Declo, ID Map & Demographics
Declo Map
Declo Overview
$30,319
PER CAPITA INCOME
$103,750
AVG FAMILY INCOME
$48,438
AVG HOUSEHOLD INCOME
0.38
INEQUALITY / GINI INDEX
498
TOTAL POPULATION
240
MALE POPULATION
258
FEMALE POPULATION
93.02
MALES / 100 FEMALES
107.50
FEMALES / 100 MALES
44.2
MEDIAN AGE
3.5
AVG FAMILY SIZE
2.5
AVG HOUSEHOLD SIZE
243
LABOR FORCE [ PEOPLE ]
64.3%
PERCENT IN LABOR FORCE
2.9%
UNEMPLOYMENT RATE
Declo Zip Codes
Declo Area Codes
Income in Declo
Income Overview in Declo
Per Capita Income in Declo is $30,319, while median incomes of families and households are $103,750 and $48,438 respectively.
| Characteristic | Number | Measure |
| Per Capita Income | 498 | $30,319 |
| Median Family Income | 116 | $103,750 |
| Mean Family Income | 116 | $95,786 |
| Median Household Income | 199 | $48,438 |
| Mean Household Income | 199 | $71,613 |
| Income Deficit | 116 | $0 |
| Wage / Income Gap (%) | 498 | 0.00% |
| Wage / Income Gap ($) | 498 | 100.00¢ per $1 |
| Gini / Inequality Index | 498 | 0.38 |
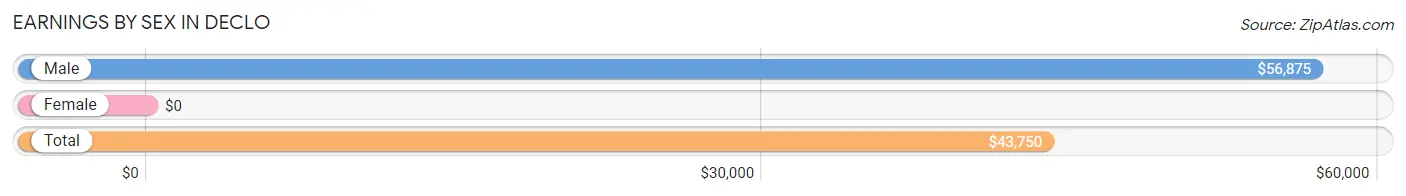
Earnings by Sex in Declo
| Sex | Number | Average Earnings |
| Male | 125 (50.6%) | $56,875 |
| Female | 122 (49.4%) | $0 |
| Total | 247 (100.0%) | $43,750 |
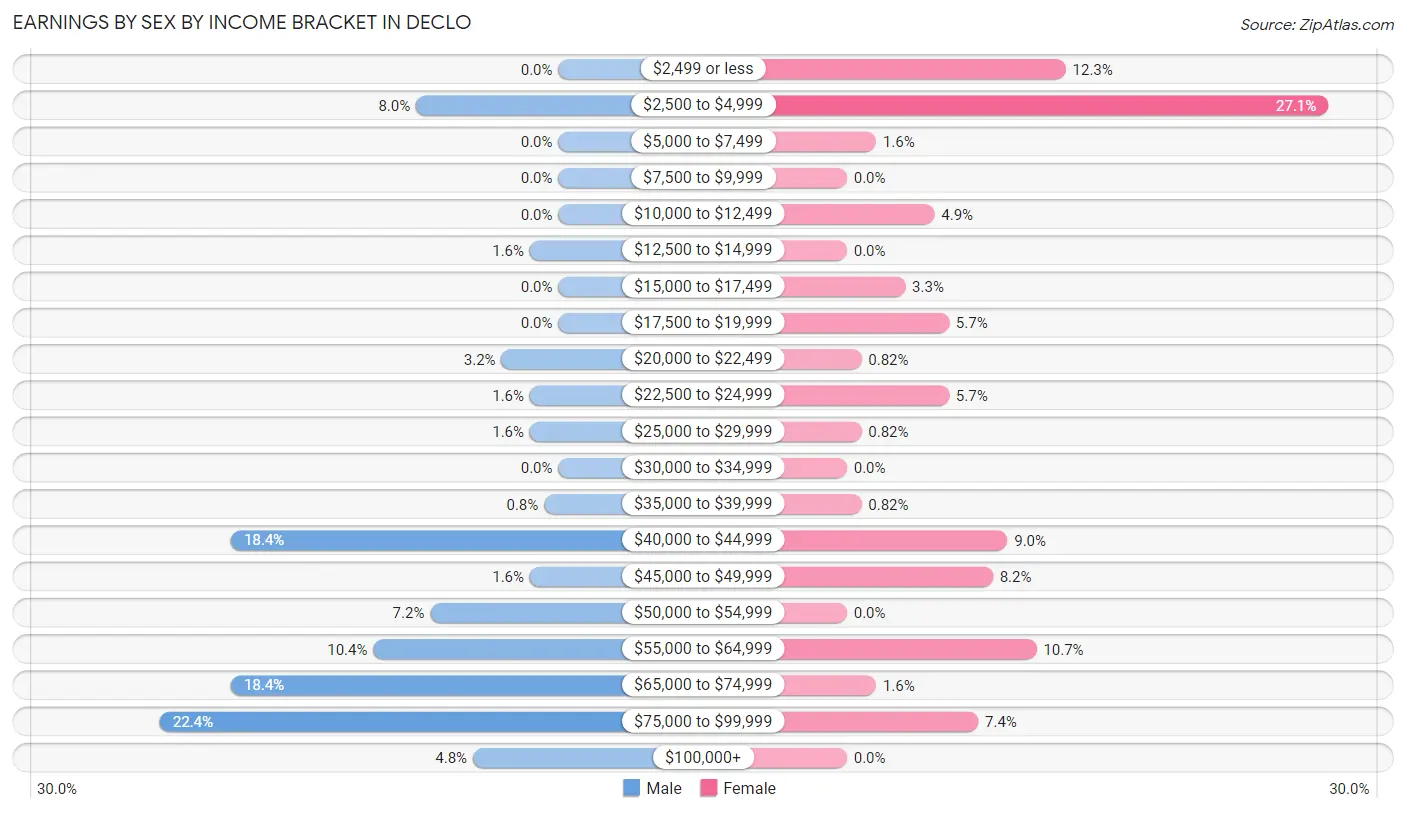
Earnings by Sex by Income Bracket in Declo
The most common earnings brackets in Declo are $75,000 to $99,999 for men (28 | 22.4%) and $2,500 to $4,999 for women (33 | 27.1%).
| Income | Male | Female |
| $2,499 or less | 0 (0.0%) | 15 (12.3%) |
| $2,500 to $4,999 | 10 (8.0%) | 33 (27.1%) |
| $5,000 to $7,499 | 0 (0.0%) | 2 (1.6%) |
| $7,500 to $9,999 | 0 (0.0%) | 0 (0.0%) |
| $10,000 to $12,499 | 0 (0.0%) | 6 (4.9%) |
| $12,500 to $14,999 | 2 (1.6%) | 0 (0.0%) |
| $15,000 to $17,499 | 0 (0.0%) | 4 (3.3%) |
| $17,500 to $19,999 | 0 (0.0%) | 7 (5.7%) |
| $20,000 to $22,499 | 4 (3.2%) | 1 (0.8%) |
| $22,500 to $24,999 | 2 (1.6%) | 7 (5.7%) |
| $25,000 to $29,999 | 2 (1.6%) | 1 (0.8%) |
| $30,000 to $34,999 | 0 (0.0%) | 0 (0.0%) |
| $35,000 to $39,999 | 1 (0.8%) | 1 (0.8%) |
| $40,000 to $44,999 | 23 (18.4%) | 11 (9.0%) |
| $45,000 to $49,999 | 2 (1.6%) | 10 (8.2%) |
| $50,000 to $54,999 | 9 (7.2%) | 0 (0.0%) |
| $55,000 to $64,999 | 13 (10.4%) | 13 (10.7%) |
| $65,000 to $74,999 | 23 (18.4%) | 2 (1.6%) |
| $75,000 to $99,999 | 28 (22.4%) | 9 (7.4%) |
| $100,000+ | 6 (4.8%) | 0 (0.0%) |
| Total | 125 (100.0%) | 122 (100.0%) |
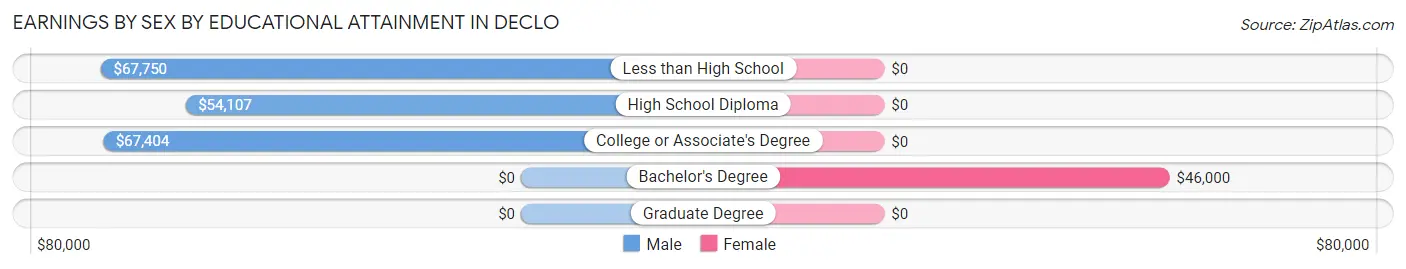
Earnings by Sex by Educational Attainment in Declo
Average earnings in Declo are $65,865 for men and $40,341 for women, a difference of 38.8%. Men with an educational attainment of less than high school enjoy the highest average annual earnings of $67,750, while those with high school diploma education earn the least with $54,107. Women with an educational attainment of bachelor's degree earn the most with the average annual earnings of $46,000, while those with bachelor's degree education have the smallest earnings of $46,000.
| Educational Attainment | Male Income | Female Income |
| Less than High School | $67,750 | $0 |
| High School Diploma | $54,107 | $0 |
| College or Associate's Degree | $67,404 | $0 |
| Bachelor's Degree | - | - |
| Graduate Degree | - | - |
| Total | $65,865 | $40,341 |
Family Income in Declo
Family Income Brackets in Declo
According to the Declo family income data, there are 53 families falling into the $100,000 to $149,999 income range, which is the most common income bracket and makes up 45.7% of all families.
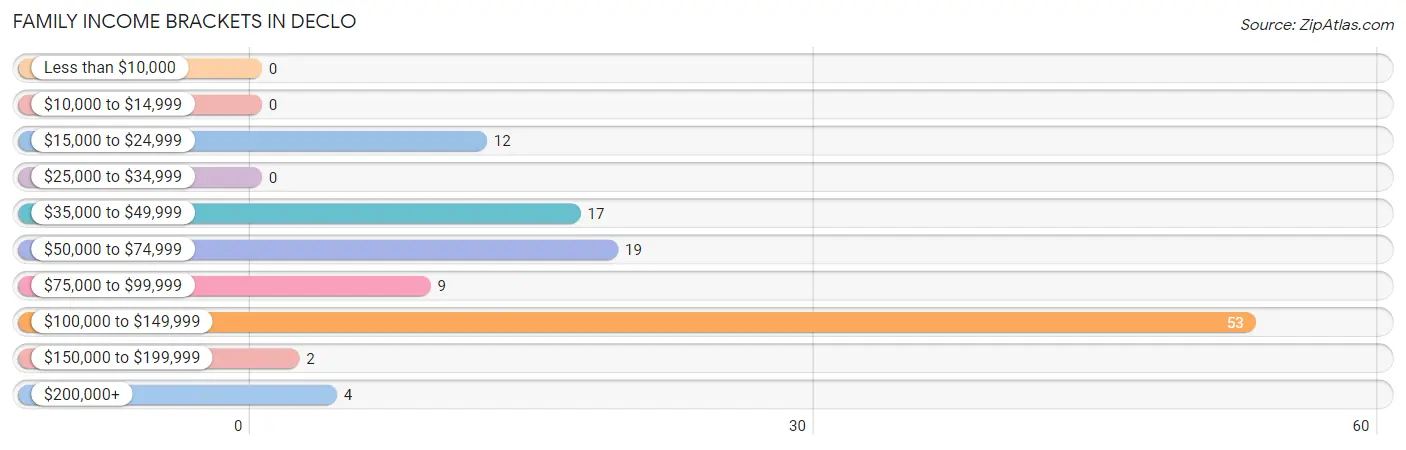
| Income Bracket | # Families | % Families |
| Less than $10,000 | 0 | 0.0% |
| $10,000 to $14,999 | 0 | 0.0% |
| $15,000 to $24,999 | 12 | 10.3% |
| $25,000 to $34,999 | 0 | 0.0% |
| $35,000 to $49,999 | 17 | 14.7% |
| $50,000 to $74,999 | 19 | 16.4% |
| $75,000 to $99,999 | 9 | 7.8% |
| $100,000 to $149,999 | 53 | 45.7% |
| $150,000 to $199,999 | 2 | 1.7% |
| $200,000+ | 4 | 3.4% |
Family Income by Famaliy Size in Declo
3-person families (15 | 12.9%) account for the highest median family income in Declo with $132,656 per family, while 3-person families (15 | 12.9%) have the highest median income of $44,219 per family member.
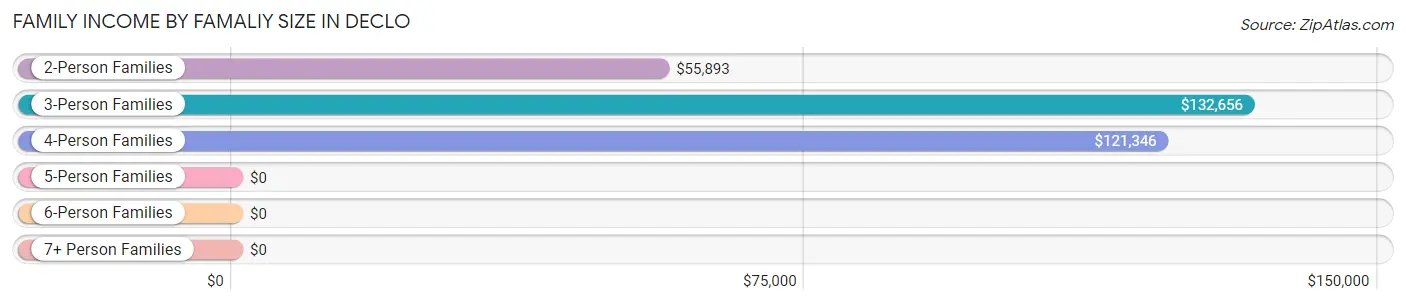
| Income Bracket | # Families | Median Income |
| 2-Person Families | 51 (44.0%) | $55,893 |
| 3-Person Families | 15 (12.9%) | $132,656 |
| 4-Person Families | 36 (31.0%) | $121,346 |
| 5-Person Families | 9 (7.8%) | $0 |
| 6-Person Families | 3 (2.6%) | $0 |
| 7+ Person Families | 2 (1.7%) | $0 |
| Total | 116 (100.0%) | $103,750 |
Family Income by Number of Earners in Declo
The median family income in Declo is $103,750, with families comprising 2 earners (44) having the highest median family income of $122,500, while families with 1 earner (43) have the lowest median family income of $66,250, accounting for 37.9% and 37.1% of families, respectively.
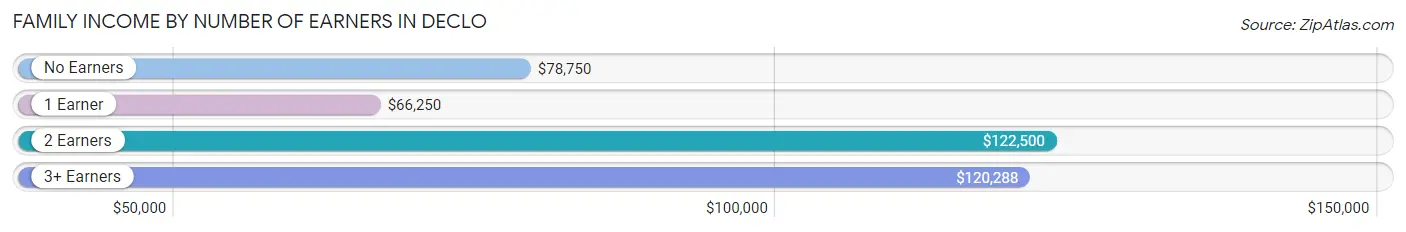
| Number of Earners | # Families | Median Income |
| No Earners | 6 (5.2%) | $78,750 |
| 1 Earner | 43 (37.1%) | $66,250 |
| 2 Earners | 44 (37.9%) | $122,500 |
| 3+ Earners | 23 (19.8%) | $120,288 |
| Total | 116 (100.0%) | $103,750 |
Household Income in Declo
Household Income Brackets in Declo
With 64 households falling in the category, the $35,000 to $49,999 income range is the most frequent in Declo, accounting for 32.2% of all households.
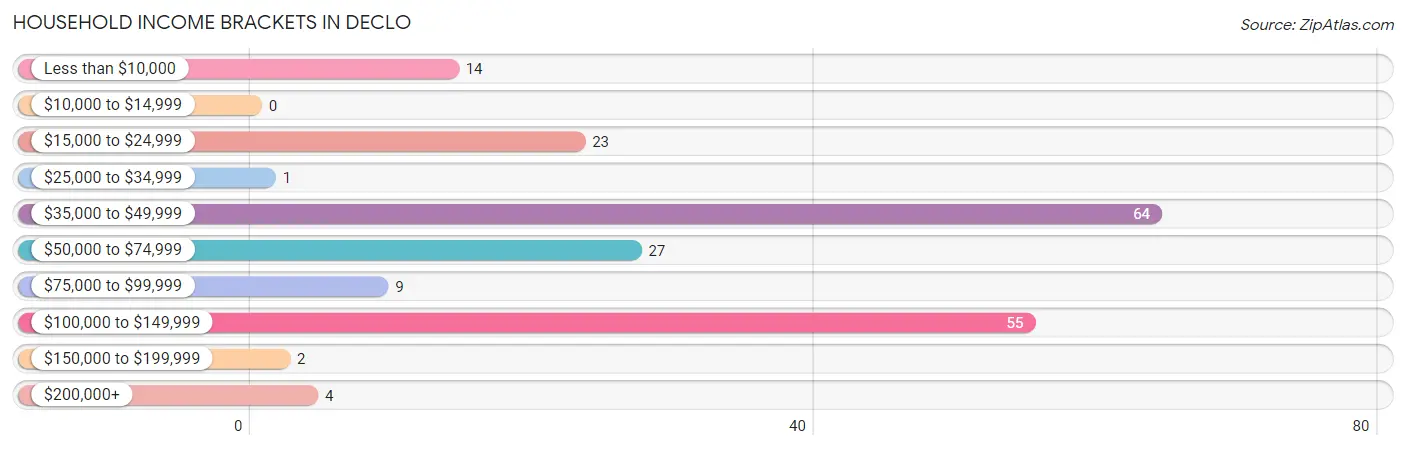
| Income Bracket | # Households | % Households |
| Less than $10,000 | 14 | 7.0% |
| $10,000 to $14,999 | 0 | 0.0% |
| $15,000 to $24,999 | 23 | 11.6% |
| $25,000 to $34,999 | 1 | 0.5% |
| $35,000 to $49,999 | 64 | 32.2% |
| $50,000 to $74,999 | 27 | 13.6% |
| $75,000 to $99,999 | 9 | 4.5% |
| $100,000 to $149,999 | 55 | 27.6% |
| $150,000 to $199,999 | 2 | 1.0% |
| $200,000+ | 4 | 2.0% |
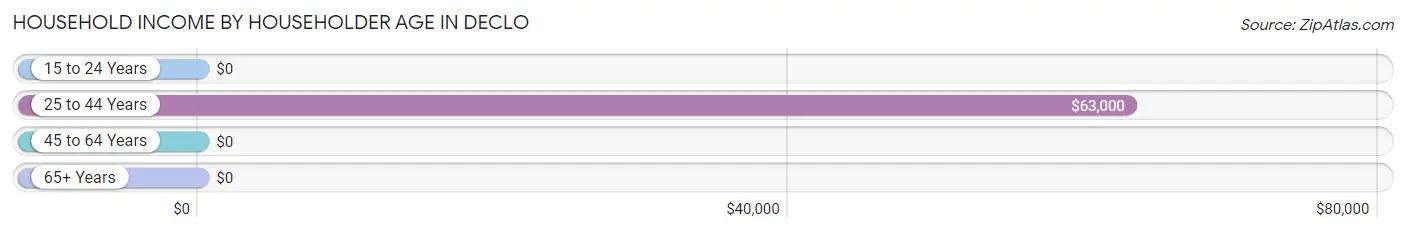
Household Income by Householder Age in Declo
The median household income in Declo is $48,438, with the highest median household income of $63,000 found in the 25 to 44 years age bracket for the primary householder. A total of 40 households (20.1%) fall into this category.
| Income Bracket | # Households | Median Income |
| 15 to 24 Years | 0 (0.0%) | $0 |
| 25 to 44 Years | 40 (20.1%) | $63,000 |
| 45 to 64 Years | 129 (64.8%) | $0 |
| 65+ Years | 30 (15.1%) | $0 |
| Total | 199 (100.0%) | $48,438 |
Poverty in Declo
Income Below Poverty by Sex and Age in Declo
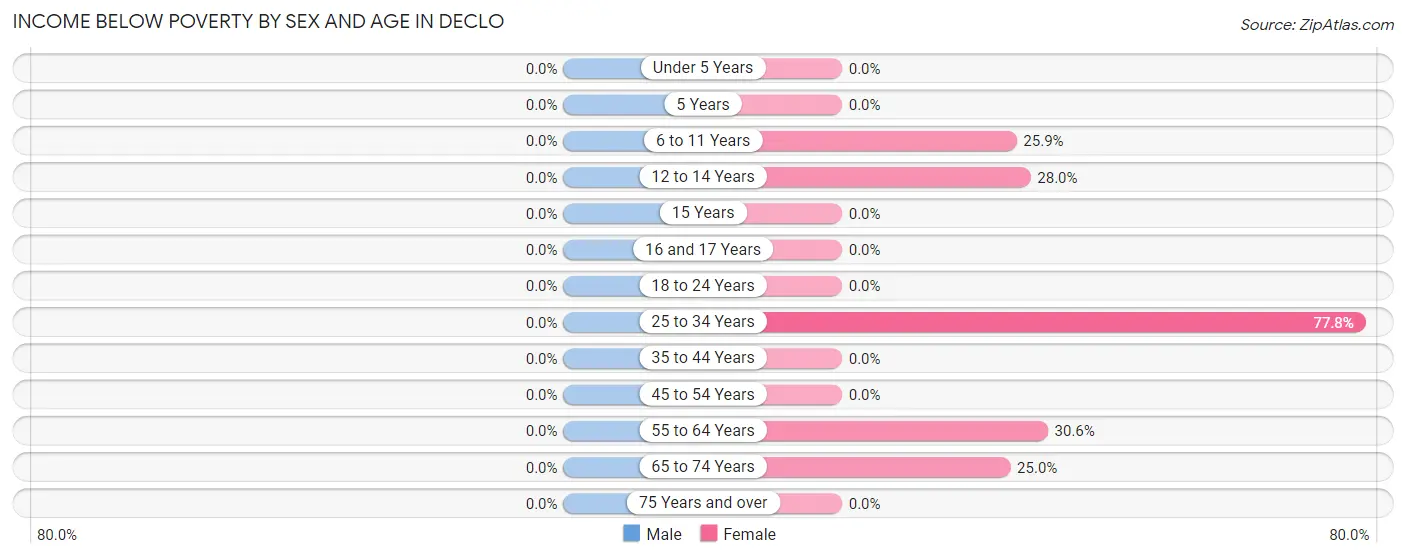
| Age Bracket | Male | Female |
| Under 5 Years | 0 (0.0%) | 0 (0.0%) |
| 5 Years | 0 (0.0%) | 0 (0.0%) |
| 6 to 11 Years | 0 (0.0%) | 7 (25.9%) |
| 12 to 14 Years | 0 (0.0%) | 14 (28.0%) |
| 15 Years | 0 (0.0%) | 0 (0.0%) |
| 16 and 17 Years | 0 (0.0%) | 0 (0.0%) |
| 18 to 24 Years | 0 (0.0%) | 0 (0.0%) |
| 25 to 34 Years | 0 (0.0%) | 7 (77.8%) |
| 35 to 44 Years | 0 (0.0%) | 0 (0.0%) |
| 45 to 54 Years | 0 (0.0%) | 0 (0.0%) |
| 55 to 64 Years | 0 (0.0%) | 11 (30.6%) |
| 65 to 74 Years | 0 (0.0%) | 3 (25.0%) |
| 75 Years and over | 0 (0.0%) | 0 (0.0%) |
| Total | 0 (0.0%) | 42 (16.4%) |
Income Above Poverty by Sex and Age in Declo
According to the poverty statistics in Declo, males aged under 5 years and females aged 5 years are the age groups that are most secure financially, with 100.0% of males and 100.0% of females in these age groups living above the poverty line.
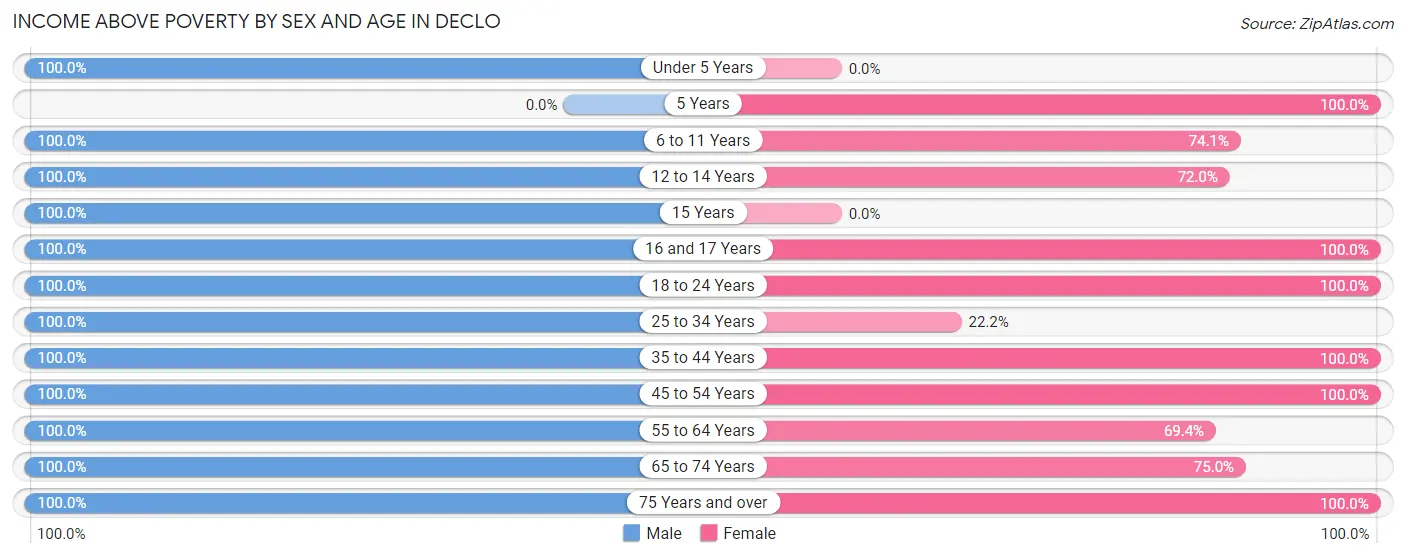
| Age Bracket | Male | Female |
| Under 5 Years | 4 (100.0%) | 0 (0.0%) |
| 5 Years | 0 (0.0%) | 2 (100.0%) |
| 6 to 11 Years | 13 (100.0%) | 20 (74.1%) |
| 12 to 14 Years | 13 (100.0%) | 36 (72.0%) |
| 15 Years | 8 (100.0%) | 0 (0.0%) |
| 16 and 17 Years | 7 (100.0%) | 35 (100.0%) |
| 18 to 24 Years | 20 (100.0%) | 1 (100.0%) |
| 25 to 34 Years | 21 (100.0%) | 2 (22.2%) |
| 35 to 44 Years | 17 (100.0%) | 26 (100.0%) |
| 45 to 54 Years | 45 (100.0%) | 55 (100.0%) |
| 55 to 64 Years | 60 (100.0%) | 25 (69.4%) |
| 65 to 74 Years | 25 (100.0%) | 9 (75.0%) |
| 75 Years and over | 6 (100.0%) | 3 (100.0%) |
| Total | 239 (100.0%) | 214 (83.6%) |
Income Below Poverty Among Married-Couple Families in Declo
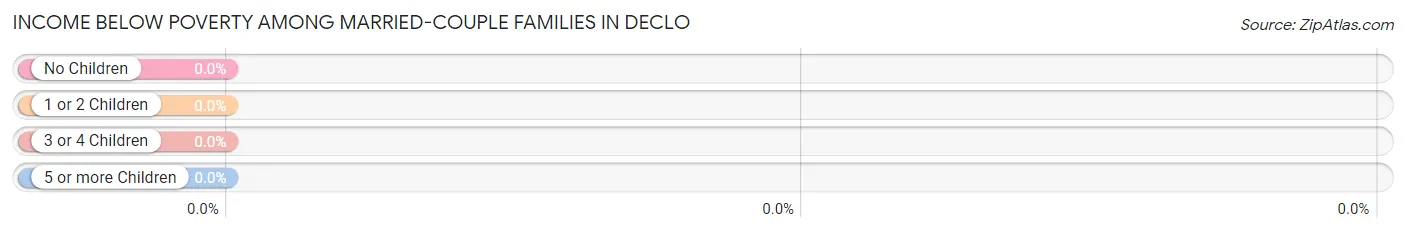
| Children | Above Poverty | Below Poverty |
| No Children | 36 (100.0%) | 0 (0.0%) |
| 1 or 2 Children | 33 (100.0%) | 0 (0.0%) |
| 3 or 4 Children | 12 (100.0%) | 0 (0.0%) |
| 5 or more Children | 2 (100.0%) | 0 (0.0%) |
| Total | 83 (100.0%) | 0 (0.0%) |
Income Below Poverty Among Single-Parent Households in Declo
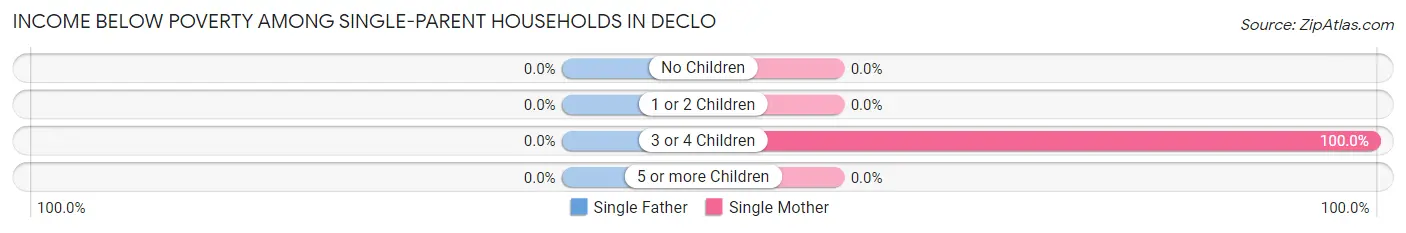
| Children | Single Father | Single Mother |
| No Children | 0 (0.0%) | 0 (0.0%) |
| 1 or 2 Children | 0 (0.0%) | 0 (0.0%) |
| 3 or 4 Children | 0 (0.0%) | 5 (100.0%) |
| 5 or more Children | 0 (0.0%) | 0 (0.0%) |
| Total | 0 (0.0%) | 5 (17.2%) |
Income Below Poverty Among Married-Couple vs Single-Parent Households in Declo
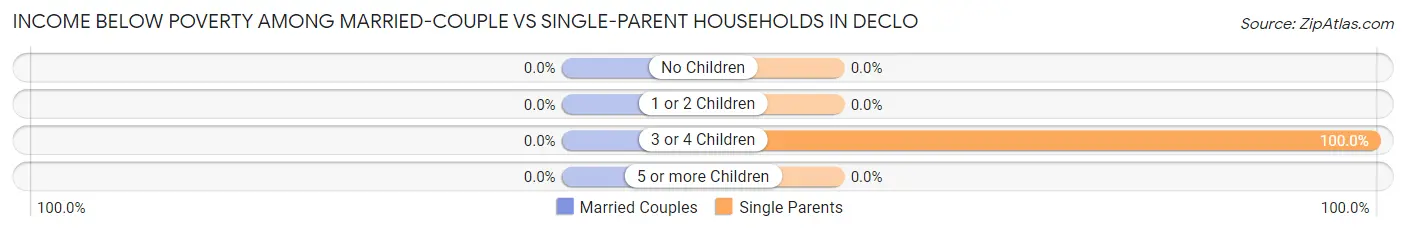
| Children | Married-Couple Families | Single-Parent Households |
| No Children | 0 (0.0%) | 0 (0.0%) |
| 1 or 2 Children | 0 (0.0%) | 0 (0.0%) |
| 3 or 4 Children | 0 (0.0%) | 5 (100.0%) |
| 5 or more Children | 0 (0.0%) | 0 (0.0%) |
| Total | 0 (0.0%) | 5 (15.1%) |
Race in Declo
The most populous races in Declo are White / Caucasian (440 | 88.3%), Hispanic or Latino (54 | 10.8%), and Two or more Races (53 | 10.6%).
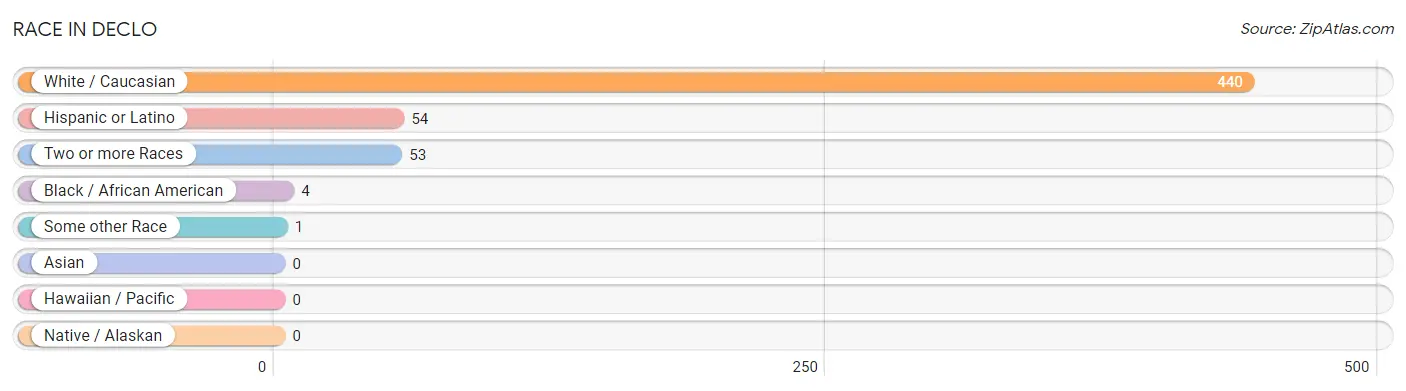
| Race | # Population | % Population |
| Asian | 0 | 0.0% |
| Black / African American | 4 | 0.8% |
| Hawaiian / Pacific | 0 | 0.0% |
| Hispanic or Latino | 54 | 10.8% |
| Native / Alaskan | 0 | 0.0% |
| White / Caucasian | 440 | 88.3% |
| Two or more Races | 53 | 10.6% |
| Some other Race | 1 | 0.2% |
| Total | 498 | 100.0% |
Ancestry in Declo
The most populous ancestries reported in Declo are English (202 | 40.6%), French (70 | 14.1%), Mexican (54 | 10.8%), American (51 | 10.2%), and Irish (40 | 8.0%), together accounting for 83.7% of all Declo residents.
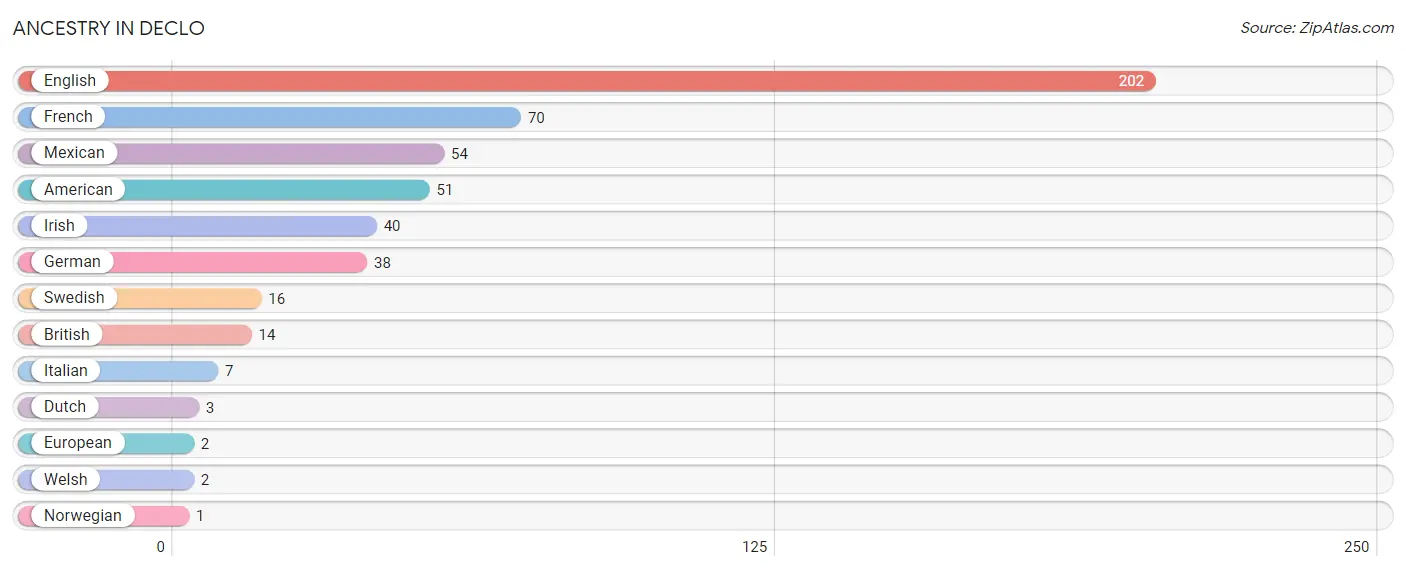
| Ancestry | # Population | % Population |
| American | 51 | 10.2% |
| British | 14 | 2.8% |
| Dutch | 3 | 0.6% |
| English | 202 | 40.6% |
| European | 2 | 0.4% |
| French | 70 | 14.1% |
| German | 38 | 7.6% |
| Irish | 40 | 8.0% |
| Italian | 7 | 1.4% |
| Mexican | 54 | 10.8% |
| Norwegian | 1 | 0.2% |
| Swedish | 16 | 3.2% |
| Welsh | 2 | 0.4% | View All 13 Rows |
Immigrants in Declo
The most numerous immigrant groups reported in Declo came from Central America (1 | 0.2%), Latin America (1 | 0.2%), and Mexico (1 | 0.2%), together accounting for 0.6% of all Declo residents.
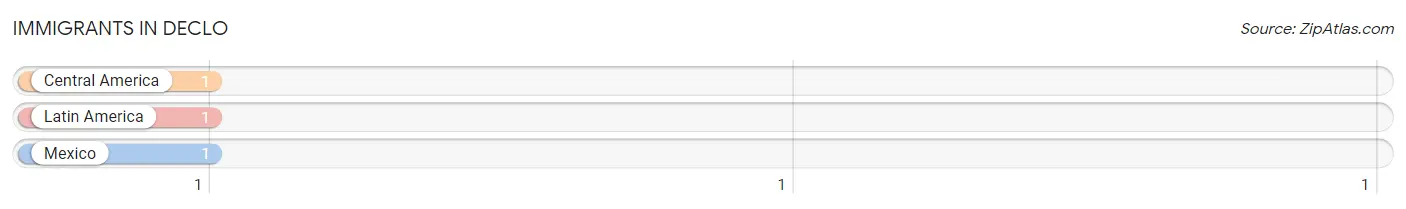
| Immigration Origin | # Population | % Population |
| Central America | 1 | 0.2% |
| Latin America | 1 | 0.2% |
| Mexico | 1 | 0.2% | View All 3 Rows |
Sex and Age in Declo
Sex and Age in Declo
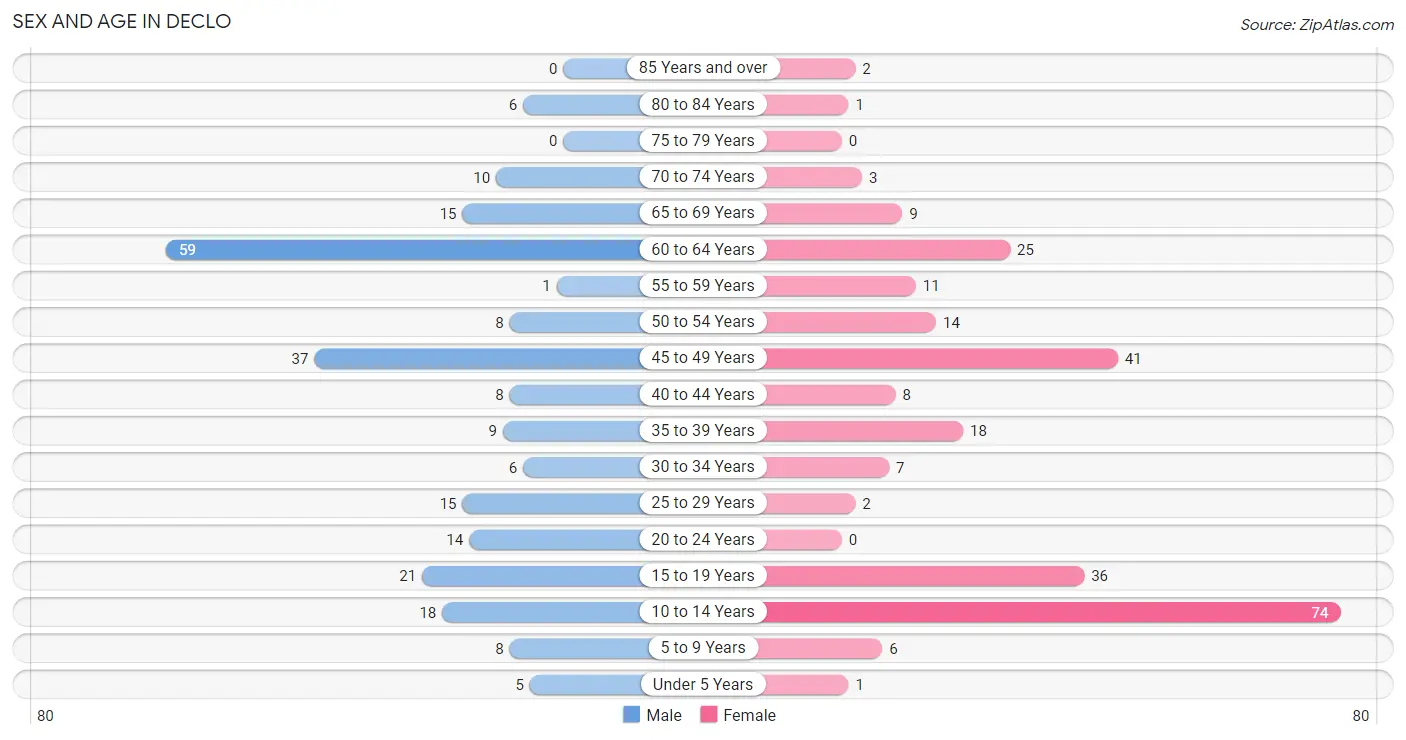
The most populous age groups in Declo are 60 to 64 Years (59 | 24.6%) for men and 10 to 14 Years (74 | 28.7%) for women.
| Age Bracket | Male | Female |
| Under 5 Years | 5 (2.1%) | 1 (0.4%) |
| 5 to 9 Years | 8 (3.3%) | 6 (2.3%) |
| 10 to 14 Years | 18 (7.5%) | 74 (28.7%) |
| 15 to 19 Years | 21 (8.7%) | 36 (14.0%) |
| 20 to 24 Years | 14 (5.8%) | 0 (0.0%) |
| 25 to 29 Years | 15 (6.2%) | 2 (0.8%) |
| 30 to 34 Years | 6 (2.5%) | 7 (2.7%) |
| 35 to 39 Years | 9 (3.7%) | 18 (7.0%) |
| 40 to 44 Years | 8 (3.3%) | 8 (3.1%) |
| 45 to 49 Years | 37 (15.4%) | 41 (15.9%) |
| 50 to 54 Years | 8 (3.3%) | 14 (5.4%) |
| 55 to 59 Years | 1 (0.4%) | 11 (4.3%) |
| 60 to 64 Years | 59 (24.6%) | 25 (9.7%) |
| 65 to 69 Years | 15 (6.2%) | 9 (3.5%) |
| 70 to 74 Years | 10 (4.2%) | 3 (1.2%) |
| 75 to 79 Years | 0 (0.0%) | 0 (0.0%) |
| 80 to 84 Years | 6 (2.5%) | 1 (0.4%) |
| 85 Years and over | 0 (0.0%) | 2 (0.8%) |
| Total | 240 (100.0%) | 258 (100.0%) |
Families and Households in Declo
Median Family Size in Declo
The median family size in Declo is 3.53 persons per family, with married-couple families (83 | 71.6%) accounting for the largest median family size of 3.93 persons per family. On the other hand, single male/father families (4 | 3.5%) represent the smallest median family size with 2.25 persons per family.
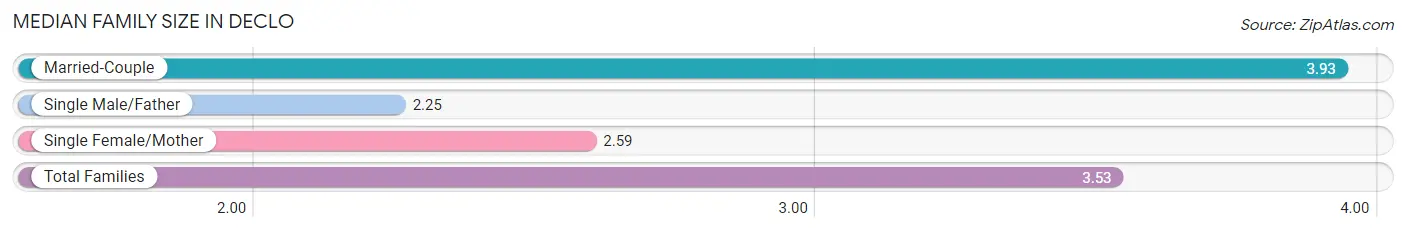
| Family Type | # Families | Family Size |
| Married-Couple | 83 (71.6%) | 3.93 |
| Single Male/Father | 4 (3.5%) | 2.25 |
| Single Female/Mother | 29 (25.0%) | 2.59 |
| Total Families | 116 (100.0%) | 3.53 |
Median Household Size in Declo
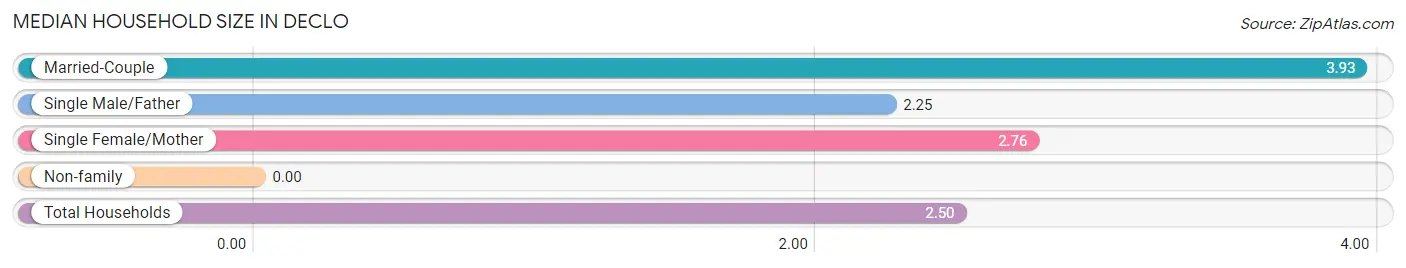
| Household Type | # Households | Household Size |
| Married-Couple | 83 (41.7%) | 3.93 |
| Single Male/Father | 4 (2.0%) | 2.25 |
| Single Female/Mother | 29 (14.6%) | 2.76 |
| Non-family | 83 (41.7%) | - |
| Total Households | 199 (100.0%) | 2.50 |
Household Size by Marriage Status in Declo
Out of a total of 199 households in Declo, 116 (58.3%) are family households, while 83 (41.7%) are nonfamily households. The most numerous type of family households are 2-person households, comprising 50, and the most common type of nonfamily households are 1-person households, comprising 83.
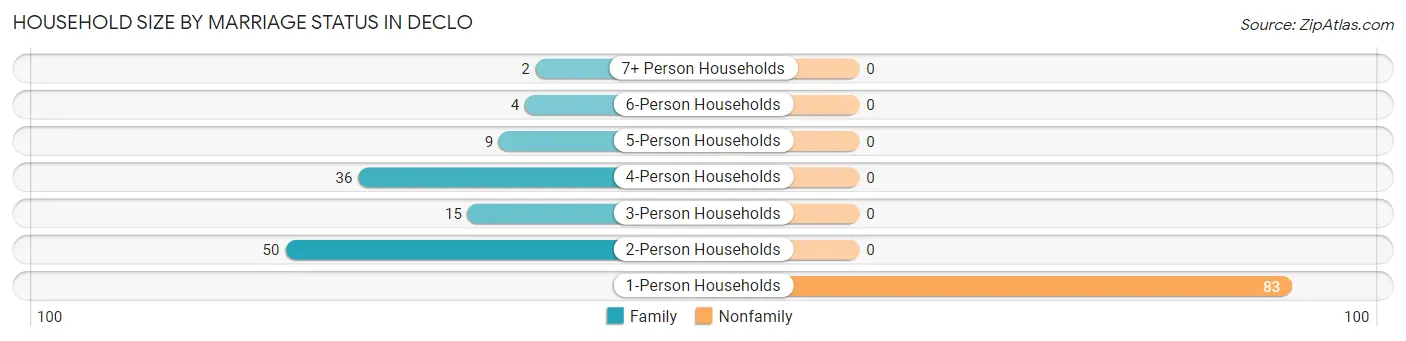
| Household Size | Family Households | Nonfamily Households |
| 1-Person Households | - | 83 (41.7%) |
| 2-Person Households | 50 (25.1%) | 0 (0.0%) |
| 3-Person Households | 15 (7.5%) | 0 (0.0%) |
| 4-Person Households | 36 (18.1%) | 0 (0.0%) |
| 5-Person Households | 9 (4.5%) | 0 (0.0%) |
| 6-Person Households | 4 (2.0%) | 0 (0.0%) |
| 7+ Person Households | 2 (1.0%) | 0 (0.0%) |
| Total | 116 (58.3%) | 83 (41.7%) |
Female Fertility in Declo
Fertility by Age in Declo
| Age Bracket | Women with Births | Births / 1,000 Women |
| 15 to 19 years | 0 (0.0%) | 0.0 |
| 20 to 34 years | 0 (0.0%) | 0.0 |
| 35 to 50 years | 0 (0.0%) | 0.0 |
| Total | 0 (0.0%) | 0.0 |
Fertility by Age by Marriage Status in Declo
| Age Bracket | Married | Unmarried |
| 15 to 19 years | 0 (0.0%) | 0 (0.0%) |
| 20 to 34 years | 0 (0.0%) | 0 (0.0%) |
| 35 to 50 years | 0 (0.0%) | 0 (0.0%) |
| Total | 0 (0.0%) | 0 (0.0%) |
Fertility by Education in Declo
| Educational Attainment | Women with Births | Births / 1,000 Women |
| Less than High School | 0 (0.0%) | 0.0 |
| High School Diploma | 0 (0.0%) | 0.0 |
| College or Associate's Degree | 0 (0.0%) | 0.0 |
| Bachelor's Degree | 0 (0.0%) | 0.0 |
| Graduate Degree | 0 (0.0%) | 0.0 |
| Total | 0 (0.0%) | 0.0 |
Fertility by Education by Marriage Status in Declo
| Educational Attainment | Married | Unmarried |
| Less than High School | 0 (0.0%) | 0 (0.0%) |
| High School Diploma | 0 (0.0%) | 0 (0.0%) |
| College or Associate's Degree | 0 (0.0%) | 0 (0.0%) |
| Bachelor's Degree | 0 (0.0%) | 0 (0.0%) |
| Graduate Degree | 0 (0.0%) | 0 (0.0%) |
| Total | 0 (0.0%) | 0 (0.0%) |
Employment Characteristics in Declo
Employment by Class of Employer in Declo
Among the 221 employed individuals in Declo, private company employees (117 | 52.9%), local government employees (55 | 24.9%), and state government employees (33 | 14.9%) make up the most common classes of employment.
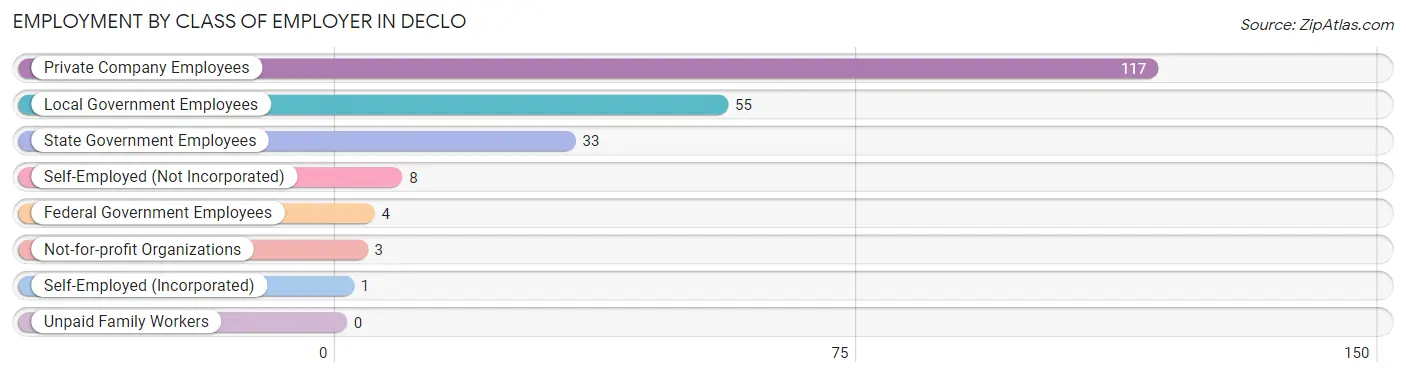
| Employer Class | # Employees | % Employees |
| Private Company Employees | 117 | 52.9% |
| Self-Employed (Incorporated) | 1 | 0.4% |
| Self-Employed (Not Incorporated) | 8 | 3.6% |
| Not-for-profit Organizations | 3 | 1.4% |
| Local Government Employees | 55 | 24.9% |
| State Government Employees | 33 | 14.9% |
| Federal Government Employees | 4 | 1.8% |
| Unpaid Family Workers | 0 | 0.0% |
| Total | 221 | 100.0% |
Employment Status by Age in Declo
According to the labor force statistics for Declo, out of the total population over 16 years of age (378), 64.3% or 243 individuals are in the labor force, with 2.9% or 7 of them unemployed. The age group with the highest labor force participation rate is 20 to 24 years, with 100.0% or 14 individuals in the labor force. Within the labor force, the 30 to 34 years age range has the highest percentage of unemployed individuals, with 30.8% or 4 of them being unemployed.
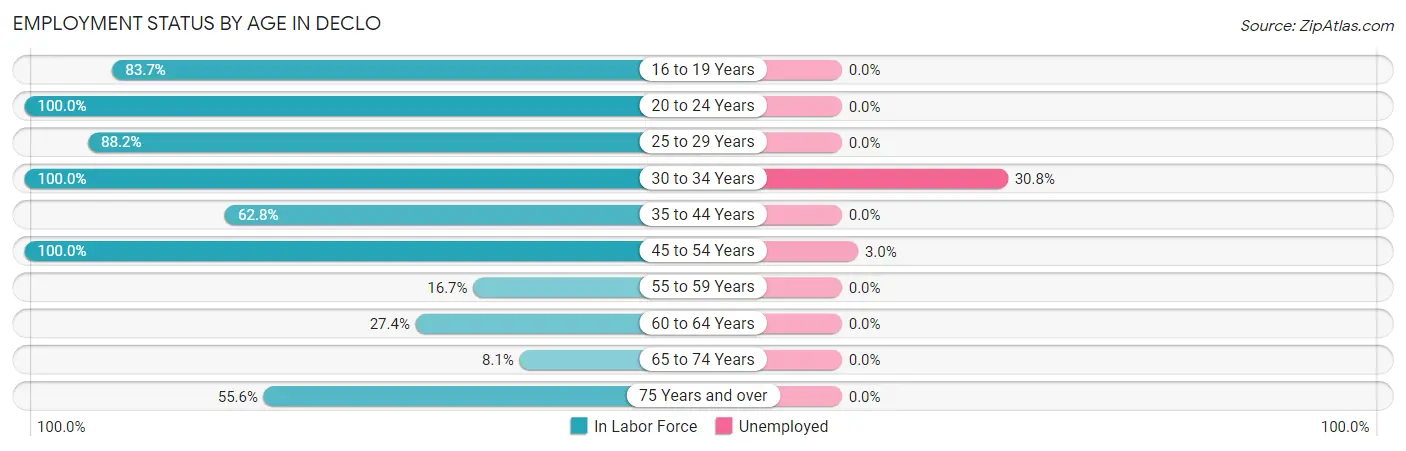
| Age Bracket | In Labor Force | Unemployed |
| 16 to 19 Years | 41 (83.7%) | 0 (0.0%) |
| 20 to 24 Years | 14 (100.0%) | 0 (0.0%) |
| 25 to 29 Years | 15 (88.2%) | 0 (0.0%) |
| 30 to 34 Years | 13 (100.0%) | 4 (30.8%) |
| 35 to 44 Years | 27 (62.8%) | 0 (0.0%) |
| 45 to 54 Years | 100 (100.0%) | 3 (3.0%) |
| 55 to 59 Years | 2 (16.7%) | 0 (0.0%) |
| 60 to 64 Years | 23 (27.4%) | 0 (0.0%) |
| 65 to 74 Years | 3 (8.1%) | 0 (0.0%) |
| 75 Years and over | 5 (55.6%) | 0 (0.0%) |
| Total | 243 (64.3%) | 7 (2.9%) |
Employment Status by Educational Attainment in Declo
According to labor force statistics for Declo, 66.9% of individuals (180) out of the total population between 25 and 64 years of age (269) are in the labor force, with 3.9% or 7 of them being unemployed. The group with the highest labor force participation rate are those with the educational attainment of bachelor's degree or higher, with 90.2% or 37 individuals in the labor force. Within the labor force, individuals with high school diploma education have the highest percentage of unemployment, with 10.4% or 7 of them being unemployed.
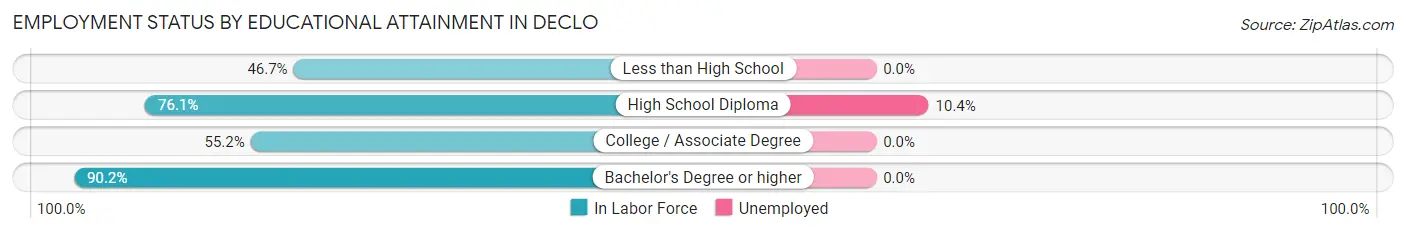
| Educational Attainment | In Labor Force | Unemployed |
| Less than High School | 7 (46.7%) | 0 (0.0%) |
| High School Diploma | 67 (76.1%) | 9 (10.4%) |
| College / Associate Degree | 69 (55.2%) | 0 (0.0%) |
| Bachelor's Degree or higher | 37 (90.2%) | 0 (0.0%) |
| Total | 180 (66.9%) | 10 (3.9%) |
Employment Occupations by Sex in Declo
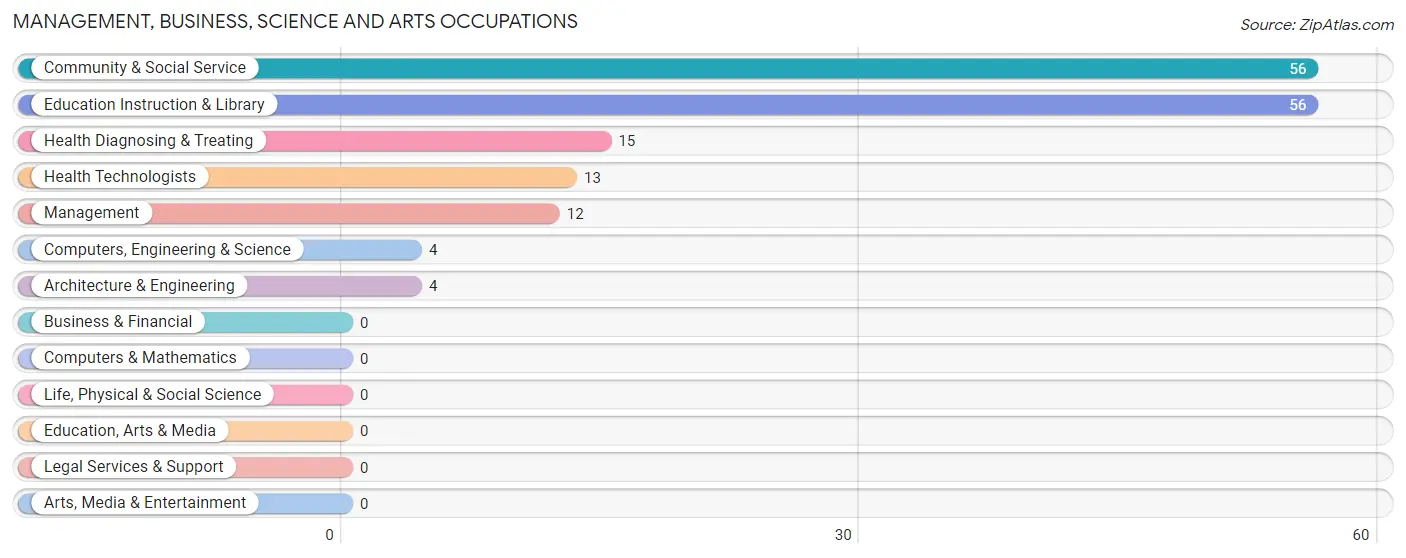
Management, Business, Science and Arts Occupations
The most common Management, Business, Science and Arts occupations in Declo are Community & Social Service (56 | 23.7%), Education Instruction & Library (56 | 23.7%), Health Diagnosing & Treating (15 | 6.4%), Health Technologists (13 | 5.5%), and Management (12 | 5.1%).
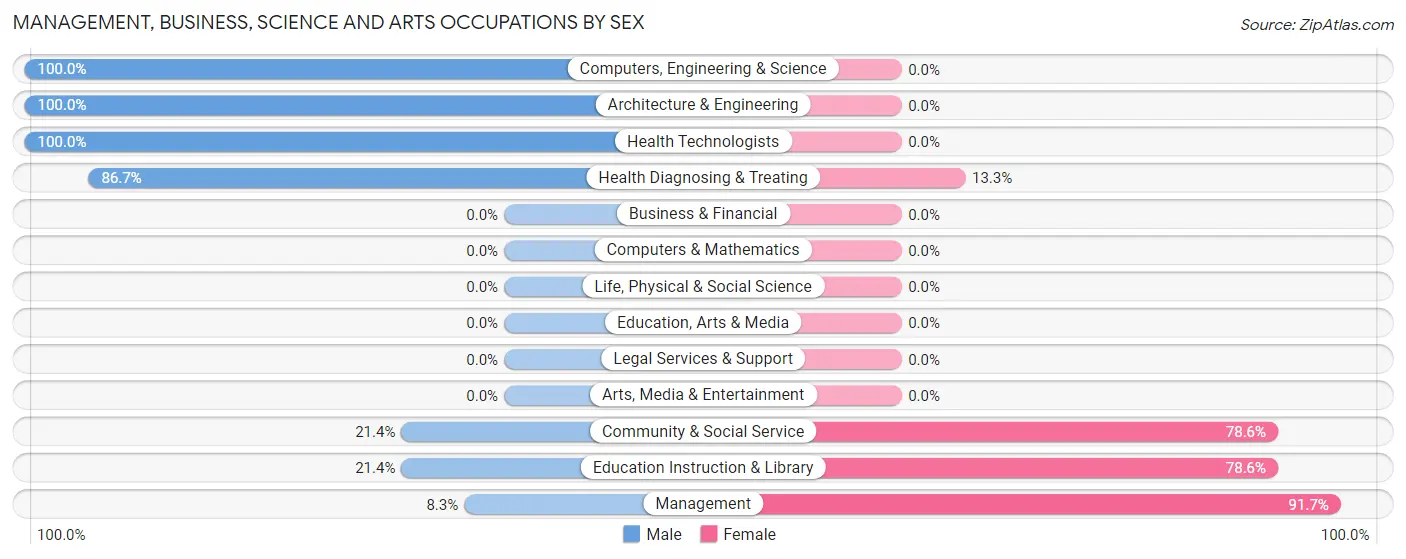
Management, Business, Science and Arts Occupations by Sex
Within the Management, Business, Science and Arts occupations in Declo, the most male-oriented occupations are Computers, Engineering & Science (100.0%), Architecture & Engineering (100.0%), and Health Technologists (100.0%), while the most female-oriented occupations are Management (91.7%), Community & Social Service (78.6%), and Education Instruction & Library (78.6%).
| Occupation | Male | Female |
| Management | 1 (8.3%) | 11 (91.7%) |
| Business & Financial | 0 (0.0%) | 0 (0.0%) |
| Computers, Engineering & Science | 4 (100.0%) | 0 (0.0%) |
| Computers & Mathematics | 0 (0.0%) | 0 (0.0%) |
| Architecture & Engineering | 4 (100.0%) | 0 (0.0%) |
| Life, Physical & Social Science | 0 (0.0%) | 0 (0.0%) |
| Community & Social Service | 12 (21.4%) | 44 (78.6%) |
| Education, Arts & Media | 0 (0.0%) | 0 (0.0%) |
| Legal Services & Support | 0 (0.0%) | 0 (0.0%) |
| Education Instruction & Library | 12 (21.4%) | 44 (78.6%) |
| Arts, Media & Entertainment | 0 (0.0%) | 0 (0.0%) |
| Health Diagnosing & Treating | 13 (86.7%) | 2 (13.3%) |
| Health Technologists | 13 (100.0%) | 0 (0.0%) |
| Total (Category) | 30 (34.5%) | 57 (65.5%) |
| Total (Overall) | 116 (49.1%) | 120 (50.8%) |
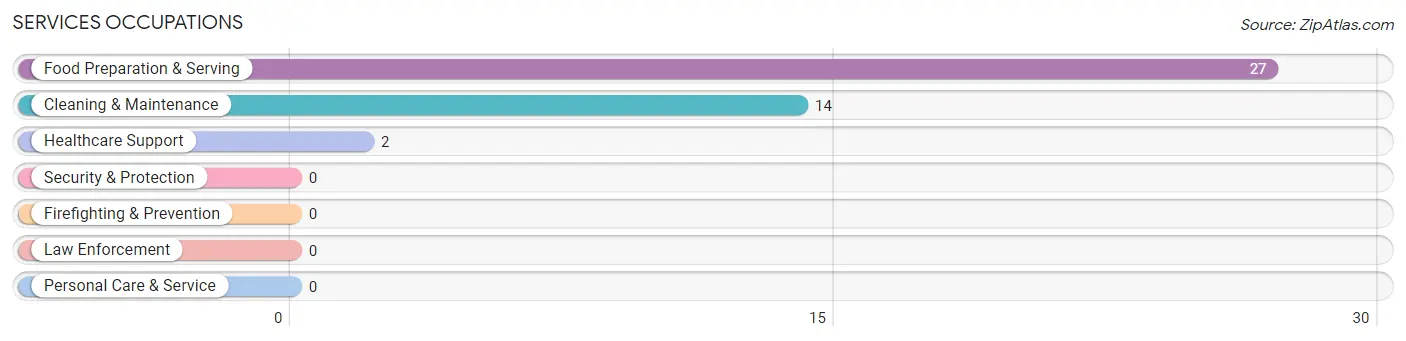
Services Occupations
The most common Services occupations in Declo are Food Preparation & Serving (27 | 11.4%), Cleaning & Maintenance (14 | 5.9%), and Healthcare Support (2 | 0.9%).
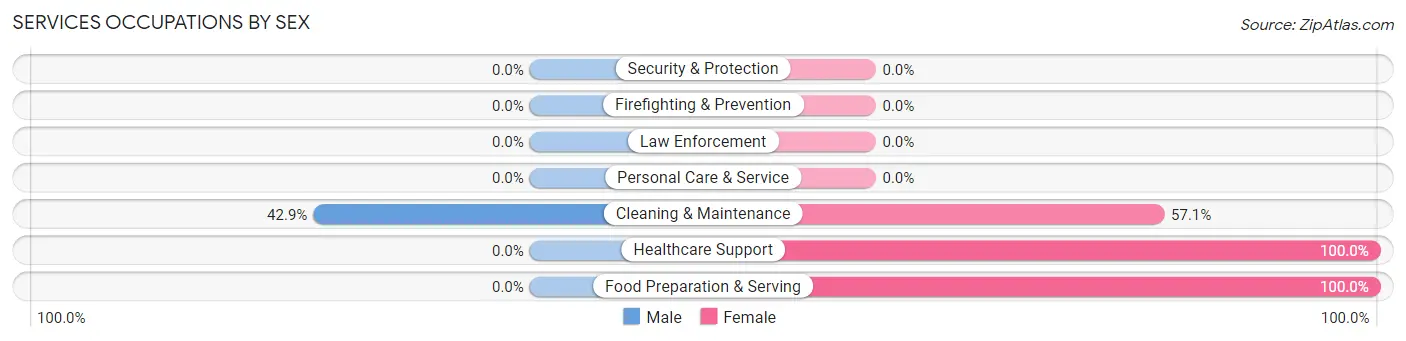
Services Occupations by Sex
| Occupation | Male | Female |
| Healthcare Support | 0 (0.0%) | 2 (100.0%) |
| Security & Protection | 0 (0.0%) | 0 (0.0%) |
| Firefighting & Prevention | 0 (0.0%) | 0 (0.0%) |
| Law Enforcement | 0 (0.0%) | 0 (0.0%) |
| Food Preparation & Serving | 0 (0.0%) | 27 (100.0%) |
| Cleaning & Maintenance | 6 (42.9%) | 8 (57.1%) |
| Personal Care & Service | 0 (0.0%) | 0 (0.0%) |
| Total (Category) | 6 (14.0%) | 37 (86.1%) |
| Total (Overall) | 116 (49.1%) | 120 (50.8%) |
Sales and Office Occupations
The most common Sales and Office occupations in Declo are Sales & Related (16 | 6.8%), and Office & Administration (5 | 2.1%).
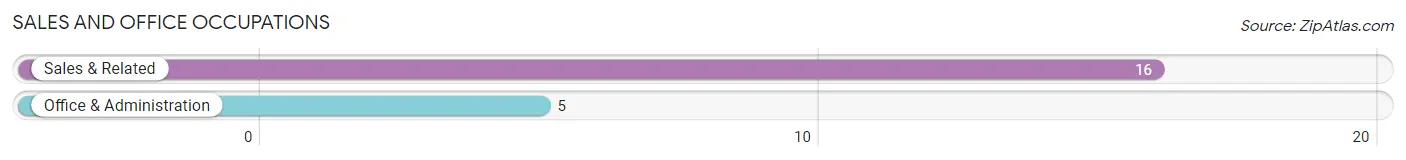
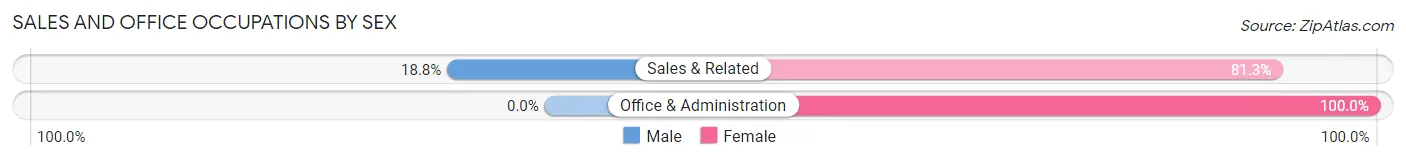
Sales and Office Occupations by Sex
| Occupation | Male | Female |
| Sales & Related | 3 (18.8%) | 13 (81.2%) |
| Office & Administration | 0 (0.0%) | 5 (100.0%) |
| Total (Category) | 3 (14.3%) | 18 (85.7%) |
| Total (Overall) | 116 (49.1%) | 120 (50.8%) |
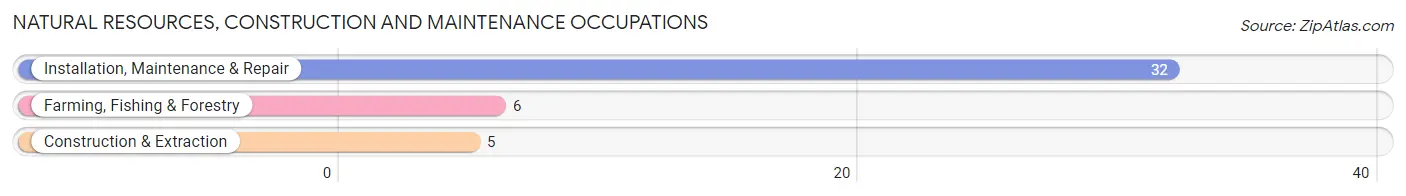
Natural Resources, Construction and Maintenance Occupations
The most common Natural Resources, Construction and Maintenance occupations in Declo are Installation, Maintenance & Repair (32 | 13.6%), Farming, Fishing & Forestry (6 | 2.5%), and Construction & Extraction (5 | 2.1%).
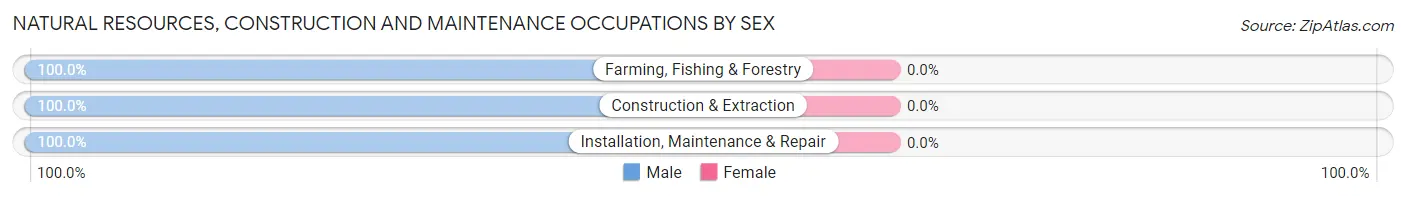
Natural Resources, Construction and Maintenance Occupations by Sex
| Occupation | Male | Female |
| Farming, Fishing & Forestry | 6 (100.0%) | 0 (0.0%) |
| Construction & Extraction | 5 (100.0%) | 0 (0.0%) |
| Installation, Maintenance & Repair | 32 (100.0%) | 0 (0.0%) |
| Total (Category) | 43 (100.0%) | 0 (0.0%) |
| Total (Overall) | 116 (49.1%) | 120 (50.8%) |
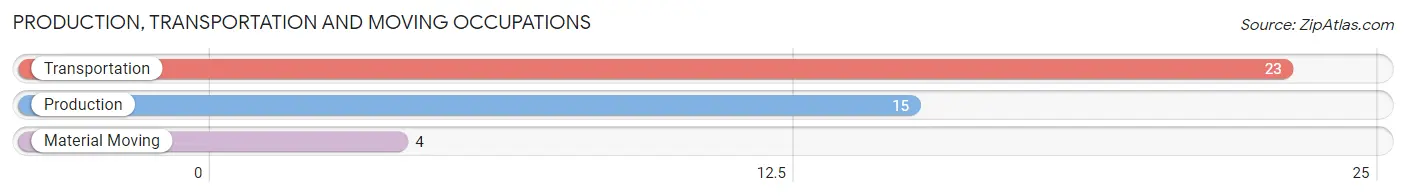
Production, Transportation and Moving Occupations
The most common Production, Transportation and Moving occupations in Declo are Transportation (23 | 9.8%), Production (15 | 6.4%), and Material Moving (4 | 1.7%).
Production, Transportation and Moving Occupations by Sex
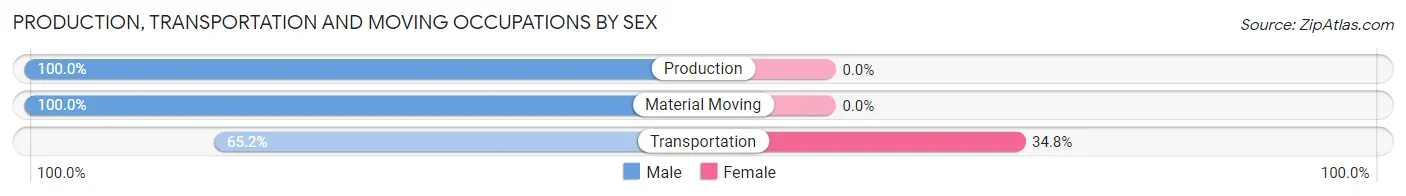
| Occupation | Male | Female |
| Production | 15 (100.0%) | 0 (0.0%) |
| Transportation | 15 (65.2%) | 8 (34.8%) |
| Material Moving | 4 (100.0%) | 0 (0.0%) |
| Total (Category) | 34 (80.9%) | 8 (19.1%) |
| Total (Overall) | 116 (49.1%) | 120 (50.8%) |
Employment Industries by Sex in Declo
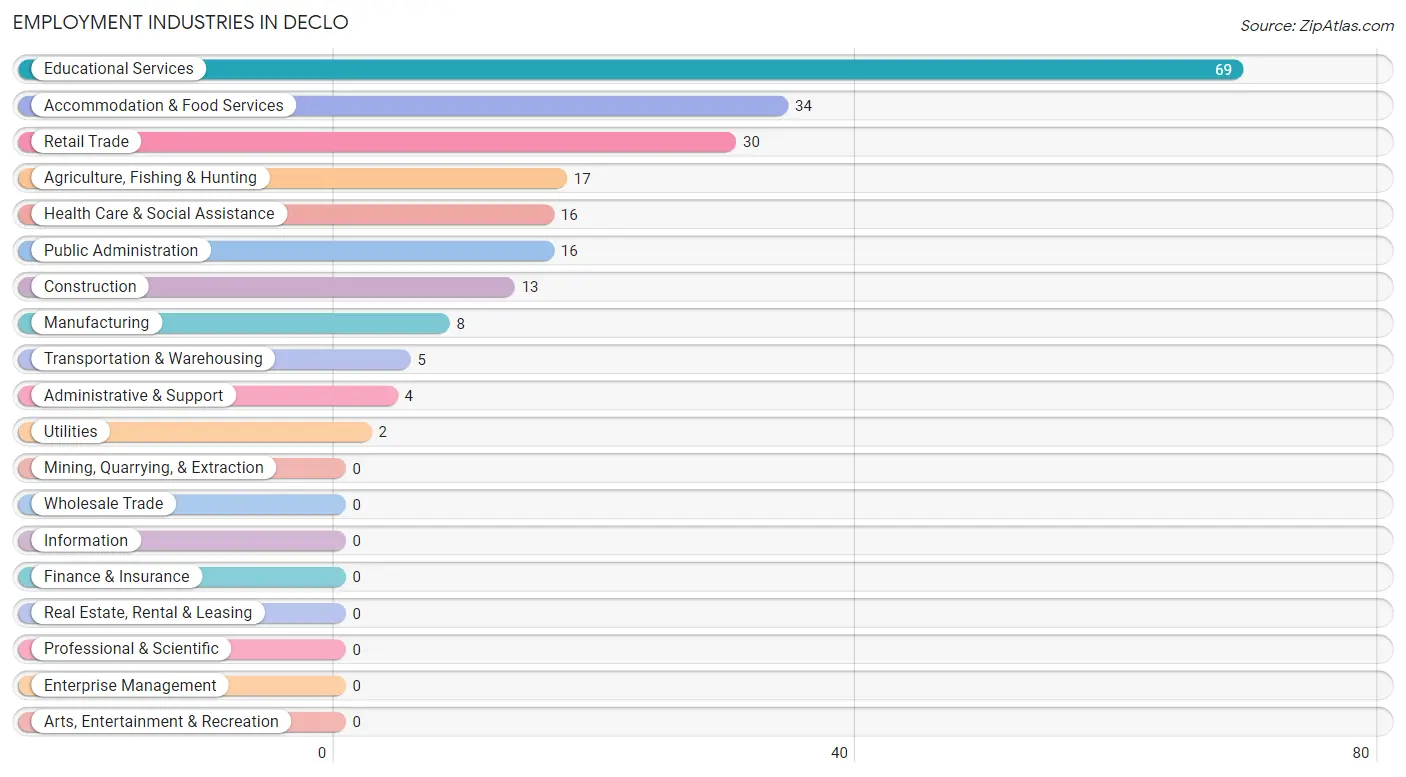
Employment Industries in Declo
The major employment industries in Declo include Educational Services (69 | 29.2%), Accommodation & Food Services (34 | 14.4%), Retail Trade (30 | 12.7%), Agriculture, Fishing & Hunting (17 | 7.2%), and Health Care & Social Assistance (16 | 6.8%).
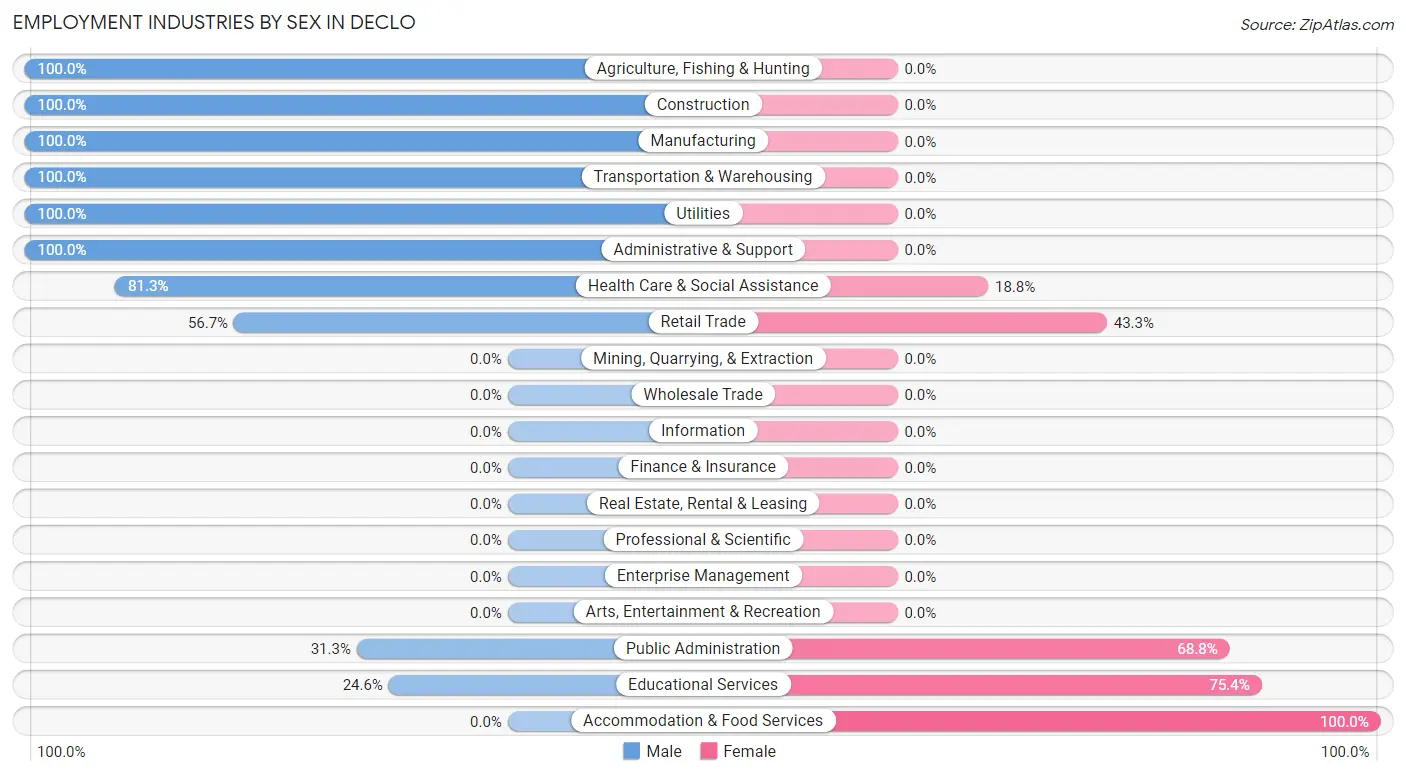
Employment Industries by Sex in Declo
The Declo industries that see more men than women are Agriculture, Fishing & Hunting (100.0%), Construction (100.0%), and Manufacturing (100.0%), whereas the industries that tend to have a higher number of women are Accommodation & Food Services (100.0%), Educational Services (75.4%), and Public Administration (68.8%).
| Industry | Male | Female |
| Agriculture, Fishing & Hunting | 17 (100.0%) | 0 (0.0%) |
| Mining, Quarrying, & Extraction | 0 (0.0%) | 0 (0.0%) |
| Construction | 13 (100.0%) | 0 (0.0%) |
| Manufacturing | 8 (100.0%) | 0 (0.0%) |
| Wholesale Trade | 0 (0.0%) | 0 (0.0%) |
| Retail Trade | 17 (56.7%) | 13 (43.3%) |
| Transportation & Warehousing | 5 (100.0%) | 0 (0.0%) |
| Utilities | 2 (100.0%) | 0 (0.0%) |
| Information | 0 (0.0%) | 0 (0.0%) |
| Finance & Insurance | 0 (0.0%) | 0 (0.0%) |
| Real Estate, Rental & Leasing | 0 (0.0%) | 0 (0.0%) |
| Professional & Scientific | 0 (0.0%) | 0 (0.0%) |
| Enterprise Management | 0 (0.0%) | 0 (0.0%) |
| Administrative & Support | 4 (100.0%) | 0 (0.0%) |
| Educational Services | 17 (24.6%) | 52 (75.4%) |
| Health Care & Social Assistance | 13 (81.2%) | 3 (18.8%) |
| Arts, Entertainment & Recreation | 0 (0.0%) | 0 (0.0%) |
| Accommodation & Food Services | 0 (0.0%) | 34 (100.0%) |
| Public Administration | 5 (31.2%) | 11 (68.8%) |
| Total | 116 (49.1%) | 120 (50.8%) |
Education in Declo
School Enrollment in Declo
The most common levels of schooling among the 182 students in Declo are middle school (77 | 42.3%), high school (57 | 31.3%), and college / undergraduate (25 | 13.7%).
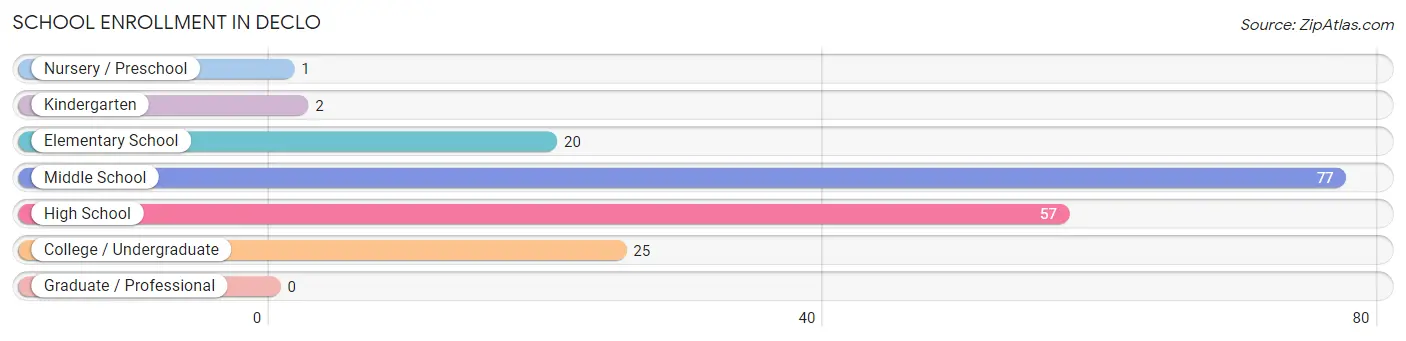
| School Level | # Students | % Students |
| Nursery / Preschool | 1 | 0.5% |
| Kindergarten | 2 | 1.1% |
| Elementary School | 20 | 11.0% |
| Middle School | 77 | 42.3% |
| High School | 57 | 31.3% |
| College / Undergraduate | 25 | 13.7% |
| Graduate / Professional | 0 | 0.0% |
| Total | 182 | 100.0% |
School Enrollment by Age by Funding Source in Declo
Out of a total of 182 students who are enrolled in schools in Declo, 16 (8.8%) attend a private institution, while the remaining 166 (91.2%) are enrolled in public schools. The age group of 3 to 4 year olds has the highest likelihood of being enrolled in private schools, with 1 (100.0% in the age bracket) enrolled. Conversely, the age group of 10 to 14 year olds has the lowest likelihood of being enrolled in a private school, with 92 (100.0% in the age bracket) attending a public institution.
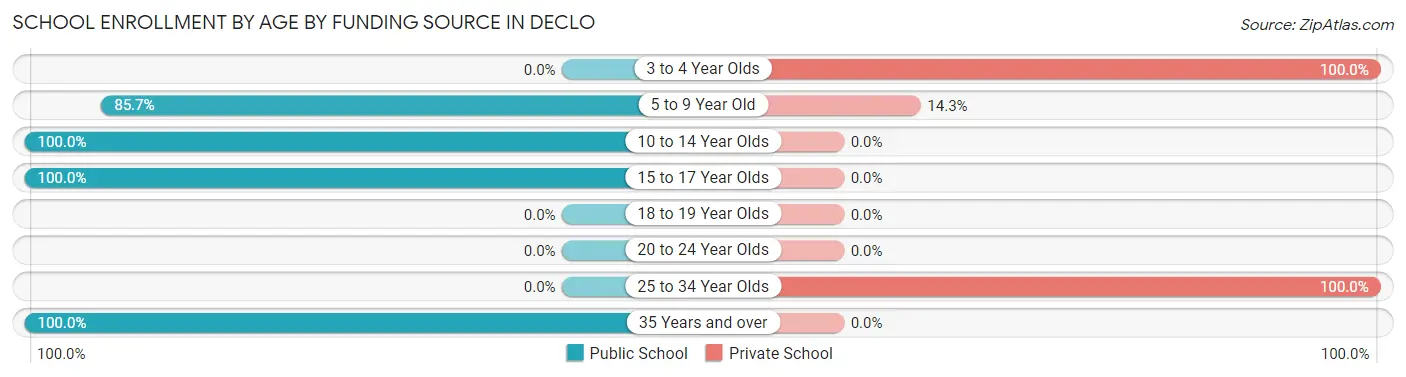
| Age Bracket | Public School | Private School |
| 3 to 4 Year Olds | 0 (0.0%) | 1 (100.0%) |
| 5 to 9 Year Old | 12 (85.7%) | 2 (14.3%) |
| 10 to 14 Year Olds | 92 (100.0%) | 0 (0.0%) |
| 15 to 17 Year Olds | 50 (100.0%) | 0 (0.0%) |
| 18 to 19 Year Olds | 0 (0.0%) | 0 (0.0%) |
| 20 to 24 Year Olds | 0 (0.0%) | 0 (0.0%) |
| 25 to 34 Year Olds | 0 (0.0%) | 13 (100.0%) |
| 35 Years and over | 12 (100.0%) | 0 (0.0%) |
| Total | 166 (91.2%) | 16 (8.8%) |
Educational Attainment by Field of Study in Declo
Education (45 | 95.7%), and business (2 | 4.3%) are the most common fields of study among 47 individuals in Declo who have obtained a bachelor's degree or higher.
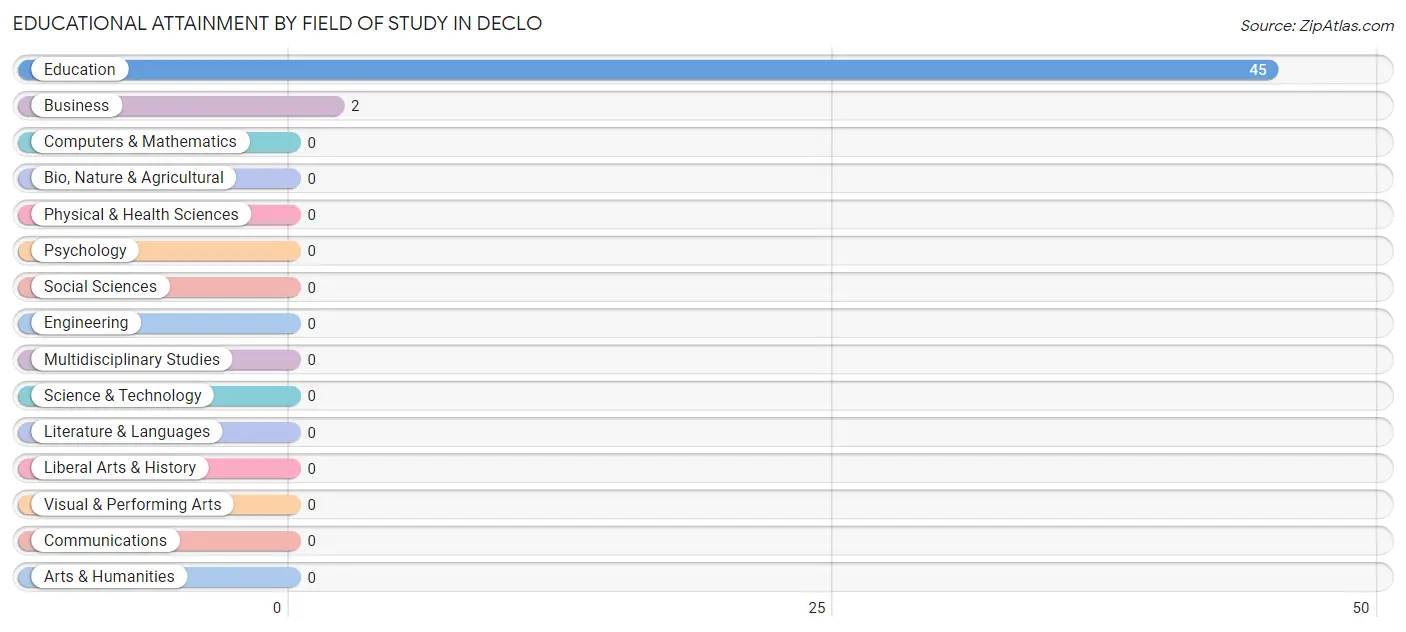
| Field of Study | # Graduates | % Graduates |
| Computers & Mathematics | 0 | 0.0% |
| Bio, Nature & Agricultural | 0 | 0.0% |
| Physical & Health Sciences | 0 | 0.0% |
| Psychology | 0 | 0.0% |
| Social Sciences | 0 | 0.0% |
| Engineering | 0 | 0.0% |
| Multidisciplinary Studies | 0 | 0.0% |
| Science & Technology | 0 | 0.0% |
| Business | 2 | 4.3% |
| Education | 45 | 95.7% |
| Literature & Languages | 0 | 0.0% |
| Liberal Arts & History | 0 | 0.0% |
| Visual & Performing Arts | 0 | 0.0% |
| Communications | 0 | 0.0% |
| Arts & Humanities | 0 | 0.0% |
| Total | 47 | 100.0% |
Transportation & Commute in Declo
Vehicle Availability by Sex in Declo
The most prevalent vehicle ownership categories in Declo are males with 2 vehicles (31, accounting for 29.2%) and females with 2 vehicles (44, making up 27.0%).
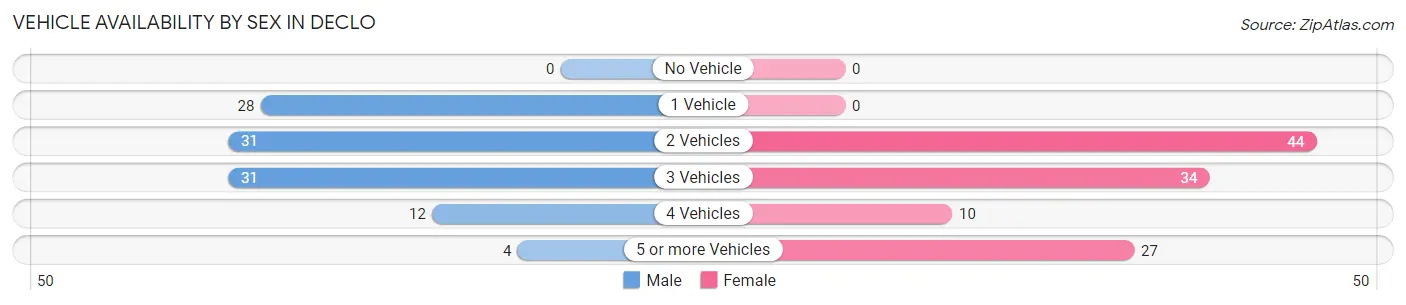
| Vehicles Available | Male | Female |
| No Vehicle | 0 (0.0%) | 0 (0.0%) |
| 1 Vehicle | 28 (26.4%) | 0 (0.0%) |
| 2 Vehicles | 31 (29.2%) | 44 (38.3%) |
| 3 Vehicles | 31 (29.2%) | 34 (29.6%) |
| 4 Vehicles | 12 (11.3%) | 10 (8.7%) |
| 5 or more Vehicles | 4 (3.8%) | 27 (23.5%) |
| Total | 106 (100.0%) | 115 (100.0%) |
Commute Time in Declo
The most frequently occuring commute durations in Declo are 5 to 9 minutes (70 commuters, 31.7%), 15 to 19 minutes (45 commuters, 20.4%), and 20 to 24 minutes (38 commuters, 17.2%).
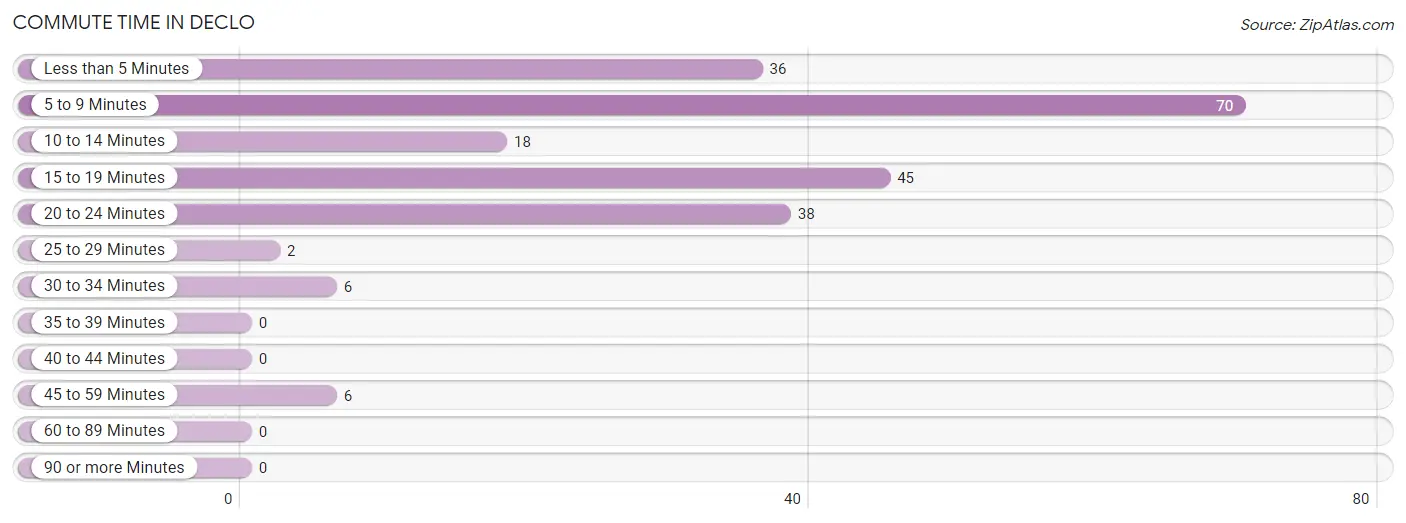
| Commute Time | # Commuters | % Commuters |
| Less than 5 Minutes | 36 | 16.3% |
| 5 to 9 Minutes | 70 | 31.7% |
| 10 to 14 Minutes | 18 | 8.1% |
| 15 to 19 Minutes | 45 | 20.4% |
| 20 to 24 Minutes | 38 | 17.2% |
| 25 to 29 Minutes | 2 | 0.9% |
| 30 to 34 Minutes | 6 | 2.7% |
| 35 to 39 Minutes | 0 | 0.0% |
| 40 to 44 Minutes | 0 | 0.0% |
| 45 to 59 Minutes | 6 | 2.7% |
| 60 to 89 Minutes | 0 | 0.0% |
| 90 or more Minutes | 0 | 0.0% |
Commute Time by Sex in Declo
The most common commute times in Declo are 20 to 24 minutes (27 commuters, 25.5%) for males and 5 to 9 minutes (51 commuters, 44.4%) for females.
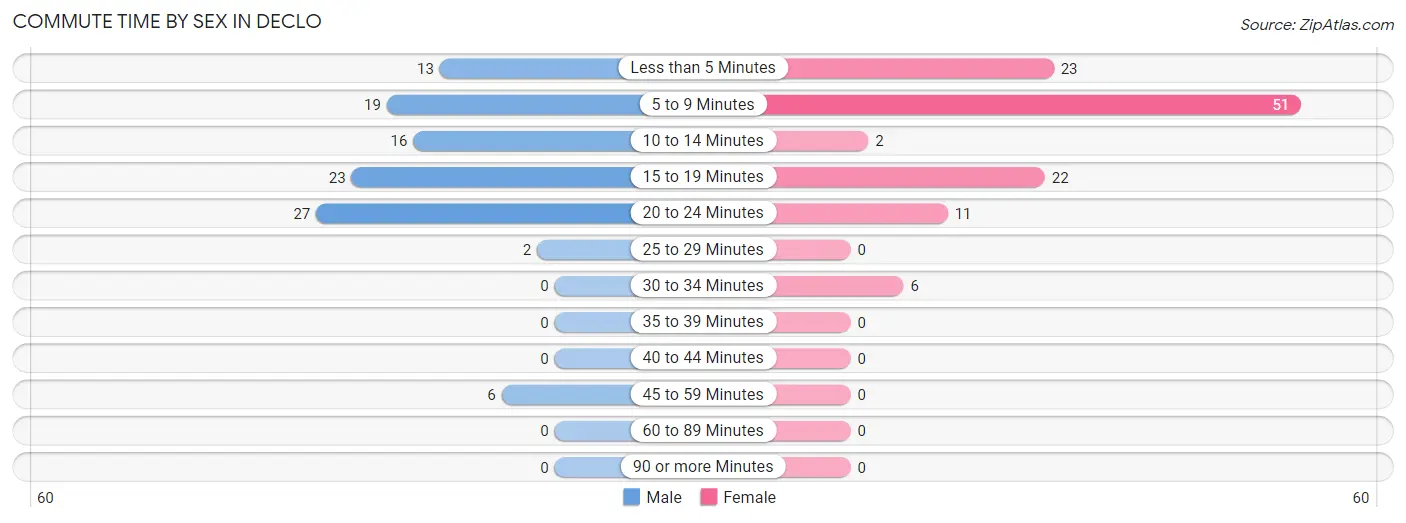
| Commute Time | Male | Female |
| Less than 5 Minutes | 13 (12.3%) | 23 (20.0%) |
| 5 to 9 Minutes | 19 (17.9%) | 51 (44.4%) |
| 10 to 14 Minutes | 16 (15.1%) | 2 (1.7%) |
| 15 to 19 Minutes | 23 (21.7%) | 22 (19.1%) |
| 20 to 24 Minutes | 27 (25.5%) | 11 (9.6%) |
| 25 to 29 Minutes | 2 (1.9%) | 0 (0.0%) |
| 30 to 34 Minutes | 0 (0.0%) | 6 (5.2%) |
| 35 to 39 Minutes | 0 (0.0%) | 0 (0.0%) |
| 40 to 44 Minutes | 0 (0.0%) | 0 (0.0%) |
| 45 to 59 Minutes | 6 (5.7%) | 0 (0.0%) |
| 60 to 89 Minutes | 0 (0.0%) | 0 (0.0%) |
| 90 or more Minutes | 0 (0.0%) | 0 (0.0%) |
Time of Departure to Work by Sex in Declo
The most frequent times of departure to work in Declo are 7:30 AM to 7:59 AM (26, 24.5%) for males and 7:30 AM to 7:59 AM (57, 49.6%) for females.
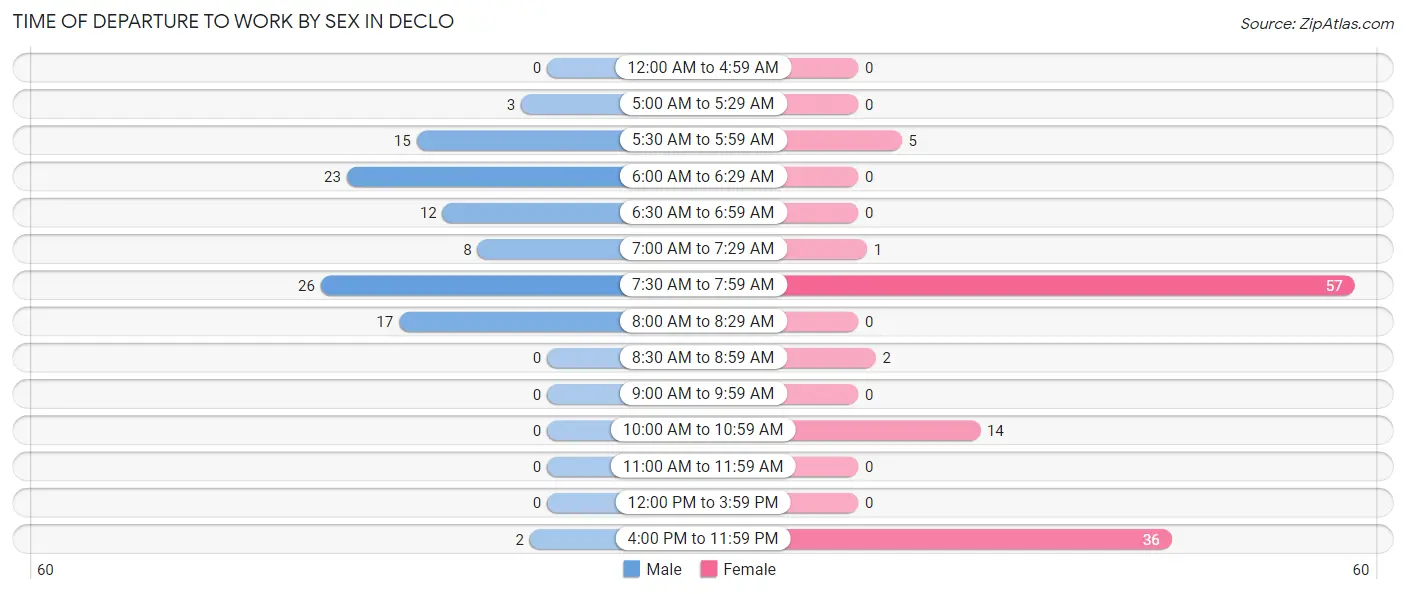
| Time of Departure | Male | Female |
| 12:00 AM to 4:59 AM | 0 (0.0%) | 0 (0.0%) |
| 5:00 AM to 5:29 AM | 3 (2.8%) | 0 (0.0%) |
| 5:30 AM to 5:59 AM | 15 (14.1%) | 5 (4.3%) |
| 6:00 AM to 6:29 AM | 23 (21.7%) | 0 (0.0%) |
| 6:30 AM to 6:59 AM | 12 (11.3%) | 0 (0.0%) |
| 7:00 AM to 7:29 AM | 8 (7.5%) | 1 (0.9%) |
| 7:30 AM to 7:59 AM | 26 (24.5%) | 57 (49.6%) |
| 8:00 AM to 8:29 AM | 17 (16.0%) | 0 (0.0%) |
| 8:30 AM to 8:59 AM | 0 (0.0%) | 2 (1.7%) |
| 9:00 AM to 9:59 AM | 0 (0.0%) | 0 (0.0%) |
| 10:00 AM to 10:59 AM | 0 (0.0%) | 14 (12.2%) |
| 11:00 AM to 11:59 AM | 0 (0.0%) | 0 (0.0%) |
| 12:00 PM to 3:59 PM | 0 (0.0%) | 0 (0.0%) |
| 4:00 PM to 11:59 PM | 2 (1.9%) | 36 (31.3%) |
| Total | 106 (100.0%) | 115 (100.0%) |
Housing Occupancy in Declo
Occupancy by Ownership in Declo
Of the total 199 dwellings in Declo, owner-occupied units account for 82 (41.2%), while renter-occupied units make up 117 (58.8%).
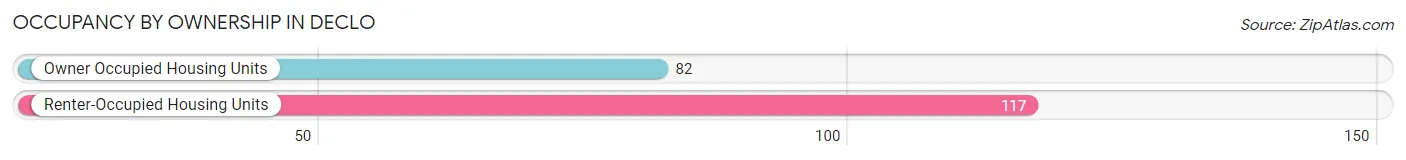
| Occupancy | # Housing Units | % Housing Units |
| Owner Occupied Housing Units | 82 | 41.2% |
| Renter-Occupied Housing Units | 117 | 58.8% |
| Total Occupied Housing Units | 199 | 100.0% |
Occupancy by Household Size in Declo
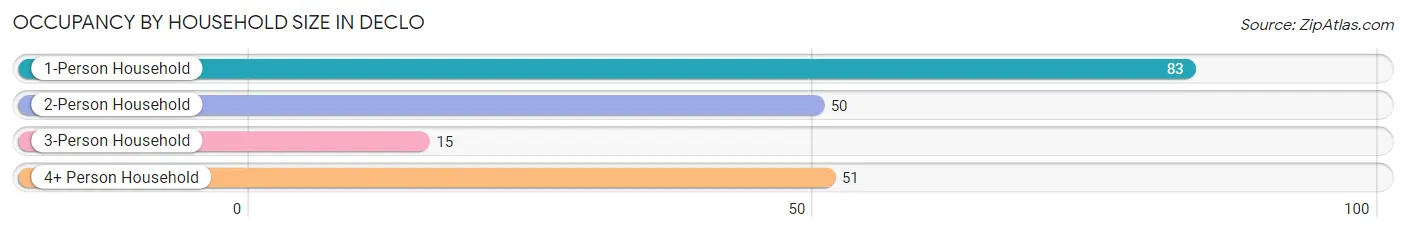
| Household Size | # Housing Units | % Housing Units |
| 1-Person Household | 83 | 41.7% |
| 2-Person Household | 50 | 25.1% |
| 3-Person Household | 15 | 7.5% |
| 4+ Person Household | 51 | 25.6% |
| Total Housing Units | 199 | 100.0% |
Occupancy by Ownership by Household Size in Declo
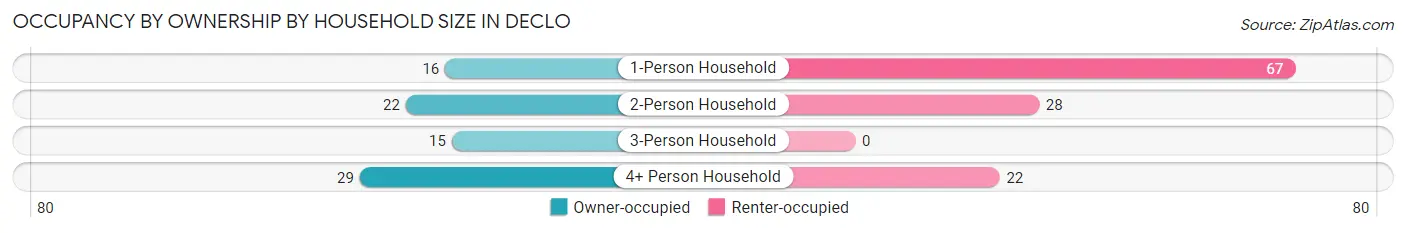
| Household Size | Owner-occupied | Renter-occupied |
| 1-Person Household | 16 (19.3%) | 67 (80.7%) |
| 2-Person Household | 22 (44.0%) | 28 (56.0%) |
| 3-Person Household | 15 (100.0%) | 0 (0.0%) |
| 4+ Person Household | 29 (56.9%) | 22 (43.1%) |
| Total Housing Units | 82 (41.2%) | 117 (58.8%) |
Occupancy by Educational Attainment in Declo
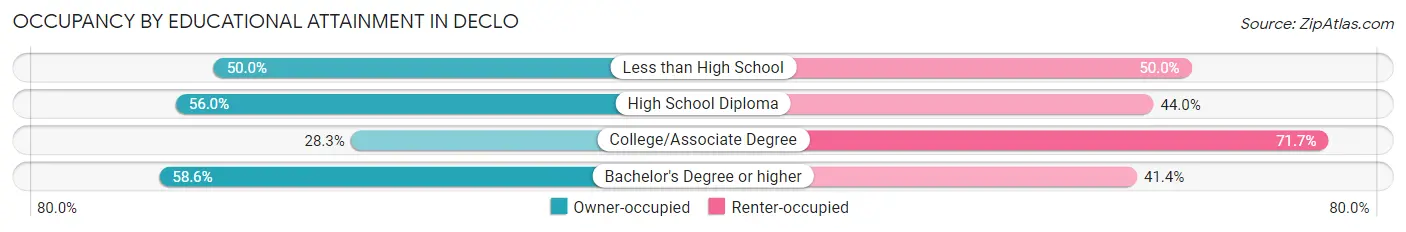
| Household Size | Owner-occupied | Renter-occupied |
| Less than High School | 7 (50.0%) | 7 (50.0%) |
| High School Diploma | 28 (56.0%) | 22 (44.0%) |
| College/Associate Degree | 30 (28.3%) | 76 (71.7%) |
| Bachelor's Degree or higher | 17 (58.6%) | 12 (41.4%) |
Occupancy by Age of Householder in Declo
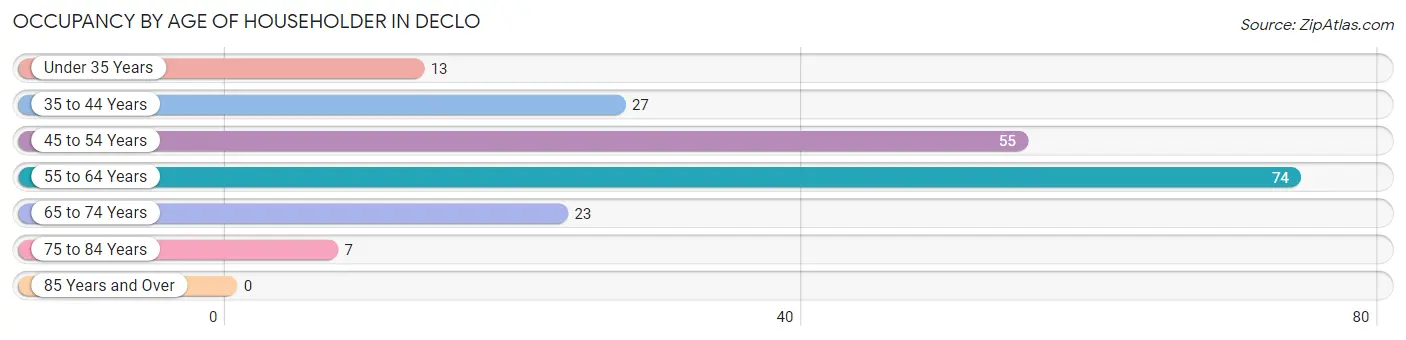
| Age Bracket | # Households | % Households |
| Under 35 Years | 13 | 6.5% |
| 35 to 44 Years | 27 | 13.6% |
| 45 to 54 Years | 55 | 27.6% |
| 55 to 64 Years | 74 | 37.2% |
| 65 to 74 Years | 23 | 11.6% |
| 75 to 84 Years | 7 | 3.5% |
| 85 Years and Over | 0 | 0.0% |
| Total | 199 | 100.0% |
Housing Finances in Declo
Median Income by Occupancy in Declo
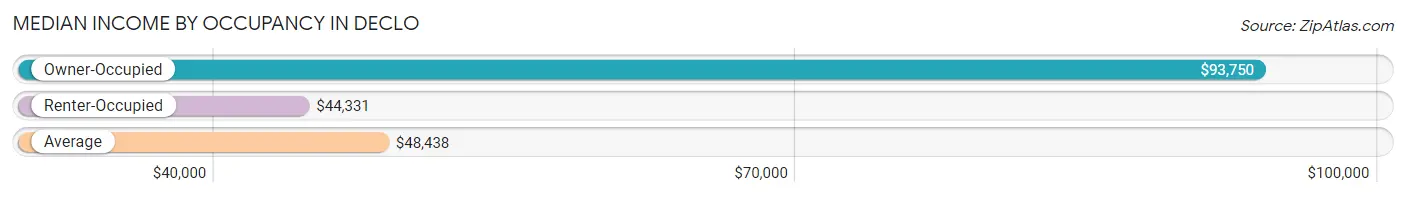
| Occupancy Type | # Households | Median Income |
| Owner-Occupied | 82 (41.2%) | $93,750 |
| Renter-Occupied | 117 (58.8%) | $44,331 |
| Average | 199 (100.0%) | $48,438 |
Occupancy by Householder Income Bracket in Declo
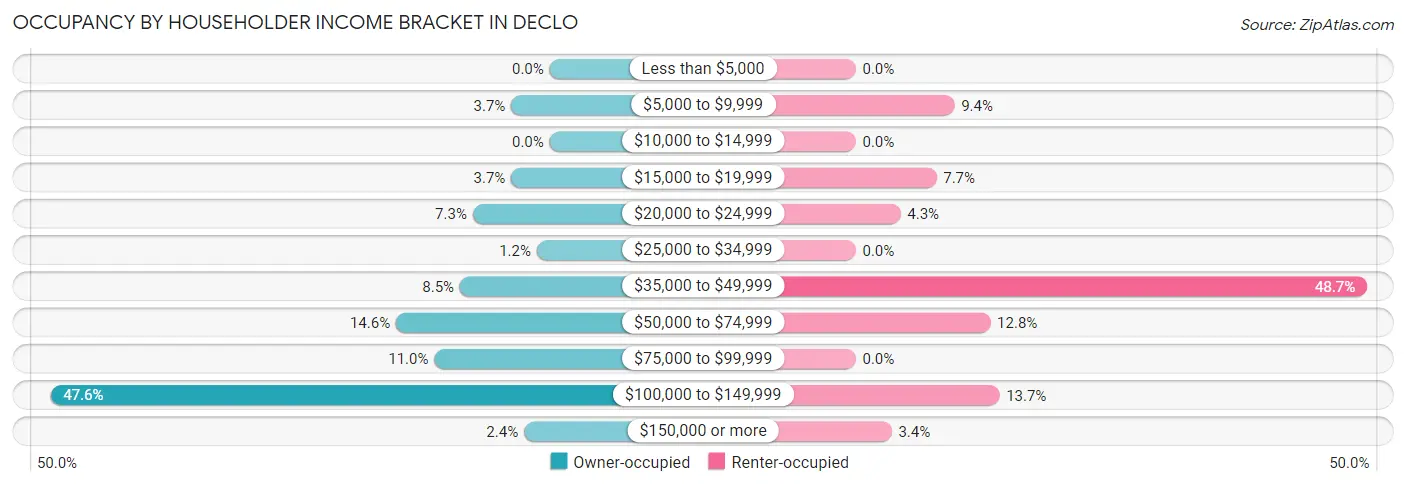
| Income Bracket | Owner-occupied | Renter-occupied |
| Less than $5,000 | 0 (0.0%) | 0 (0.0%) |
| $5,000 to $9,999 | 3 (3.7%) | 11 (9.4%) |
| $10,000 to $14,999 | 0 (0.0%) | 0 (0.0%) |
| $15,000 to $19,999 | 3 (3.7%) | 9 (7.7%) |
| $20,000 to $24,999 | 6 (7.3%) | 5 (4.3%) |
| $25,000 to $34,999 | 1 (1.2%) | 0 (0.0%) |
| $35,000 to $49,999 | 7 (8.5%) | 57 (48.7%) |
| $50,000 to $74,999 | 12 (14.6%) | 15 (12.8%) |
| $75,000 to $99,999 | 9 (11.0%) | 0 (0.0%) |
| $100,000 to $149,999 | 39 (47.6%) | 16 (13.7%) |
| $150,000 or more | 2 (2.4%) | 4 (3.4%) |
| Total | 82 (100.0%) | 117 (100.0%) |
Monthly Housing Cost Tiers in Declo
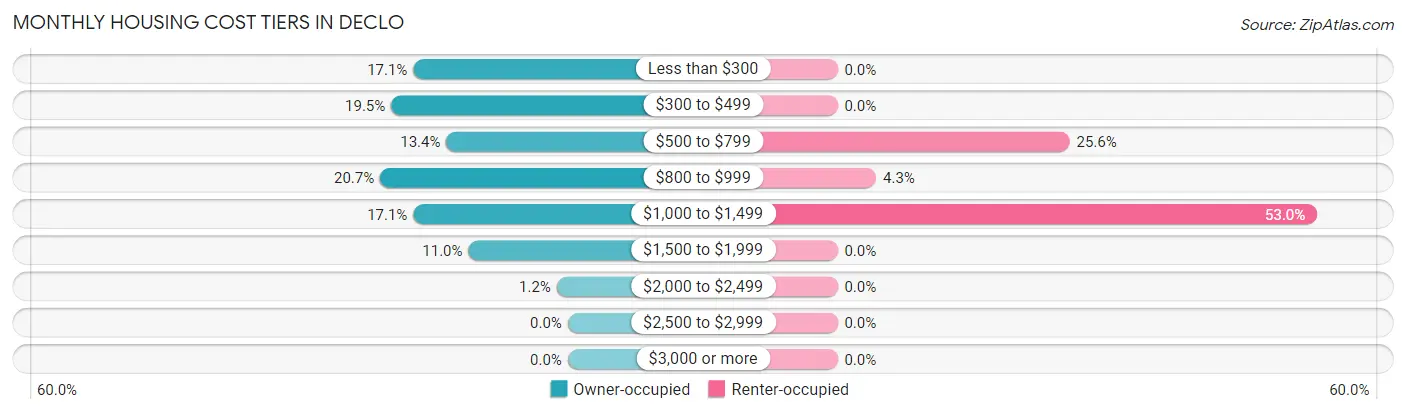
| Monthly Cost | Owner-occupied | Renter-occupied |
| Less than $300 | 14 (17.1%) | 0 (0.0%) |
| $300 to $499 | 16 (19.5%) | 0 (0.0%) |
| $500 to $799 | 11 (13.4%) | 30 (25.6%) |
| $800 to $999 | 17 (20.7%) | 5 (4.3%) |
| $1,000 to $1,499 | 14 (17.1%) | 62 (53.0%) |
| $1,500 to $1,999 | 9 (11.0%) | 0 (0.0%) |
| $2,000 to $2,499 | 1 (1.2%) | 0 (0.0%) |
| $2,500 to $2,999 | 0 (0.0%) | 0 (0.0%) |
| $3,000 or more | 0 (0.0%) | 0 (0.0%) |
| Total | 82 (100.0%) | 117 (100.0%) |
Physical Housing Characteristics in Declo
Housing Structures in Declo

| Structure Type | # Housing Units | % Housing Units |
| Single Unit, Detached | 163 | 81.9% |
| Single Unit, Attached | 7 | 3.5% |
| 2 Unit Apartments | 0 | 0.0% |
| 3 or 4 Unit Apartments | 1 | 0.5% |
| 5 to 9 Unit Apartments | 9 | 4.5% |
| 10 or more Apartments | 0 | 0.0% |
| Mobile Home / Other | 19 | 9.6% |
| Total | 199 | 100.0% |
Housing Structures by Occupancy in Declo
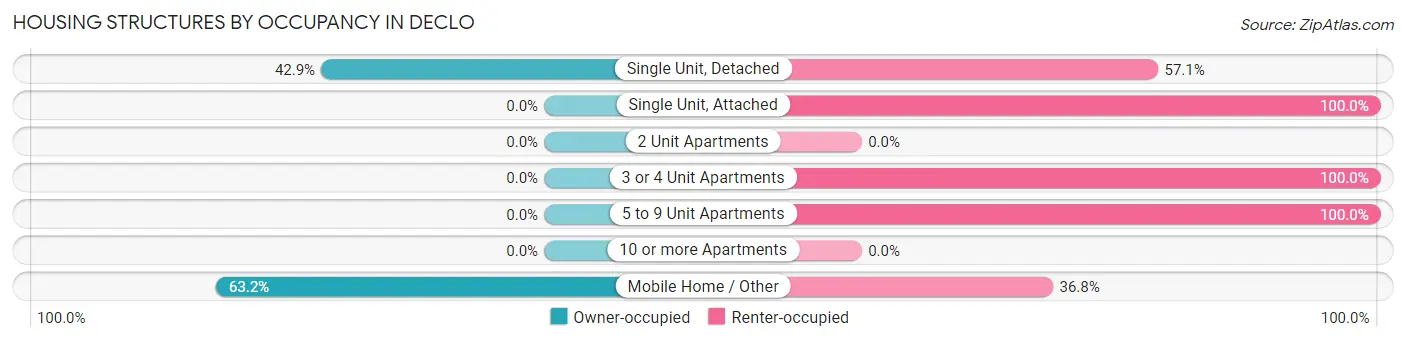
| Structure Type | Owner-occupied | Renter-occupied |
| Single Unit, Detached | 70 (42.9%) | 93 (57.1%) |
| Single Unit, Attached | 0 (0.0%) | 7 (100.0%) |
| 2 Unit Apartments | 0 (0.0%) | 0 (0.0%) |
| 3 or 4 Unit Apartments | 0 (0.0%) | 1 (100.0%) |
| 5 to 9 Unit Apartments | 0 (0.0%) | 9 (100.0%) |
| 10 or more Apartments | 0 (0.0%) | 0 (0.0%) |
| Mobile Home / Other | 12 (63.2%) | 7 (36.8%) |
| Total | 82 (41.2%) | 117 (58.8%) |
Housing Structures by Number of Rooms in Declo
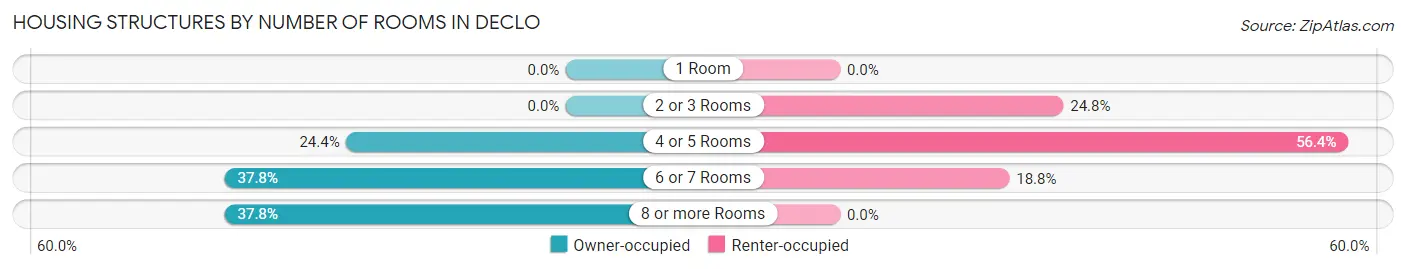
| Number of Rooms | Owner-occupied | Renter-occupied |
| 1 Room | 0 (0.0%) | 0 (0.0%) |
| 2 or 3 Rooms | 0 (0.0%) | 29 (24.8%) |
| 4 or 5 Rooms | 20 (24.4%) | 66 (56.4%) |
| 6 or 7 Rooms | 31 (37.8%) | 22 (18.8%) |
| 8 or more Rooms | 31 (37.8%) | 0 (0.0%) |
| Total | 82 (100.0%) | 117 (100.0%) |
Housing Structure by Heating Type in Declo
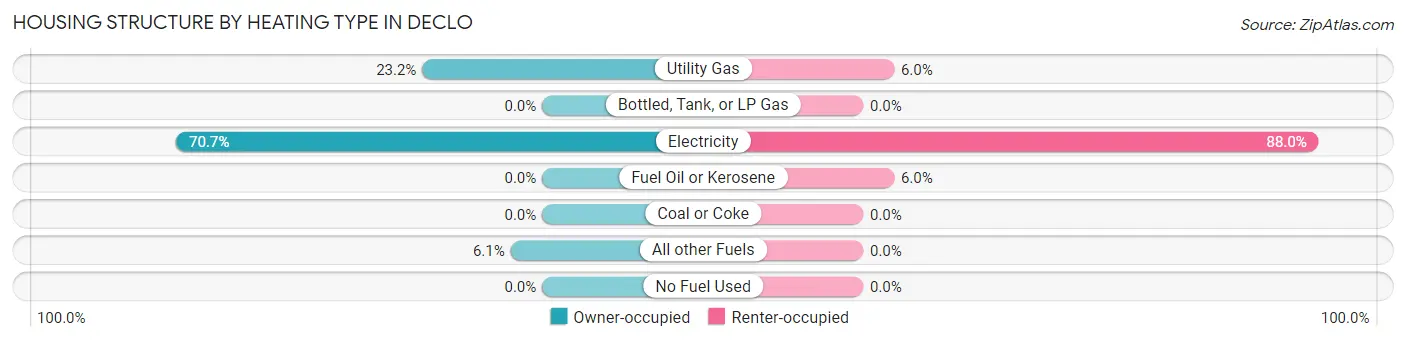
| Heating Type | Owner-occupied | Renter-occupied |
| Utility Gas | 19 (23.2%) | 7 (6.0%) |
| Bottled, Tank, or LP Gas | 0 (0.0%) | 0 (0.0%) |
| Electricity | 58 (70.7%) | 103 (88.0%) |
| Fuel Oil or Kerosene | 0 (0.0%) | 7 (6.0%) |
| Coal or Coke | 0 (0.0%) | 0 (0.0%) |
| All other Fuels | 5 (6.1%) | 0 (0.0%) |
| No Fuel Used | 0 (0.0%) | 0 (0.0%) |
| Total | 82 (100.0%) | 117 (100.0%) |
Household Vehicle Usage in Declo
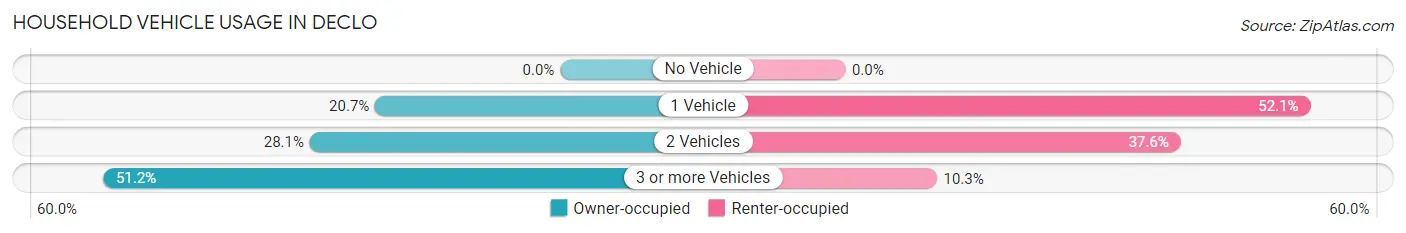
| Vehicles per Household | Owner-occupied | Renter-occupied |
| No Vehicle | 0 (0.0%) | 0 (0.0%) |
| 1 Vehicle | 17 (20.7%) | 61 (52.1%) |
| 2 Vehicles | 23 (28.1%) | 44 (37.6%) |
| 3 or more Vehicles | 42 (51.2%) | 12 (10.3%) |
| Total | 82 (100.0%) | 117 (100.0%) |
Real Estate & Mortgages in Declo
Real Estate and Mortgage Overview in Declo
| Characteristic | Without Mortgage | With Mortgage |
| Housing Units | 43 | 39 |
| Median Property Value | $187,500 | $0 |
| Median Household Income | $69,750 | $1 |
| Monthly Housing Costs | $342 | $0 |
| Real Estate Taxes | $721 | $0 |
Property Value by Mortgage Status in Declo
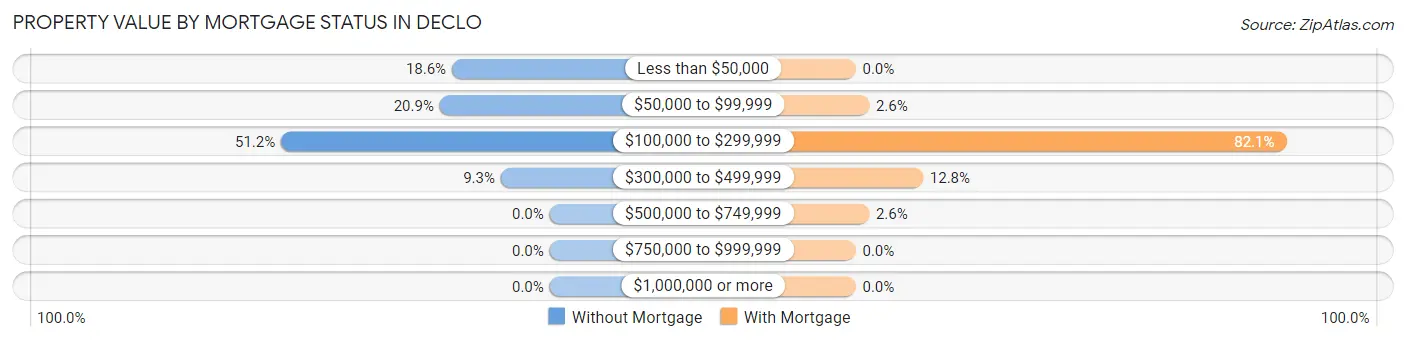
| Property Value | Without Mortgage | With Mortgage |
| Less than $50,000 | 8 (18.6%) | 0 (0.0%) |
| $50,000 to $99,999 | 9 (20.9%) | 1 (2.6%) |
| $100,000 to $299,999 | 22 (51.2%) | 32 (82.1%) |
| $300,000 to $499,999 | 4 (9.3%) | 5 (12.8%) |
| $500,000 to $749,999 | 0 (0.0%) | 1 (2.6%) |
| $750,000 to $999,999 | 0 (0.0%) | 0 (0.0%) |
| $1,000,000 or more | 0 (0.0%) | 0 (0.0%) |
| Total | 43 (100.0%) | 39 (100.0%) |
Household Income by Mortgage Status in Declo
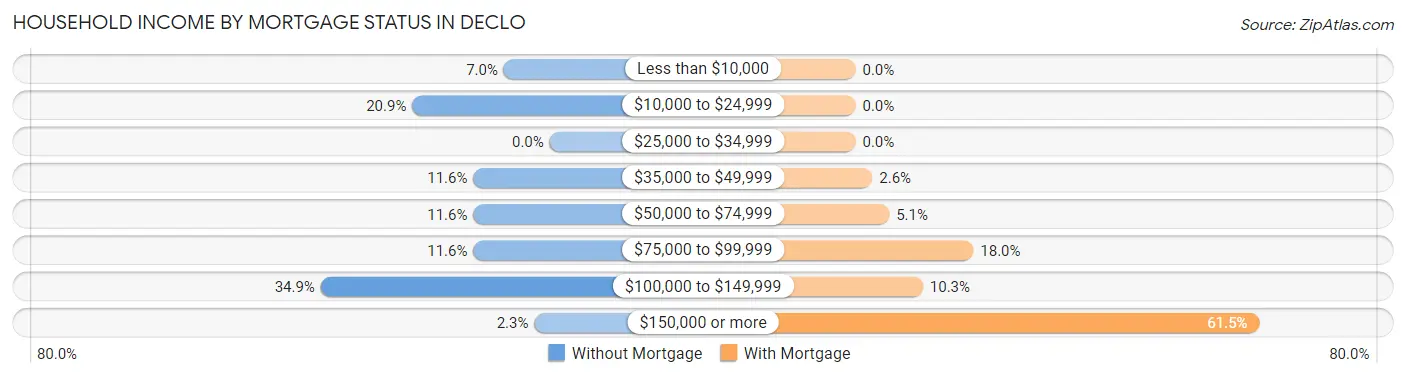
| Household Income | Without Mortgage | With Mortgage |
| Less than $10,000 | 3 (7.0%) | 0 (0.0%) |
| $10,000 to $24,999 | 9 (20.9%) | 0 (0.0%) |
| $25,000 to $34,999 | 0 (0.0%) | 0 (0.0%) |
| $35,000 to $49,999 | 5 (11.6%) | 1 (2.6%) |
| $50,000 to $74,999 | 5 (11.6%) | 2 (5.1%) |
| $75,000 to $99,999 | 5 (11.6%) | 7 (17.9%) |
| $100,000 to $149,999 | 15 (34.9%) | 4 (10.3%) |
| $150,000 or more | 1 (2.3%) | 24 (61.5%) |
| Total | 43 (100.0%) | 39 (100.0%) |
Property Value to Household Income Ratio in Declo
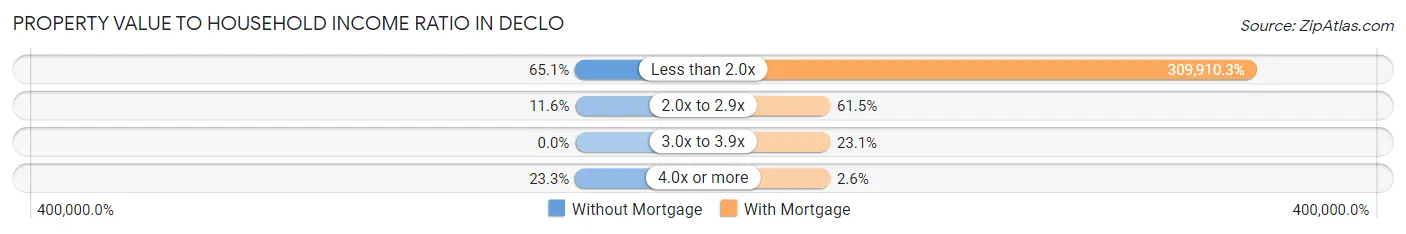
| Value-to-Income Ratio | Without Mortgage | With Mortgage |
| Less than 2.0x | 28 (65.1%) | 120,865 (309,910.3%) |
| 2.0x to 2.9x | 5 (11.6%) | 24 (61.5%) |
| 3.0x to 3.9x | 0 (0.0%) | 9 (23.1%) |
| 4.0x or more | 10 (23.3%) | 1 (2.6%) |
| Total | 43 (100.0%) | 39 (100.0%) |
Real Estate Taxes by Mortgage Status in Declo
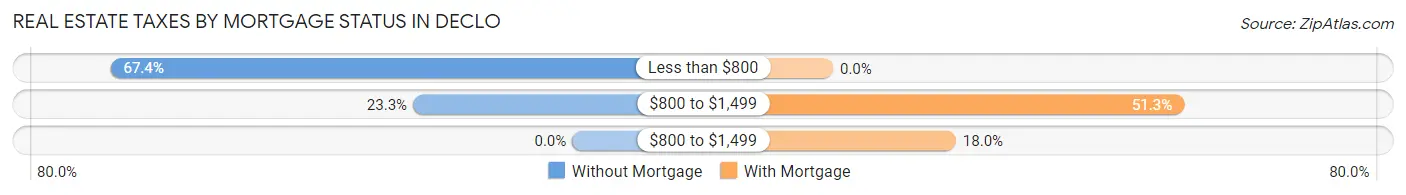
| Property Taxes | Without Mortgage | With Mortgage |
| Less than $800 | 29 (67.4%) | 0 (0.0%) |
| $800 to $1,499 | 10 (23.3%) | 20 (51.3%) |
| $800 to $1,499 | 0 (0.0%) | 7 (17.9%) |
| Total | 43 (100.0%) | 39 (100.0%) |
Health & Disability in Declo
Health Insurance Coverage by Age in Declo
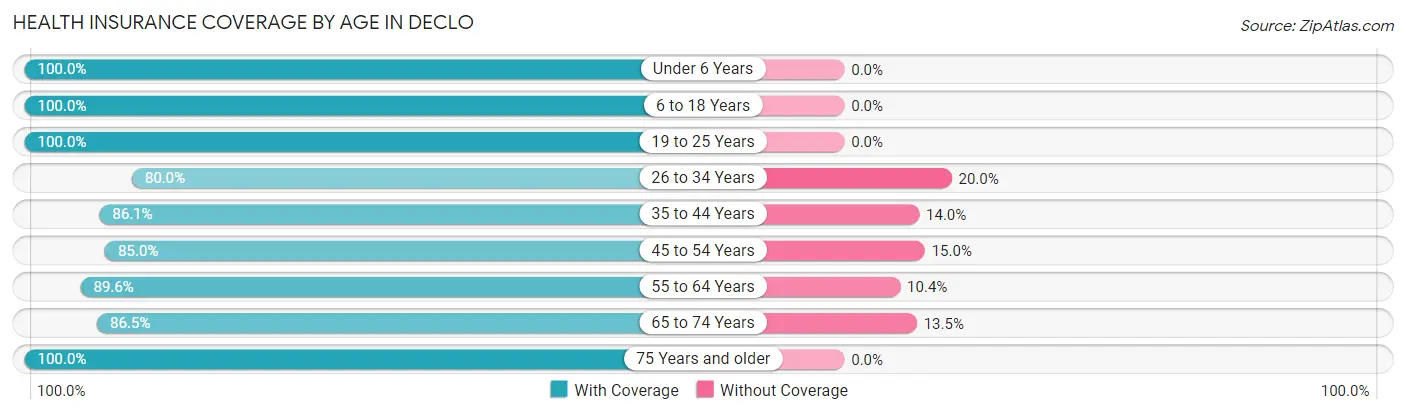
| Age Bracket | With Coverage | Without Coverage |
| Under 6 Years | 8 (100.0%) | 0 (0.0%) |
| 6 to 18 Years | 161 (100.0%) | 0 (0.0%) |
| 19 to 25 Years | 14 (100.0%) | 0 (0.0%) |
| 26 to 34 Years | 24 (80.0%) | 6 (20.0%) |
| 35 to 44 Years | 37 (86.1%) | 6 (14.0%) |
| 45 to 54 Years | 85 (85.0%) | 15 (15.0%) |
| 55 to 64 Years | 86 (89.6%) | 10 (10.4%) |
| 65 to 74 Years | 32 (86.5%) | 5 (13.5%) |
| 75 Years and older | 9 (100.0%) | 0 (0.0%) |
| Total | 456 (91.6%) | 42 (8.4%) |
Health Insurance Coverage by Citizenship Status in Declo
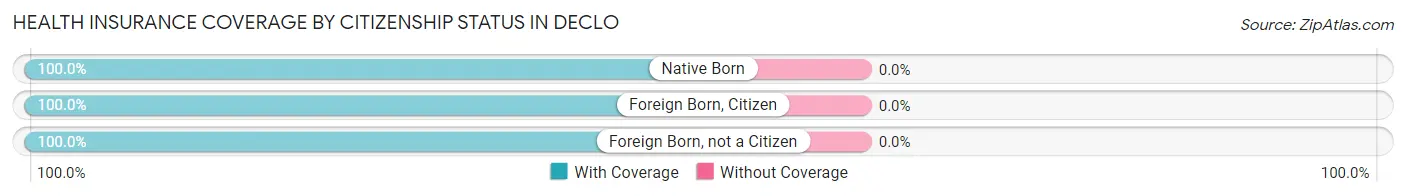
| Citizenship Status | With Coverage | Without Coverage |
| Native Born | 8 (100.0%) | 0 (0.0%) |
| Foreign Born, Citizen | 161 (100.0%) | 0 (0.0%) |
| Foreign Born, not a Citizen | 14 (100.0%) | 0 (0.0%) |
Health Insurance Coverage by Household Income in Declo
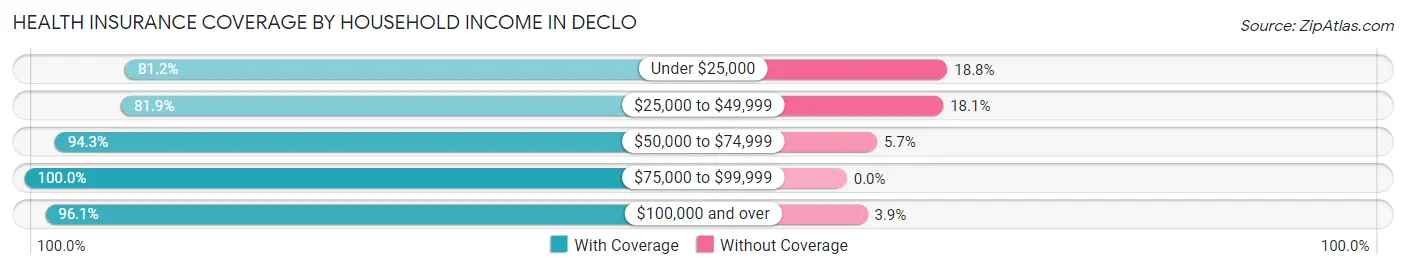
| Household Income | With Coverage | Without Coverage |
| Under $25,000 | 56 (81.2%) | 13 (18.8%) |
| $25,000 to $49,999 | 68 (81.9%) | 15 (18.1%) |
| $50,000 to $74,999 | 100 (94.3%) | 6 (5.7%) |
| $75,000 to $99,999 | 34 (100.0%) | 0 (0.0%) |
| $100,000 and over | 198 (96.1%) | 8 (3.9%) |
Public vs Private Health Insurance Coverage by Age in Declo
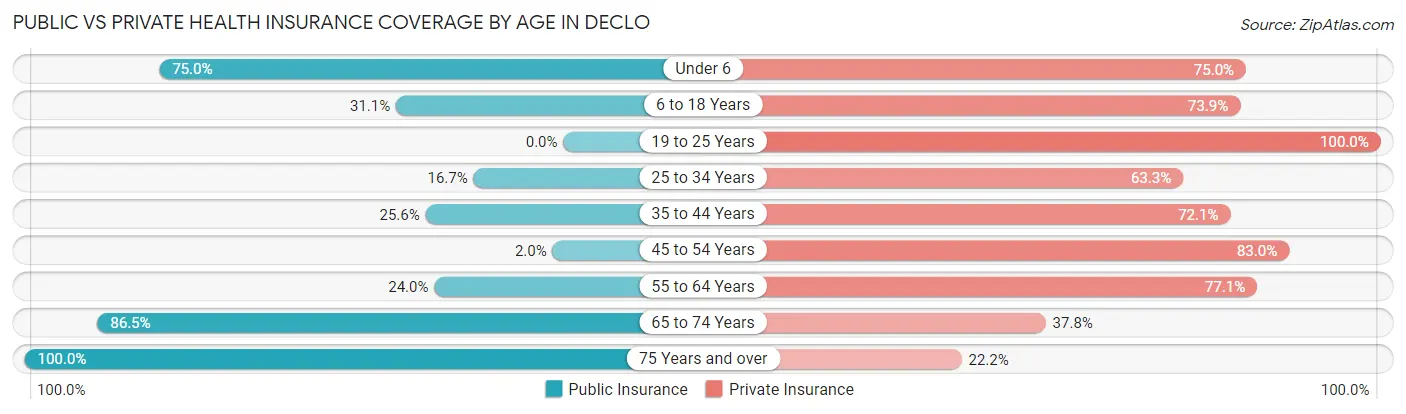
| Age Bracket | Public Insurance | Private Insurance |
| Under 6 | 6 (75.0%) | 6 (75.0%) |
| 6 to 18 Years | 50 (31.1%) | 119 (73.9%) |
| 19 to 25 Years | 0 (0.0%) | 14 (100.0%) |
| 25 to 34 Years | 5 (16.7%) | 19 (63.3%) |
| 35 to 44 Years | 11 (25.6%) | 31 (72.1%) |
| 45 to 54 Years | 2 (2.0%) | 83 (83.0%) |
| 55 to 64 Years | 23 (24.0%) | 74 (77.1%) |
| 65 to 74 Years | 32 (86.5%) | 14 (37.8%) |
| 75 Years and over | 9 (100.0%) | 2 (22.2%) |
| Total | 138 (27.7%) | 362 (72.7%) |
Disability Status by Sex by Age in Declo
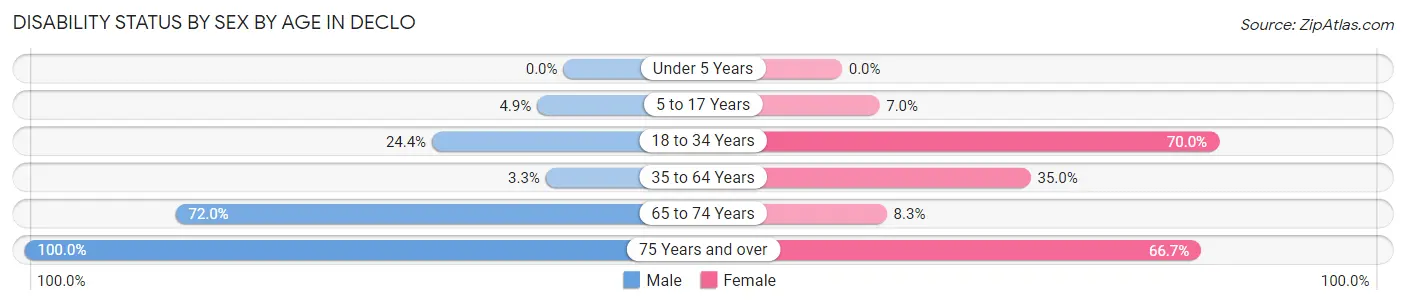
| Age Bracket | Male | Female |
| Under 5 Years | 0 (0.0%) | 0 (0.0%) |
| 5 to 17 Years | 2 (4.9%) | 8 (7.0%) |
| 18 to 34 Years | 10 (24.4%) | 7 (70.0%) |
| 35 to 64 Years | 4 (3.3%) | 41 (35.0%) |
| 65 to 74 Years | 18 (72.0%) | 1 (8.3%) |
| 75 Years and over | 6 (100.0%) | 2 (66.7%) |
Disability Class by Sex by Age in Declo
Disability Class: Hearing Difficulty
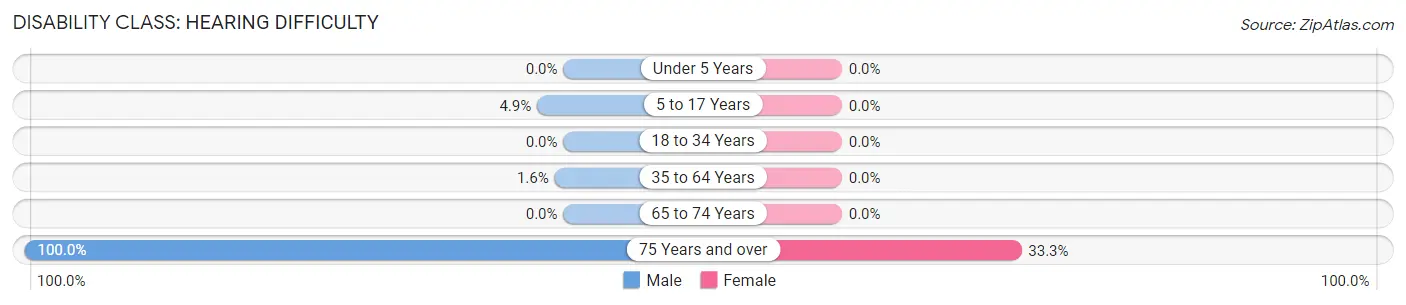
| Age Bracket | Male | Female |
| Under 5 Years | 0 (0.0%) | 0 (0.0%) |
| 5 to 17 Years | 2 (4.9%) | 0 (0.0%) |
| 18 to 34 Years | 0 (0.0%) | 0 (0.0%) |
| 35 to 64 Years | 2 (1.6%) | 0 (0.0%) |
| 65 to 74 Years | 0 (0.0%) | 0 (0.0%) |
| 75 Years and over | 6 (100.0%) | 1 (33.3%) |
Disability Class: Vision Difficulty
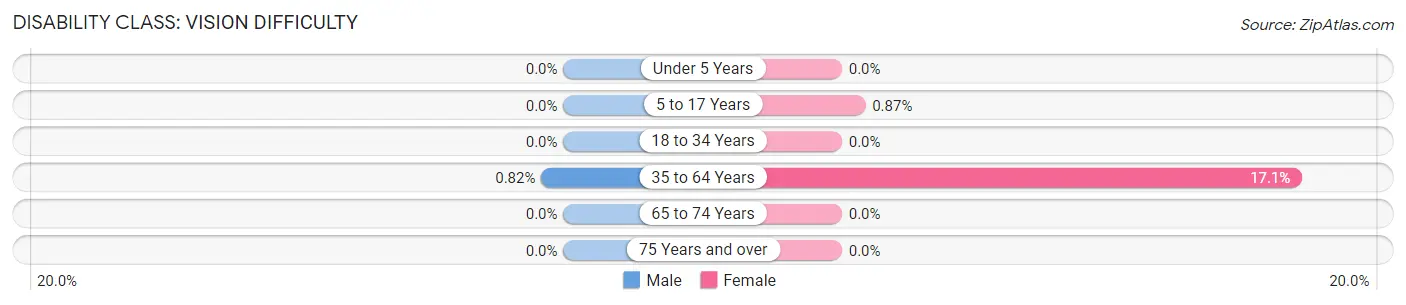
| Age Bracket | Male | Female |
| Under 5 Years | 0 (0.0%) | 0 (0.0%) |
| 5 to 17 Years | 0 (0.0%) | 1 (0.9%) |
| 18 to 34 Years | 0 (0.0%) | 0 (0.0%) |
| 35 to 64 Years | 1 (0.8%) | 20 (17.1%) |
| 65 to 74 Years | 0 (0.0%) | 0 (0.0%) |
| 75 Years and over | 0 (0.0%) | 0 (0.0%) |
Disability Class: Cognitive Difficulty
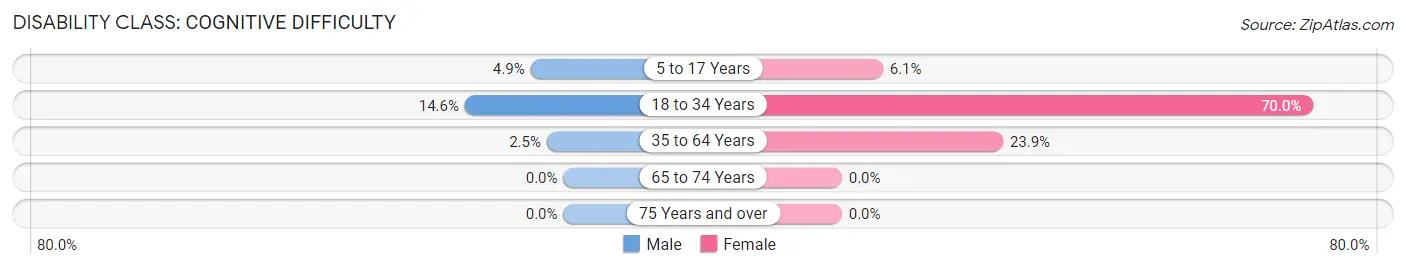
| Age Bracket | Male | Female |
| 5 to 17 Years | 2 (4.9%) | 7 (6.1%) |
| 18 to 34 Years | 6 (14.6%) | 7 (70.0%) |
| 35 to 64 Years | 3 (2.5%) | 28 (23.9%) |
| 65 to 74 Years | 0 (0.0%) | 0 (0.0%) |
| 75 Years and over | 0 (0.0%) | 0 (0.0%) |
Disability Class: Ambulatory Difficulty
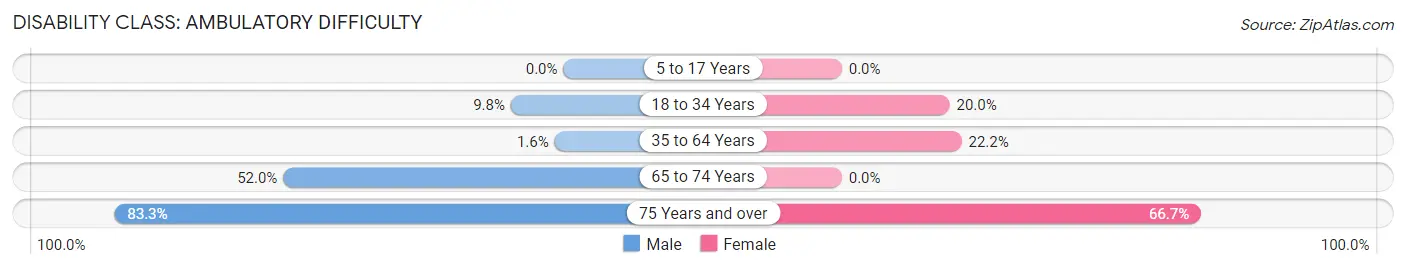
| Age Bracket | Male | Female |
| 5 to 17 Years | 0 (0.0%) | 0 (0.0%) |
| 18 to 34 Years | 4 (9.8%) | 2 (20.0%) |
| 35 to 64 Years | 2 (1.6%) | 26 (22.2%) |
| 65 to 74 Years | 13 (52.0%) | 0 (0.0%) |
| 75 Years and over | 5 (83.3%) | 2 (66.7%) |
Disability Class: Self-Care Difficulty
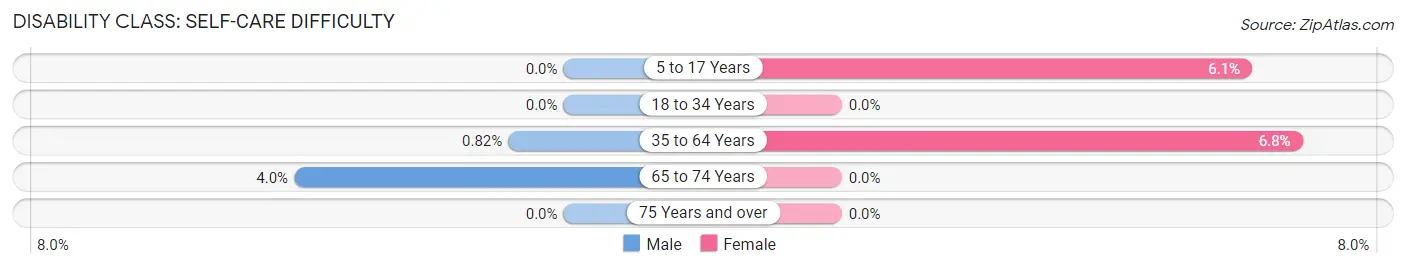
| Age Bracket | Male | Female |
| 5 to 17 Years | 0 (0.0%) | 7 (6.1%) |
| 18 to 34 Years | 0 (0.0%) | 0 (0.0%) |
| 35 to 64 Years | 1 (0.8%) | 8 (6.8%) |
| 65 to 74 Years | 1 (4.0%) | 0 (0.0%) |
| 75 Years and over | 0 (0.0%) | 0 (0.0%) |
Technology Access in Declo
Computing Device Access in Declo
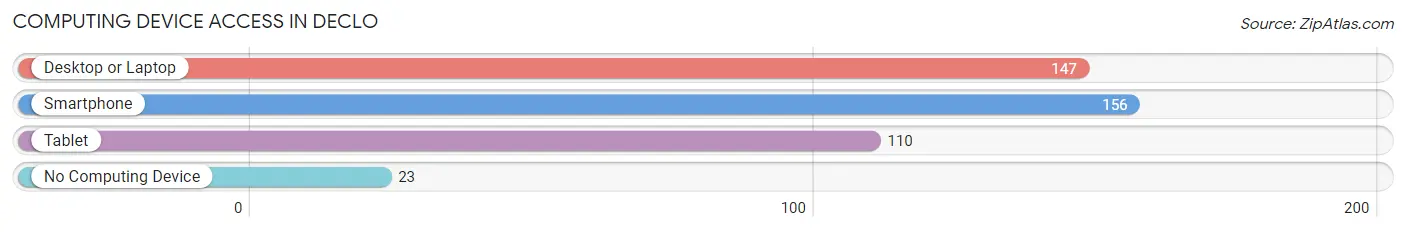
| Device Type | # Households | % Households |
| Desktop or Laptop | 147 | 73.9% |
| Smartphone | 156 | 78.4% |
| Tablet | 110 | 55.3% |
| No Computing Device | 23 | 11.6% |
| Total | 199 | 100.0% |
Internet Access in Declo
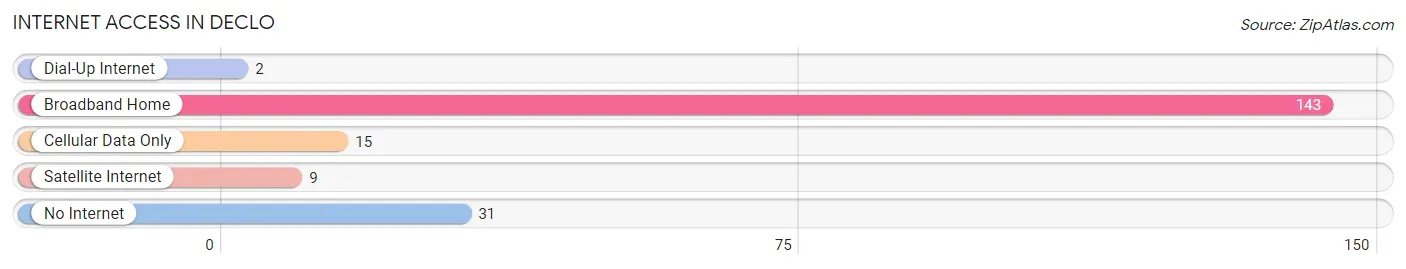
| Internet Type | # Households | % Households |
| Dial-Up Internet | 2 | 1.0% |
| Broadband Home | 143 | 71.9% |
| Cellular Data Only | 15 | 7.5% |
| Satellite Internet | 9 | 4.5% |
| No Internet | 31 | 15.6% |
| Total | 199 | 100.0% |
Declo Summary
Clo is a small town located in the state of Idaho, in the United States. It is situated in the south-central part of the state, in the foothills of the Rocky Mountains. The town has a population of approximately 1,500 people, and is the county seat of Cassia County.
History
Clo was first settled in 1864 by a group of Mormon pioneers. The town was named after the nearby river, which was named after the Shoshone chief, Clo-o-mah. The town was incorporated in 1883, and the first post office was established in 1884.
The town was an important stop on the Oregon Trail, and was a major trading center for the surrounding area. The town was also a major stop on the Union Pacific Railroad, which was built in the late 1800s.
Geography
Clo is located in the south-central part of Idaho, in the foothills of the Rocky Mountains. The town is situated at an elevation of 4,890 feet above sea level. The town is located on the banks of the Snake River, and is surrounded by the Snake River Plain.
The climate in Clo is semi-arid, with hot summers and cold winters. The average annual temperature is around 50 degrees Fahrenheit. The average annual precipitation is around 10 inches.
Economy
The economy of Clo is largely based on agriculture. The town is home to several farms, which produce a variety of crops, including wheat, barley, corn, and hay. The town is also home to several dairies, which produce milk and other dairy products.
The town is also home to several small businesses, including restaurants, retail stores, and service providers. The town is also home to several manufacturing companies, which produce a variety of products, including furniture, clothing, and electronics.
Demographics
As of the 2010 census, the population of Clo was 1,500 people. The racial makeup of the town was 95.3% White, 0.7% African American, 0.7% Native American, 0.3% Asian, 0.3% from other races, and 2.0% from two or more races. The median household income was $37,500, and the median family income was $45,000.
Clo is a small town with a rich history and a diverse population. The town is home to a variety of businesses, and is a great place to live and work. The town is also home to a variety of recreational activities, including fishing, camping, and hiking.
Common Questions
What is Per Capita Income in Declo?
Per Capita income in Declo is $30,319.
What is the Median Family Income in Declo?
Median Family Income in Declo is $103,750.
What is the Median Household income in Declo?
Median Household Income in Declo is $48,438.
What is Inequality or Gini Index in Declo?
Inequality or Gini Index in Declo is 0.38.
What is the Total Population of Declo?
Total Population of Declo is 498.
What is the Total Male Population of Declo?
Total Male Population of Declo is 240.
What is the Total Female Population of Declo?
Total Female Population of Declo is 258.
What is the Ratio of Males per 100 Females in Declo?
There are 93.02 Males per 100 Females in Declo.
What is the Ratio of Females per 100 Males in Declo?
There are 107.50 Females per 100 Males in Declo.
What is the Median Population Age in Declo?
Median Population Age in Declo is 44.2 Years.
What is the Average Family Size in Declo
Average Family Size in Declo is 3.5 People.
What is the Average Household Size in Declo
Average Household Size in Declo is 2.5 People.
How Large is the Labor Force in Declo?
There are 243 People in the Labor Forcein in Declo.
What is the Percentage of People in the Labor Force in Declo?
64.3% of People are in the Labor Force in Declo.
What is the Unemployment Rate in Declo?
Unemployment Rate in Declo is 2.9%.