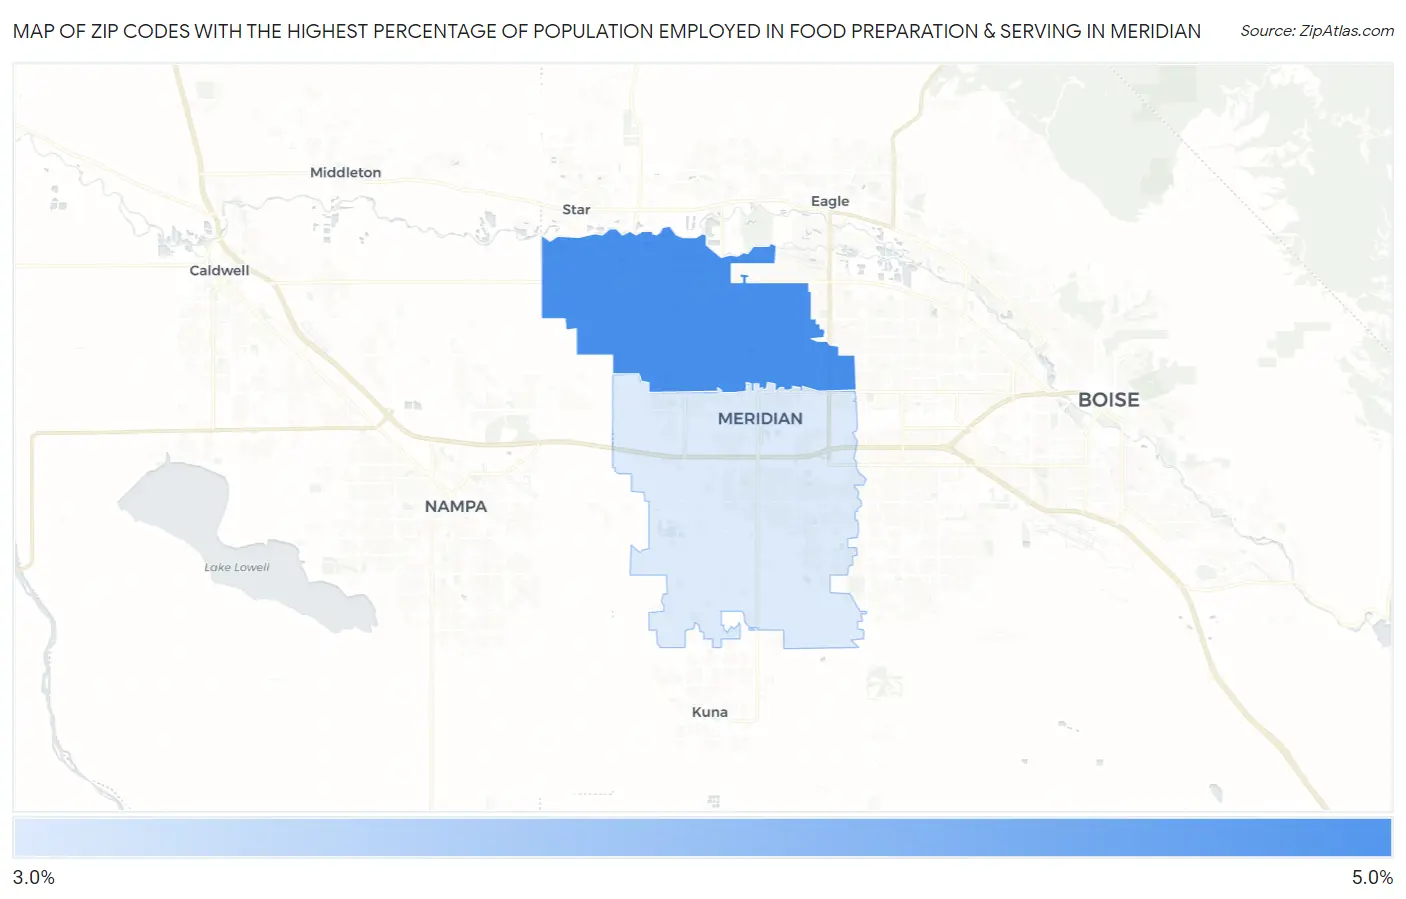
Zip Codes with the Highest Percentage of Population Employed in Food Preparation & Serving in Meridian, ID
RELATED REPORTS & OPTIONS
Food Preparation & Serving
Meridian
Compare Zip Codes
Map of Zip Codes with the Highest Percentage of Population Employed in Food Preparation & Serving in Meridian
3.7%
4.0%
Zip Codes with the Highest Percentage of Population Employed in Food Preparation & Serving in Meridian, ID
| Zip Code | % Employed | vs State | vs National | |
| 1. | 83646 | 4.0% | 5.7%(-1.64)#137 | 5.3%(-1.25)#16,991 |
| 2. | 83642 | 3.7% | 5.7%(-1.97)#143 | 5.3%(-1.58)#18,344 |
1
Common Questions
What are the Top Zip Codes with the Highest Percentage of Population Employed in Food Preparation & Serving in Meridian, ID?
Top Zip Codes with the Highest Percentage of Population Employed in Food Preparation & Serving in Meridian, ID are:
What zip code has the Highest Percentage of Population Employed in Food Preparation & Serving in Meridian, ID?
83646 has the Highest Percentage of Population Employed in Food Preparation & Serving in Meridian, ID with 4.0%.
What is the Percentage of Population Employed in Food Preparation & Serving in Meridian, ID?
Percentage of Population Employed in Food Preparation & Serving in Meridian is 4.0%.
What is the Percentage of Population Employed in Food Preparation & Serving in Idaho?
Percentage of Population Employed in Food Preparation & Serving in Idaho is 5.7%.
What is the Percentage of Population Employed in Food Preparation & Serving in the United States?
Percentage of Population Employed in Food Preparation & Serving in the United States is 5.3%.