Plummer, ID Map & Demographics
Plummer Map
Plummer Overview
$23,744
PER CAPITA INCOME
$56,042
AVG FAMILY INCOME
$50,227
AVG HOUSEHOLD INCOME
17.5%
WAGE / INCOME GAP [ % ]
82.5¢/ $1
WAGE / INCOME GAP [ $ ]
$10,312
FAMILY INCOME DEFICIT
0.40
INEQUALITY / GINI INDEX
1,158
TOTAL POPULATION
610
MALE POPULATION
548
FEMALE POPULATION
111.31
MALES / 100 FEMALES
89.84
FEMALES / 100 MALES
33.8
MEDIAN AGE
3.7
AVG FAMILY SIZE
2.9
AVG HOUSEHOLD SIZE
564
LABOR FORCE [ PEOPLE ]
62.0%
PERCENT IN LABOR FORCE
4.3%
UNEMPLOYMENT RATE
Plummer Zip Codes
Plummer Area Codes
Income in Plummer
Income Overview in Plummer
Per Capita Income in Plummer is $23,744, while median incomes of families and households are $56,042 and $50,227 respectively.
| Characteristic | Number | Measure |
| Per Capita Income | 1,158 | $23,744 |
| Median Family Income | 251 | $56,042 |
| Mean Family Income | 251 | $68,180 |
| Median Household Income | 398 | $50,227 |
| Mean Household Income | 398 | $62,270 |
| Income Deficit | 251 | $10,312 |
| Wage / Income Gap (%) | 1,158 | 17.49% |
| Wage / Income Gap ($) | 1,158 | 82.51¢ per $1 |
| Gini / Inequality Index | 1,158 | 0.40 |
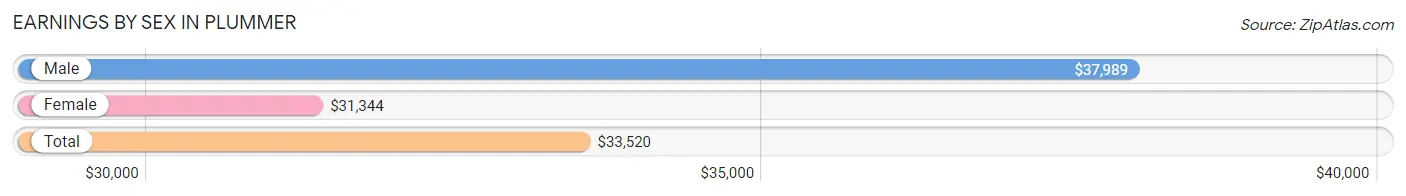
Earnings by Sex in Plummer
Average Earnings in Plummer are $33,520, $37,989 for men and $31,344 for women, a difference of 17.5%.
| Sex | Number | Average Earnings |
| Male | 285 (48.6%) | $37,989 |
| Female | 301 (51.4%) | $31,344 |
| Total | 586 (100.0%) | $33,520 |
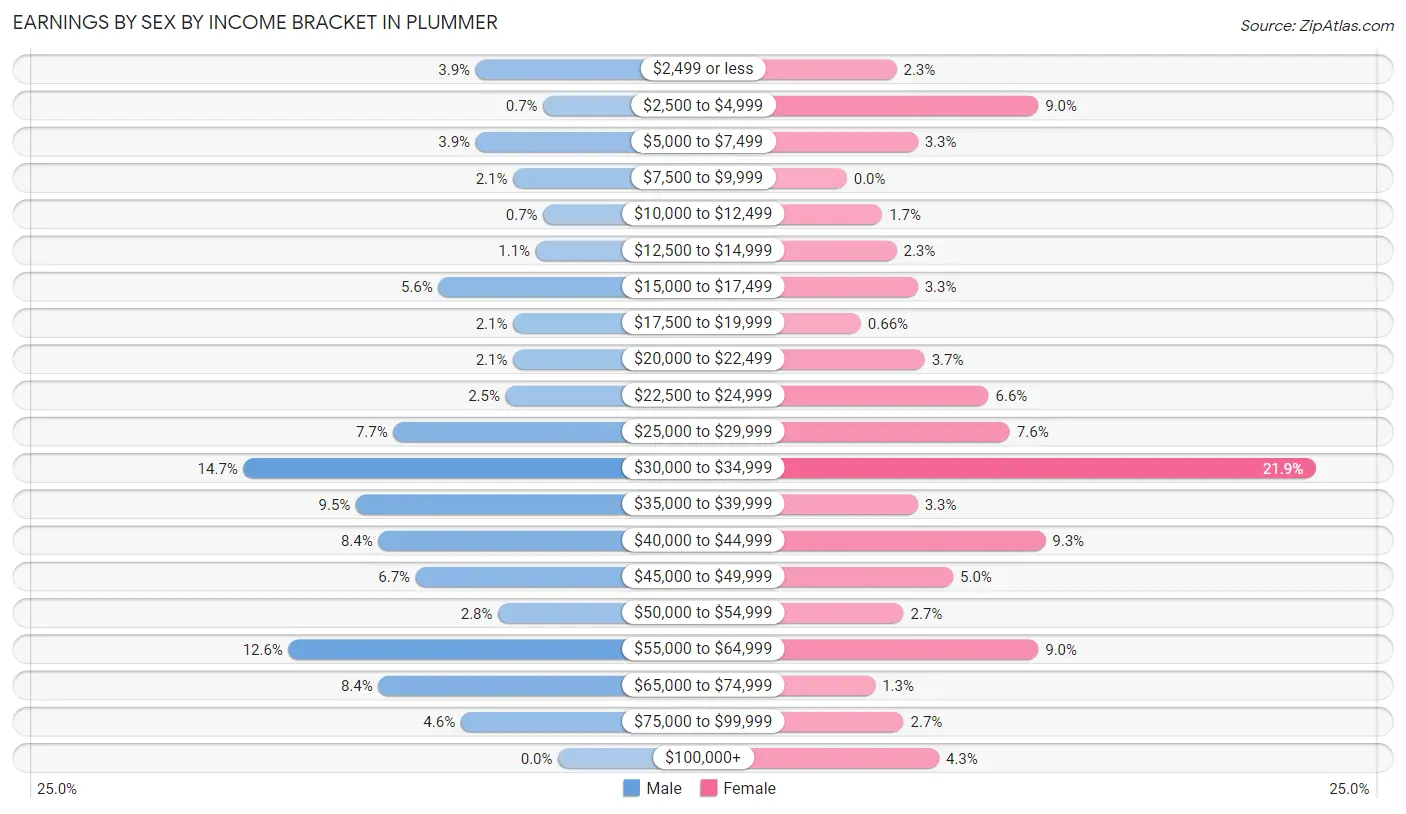
Earnings by Sex by Income Bracket in Plummer
The most common earnings brackets in Plummer are $30,000 to $34,999 for men (42 | 14.7%) and $30,000 to $34,999 for women (66 | 21.9%).
| Income | Male | Female |
| $2,499 or less | 11 (3.9%) | 7 (2.3%) |
| $2,500 to $4,999 | 2 (0.7%) | 27 (9.0%) |
| $5,000 to $7,499 | 11 (3.9%) | 10 (3.3%) |
| $7,500 to $9,999 | 6 (2.1%) | 0 (0.0%) |
| $10,000 to $12,499 | 2 (0.7%) | 5 (1.7%) |
| $12,500 to $14,999 | 3 (1.1%) | 7 (2.3%) |
| $15,000 to $17,499 | 16 (5.6%) | 10 (3.3%) |
| $17,500 to $19,999 | 6 (2.1%) | 2 (0.7%) |
| $20,000 to $22,499 | 6 (2.1%) | 11 (3.6%) |
| $22,500 to $24,999 | 7 (2.5%) | 20 (6.6%) |
| $25,000 to $29,999 | 22 (7.7%) | 23 (7.6%) |
| $30,000 to $34,999 | 42 (14.7%) | 66 (21.9%) |
| $35,000 to $39,999 | 27 (9.5%) | 10 (3.3%) |
| $40,000 to $44,999 | 24 (8.4%) | 28 (9.3%) |
| $45,000 to $49,999 | 19 (6.7%) | 15 (5.0%) |
| $50,000 to $54,999 | 8 (2.8%) | 8 (2.7%) |
| $55,000 to $64,999 | 36 (12.6%) | 27 (9.0%) |
| $65,000 to $74,999 | 24 (8.4%) | 4 (1.3%) |
| $75,000 to $99,999 | 13 (4.6%) | 8 (2.7%) |
| $100,000+ | 0 (0.0%) | 13 (4.3%) |
| Total | 285 (100.0%) | 301 (100.0%) |
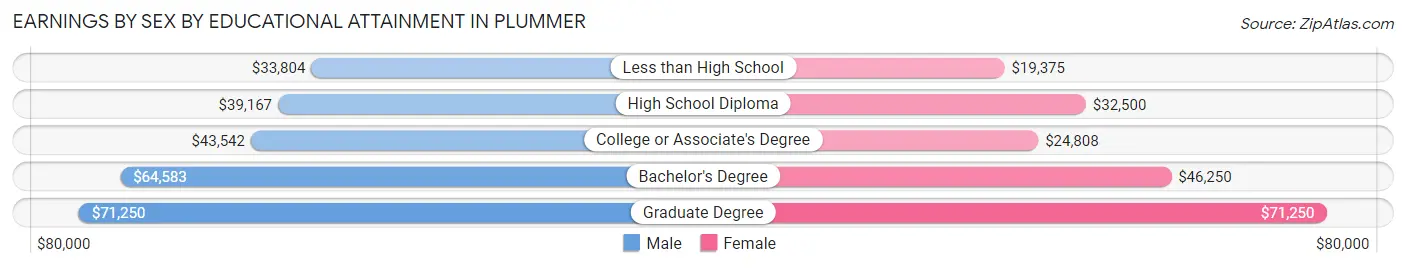
Earnings by Sex by Educational Attainment in Plummer
Average earnings in Plummer are $39,750 for men and $35,417 for women, a difference of 10.9%. Men with an educational attainment of graduate degree enjoy the highest average annual earnings of $71,250, while those with less than high school education earn the least with $33,804. Women with an educational attainment of graduate degree earn the most with the average annual earnings of $71,250, while those with less than high school education have the smallest earnings of $19,375.
| Educational Attainment | Male Income | Female Income |
| Less than High School | $33,804 | $19,375 |
| High School Diploma | $39,167 | $32,500 |
| College or Associate's Degree | $43,542 | $24,808 |
| Bachelor's Degree | $64,583 | $46,250 |
| Graduate Degree | $71,250 | $71,250 |
| Total | $39,750 | $35,417 |
Family Income in Plummer
Family Income Brackets in Plummer
According to the Plummer family income data, there are 59 families falling into the $50,000 to $74,999 income range, which is the most common income bracket and makes up 23.5% of all families. Conversely, the $10,000 to $14,999 income bracket is the least frequent group with only 3 families (1.2%) belonging to this category.
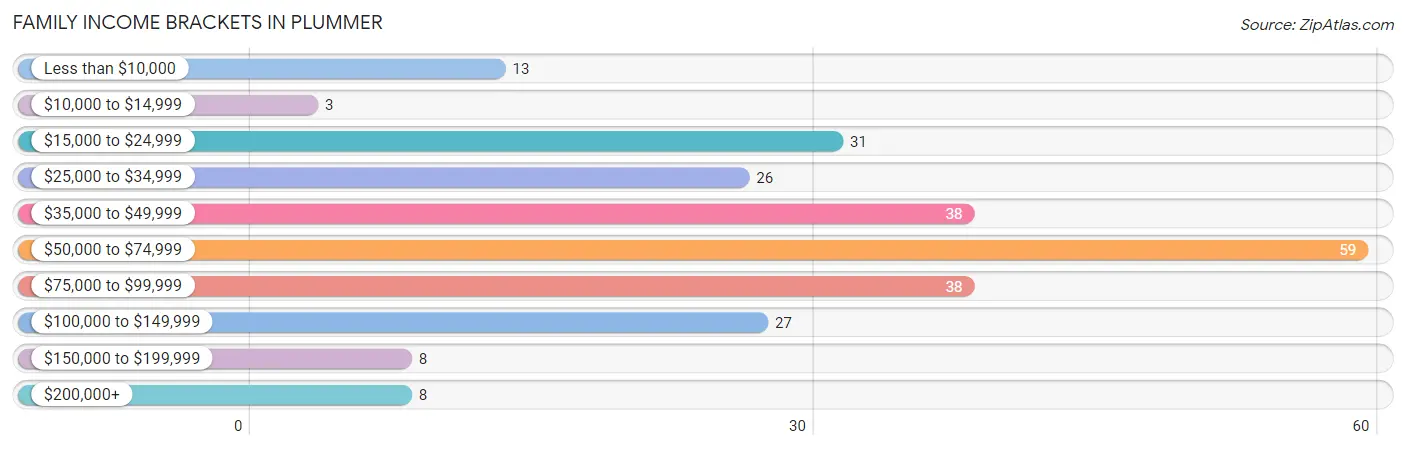
| Income Bracket | # Families | % Families |
| Less than $10,000 | 13 | 5.2% |
| $10,000 to $14,999 | 3 | 1.2% |
| $15,000 to $24,999 | 31 | 12.4% |
| $25,000 to $34,999 | 26 | 10.4% |
| $35,000 to $49,999 | 38 | 15.1% |
| $50,000 to $74,999 | 59 | 23.5% |
| $75,000 to $99,999 | 38 | 15.1% |
| $100,000 to $149,999 | 27 | 10.8% |
| $150,000 to $199,999 | 8 | 3.2% |
| $200,000+ | 8 | 3.2% |
Family Income by Famaliy Size in Plummer
3-person families (32 | 12.8%) account for the highest median family income in Plummer with $73,750 per family, while 2-person families (118 | 47.0%) have the highest median income of $27,032 per family member.
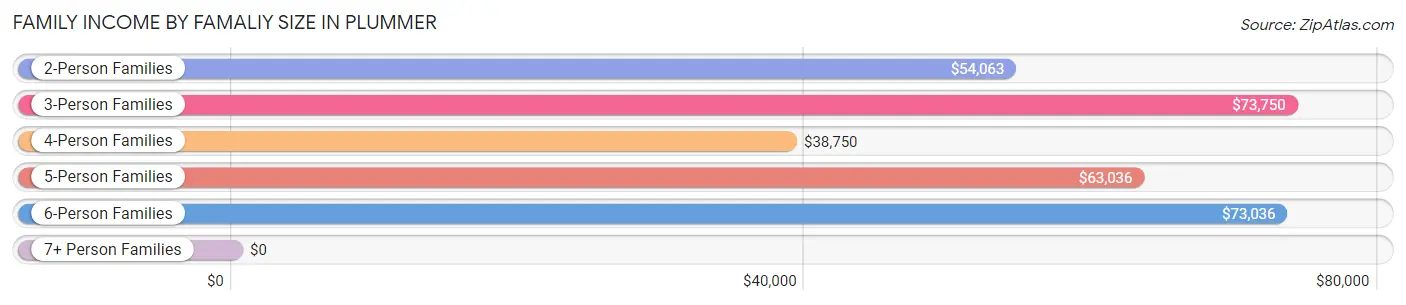
| Income Bracket | # Families | Median Income |
| 2-Person Families | 118 (47.0%) | $54,063 |
| 3-Person Families | 32 (12.8%) | $73,750 |
| 4-Person Families | 40 (15.9%) | $38,750 |
| 5-Person Families | 41 (16.3%) | $63,036 |
| 6-Person Families | 11 (4.4%) | $73,036 |
| 7+ Person Families | 9 (3.6%) | $0 |
| Total | 251 (100.0%) | $56,042 |
Family Income by Number of Earners in Plummer
The median family income in Plummer is $56,042, with families comprising 3+ earners (21) having the highest median family income of $120,313, while families with no earners (42) have the lowest median family income of $21,667, accounting for 8.4% and 16.7% of families, respectively.
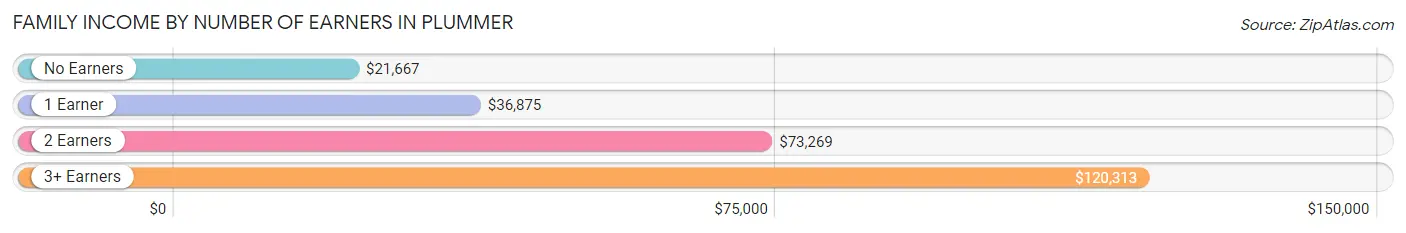
| Number of Earners | # Families | Median Income |
| No Earners | 42 (16.7%) | $21,667 |
| 1 Earner | 84 (33.5%) | $36,875 |
| 2 Earners | 104 (41.4%) | $73,269 |
| 3+ Earners | 21 (8.4%) | $120,313 |
| Total | 251 (100.0%) | $56,042 |
Household Income in Plummer
Household Income Brackets in Plummer
With 86 households falling in the category, the $50,000 to $74,999 income range is the most frequent in Plummer, accounting for 21.6% of all households. In contrast, only 10 households (2.5%) fall into the $200,000+ income bracket, making it the least populous group.
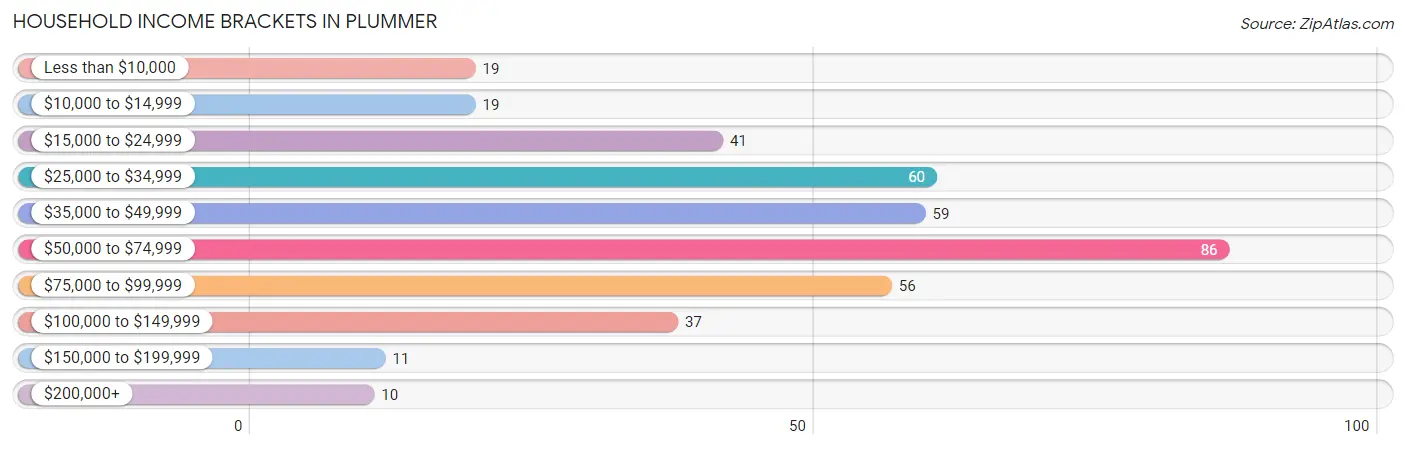
| Income Bracket | # Households | % Households |
| Less than $10,000 | 19 | 4.8% |
| $10,000 to $14,999 | 19 | 4.8% |
| $15,000 to $24,999 | 41 | 10.3% |
| $25,000 to $34,999 | 60 | 15.1% |
| $35,000 to $49,999 | 59 | 14.8% |
| $50,000 to $74,999 | 86 | 21.6% |
| $75,000 to $99,999 | 56 | 14.1% |
| $100,000 to $149,999 | 37 | 9.3% |
| $150,000 to $199,999 | 11 | 2.8% |
| $200,000+ | 10 | 2.5% |
Household Income by Householder Age in Plummer
The median household income in Plummer is $50,227, with the highest median household income of $51,528 found in the 45 to 64 years age bracket for the primary householder. A total of 195 households (49.0%) fall into this category. Meanwhile, the 65+ years age bracket for the primary householder has the lowest median household income of $46,875, with 69 households (17.3%) in this group.
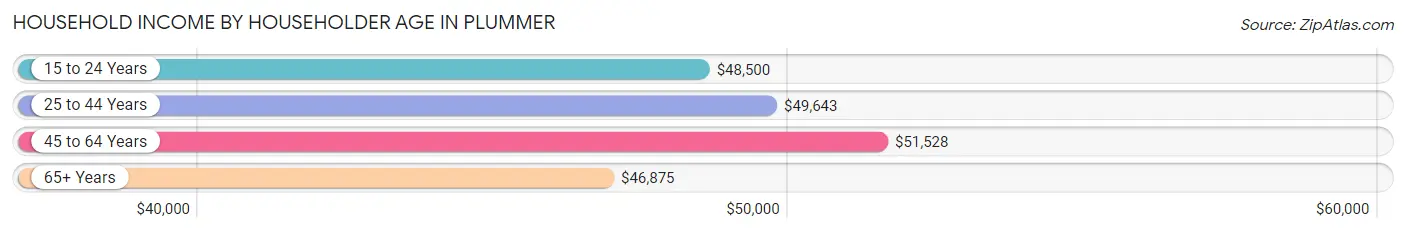
| Income Bracket | # Households | Median Income |
| 15 to 24 Years | 16 (4.0%) | $48,500 |
| 25 to 44 Years | 118 (29.6%) | $49,643 |
| 45 to 64 Years | 195 (49.0%) | $51,528 |
| 65+ Years | 69 (17.3%) | $46,875 |
| Total | 398 (100.0%) | $50,227 |
Poverty in Plummer
Income Below Poverty by Sex and Age in Plummer
With 16.6% poverty level for males and 14.5% for females among the residents of Plummer, 15 year old males and 15 year old females are the most vulnerable to poverty, with 2 males (50.0%) and 3 females (50.0%) in their respective age groups living below the poverty level.
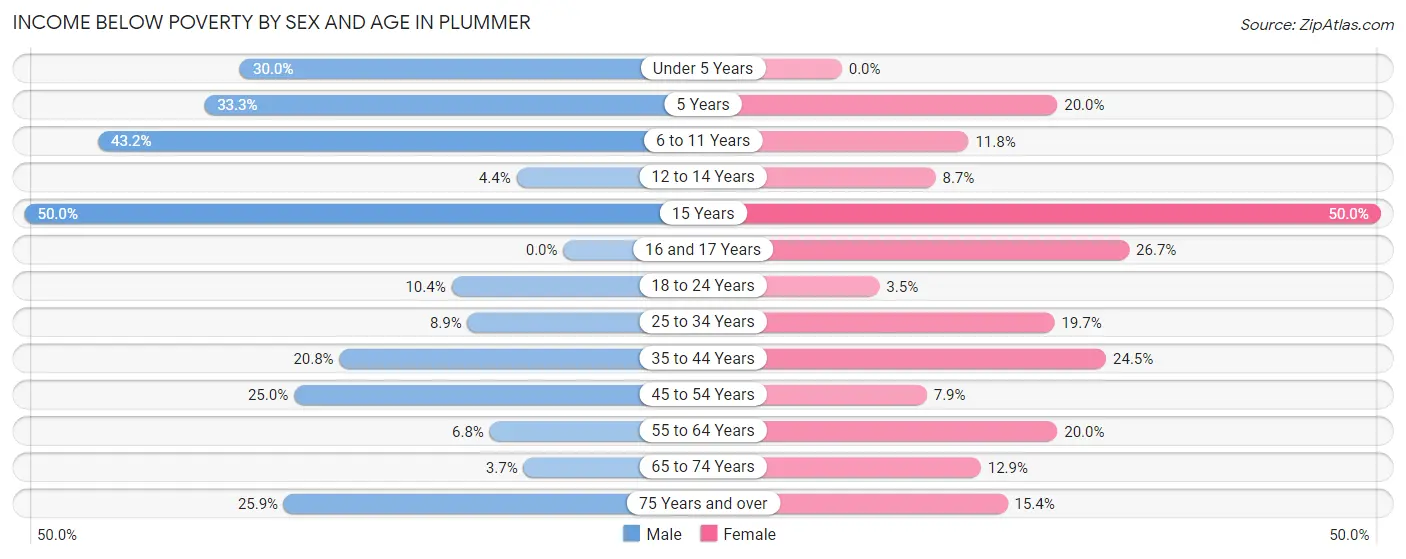
| Age Bracket | Male | Female |
| Under 5 Years | 9 (30.0%) | 0 (0.0%) |
| 5 Years | 2 (33.3%) | 1 (20.0%) |
| 6 to 11 Years | 19 (43.2%) | 6 (11.8%) |
| 12 to 14 Years | 1 (4.3%) | 4 (8.7%) |
| 15 Years | 2 (50.0%) | 3 (50.0%) |
| 16 and 17 Years | 0 (0.0%) | 4 (26.7%) |
| 18 to 24 Years | 11 (10.4%) | 3 (3.5%) |
| 25 to 34 Years | 4 (8.9%) | 15 (19.7%) |
| 35 to 44 Years | 16 (20.8%) | 13 (24.5%) |
| 45 to 54 Years | 19 (25.0%) | 3 (7.9%) |
| 55 to 64 Years | 8 (6.8%) | 21 (20.0%) |
| 65 to 74 Years | 1 (3.7%) | 4 (12.9%) |
| 75 Years and over | 7 (25.9%) | 2 (15.4%) |
| Total | 99 (16.6%) | 79 (14.5%) |
Income Above Poverty by Sex and Age in Plummer
According to the poverty statistics in Plummer, males aged 16 and 17 years and females aged under 5 years are the age groups that are most secure financially, with 100.0% of males and 100.0% of females in these age groups living above the poverty line.
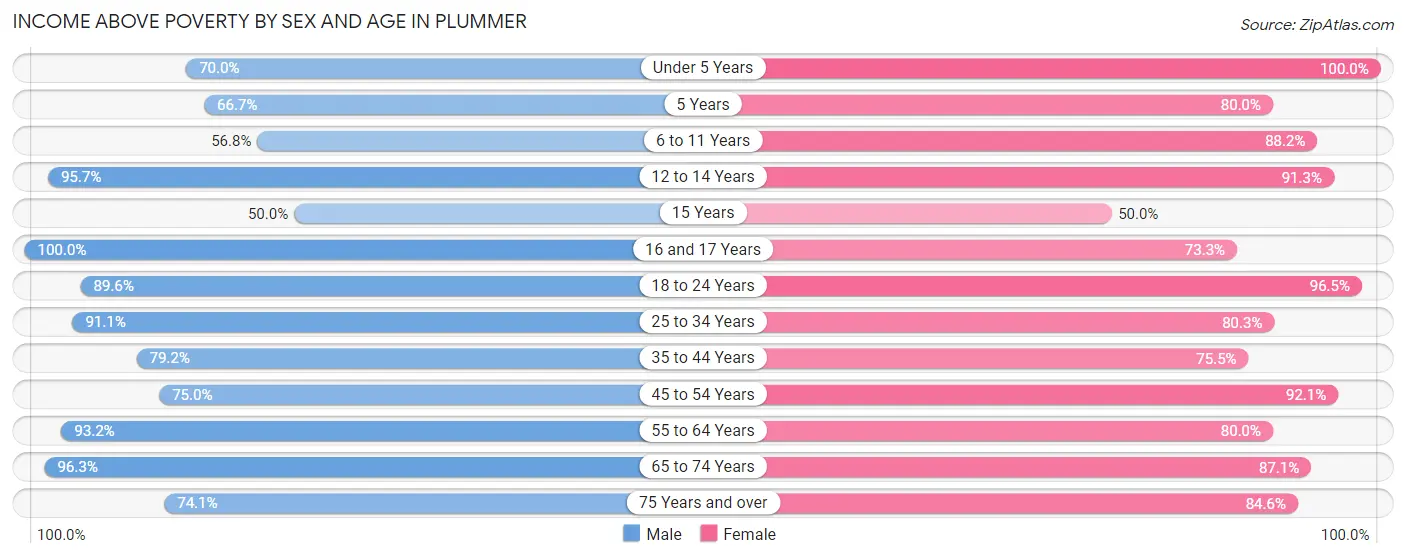
| Age Bracket | Male | Female |
| Under 5 Years | 21 (70.0%) | 18 (100.0%) |
| 5 Years | 4 (66.7%) | 4 (80.0%) |
| 6 to 11 Years | 25 (56.8%) | 45 (88.2%) |
| 12 to 14 Years | 22 (95.7%) | 42 (91.3%) |
| 15 Years | 2 (50.0%) | 3 (50.0%) |
| 16 and 17 Years | 15 (100.0%) | 11 (73.3%) |
| 18 to 24 Years | 95 (89.6%) | 83 (96.5%) |
| 25 to 34 Years | 41 (91.1%) | 61 (80.3%) |
| 35 to 44 Years | 61 (79.2%) | 40 (75.5%) |
| 45 to 54 Years | 57 (75.0%) | 35 (92.1%) |
| 55 to 64 Years | 109 (93.2%) | 84 (80.0%) |
| 65 to 74 Years | 26 (96.3%) | 27 (87.1%) |
| 75 Years and over | 20 (74.1%) | 11 (84.6%) |
| Total | 498 (83.4%) | 464 (85.5%) |
Income Below Poverty Among Married-Couple Families in Plummer
The poverty statistics for married-couple families in Plummer show that 9.9% or 16 of the total 162 families live below the poverty line. Families with 1 or 2 children have the highest poverty rate of 29.6%, comprising of 8 families. On the other hand, families with 5 or more children have the lowest poverty rate of 0.0%, which includes 0 families.
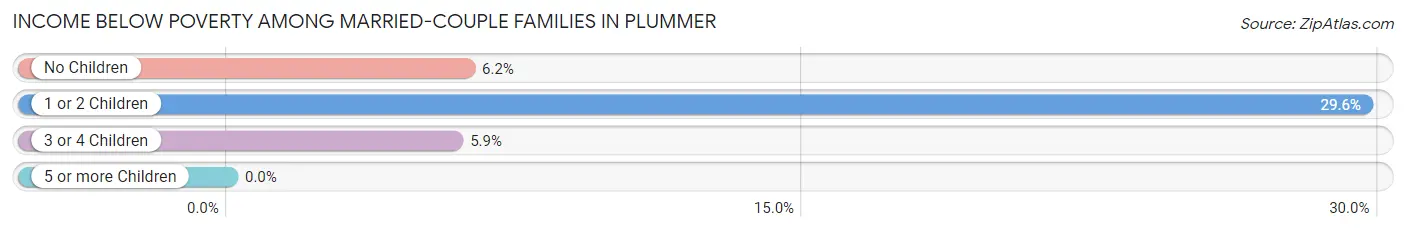
| Children | Above Poverty | Below Poverty |
| No Children | 91 (93.8%) | 6 (6.2%) |
| 1 or 2 Children | 19 (70.4%) | 8 (29.6%) |
| 3 or 4 Children | 32 (94.1%) | 2 (5.9%) |
| 5 or more Children | 4 (100.0%) | 0 (0.0%) |
| Total | 146 (90.1%) | 16 (9.9%) |
Income Below Poverty Among Single-Parent Households in Plummer
According to the poverty data in Plummer, 43.8% or 14 single-father households and 21.0% or 12 single-mother households are living below the poverty line. Among single-father households, those with 1 or 2 children have the highest poverty rate, with 2 households (50.0%) experiencing poverty. Likewise, among single-mother households, those with 5 or more children have the highest poverty rate, with 3 households (100.0%) falling below the poverty line.
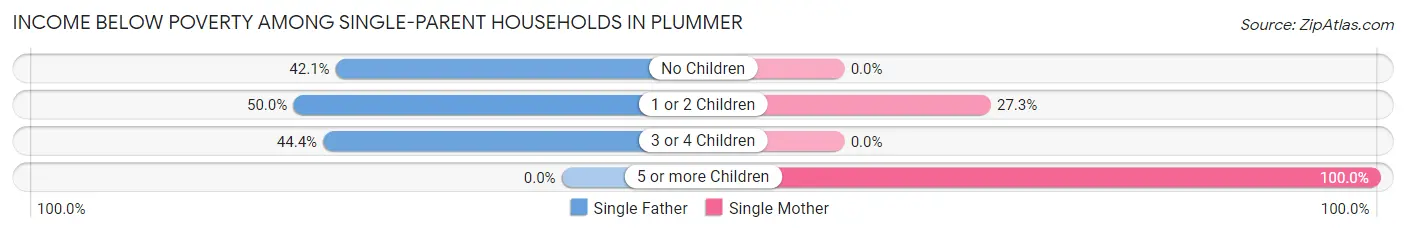
| Children | Single Father | Single Mother |
| No Children | 8 (42.1%) | 0 (0.0%) |
| 1 or 2 Children | 2 (50.0%) | 9 (27.3%) |
| 3 or 4 Children | 4 (44.4%) | 0 (0.0%) |
| 5 or more Children | 0 (0.0%) | 3 (100.0%) |
| Total | 14 (43.8%) | 12 (21.0%) |
Income Below Poverty Among Married-Couple vs Single-Parent Households in Plummer
The poverty data for Plummer shows that 16 of the married-couple family households (9.9%) and 26 of the single-parent households (29.2%) are living below the poverty level. Within the married-couple family households, those with 1 or 2 children have the highest poverty rate, with 8 households (29.6%) falling below the poverty line. Among the single-parent households, those with 5 or more children have the highest poverty rate, with 3 household (100.0%) living below poverty.
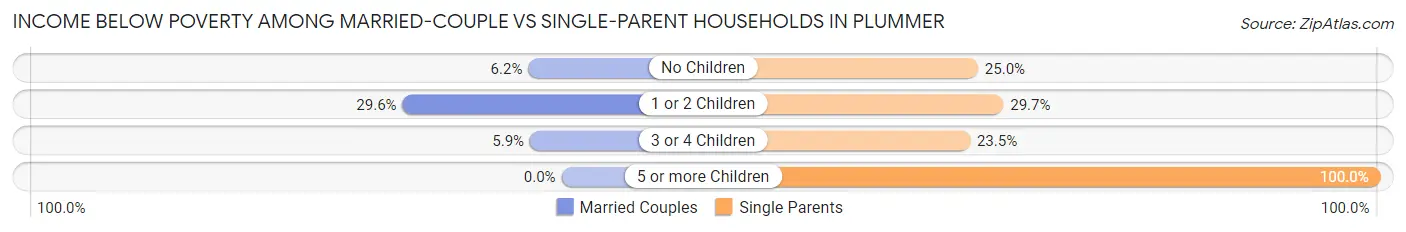
| Children | Married-Couple Families | Single-Parent Households |
| No Children | 6 (6.2%) | 8 (25.0%) |
| 1 or 2 Children | 8 (29.6%) | 11 (29.7%) |
| 3 or 4 Children | 2 (5.9%) | 4 (23.5%) |
| 5 or more Children | 0 (0.0%) | 3 (100.0%) |
| Total | 16 (9.9%) | 26 (29.2%) |
Race in Plummer
The most populous races in Plummer are White / Caucasian (531 | 45.9%), Native / Alaskan (446 | 38.5%), and Hispanic or Latino (118 | 10.2%).
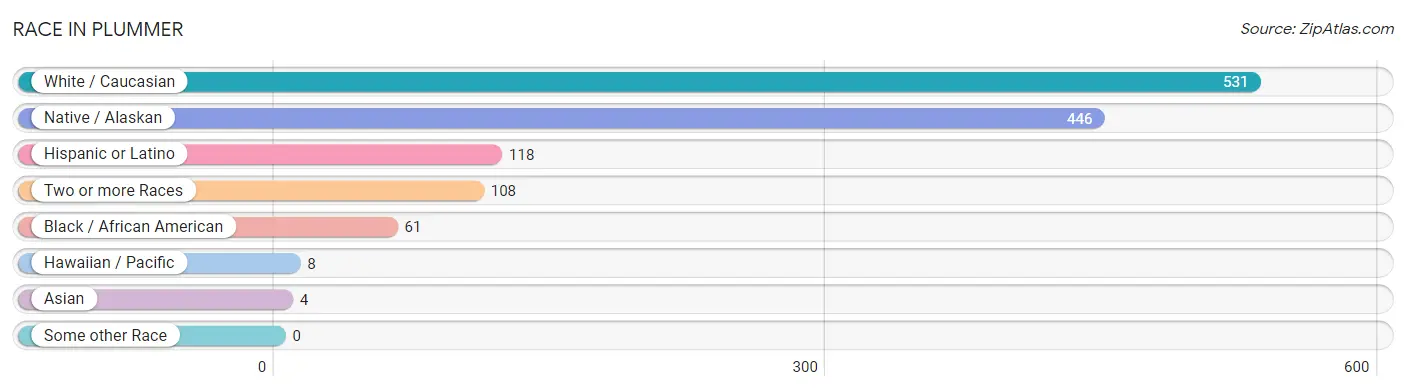
| Race | # Population | % Population |
| Asian | 4 | 0.4% |
| Black / African American | 61 | 5.3% |
| Hawaiian / Pacific | 8 | 0.7% |
| Hispanic or Latino | 118 | 10.2% |
| Native / Alaskan | 446 | 38.5% |
| White / Caucasian | 531 | 45.9% |
| Two or more Races | 108 | 9.3% |
| Some other Race | 0 | 0.0% |
| Total | 1,158 | 100.0% |
Ancestry in Plummer
The most populous ancestries reported in Plummer are German (143 | 12.3%), Mexican (112 | 9.7%), English (73 | 6.3%), Scottish (51 | 4.4%), and Irish (45 | 3.9%), together accounting for 36.6% of all Plummer residents.
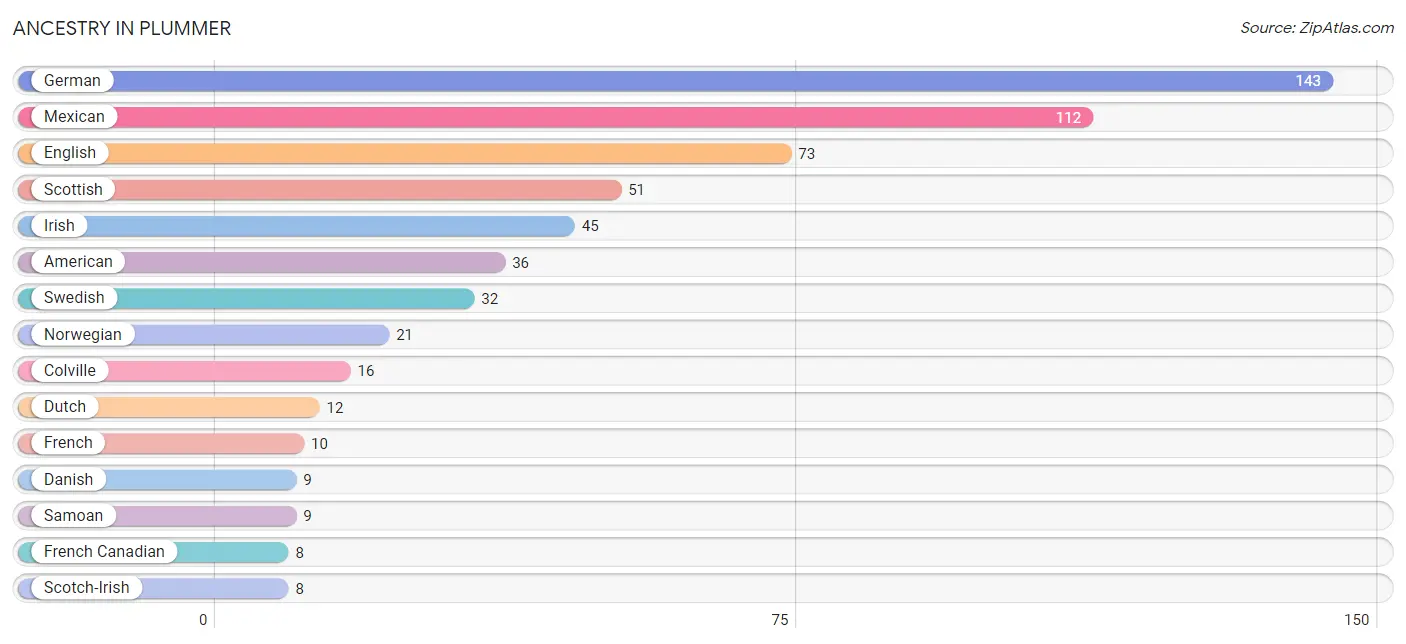
| Ancestry | # Population | % Population |
| American | 36 | 3.1% |
| Burmese | 3 | 0.3% |
| Celtic | 1 | 0.1% |
| Cherokee | 5 | 0.4% |
| Choctaw | 2 | 0.2% |
| Colville | 16 | 1.4% |
| Czech | 4 | 0.4% |
| Danish | 9 | 0.8% |
| Dutch | 12 | 1.0% |
| English | 73 | 6.3% |
| European | 4 | 0.4% |
| French | 10 | 0.9% |
| French Canadian | 8 | 0.7% |
| German | 143 | 12.3% |
| Irish | 45 | 3.9% |
| Italian | 2 | 0.2% |
| Mexican | 112 | 9.7% |
| Native Hawaiian | 5 | 0.4% |
| Norwegian | 21 | 1.8% |
| Pakistani | 3 | 0.3% |
| Portuguese | 2 | 0.2% |
| Puerto Rican | 6 | 0.5% |
| Samoan | 9 | 0.8% |
| Scotch-Irish | 8 | 0.7% |
| Scottish | 51 | 4.4% |
| Shoshone | 4 | 0.4% |
| Sioux | 7 | 0.6% |
| Swedish | 32 | 2.8% |
| Tlingit-Haida | 3 | 0.3% |
| Tsimshian | 5 | 0.4% |
| Ute | 1 | 0.1% |
| Welsh | 7 | 0.6% |
| Yup'ik | 4 | 0.4% | View All 33 Rows |
Immigrants in Plummer
The most numerous immigrant groups reported in Plummer came from Oceania (3 | 0.3%), Europe (2 | 0.2%), Northern Europe (2 | 0.2%), Asia (1 | 0.1%), and Eastern Asia (1 | 0.1%), together accounting for 0.8% of all Plummer residents.
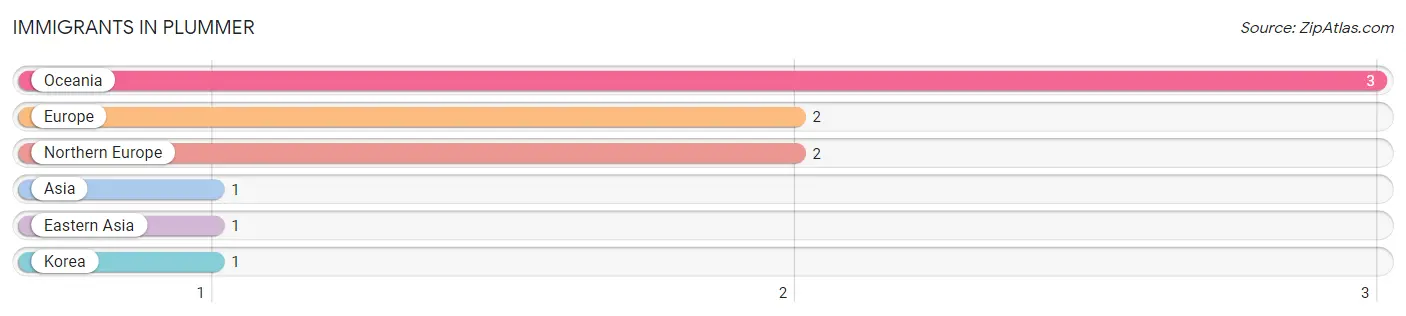
| Immigration Origin | # Population | % Population |
| Asia | 1 | 0.1% |
| Eastern Asia | 1 | 0.1% |
| Europe | 2 | 0.2% |
| Korea | 1 | 0.1% |
| Northern Europe | 2 | 0.2% |
| Oceania | 3 | 0.3% | View All 6 Rows |
Sex and Age in Plummer
Sex and Age in Plummer
The most populous age groups in Plummer are 15 to 19 Years (79 | 13.0%) for men and 20 to 24 Years (68 | 12.4%) for women.
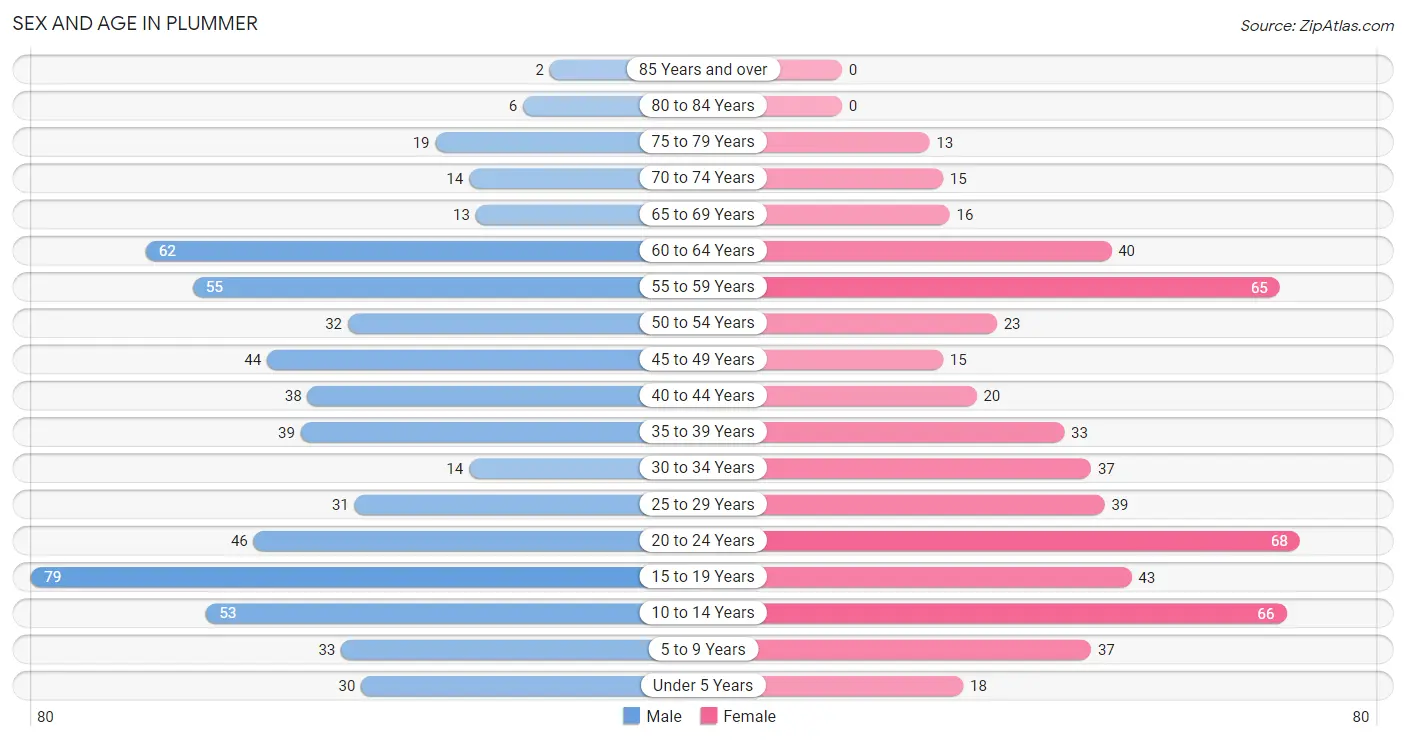
| Age Bracket | Male | Female |
| Under 5 Years | 30 (4.9%) | 18 (3.3%) |
| 5 to 9 Years | 33 (5.4%) | 37 (6.8%) |
| 10 to 14 Years | 53 (8.7%) | 66 (12.0%) |
| 15 to 19 Years | 79 (13.0%) | 43 (7.9%) |
| 20 to 24 Years | 46 (7.5%) | 68 (12.4%) |
| 25 to 29 Years | 31 (5.1%) | 39 (7.1%) |
| 30 to 34 Years | 14 (2.3%) | 37 (6.8%) |
| 35 to 39 Years | 39 (6.4%) | 33 (6.0%) |
| 40 to 44 Years | 38 (6.2%) | 20 (3.6%) |
| 45 to 49 Years | 44 (7.2%) | 15 (2.7%) |
| 50 to 54 Years | 32 (5.2%) | 23 (4.2%) |
| 55 to 59 Years | 55 (9.0%) | 65 (11.9%) |
| 60 to 64 Years | 62 (10.2%) | 40 (7.3%) |
| 65 to 69 Years | 13 (2.1%) | 16 (2.9%) |
| 70 to 74 Years | 14 (2.3%) | 15 (2.7%) |
| 75 to 79 Years | 19 (3.1%) | 13 (2.4%) |
| 80 to 84 Years | 6 (1.0%) | 0 (0.0%) |
| 85 Years and over | 2 (0.3%) | 0 (0.0%) |
| Total | 610 (100.0%) | 548 (100.0%) |
Families and Households in Plummer
Median Family Size in Plummer
The median family size in Plummer is 3.69 persons per family, with single female/mother families (57 | 22.7%) accounting for the largest median family size of 5.4 persons per family. On the other hand, married-couple families (162 | 64.5%) represent the smallest median family size with 3.19 persons per family.
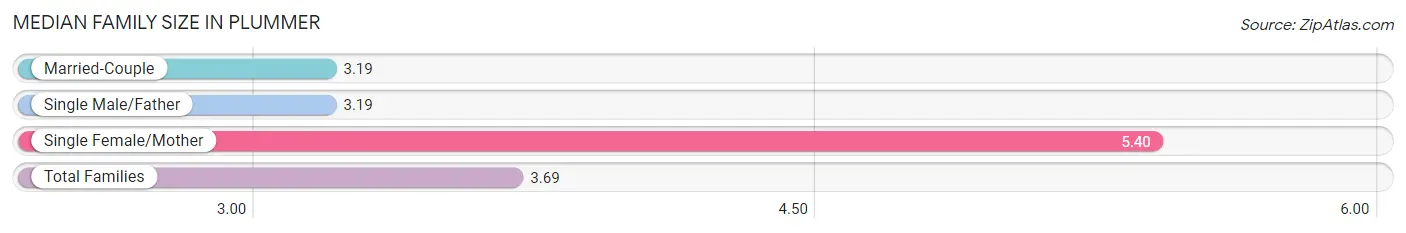
| Family Type | # Families | Family Size |
| Married-Couple | 162 (64.5%) | 3.19 |
| Single Male/Father | 32 (12.8%) | 3.19 |
| Single Female/Mother | 57 (22.7%) | 5.40 |
| Total Families | 251 (100.0%) | 3.69 |
Median Household Size in Plummer
The median household size in Plummer is 2.90 persons per household, with single female/mother households (57 | 14.3%) accounting for the largest median household size of 5.53 persons per household. non-family households (147 | 36.9%) represent the smallest median household size with 1.39 persons per household.
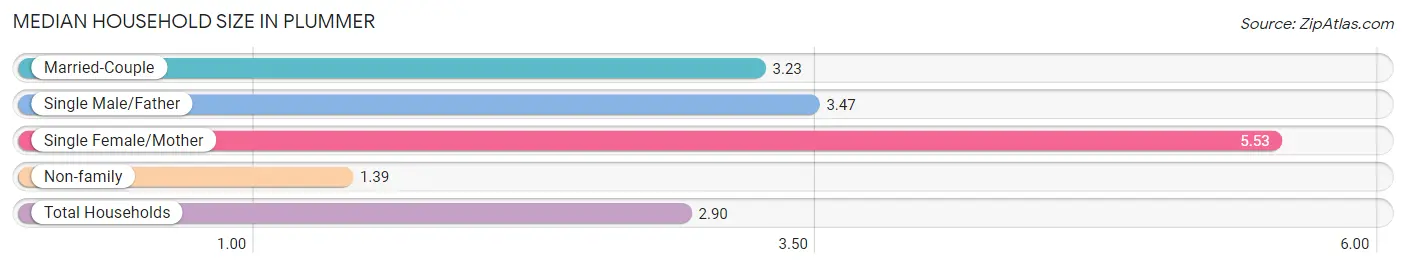
| Household Type | # Households | Household Size |
| Married-Couple | 162 (40.7%) | 3.23 |
| Single Male/Father | 32 (8.0%) | 3.47 |
| Single Female/Mother | 57 (14.3%) | 5.53 |
| Non-family | 147 (36.9%) | 1.39 |
| Total Households | 398 (100.0%) | 2.90 |
Household Size by Marriage Status in Plummer
Out of a total of 398 households in Plummer, 251 (63.1%) are family households, while 147 (36.9%) are nonfamily households. The most numerous type of family households are 2-person households, comprising 113, and the most common type of nonfamily households are 1-person households, comprising 119.
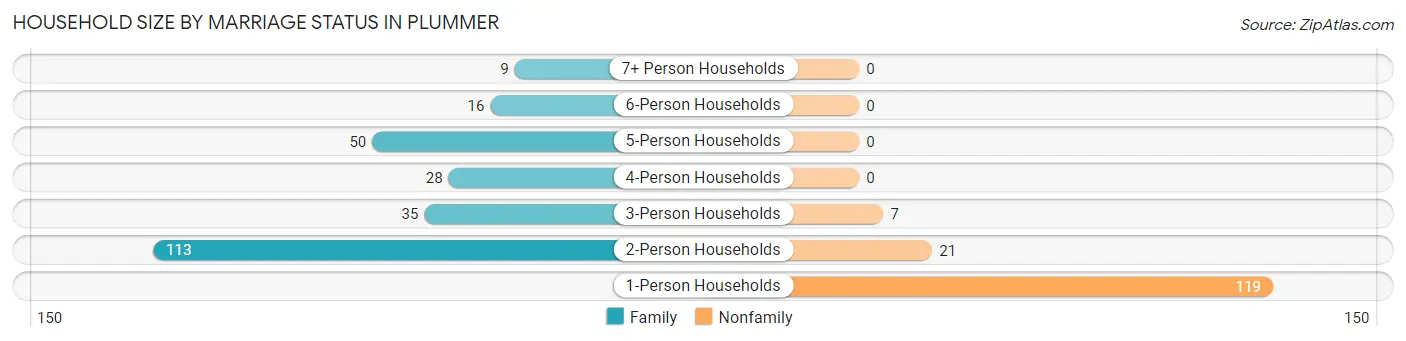
| Household Size | Family Households | Nonfamily Households |
| 1-Person Households | - | 119 (29.9%) |
| 2-Person Households | 113 (28.4%) | 21 (5.3%) |
| 3-Person Households | 35 (8.8%) | 7 (1.8%) |
| 4-Person Households | 28 (7.0%) | 0 (0.0%) |
| 5-Person Households | 50 (12.6%) | 0 (0.0%) |
| 6-Person Households | 16 (4.0%) | 0 (0.0%) |
| 7+ Person Households | 9 (2.3%) | 0 (0.0%) |
| Total | 251 (63.1%) | 147 (36.9%) |
Female Fertility in Plummer
Fertility by Age in Plummer
Average fertility rate in Plummer is 54.0 births per 1,000 women. Women in the age bracket of 20 to 34 years have the highest fertility rate with 97.0 births per 1,000 women. Women in the age bracket of 20 to 34 years acount for 100.0% of all women with births.
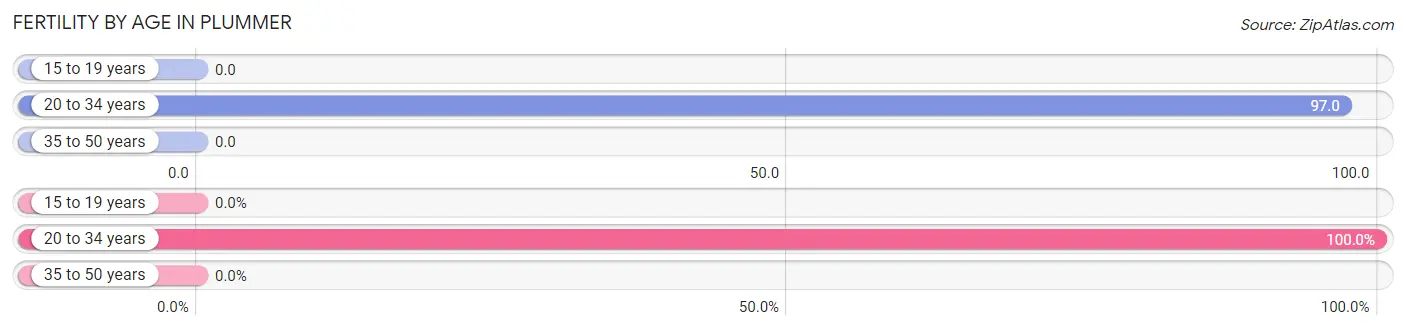
| Age Bracket | Women with Births | Births / 1,000 Women |
| 15 to 19 years | 0 (0.0%) | 0.0 |
| 20 to 34 years | 14 (100.0%) | 97.0 |
| 35 to 50 years | 0 (0.0%) | 0.0 |
| Total | 14 (100.0%) | 54.0 |
Fertility by Age by Marriage Status in Plummer
50.0% of women with births (14) in Plummer are married. The highest percentage of unmarried women with births falls into 20 to 34 years age bracket with 50.0% of them unmarried at the time of birth, while the lowest percentage of unmarried women with births belong to 20 to 34 years age bracket with 50.0% of them unmarried.
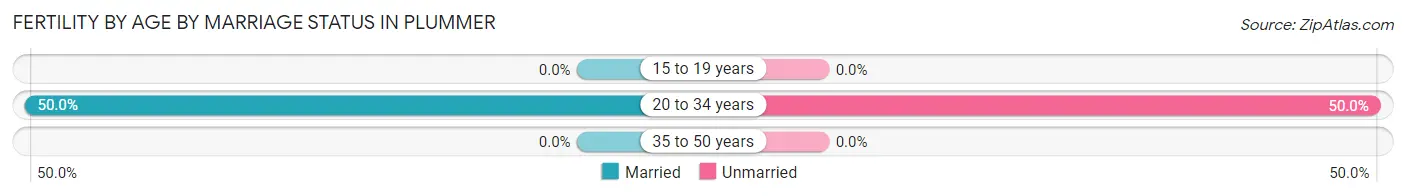
| Age Bracket | Married | Unmarried |
| 15 to 19 years | 0 (0.0%) | 0 (0.0%) |
| 20 to 34 years | 7 (50.0%) | 7 (50.0%) |
| 35 to 50 years | 0 (0.0%) | 0 (0.0%) |
| Total | 7 (50.0%) | 7 (50.0%) |
Fertility by Education in Plummer
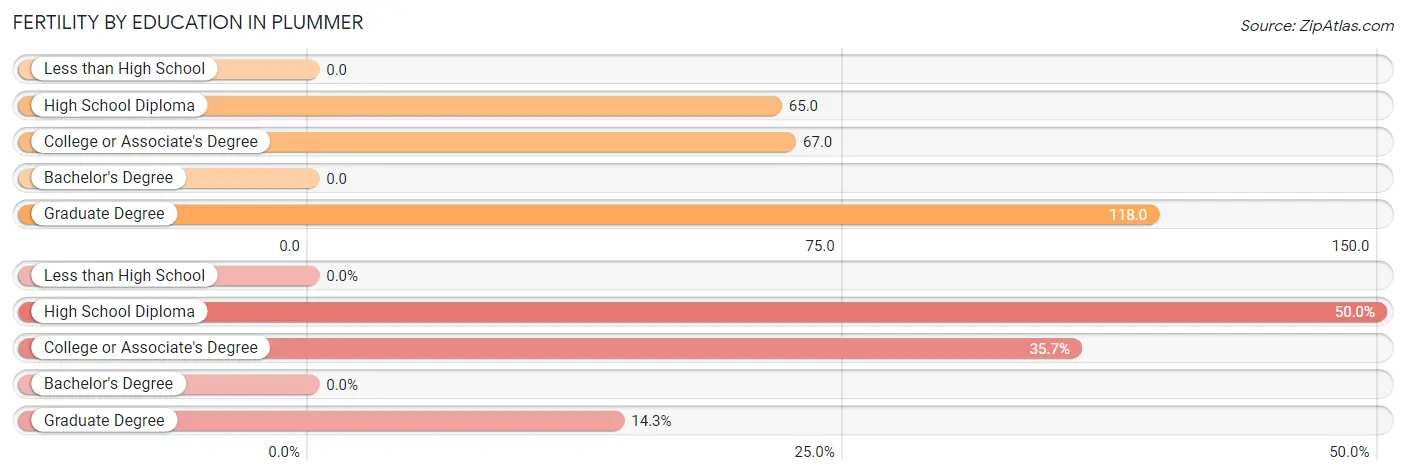
| Educational Attainment | Women with Births | Births / 1,000 Women |
| Less than High School | 0 (0.0%) | 0.0 |
| High School Diploma | 7 (50.0%) | 65.0 |
| College or Associate's Degree | 5 (35.7%) | 67.0 |
| Bachelor's Degree | 0 (0.0%) | 0.0 |
| Graduate Degree | 2 (14.3%) | 118.0 |
| Total | 14 (100.0%) | 54.0 |
Fertility by Education by Marriage Status in Plummer
50.0% of women with births in Plummer are unmarried. Women with the educational attainment of high school diploma are most likely to be married with 100.0% of them married at childbirth, while women with the educational attainment of college or associate's degree are least likely to be married with 100.0% of them unmarried at childbirth.
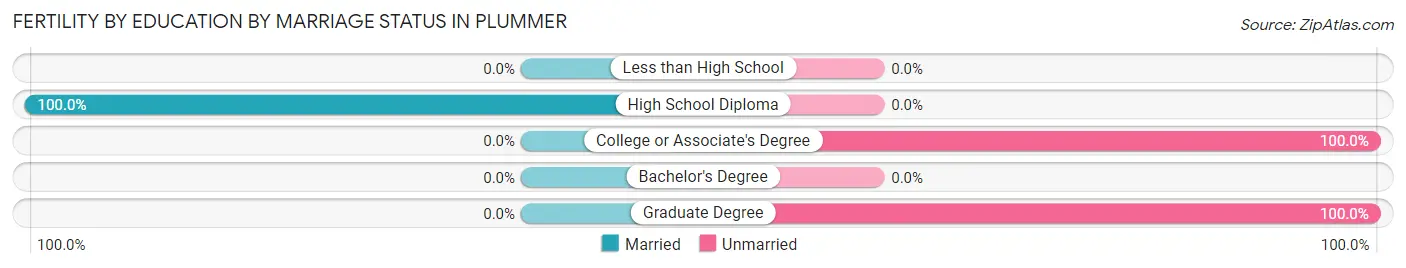
| Educational Attainment | Married | Unmarried |
| Less than High School | 0 (0.0%) | 0 (0.0%) |
| High School Diploma | 7 (100.0%) | 0 (0.0%) |
| College or Associate's Degree | 0 (0.0%) | 5 (100.0%) |
| Bachelor's Degree | 0 (0.0%) | 0 (0.0%) |
| Graduate Degree | 0 (0.0%) | 2 (100.0%) |
| Total | 7 (50.0%) | 7 (50.0%) |
Employment Characteristics in Plummer
Employment by Class of Employer in Plummer
Among the 535 employed individuals in Plummer, private company employees (278 | 52.0%), not-for-profit organizations (129 | 24.1%), and local government employees (62 | 11.6%) make up the most common classes of employment.
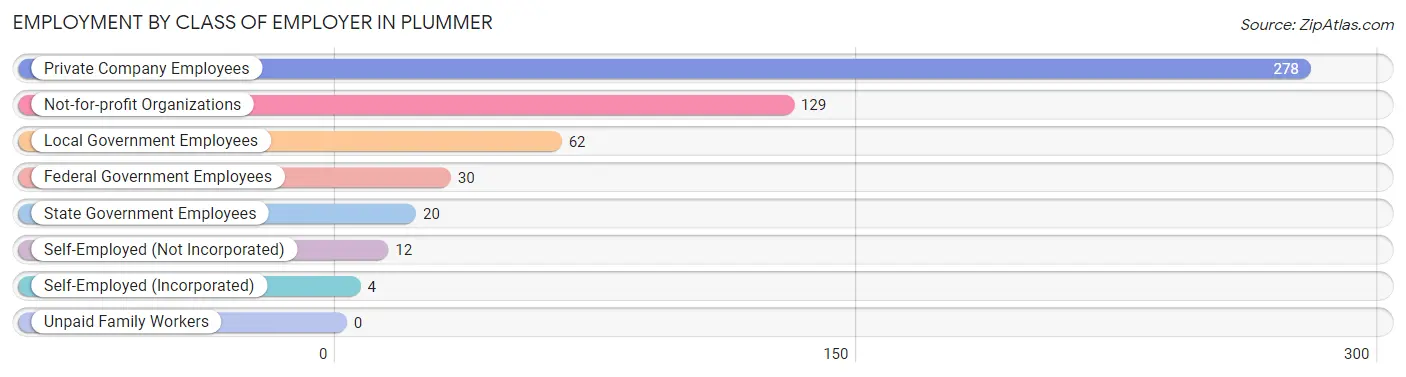
| Employer Class | # Employees | % Employees |
| Private Company Employees | 278 | 52.0% |
| Self-Employed (Incorporated) | 4 | 0.7% |
| Self-Employed (Not Incorporated) | 12 | 2.2% |
| Not-for-profit Organizations | 129 | 24.1% |
| Local Government Employees | 62 | 11.6% |
| State Government Employees | 20 | 3.7% |
| Federal Government Employees | 30 | 5.6% |
| Unpaid Family Workers | 0 | 0.0% |
| Total | 535 | 100.0% |
Employment Status by Age in Plummer
According to the labor force statistics for Plummer, out of the total population over 16 years of age (910), 62.0% or 564 individuals are in the labor force, with 4.3% or 24 of them unemployed. The age group with the highest labor force participation rate is 45 to 54 years, with 89.5% or 102 individuals in the labor force. Within the labor force, the 25 to 29 years age range has the highest percentage of unemployed individuals, with 10.0% or 3 of them being unemployed.
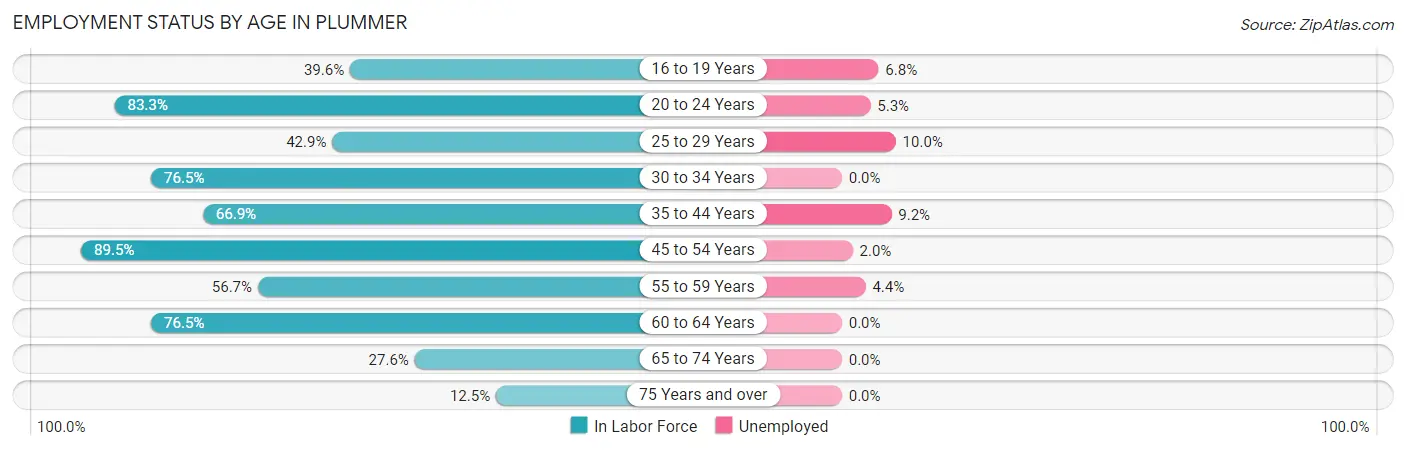
| Age Bracket | In Labor Force | Unemployed |
| 16 to 19 Years | 44 (39.6%) | 3 (6.8%) |
| 20 to 24 Years | 95 (83.3%) | 5 (5.3%) |
| 25 to 29 Years | 30 (42.9%) | 3 (10.0%) |
| 30 to 34 Years | 39 (76.5%) | 0 (0.0%) |
| 35 to 44 Years | 87 (66.9%) | 8 (9.2%) |
| 45 to 54 Years | 102 (89.5%) | 2 (2.0%) |
| 55 to 59 Years | 68 (56.7%) | 3 (4.4%) |
| 60 to 64 Years | 78 (76.5%) | 0 (0.0%) |
| 65 to 74 Years | 16 (27.6%) | 0 (0.0%) |
| 75 Years and over | 5 (12.5%) | 0 (0.0%) |
| Total | 564 (62.0%) | 24 (4.3%) |
Employment Status by Educational Attainment in Plummer
According to labor force statistics for Plummer, 68.8% of individuals (404) out of the total population between 25 and 64 years of age (587) are in the labor force, with 4.0% or 16 of them being unemployed. The group with the highest labor force participation rate are those with the educational attainment of bachelor's degree or higher, with 94.0% or 63 individuals in the labor force. Within the labor force, individuals with less than high school education have the highest percentage of unemployment, with 6.5% or 3 of them being unemployed.
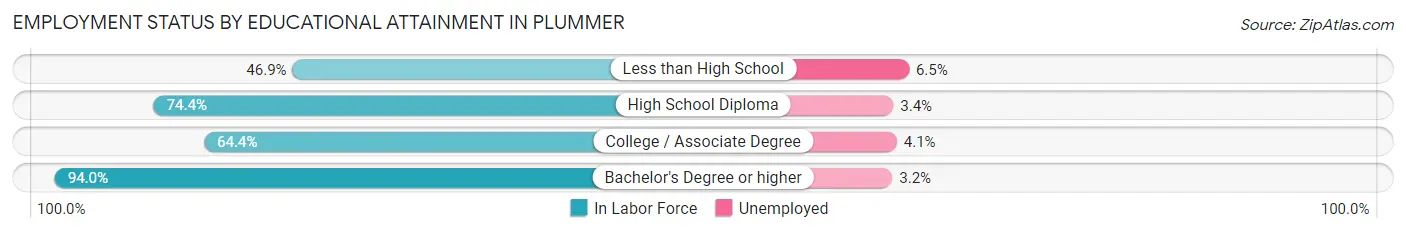
| Educational Attainment | In Labor Force | Unemployed |
| Less than High School | 46 (46.9%) | 6 (6.5%) |
| High School Diploma | 174 (74.4%) | 8 (3.4%) |
| College / Associate Degree | 121 (64.4%) | 8 (4.1%) |
| Bachelor's Degree or higher | 63 (94.0%) | 2 (3.2%) |
| Total | 404 (68.8%) | 23 (4.0%) |
Employment Occupations by Sex in Plummer
Management, Business, Science and Arts Occupations
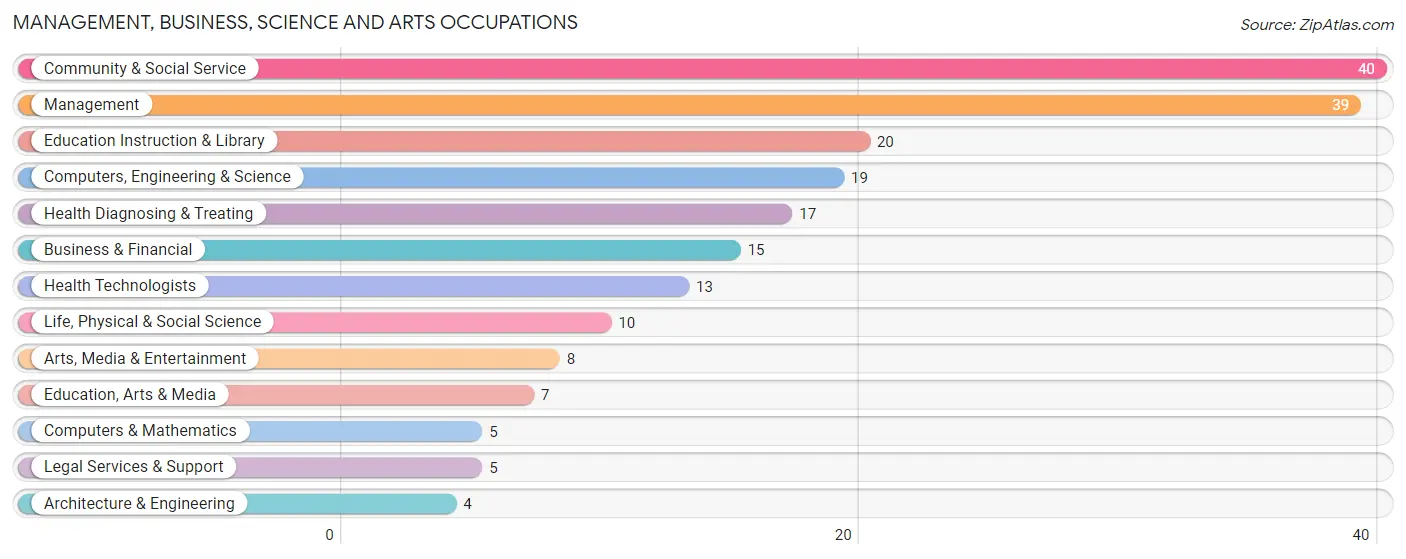
The most common Management, Business, Science and Arts occupations in Plummer are Community & Social Service (40 | 7.4%), Management (39 | 7.2%), Education Instruction & Library (20 | 3.7%), Computers, Engineering & Science (19 | 3.5%), and Health Diagnosing & Treating (17 | 3.2%).
Management, Business, Science and Arts Occupations by Sex
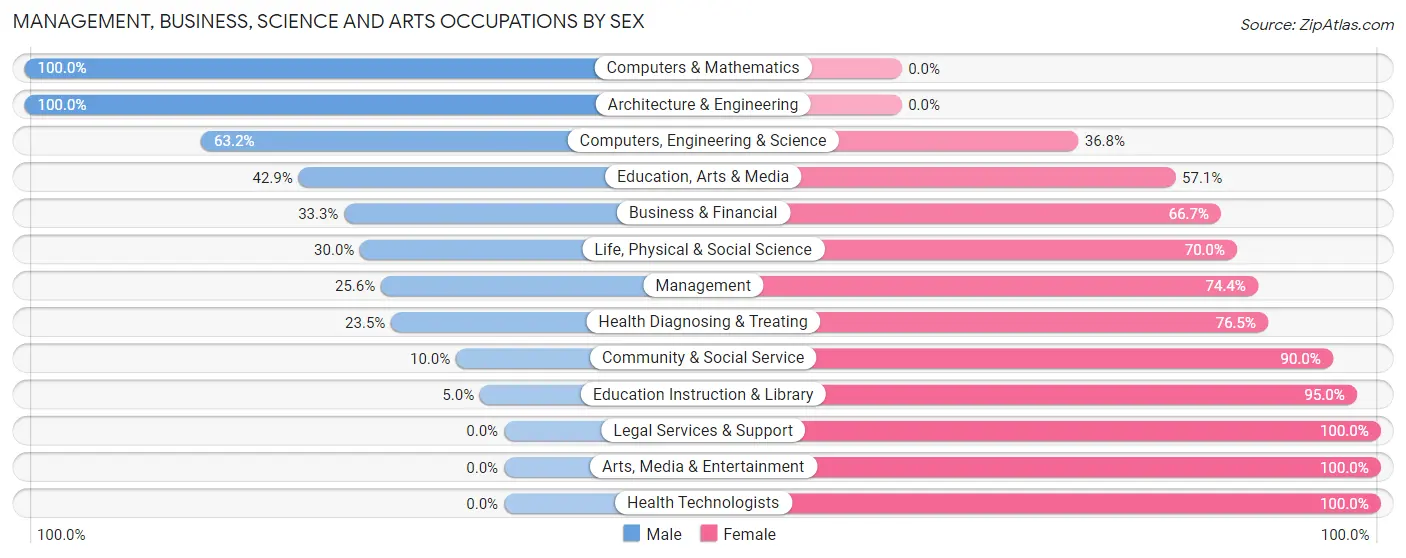
Within the Management, Business, Science and Arts occupations in Plummer, the most male-oriented occupations are Computers & Mathematics (100.0%), Architecture & Engineering (100.0%), and Computers, Engineering & Science (63.2%), while the most female-oriented occupations are Legal Services & Support (100.0%), Arts, Media & Entertainment (100.0%), and Health Technologists (100.0%).
| Occupation | Male | Female |
| Management | 10 (25.6%) | 29 (74.4%) |
| Business & Financial | 5 (33.3%) | 10 (66.7%) |
| Computers, Engineering & Science | 12 (63.2%) | 7 (36.8%) |
| Computers & Mathematics | 5 (100.0%) | 0 (0.0%) |
| Architecture & Engineering | 4 (100.0%) | 0 (0.0%) |
| Life, Physical & Social Science | 3 (30.0%) | 7 (70.0%) |
| Community & Social Service | 4 (10.0%) | 36 (90.0%) |
| Education, Arts & Media | 3 (42.9%) | 4 (57.1%) |
| Legal Services & Support | 0 (0.0%) | 5 (100.0%) |
| Education Instruction & Library | 1 (5.0%) | 19 (95.0%) |
| Arts, Media & Entertainment | 0 (0.0%) | 8 (100.0%) |
| Health Diagnosing & Treating | 4 (23.5%) | 13 (76.5%) |
| Health Technologists | 0 (0.0%) | 13 (100.0%) |
| Total (Category) | 35 (26.9%) | 95 (73.1%) |
| Total (Overall) | 267 (49.4%) | 273 (50.6%) |
Services Occupations
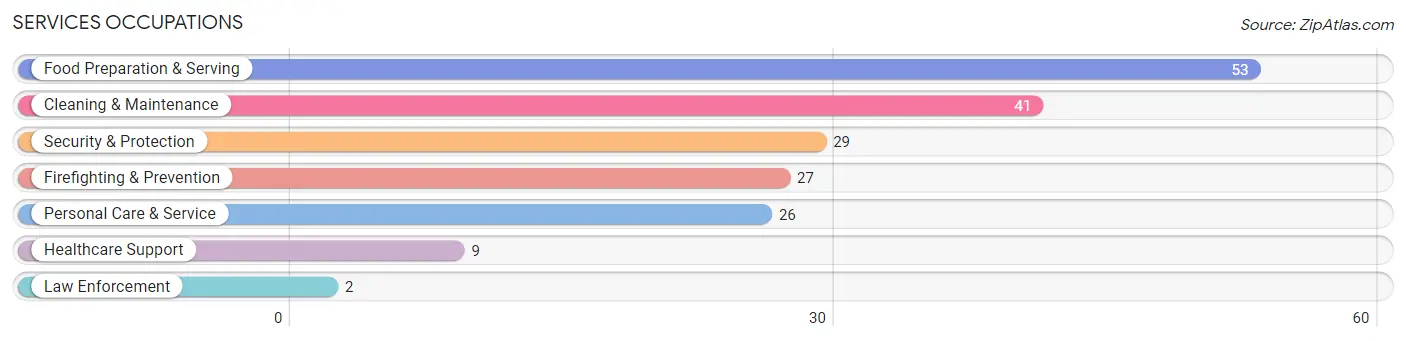
The most common Services occupations in Plummer are Food Preparation & Serving (53 | 9.8%), Cleaning & Maintenance (41 | 7.6%), Security & Protection (29 | 5.4%), Firefighting & Prevention (27 | 5.0%), and Personal Care & Service (26 | 4.8%).
Services Occupations by Sex
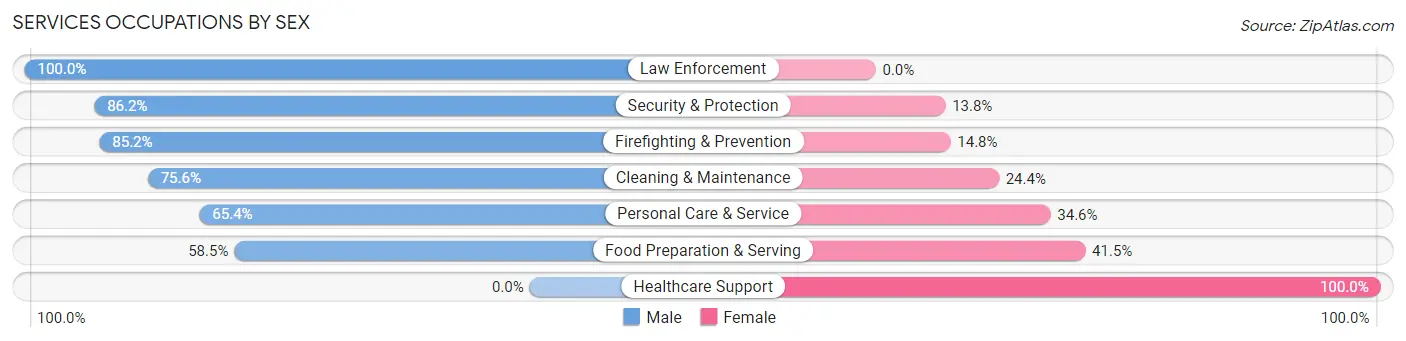
Within the Services occupations in Plummer, the most male-oriented occupations are Law Enforcement (100.0%), Security & Protection (86.2%), and Firefighting & Prevention (85.2%), while the most female-oriented occupations are Healthcare Support (100.0%), Food Preparation & Serving (41.5%), and Personal Care & Service (34.6%).
| Occupation | Male | Female |
| Healthcare Support | 0 (0.0%) | 9 (100.0%) |
| Security & Protection | 25 (86.2%) | 4 (13.8%) |
| Firefighting & Prevention | 23 (85.2%) | 4 (14.8%) |
| Law Enforcement | 2 (100.0%) | 0 (0.0%) |
| Food Preparation & Serving | 31 (58.5%) | 22 (41.5%) |
| Cleaning & Maintenance | 31 (75.6%) | 10 (24.4%) |
| Personal Care & Service | 17 (65.4%) | 9 (34.6%) |
| Total (Category) | 104 (65.8%) | 54 (34.2%) |
| Total (Overall) | 267 (49.4%) | 273 (50.6%) |
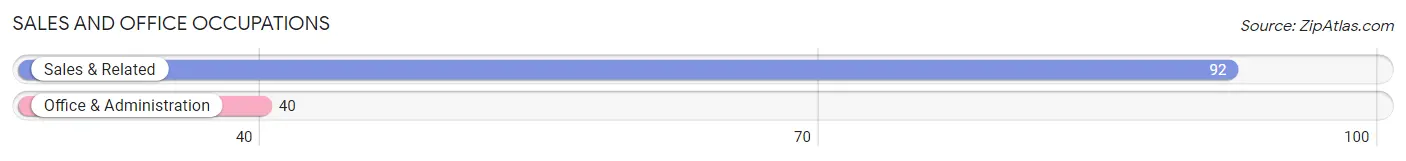
Sales and Office Occupations
The most common Sales and Office occupations in Plummer are Sales & Related (92 | 17.0%), and Office & Administration (40 | 7.4%).
Sales and Office Occupations by Sex
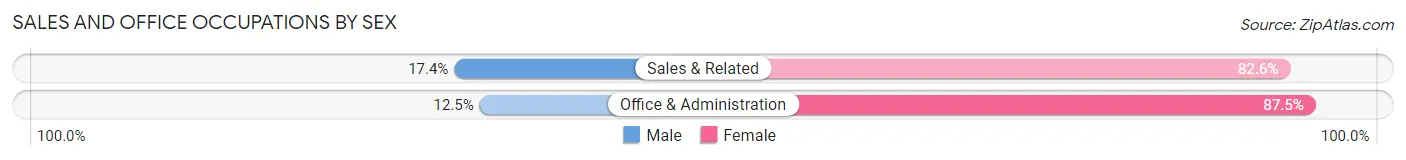
| Occupation | Male | Female |
| Sales & Related | 16 (17.4%) | 76 (82.6%) |
| Office & Administration | 5 (12.5%) | 35 (87.5%) |
| Total (Category) | 21 (15.9%) | 111 (84.1%) |
| Total (Overall) | 267 (49.4%) | 273 (50.6%) |
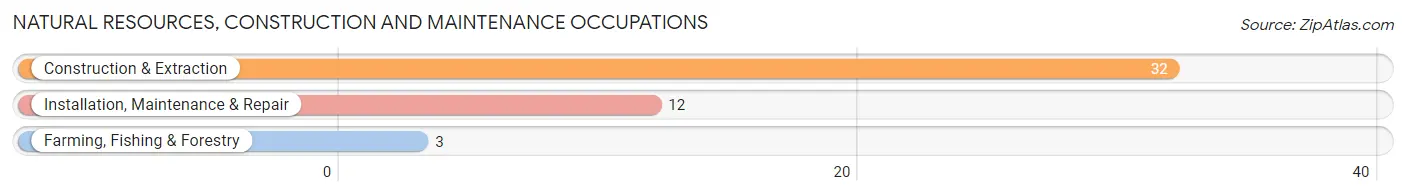
Natural Resources, Construction and Maintenance Occupations
The most common Natural Resources, Construction and Maintenance occupations in Plummer are Construction & Extraction (32 | 5.9%), Installation, Maintenance & Repair (12 | 2.2%), and Farming, Fishing & Forestry (3 | 0.6%).
Natural Resources, Construction and Maintenance Occupations by Sex
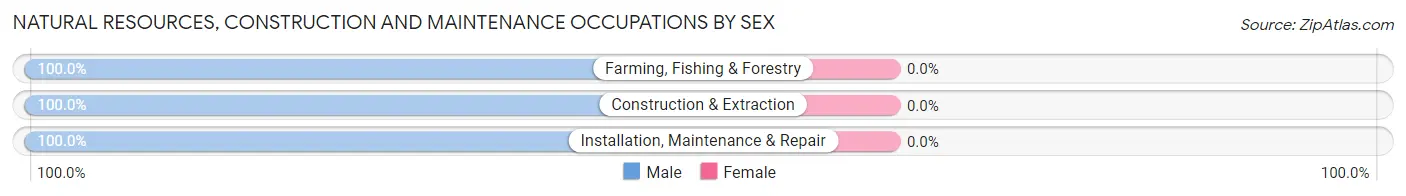
| Occupation | Male | Female |
| Farming, Fishing & Forestry | 3 (100.0%) | 0 (0.0%) |
| Construction & Extraction | 32 (100.0%) | 0 (0.0%) |
| Installation, Maintenance & Repair | 12 (100.0%) | 0 (0.0%) |
| Total (Category) | 47 (100.0%) | 0 (0.0%) |
| Total (Overall) | 267 (49.4%) | 273 (50.6%) |
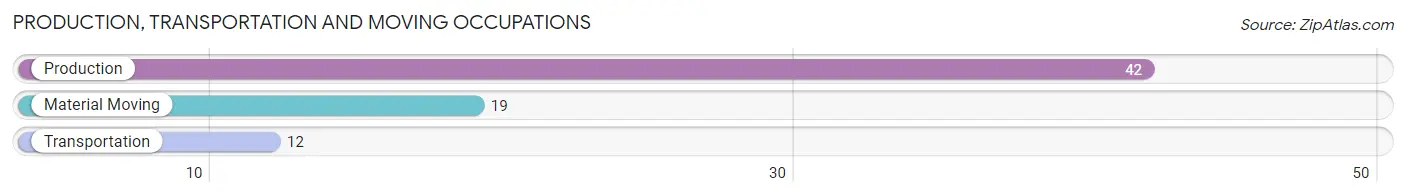
Production, Transportation and Moving Occupations
The most common Production, Transportation and Moving occupations in Plummer are Production (42 | 7.8%), Material Moving (19 | 3.5%), and Transportation (12 | 2.2%).
Production, Transportation and Moving Occupations by Sex
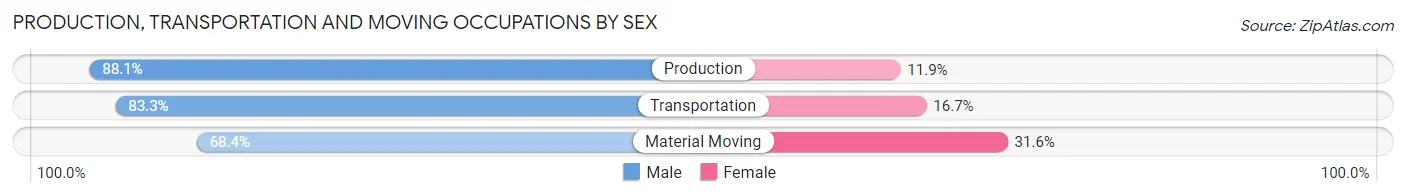
| Occupation | Male | Female |
| Production | 37 (88.1%) | 5 (11.9%) |
| Transportation | 10 (83.3%) | 2 (16.7%) |
| Material Moving | 13 (68.4%) | 6 (31.6%) |
| Total (Category) | 60 (82.2%) | 13 (17.8%) |
| Total (Overall) | 267 (49.4%) | 273 (50.6%) |
Employment Industries by Sex in Plummer
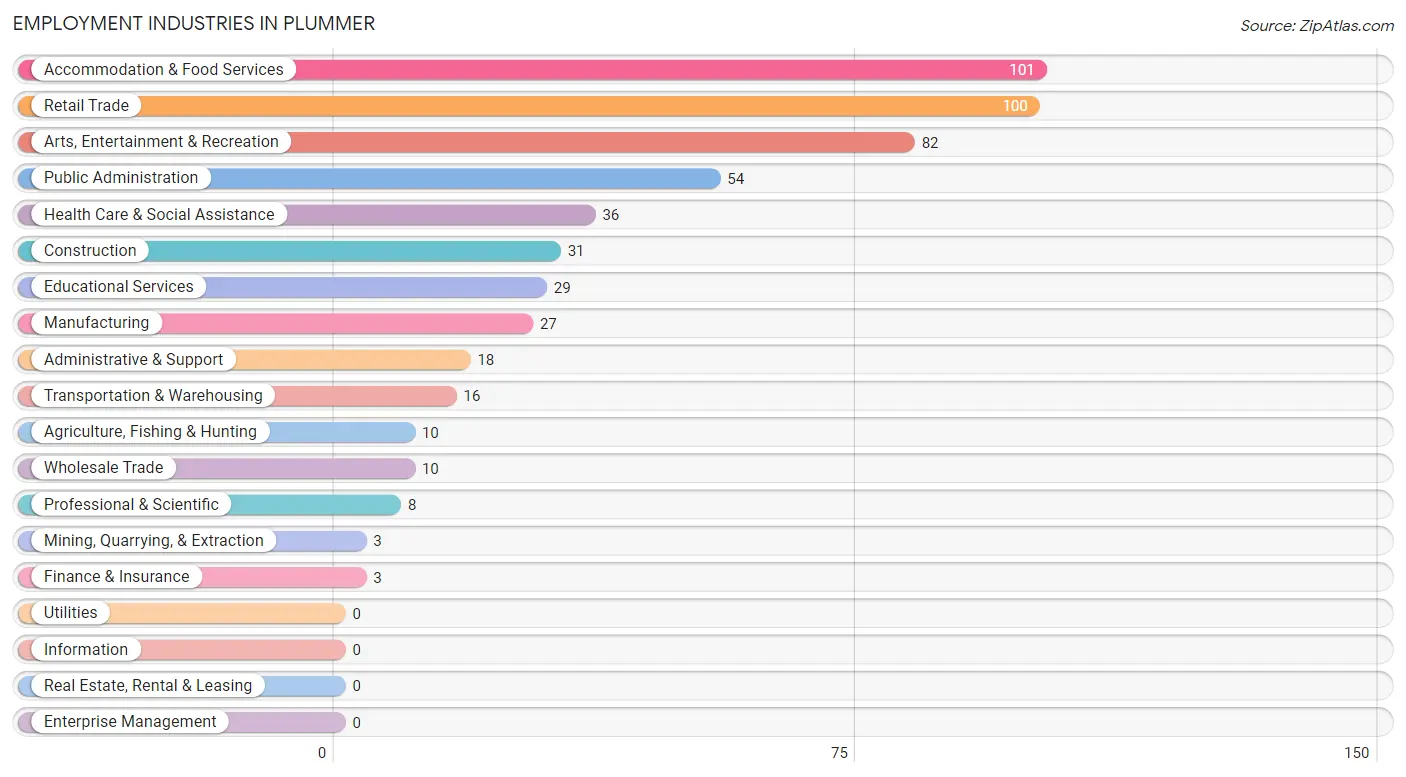
Employment Industries in Plummer
The major employment industries in Plummer include Accommodation & Food Services (101 | 18.7%), Retail Trade (100 | 18.5%), Arts, Entertainment & Recreation (82 | 15.2%), Public Administration (54 | 10.0%), and Health Care & Social Assistance (36 | 6.7%).
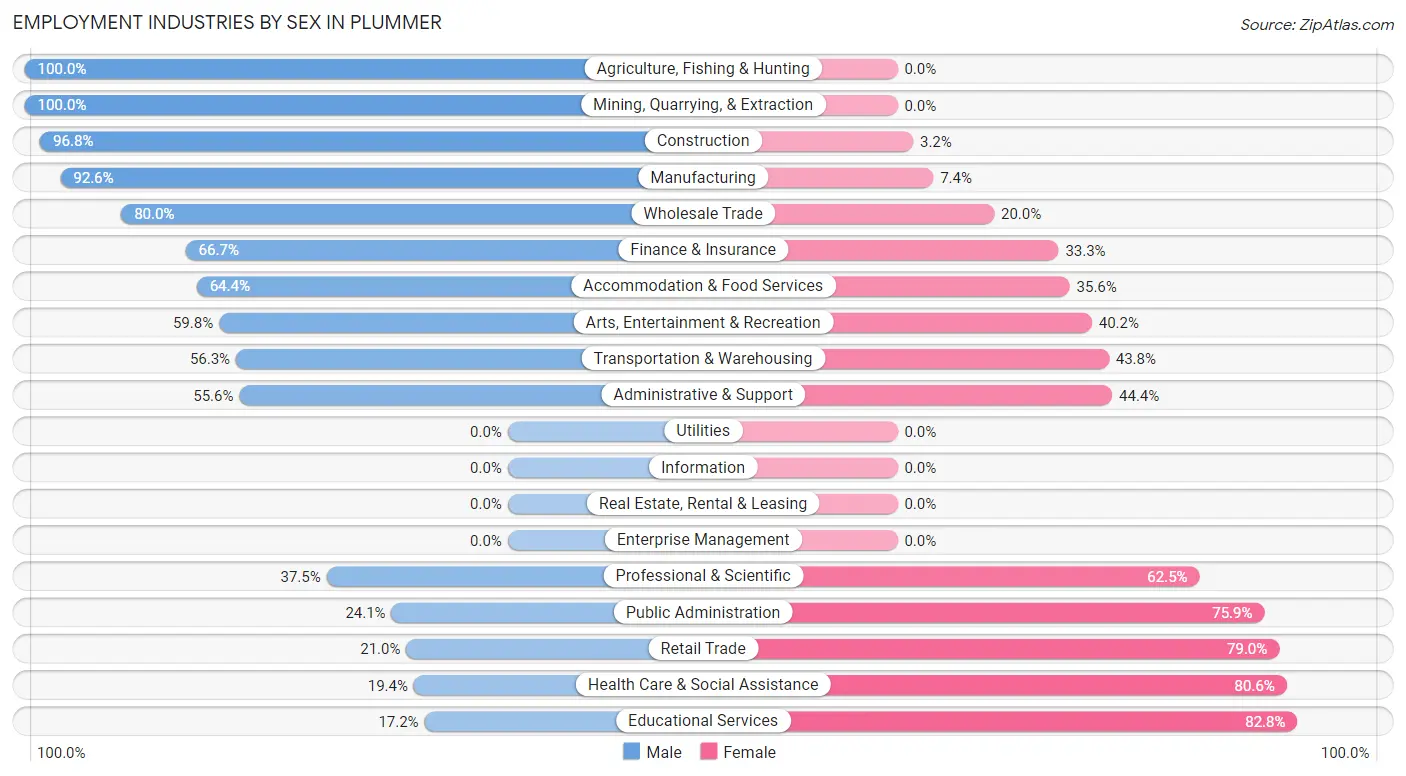
Employment Industries by Sex in Plummer
The Plummer industries that see more men than women are Agriculture, Fishing & Hunting (100.0%), Mining, Quarrying, & Extraction (100.0%), and Construction (96.8%), whereas the industries that tend to have a higher number of women are Educational Services (82.8%), Health Care & Social Assistance (80.6%), and Retail Trade (79.0%).
| Industry | Male | Female |
| Agriculture, Fishing & Hunting | 10 (100.0%) | 0 (0.0%) |
| Mining, Quarrying, & Extraction | 3 (100.0%) | 0 (0.0%) |
| Construction | 30 (96.8%) | 1 (3.2%) |
| Manufacturing | 25 (92.6%) | 2 (7.4%) |
| Wholesale Trade | 8 (80.0%) | 2 (20.0%) |
| Retail Trade | 21 (21.0%) | 79 (79.0%) |
| Transportation & Warehousing | 9 (56.2%) | 7 (43.8%) |
| Utilities | 0 (0.0%) | 0 (0.0%) |
| Information | 0 (0.0%) | 0 (0.0%) |
| Finance & Insurance | 2 (66.7%) | 1 (33.3%) |
| Real Estate, Rental & Leasing | 0 (0.0%) | 0 (0.0%) |
| Professional & Scientific | 3 (37.5%) | 5 (62.5%) |
| Enterprise Management | 0 (0.0%) | 0 (0.0%) |
| Administrative & Support | 10 (55.6%) | 8 (44.4%) |
| Educational Services | 5 (17.2%) | 24 (82.8%) |
| Health Care & Social Assistance | 7 (19.4%) | 29 (80.6%) |
| Arts, Entertainment & Recreation | 49 (59.8%) | 33 (40.2%) |
| Accommodation & Food Services | 65 (64.4%) | 36 (35.6%) |
| Public Administration | 13 (24.1%) | 41 (75.9%) |
| Total | 267 (49.4%) | 273 (50.6%) |
Education in Plummer
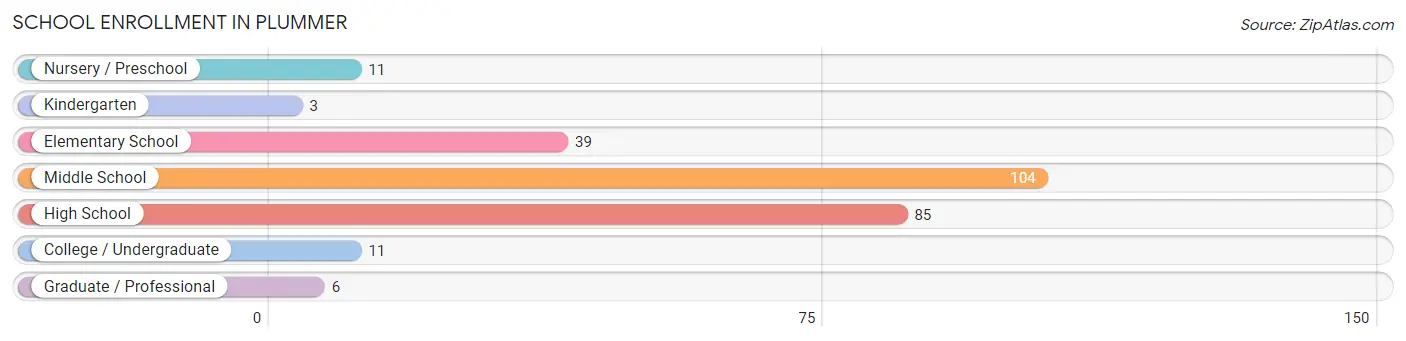
School Enrollment in Plummer
The most common levels of schooling among the 259 students in Plummer are middle school (104 | 40.2%), high school (85 | 32.8%), and elementary school (39 | 15.1%).
| School Level | # Students | % Students |
| Nursery / Preschool | 11 | 4.3% |
| Kindergarten | 3 | 1.2% |
| Elementary School | 39 | 15.1% |
| Middle School | 104 | 40.2% |
| High School | 85 | 32.8% |
| College / Undergraduate | 11 | 4.3% |
| Graduate / Professional | 6 | 2.3% |
| Total | 259 | 100.0% |
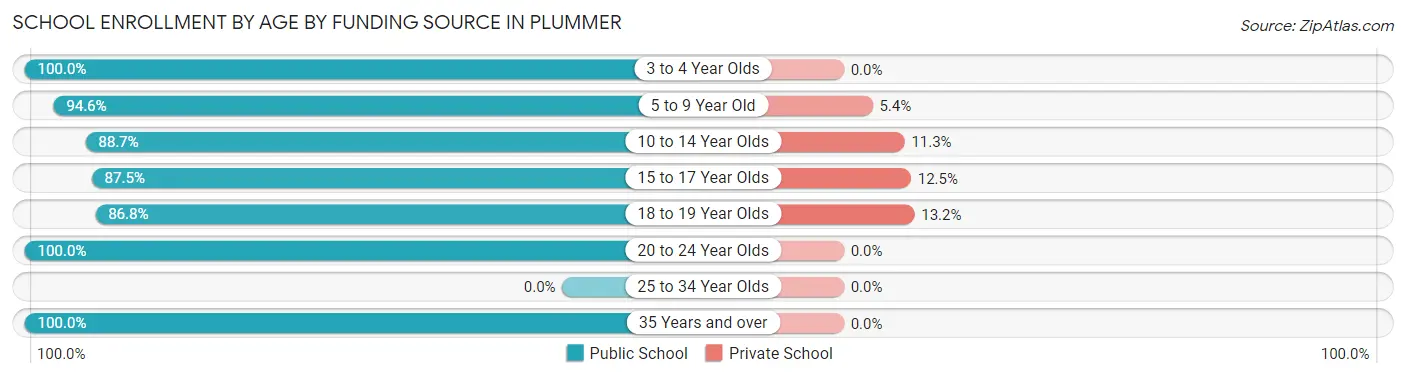
School Enrollment by Age by Funding Source in Plummer
Out of a total of 259 students who are enrolled in schools in Plummer, 25 (9.7%) attend a private institution, while the remaining 234 (90.3%) are enrolled in public schools. The age group of 18 to 19 year olds has the highest likelihood of being enrolled in private schools, with 5 (13.2% in the age bracket) enrolled. Conversely, the age group of 3 to 4 year olds has the lowest likelihood of being enrolled in a private school, with 9 (100.0% in the age bracket) attending a public institution.
| Age Bracket | Public School | Private School |
| 3 to 4 Year Olds | 9 (100.0%) | 0 (0.0%) |
| 5 to 9 Year Old | 53 (94.6%) | 3 (5.4%) |
| 10 to 14 Year Olds | 94 (88.7%) | 12 (11.3%) |
| 15 to 17 Year Olds | 35 (87.5%) | 5 (12.5%) |
| 18 to 19 Year Olds | 33 (86.8%) | 5 (13.2%) |
| 20 to 24 Year Olds | 4 (100.0%) | 0 (0.0%) |
| 25 to 34 Year Olds | 0 (0.0%) | 0 (0.0%) |
| 35 Years and over | 6 (100.0%) | 0 (0.0%) |
| Total | 234 (90.3%) | 25 (9.7%) |
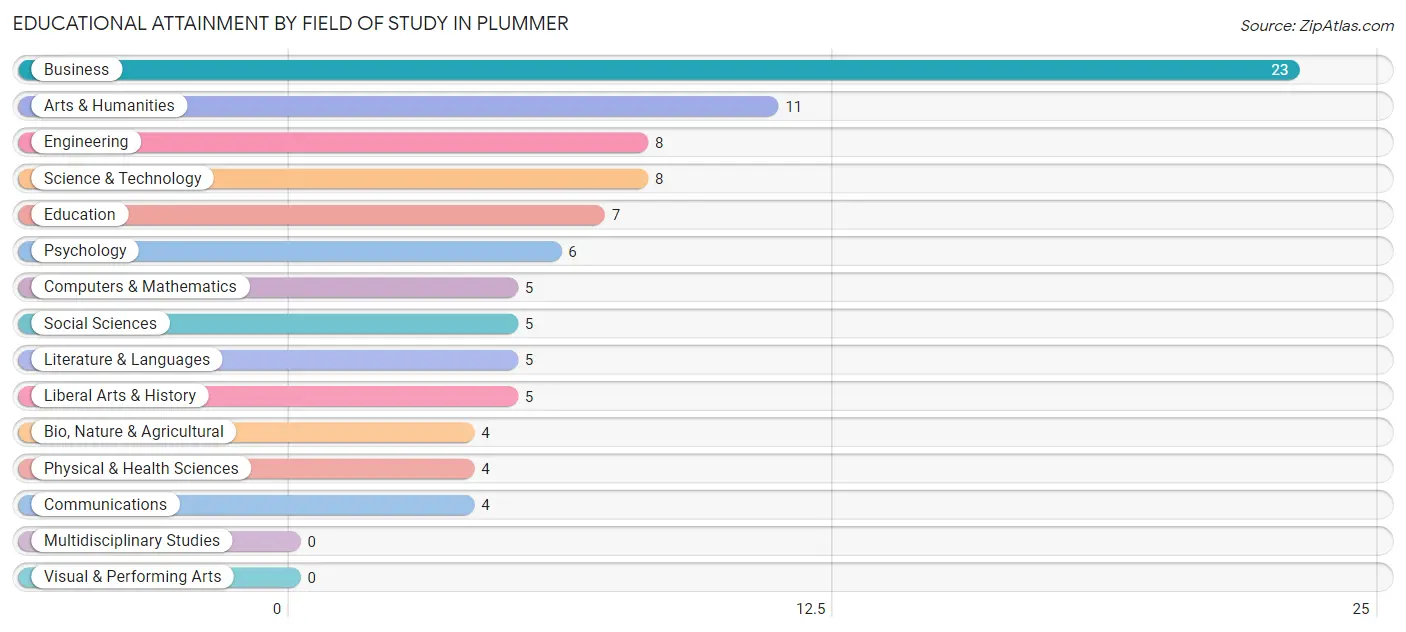
Educational Attainment by Field of Study in Plummer
Business (23 | 24.2%), arts & humanities (11 | 11.6%), engineering (8 | 8.4%), science & technology (8 | 8.4%), and education (7 | 7.4%) are the most common fields of study among 95 individuals in Plummer who have obtained a bachelor's degree or higher.
| Field of Study | # Graduates | % Graduates |
| Computers & Mathematics | 5 | 5.3% |
| Bio, Nature & Agricultural | 4 | 4.2% |
| Physical & Health Sciences | 4 | 4.2% |
| Psychology | 6 | 6.3% |
| Social Sciences | 5 | 5.3% |
| Engineering | 8 | 8.4% |
| Multidisciplinary Studies | 0 | 0.0% |
| Science & Technology | 8 | 8.4% |
| Business | 23 | 24.2% |
| Education | 7 | 7.4% |
| Literature & Languages | 5 | 5.3% |
| Liberal Arts & History | 5 | 5.3% |
| Visual & Performing Arts | 0 | 0.0% |
| Communications | 4 | 4.2% |
| Arts & Humanities | 11 | 11.6% |
| Total | 95 | 100.0% |
Transportation & Commute in Plummer
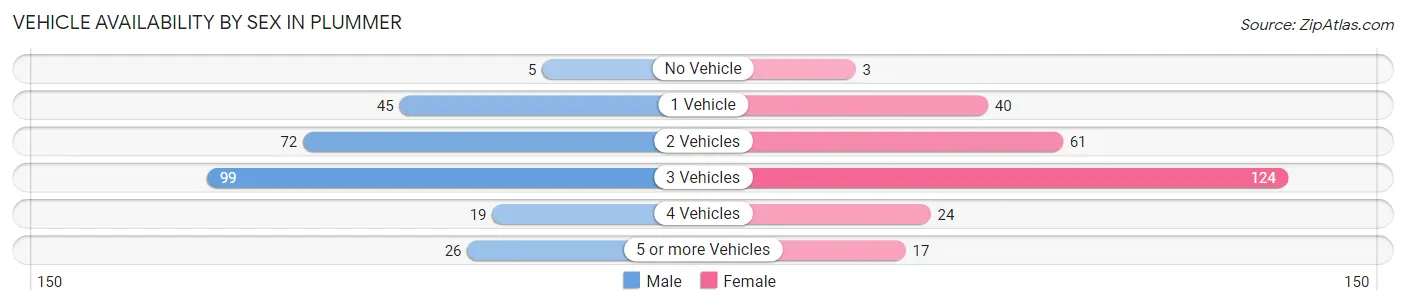
Vehicle Availability by Sex in Plummer
The most prevalent vehicle ownership categories in Plummer are males with 3 vehicles (99, accounting for 37.2%) and females with 3 vehicles (124, making up 36.8%).
| Vehicles Available | Male | Female |
| No Vehicle | 5 (1.9%) | 3 (1.1%) |
| 1 Vehicle | 45 (16.9%) | 40 (14.9%) |
| 2 Vehicles | 72 (27.1%) | 61 (22.7%) |
| 3 Vehicles | 99 (37.2%) | 124 (46.1%) |
| 4 Vehicles | 19 (7.1%) | 24 (8.9%) |
| 5 or more Vehicles | 26 (9.8%) | 17 (6.3%) |
| Total | 266 (100.0%) | 269 (100.0%) |
Commute Time in Plummer
The most frequently occuring commute durations in Plummer are 5 to 9 minutes (151 commuters, 28.9%), 15 to 19 minutes (83 commuters, 15.9%), and less than 5 minutes (53 commuters, 10.2%).
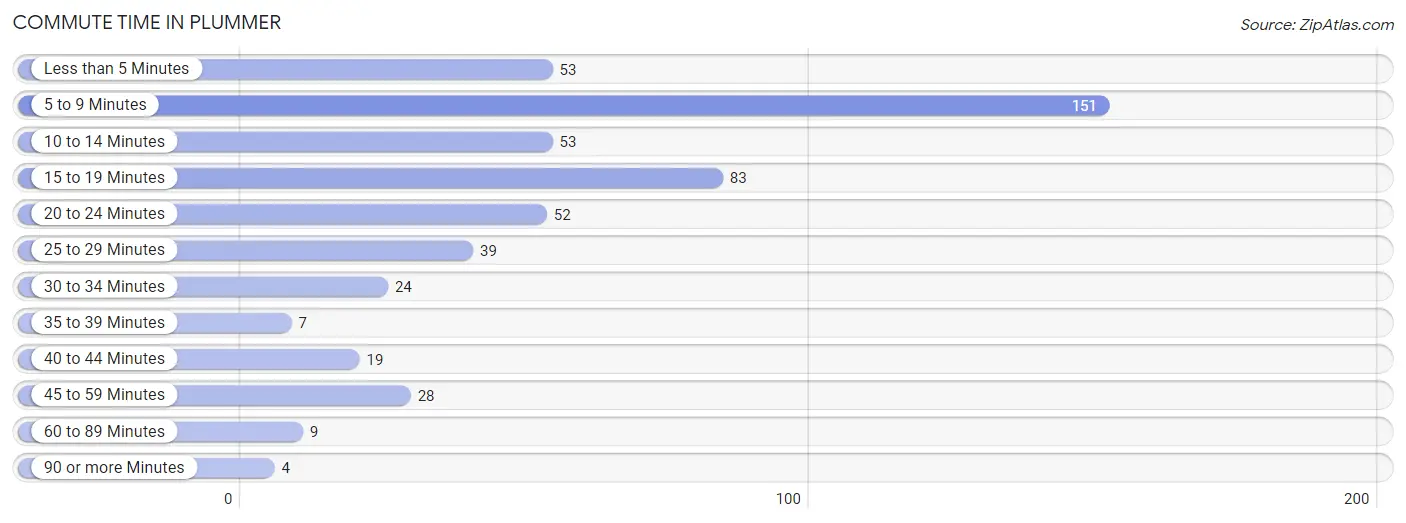
| Commute Time | # Commuters | % Commuters |
| Less than 5 Minutes | 53 | 10.2% |
| 5 to 9 Minutes | 151 | 28.9% |
| 10 to 14 Minutes | 53 | 10.2% |
| 15 to 19 Minutes | 83 | 15.9% |
| 20 to 24 Minutes | 52 | 10.0% |
| 25 to 29 Minutes | 39 | 7.5% |
| 30 to 34 Minutes | 24 | 4.6% |
| 35 to 39 Minutes | 7 | 1.3% |
| 40 to 44 Minutes | 19 | 3.6% |
| 45 to 59 Minutes | 28 | 5.4% |
| 60 to 89 Minutes | 9 | 1.7% |
| 90 or more Minutes | 4 | 0.8% |
Commute Time by Sex in Plummer
The most common commute times in Plummer are 15 to 19 minutes (51 commuters, 20.0%) for males and 5 to 9 minutes (107 commuters, 40.1%) for females.
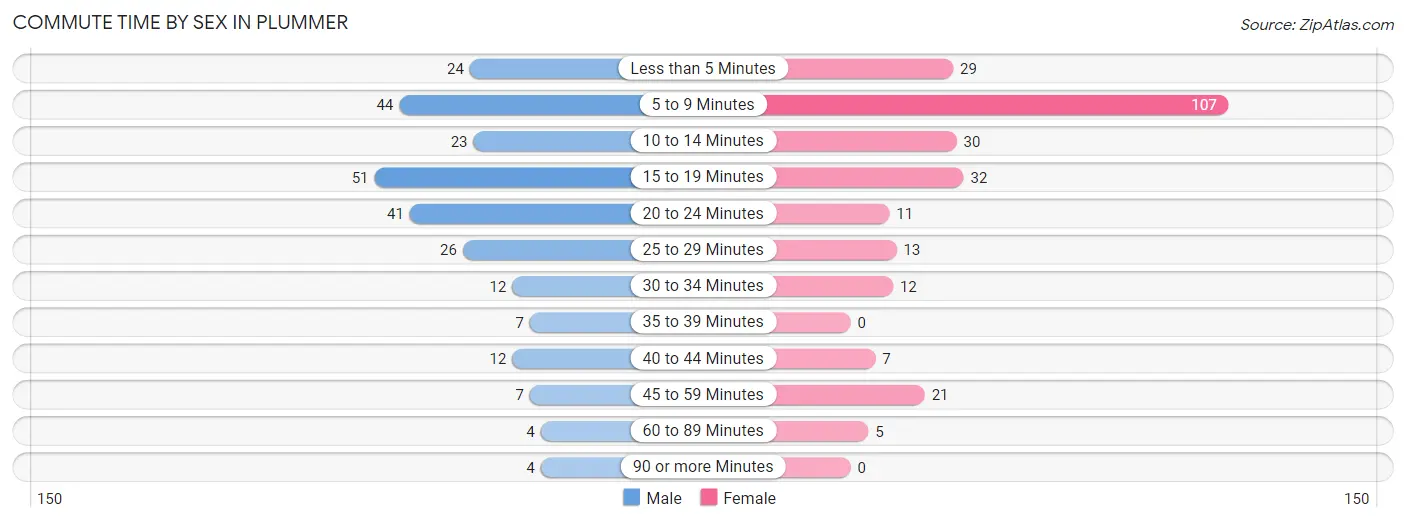
| Commute Time | Male | Female |
| Less than 5 Minutes | 24 (9.4%) | 29 (10.9%) |
| 5 to 9 Minutes | 44 (17.2%) | 107 (40.1%) |
| 10 to 14 Minutes | 23 (9.0%) | 30 (11.2%) |
| 15 to 19 Minutes | 51 (20.0%) | 32 (12.0%) |
| 20 to 24 Minutes | 41 (16.1%) | 11 (4.1%) |
| 25 to 29 Minutes | 26 (10.2%) | 13 (4.9%) |
| 30 to 34 Minutes | 12 (4.7%) | 12 (4.5%) |
| 35 to 39 Minutes | 7 (2.8%) | 0 (0.0%) |
| 40 to 44 Minutes | 12 (4.7%) | 7 (2.6%) |
| 45 to 59 Minutes | 7 (2.8%) | 21 (7.9%) |
| 60 to 89 Minutes | 4 (1.6%) | 5 (1.9%) |
| 90 or more Minutes | 4 (1.6%) | 0 (0.0%) |
Time of Departure to Work by Sex in Plummer
The most frequent times of departure to work in Plummer are 12:00 AM to 4:59 AM (68, 26.7%) for males and 10:00 AM to 10:59 AM (57, 21.3%) for females.
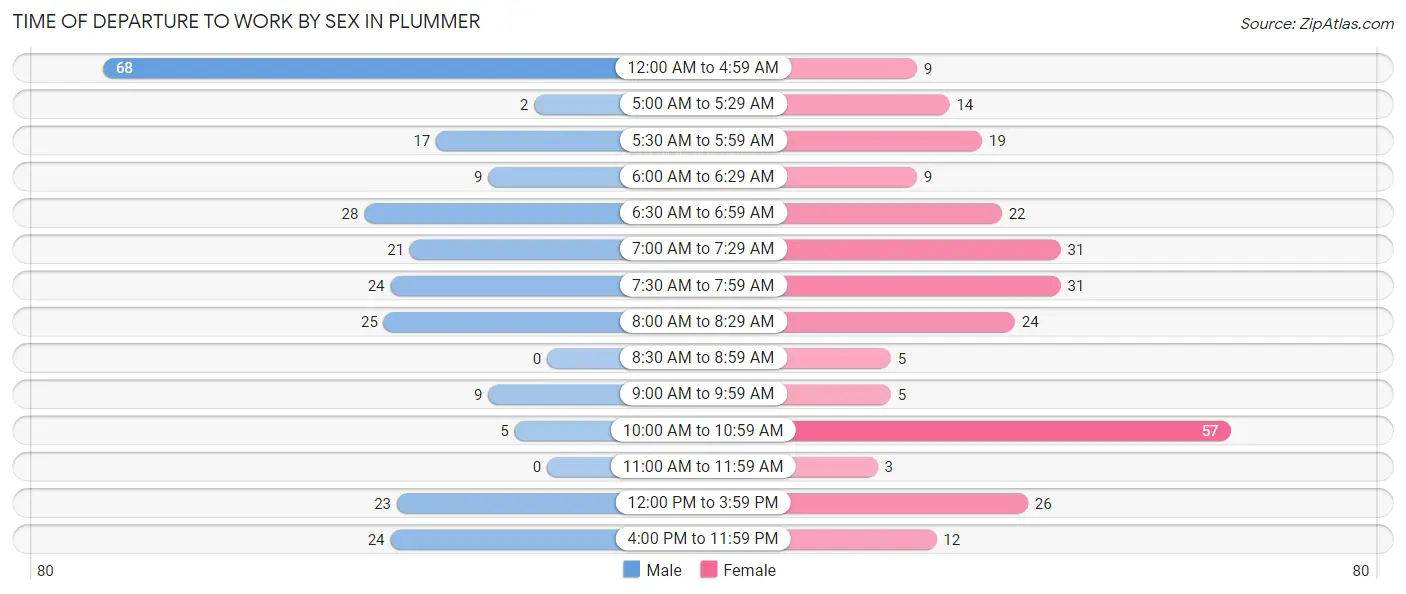
| Time of Departure | Male | Female |
| 12:00 AM to 4:59 AM | 68 (26.7%) | 9 (3.4%) |
| 5:00 AM to 5:29 AM | 2 (0.8%) | 14 (5.2%) |
| 5:30 AM to 5:59 AM | 17 (6.7%) | 19 (7.1%) |
| 6:00 AM to 6:29 AM | 9 (3.5%) | 9 (3.4%) |
| 6:30 AM to 6:59 AM | 28 (11.0%) | 22 (8.2%) |
| 7:00 AM to 7:29 AM | 21 (8.2%) | 31 (11.6%) |
| 7:30 AM to 7:59 AM | 24 (9.4%) | 31 (11.6%) |
| 8:00 AM to 8:29 AM | 25 (9.8%) | 24 (9.0%) |
| 8:30 AM to 8:59 AM | 0 (0.0%) | 5 (1.9%) |
| 9:00 AM to 9:59 AM | 9 (3.5%) | 5 (1.9%) |
| 10:00 AM to 10:59 AM | 5 (2.0%) | 57 (21.3%) |
| 11:00 AM to 11:59 AM | 0 (0.0%) | 3 (1.1%) |
| 12:00 PM to 3:59 PM | 23 (9.0%) | 26 (9.7%) |
| 4:00 PM to 11:59 PM | 24 (9.4%) | 12 (4.5%) |
| Total | 255 (100.0%) | 267 (100.0%) |
Housing Occupancy in Plummer
Occupancy by Ownership in Plummer
Of the total 398 dwellings in Plummer, owner-occupied units account for 256 (64.3%), while renter-occupied units make up 142 (35.7%).
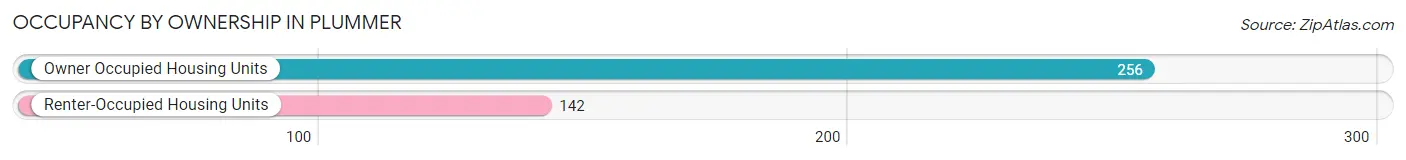
| Occupancy | # Housing Units | % Housing Units |
| Owner Occupied Housing Units | 256 | 64.3% |
| Renter-Occupied Housing Units | 142 | 35.7% |
| Total Occupied Housing Units | 398 | 100.0% |
Occupancy by Household Size in Plummer
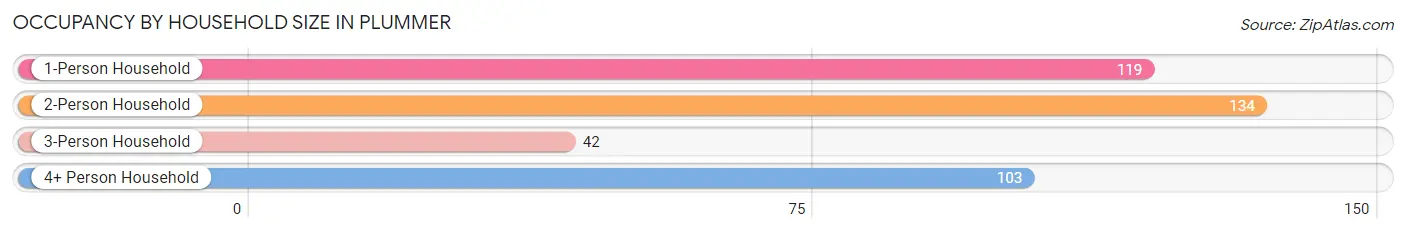
| Household Size | # Housing Units | % Housing Units |
| 1-Person Household | 119 | 29.9% |
| 2-Person Household | 134 | 33.7% |
| 3-Person Household | 42 | 10.5% |
| 4+ Person Household | 103 | 25.9% |
| Total Housing Units | 398 | 100.0% |
Occupancy by Ownership by Household Size in Plummer
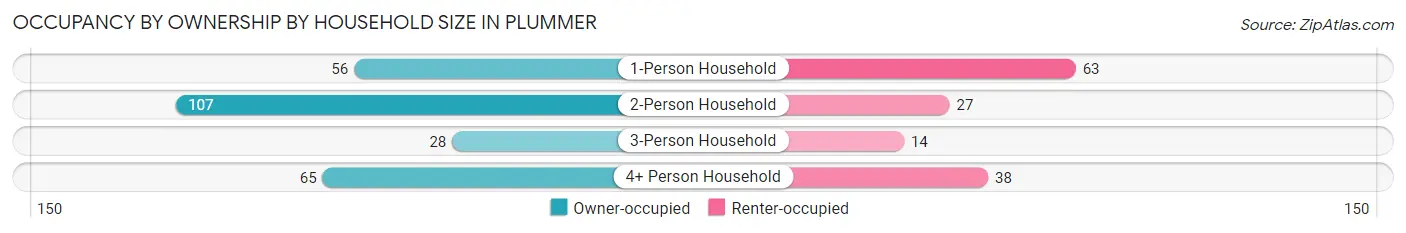
| Household Size | Owner-occupied | Renter-occupied |
| 1-Person Household | 56 (47.1%) | 63 (52.9%) |
| 2-Person Household | 107 (79.8%) | 27 (20.2%) |
| 3-Person Household | 28 (66.7%) | 14 (33.3%) |
| 4+ Person Household | 65 (63.1%) | 38 (36.9%) |
| Total Housing Units | 256 (64.3%) | 142 (35.7%) |
Occupancy by Educational Attainment in Plummer
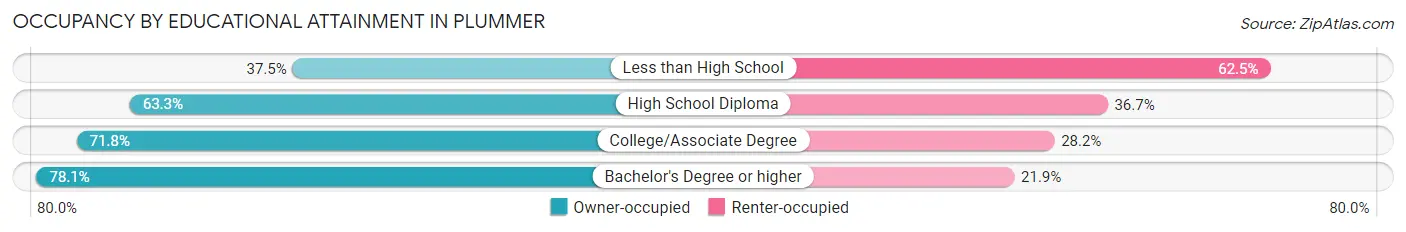
| Household Size | Owner-occupied | Renter-occupied |
| Less than High School | 24 (37.5%) | 40 (62.5%) |
| High School Diploma | 88 (63.3%) | 51 (36.7%) |
| College/Associate Degree | 94 (71.8%) | 37 (28.2%) |
| Bachelor's Degree or higher | 50 (78.1%) | 14 (21.9%) |
Occupancy by Age of Householder in Plummer
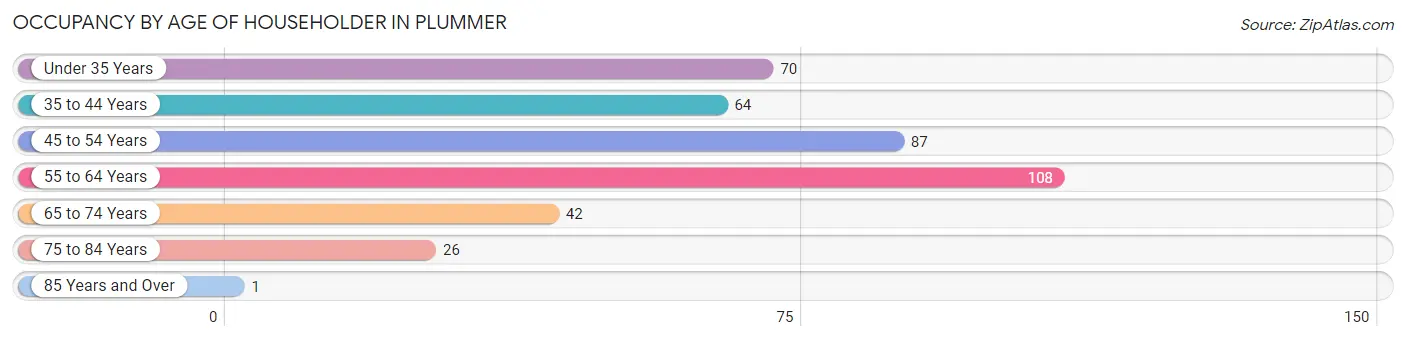
| Age Bracket | # Households | % Households |
| Under 35 Years | 70 | 17.6% |
| 35 to 44 Years | 64 | 16.1% |
| 45 to 54 Years | 87 | 21.9% |
| 55 to 64 Years | 108 | 27.1% |
| 65 to 74 Years | 42 | 10.5% |
| 75 to 84 Years | 26 | 6.5% |
| 85 Years and Over | 1 | 0.3% |
| Total | 398 | 100.0% |
Housing Finances in Plummer
Median Income by Occupancy in Plummer
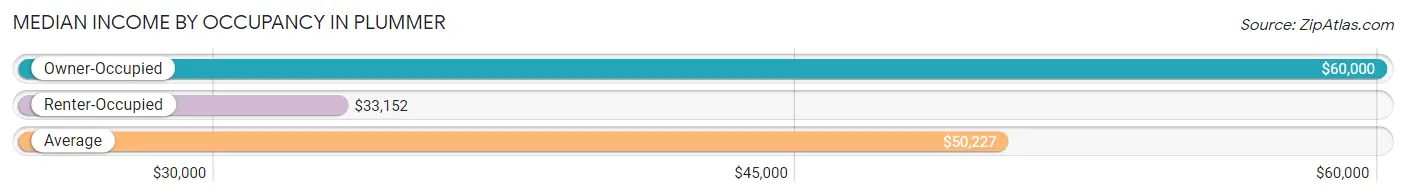
| Occupancy Type | # Households | Median Income |
| Owner-Occupied | 256 (64.3%) | $60,000 |
| Renter-Occupied | 142 (35.7%) | $33,152 |
| Average | 398 (100.0%) | $50,227 |
Occupancy by Householder Income Bracket in Plummer
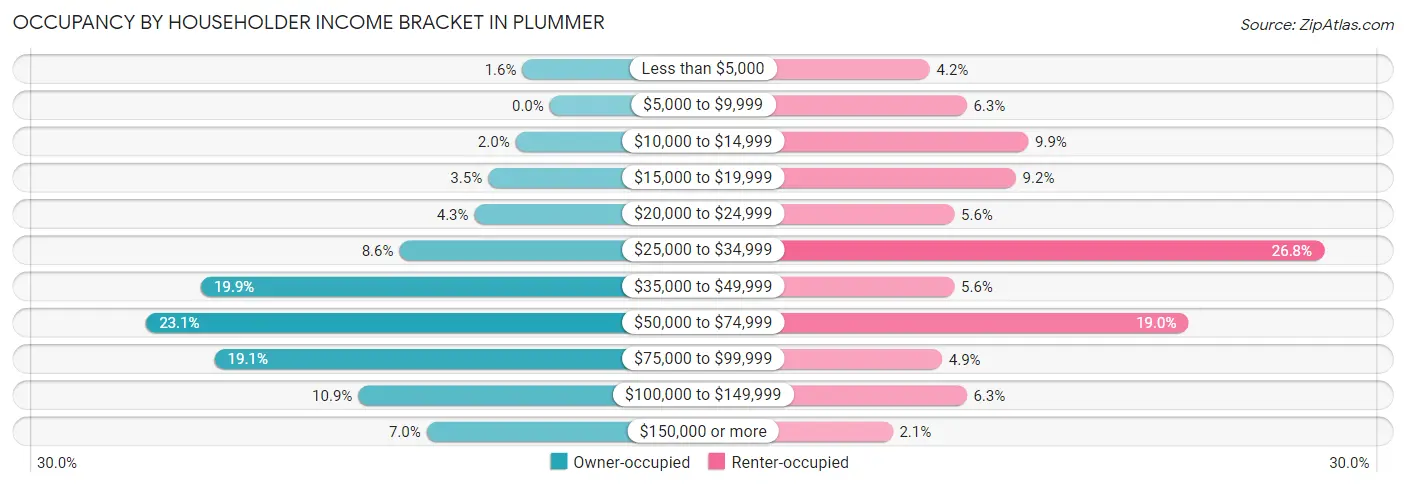
| Income Bracket | Owner-occupied | Renter-occupied |
| Less than $5,000 | 4 (1.6%) | 6 (4.2%) |
| $5,000 to $9,999 | 0 (0.0%) | 9 (6.3%) |
| $10,000 to $14,999 | 5 (1.9%) | 14 (9.9%) |
| $15,000 to $19,999 | 9 (3.5%) | 13 (9.1%) |
| $20,000 to $24,999 | 11 (4.3%) | 8 (5.6%) |
| $25,000 to $34,999 | 22 (8.6%) | 38 (26.8%) |
| $35,000 to $49,999 | 51 (19.9%) | 8 (5.6%) |
| $50,000 to $74,999 | 59 (23.1%) | 27 (19.0%) |
| $75,000 to $99,999 | 49 (19.1%) | 7 (4.9%) |
| $100,000 to $149,999 | 28 (10.9%) | 9 (6.3%) |
| $150,000 or more | 18 (7.0%) | 3 (2.1%) |
| Total | 256 (100.0%) | 142 (100.0%) |
Monthly Housing Cost Tiers in Plummer
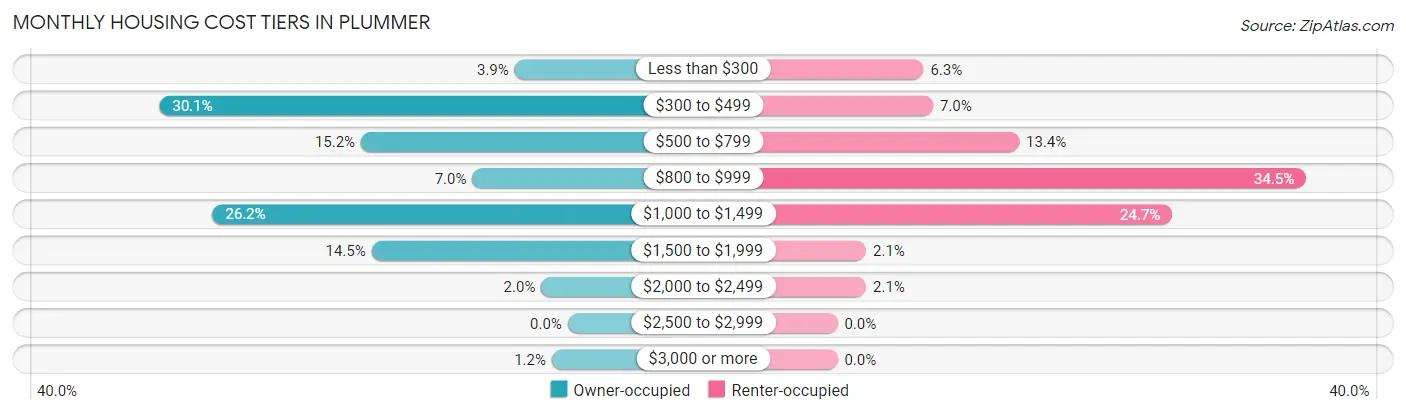
| Monthly Cost | Owner-occupied | Renter-occupied |
| Less than $300 | 10 (3.9%) | 9 (6.3%) |
| $300 to $499 | 77 (30.1%) | 10 (7.0%) |
| $500 to $799 | 39 (15.2%) | 19 (13.4%) |
| $800 to $999 | 18 (7.0%) | 49 (34.5%) |
| $1,000 to $1,499 | 67 (26.2%) | 35 (24.6%) |
| $1,500 to $1,999 | 37 (14.4%) | 3 (2.1%) |
| $2,000 to $2,499 | 5 (1.9%) | 3 (2.1%) |
| $2,500 to $2,999 | 0 (0.0%) | 0 (0.0%) |
| $3,000 or more | 3 (1.2%) | 0 (0.0%) |
| Total | 256 (100.0%) | 142 (100.0%) |
Physical Housing Characteristics in Plummer
Housing Structures in Plummer
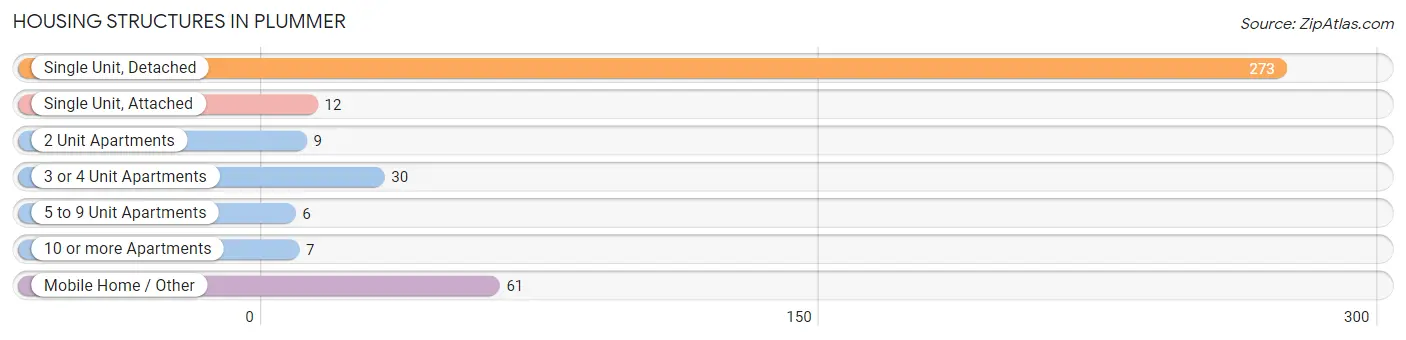
| Structure Type | # Housing Units | % Housing Units |
| Single Unit, Detached | 273 | 68.6% |
| Single Unit, Attached | 12 | 3.0% |
| 2 Unit Apartments | 9 | 2.3% |
| 3 or 4 Unit Apartments | 30 | 7.5% |
| 5 to 9 Unit Apartments | 6 | 1.5% |
| 10 or more Apartments | 7 | 1.8% |
| Mobile Home / Other | 61 | 15.3% |
| Total | 398 | 100.0% |
Housing Structures by Occupancy in Plummer
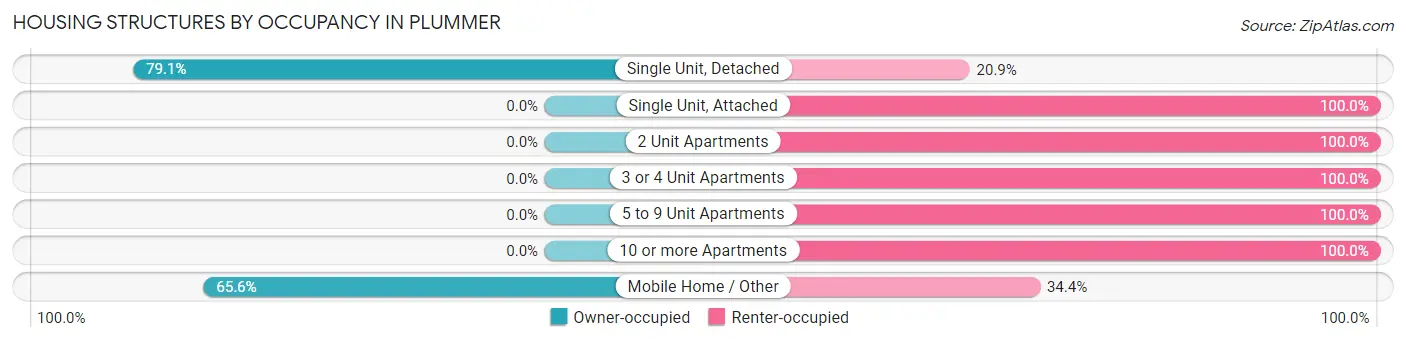
| Structure Type | Owner-occupied | Renter-occupied |
| Single Unit, Detached | 216 (79.1%) | 57 (20.9%) |
| Single Unit, Attached | 0 (0.0%) | 12 (100.0%) |
| 2 Unit Apartments | 0 (0.0%) | 9 (100.0%) |
| 3 or 4 Unit Apartments | 0 (0.0%) | 30 (100.0%) |
| 5 to 9 Unit Apartments | 0 (0.0%) | 6 (100.0%) |
| 10 or more Apartments | 0 (0.0%) | 7 (100.0%) |
| Mobile Home / Other | 40 (65.6%) | 21 (34.4%) |
| Total | 256 (64.3%) | 142 (35.7%) |
Housing Structures by Number of Rooms in Plummer
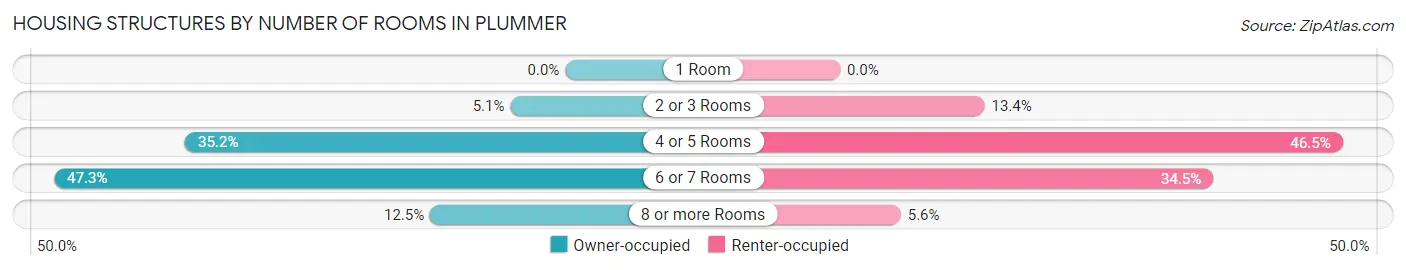
| Number of Rooms | Owner-occupied | Renter-occupied |
| 1 Room | 0 (0.0%) | 0 (0.0%) |
| 2 or 3 Rooms | 13 (5.1%) | 19 (13.4%) |
| 4 or 5 Rooms | 90 (35.2%) | 66 (46.5%) |
| 6 or 7 Rooms | 121 (47.3%) | 49 (34.5%) |
| 8 or more Rooms | 32 (12.5%) | 8 (5.6%) |
| Total | 256 (100.0%) | 142 (100.0%) |
Housing Structure by Heating Type in Plummer
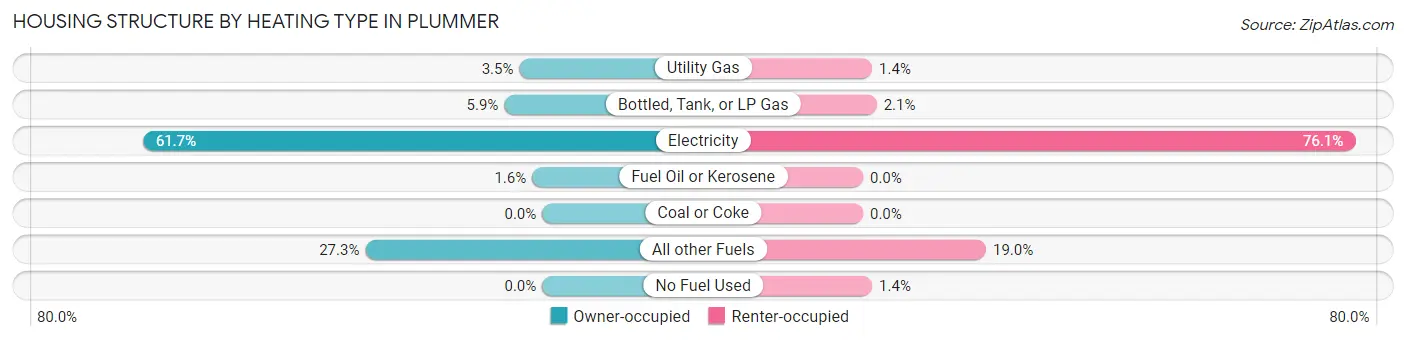
| Heating Type | Owner-occupied | Renter-occupied |
| Utility Gas | 9 (3.5%) | 2 (1.4%) |
| Bottled, Tank, or LP Gas | 15 (5.9%) | 3 (2.1%) |
| Electricity | 158 (61.7%) | 108 (76.1%) |
| Fuel Oil or Kerosene | 4 (1.6%) | 0 (0.0%) |
| Coal or Coke | 0 (0.0%) | 0 (0.0%) |
| All other Fuels | 70 (27.3%) | 27 (19.0%) |
| No Fuel Used | 0 (0.0%) | 2 (1.4%) |
| Total | 256 (100.0%) | 142 (100.0%) |
Household Vehicle Usage in Plummer
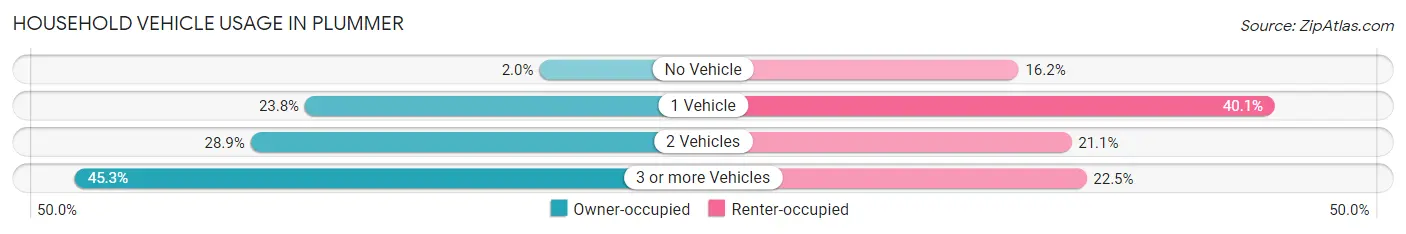
| Vehicles per Household | Owner-occupied | Renter-occupied |
| No Vehicle | 5 (1.9%) | 23 (16.2%) |
| 1 Vehicle | 61 (23.8%) | 57 (40.1%) |
| 2 Vehicles | 74 (28.9%) | 30 (21.1%) |
| 3 or more Vehicles | 116 (45.3%) | 32 (22.5%) |
| Total | 256 (100.0%) | 142 (100.0%) |
Real Estate & Mortgages in Plummer
Real Estate and Mortgage Overview in Plummer
| Characteristic | Without Mortgage | With Mortgage |
| Housing Units | 109 | 147 |
| Median Property Value | $129,800 | $164,600 |
| Median Household Income | $66,964 | $10 |
| Monthly Housing Costs | $411 | $3 |
| Real Estate Taxes | $650 | $22 |
Property Value by Mortgage Status in Plummer
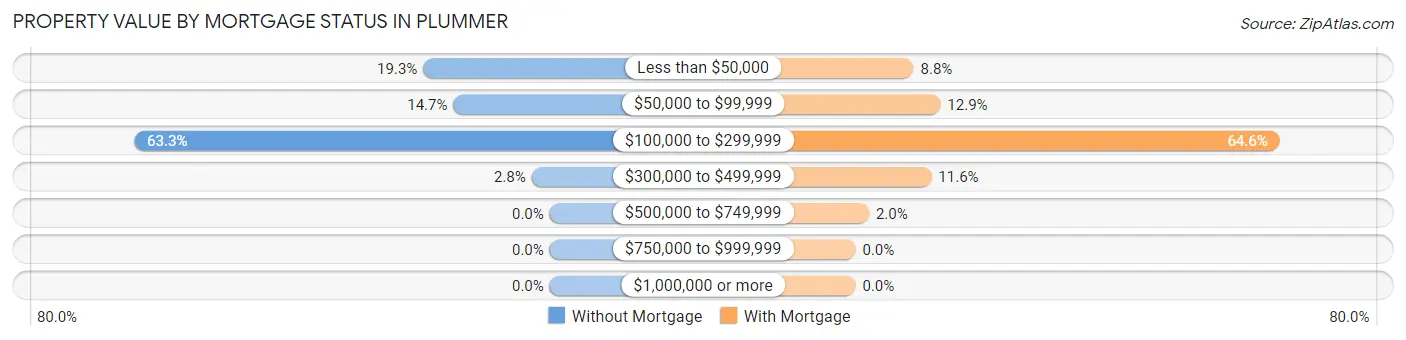
| Property Value | Without Mortgage | With Mortgage |
| Less than $50,000 | 21 (19.3%) | 13 (8.8%) |
| $50,000 to $99,999 | 16 (14.7%) | 19 (12.9%) |
| $100,000 to $299,999 | 69 (63.3%) | 95 (64.6%) |
| $300,000 to $499,999 | 3 (2.8%) | 17 (11.6%) |
| $500,000 to $749,999 | 0 (0.0%) | 3 (2.0%) |
| $750,000 to $999,999 | 0 (0.0%) | 0 (0.0%) |
| $1,000,000 or more | 0 (0.0%) | 0 (0.0%) |
| Total | 109 (100.0%) | 147 (100.0%) |
Household Income by Mortgage Status in Plummer
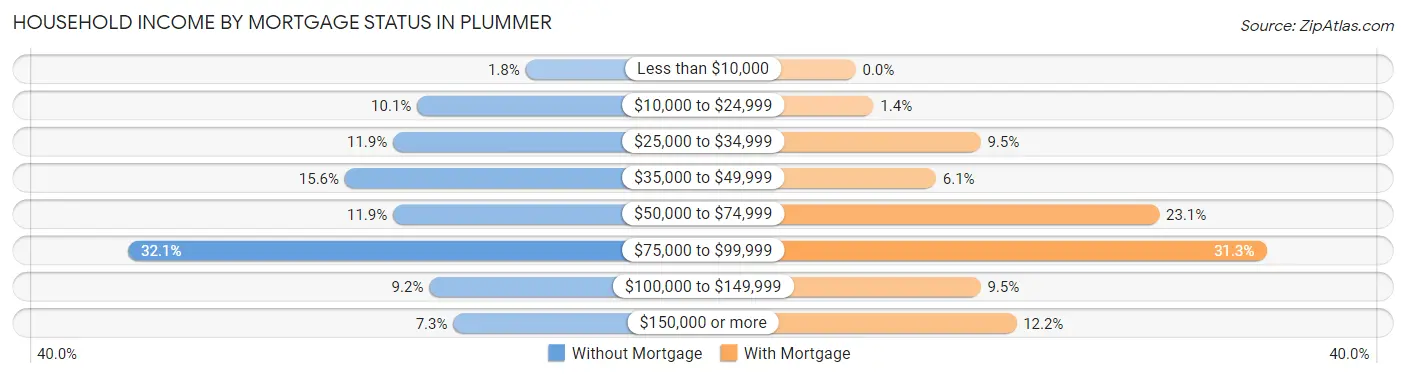
| Household Income | Without Mortgage | With Mortgage |
| Less than $10,000 | 2 (1.8%) | 0 (0.0%) |
| $10,000 to $24,999 | 11 (10.1%) | 2 (1.4%) |
| $25,000 to $34,999 | 13 (11.9%) | 14 (9.5%) |
| $35,000 to $49,999 | 17 (15.6%) | 9 (6.1%) |
| $50,000 to $74,999 | 13 (11.9%) | 34 (23.1%) |
| $75,000 to $99,999 | 35 (32.1%) | 46 (31.3%) |
| $100,000 to $149,999 | 10 (9.2%) | 14 (9.5%) |
| $150,000 or more | 8 (7.3%) | 18 (12.2%) |
| Total | 109 (100.0%) | 147 (100.0%) |
Property Value to Household Income Ratio in Plummer
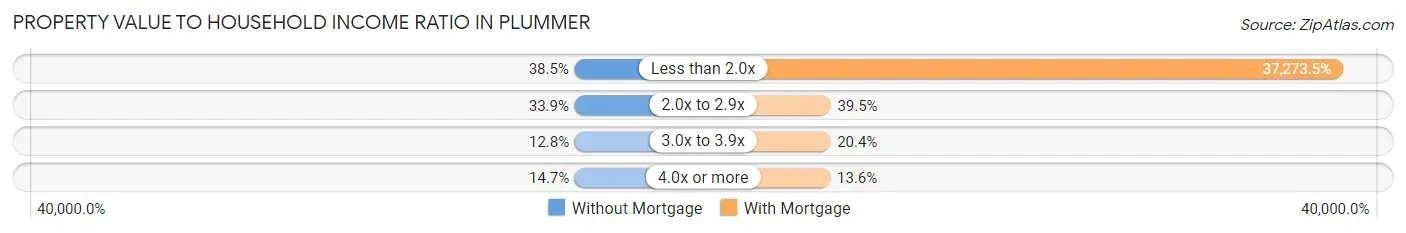
| Value-to-Income Ratio | Without Mortgage | With Mortgage |
| Less than 2.0x | 42 (38.5%) | 54,792 (37,273.5%) |
| 2.0x to 2.9x | 37 (33.9%) | 58 (39.5%) |
| 3.0x to 3.9x | 14 (12.8%) | 30 (20.4%) |
| 4.0x or more | 16 (14.7%) | 20 (13.6%) |
| Total | 109 (100.0%) | 147 (100.0%) |
Real Estate Taxes by Mortgage Status in Plummer
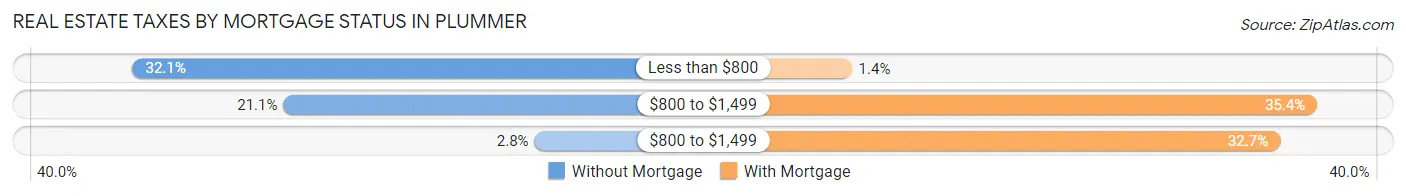
| Property Taxes | Without Mortgage | With Mortgage |
| Less than $800 | 35 (32.1%) | 2 (1.4%) |
| $800 to $1,499 | 23 (21.1%) | 52 (35.4%) |
| $800 to $1,499 | 3 (2.8%) | 48 (32.7%) |
| Total | 109 (100.0%) | 147 (100.0%) |
Health & Disability in Plummer
Health Insurance Coverage by Age in Plummer
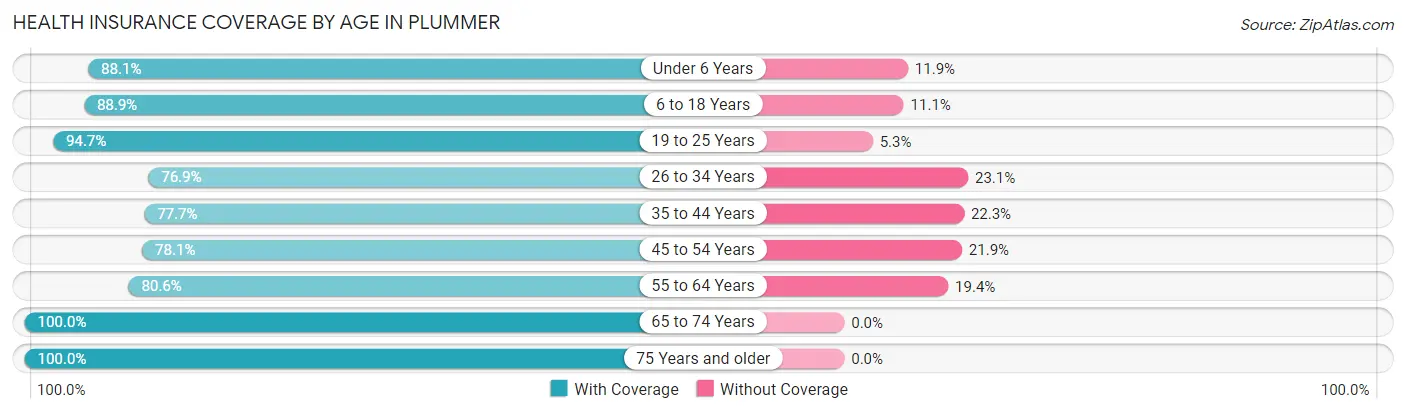
| Age Bracket | With Coverage | Without Coverage |
| Under 6 Years | 52 (88.1%) | 7 (11.9%) |
| 6 to 18 Years | 233 (88.9%) | 29 (11.1%) |
| 19 to 25 Years | 143 (94.7%) | 8 (5.3%) |
| 26 to 34 Years | 90 (76.9%) | 27 (23.1%) |
| 35 to 44 Years | 101 (77.7%) | 29 (22.3%) |
| 45 to 54 Years | 89 (78.1%) | 25 (21.9%) |
| 55 to 64 Years | 179 (80.6%) | 43 (19.4%) |
| 65 to 74 Years | 58 (100.0%) | 0 (0.0%) |
| 75 Years and older | 40 (100.0%) | 0 (0.0%) |
| Total | 985 (85.4%) | 168 (14.6%) |
Health Insurance Coverage by Citizenship Status in Plummer
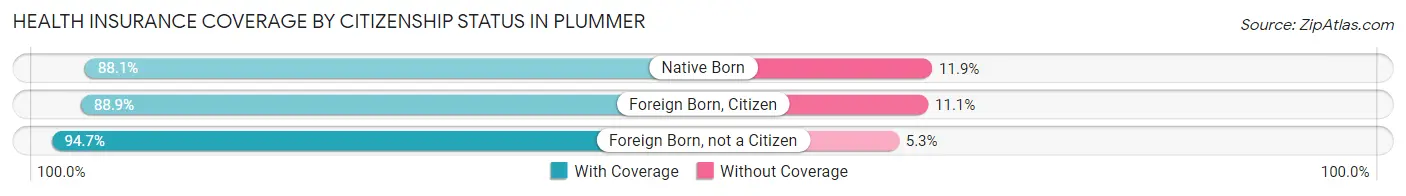
| Citizenship Status | With Coverage | Without Coverage |
| Native Born | 52 (88.1%) | 7 (11.9%) |
| Foreign Born, Citizen | 233 (88.9%) | 29 (11.1%) |
| Foreign Born, not a Citizen | 143 (94.7%) | 8 (5.3%) |
Health Insurance Coverage by Household Income in Plummer
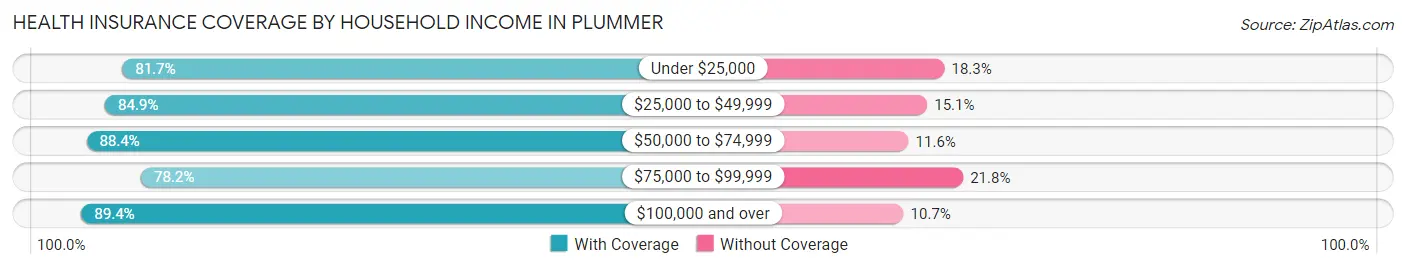
| Household Income | With Coverage | Without Coverage |
| Under $25,000 | 116 (81.7%) | 26 (18.3%) |
| $25,000 to $49,999 | 242 (84.9%) | 43 (15.1%) |
| $50,000 to $74,999 | 305 (88.4%) | 40 (11.6%) |
| $75,000 to $99,999 | 129 (78.2%) | 36 (21.8%) |
| $100,000 and over | 193 (89.3%) | 23 (10.6%) |
Public vs Private Health Insurance Coverage by Age in Plummer
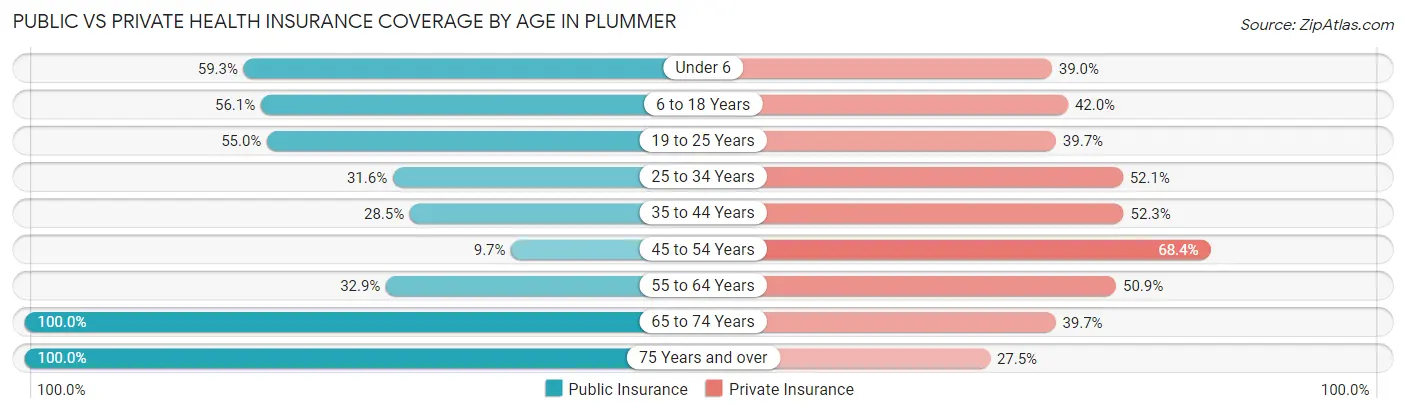
| Age Bracket | Public Insurance | Private Insurance |
| Under 6 | 35 (59.3%) | 23 (39.0%) |
| 6 to 18 Years | 147 (56.1%) | 110 (42.0%) |
| 19 to 25 Years | 83 (55.0%) | 60 (39.7%) |
| 25 to 34 Years | 37 (31.6%) | 61 (52.1%) |
| 35 to 44 Years | 37 (28.5%) | 68 (52.3%) |
| 45 to 54 Years | 11 (9.7%) | 78 (68.4%) |
| 55 to 64 Years | 73 (32.9%) | 113 (50.9%) |
| 65 to 74 Years | 58 (100.0%) | 23 (39.7%) |
| 75 Years and over | 40 (100.0%) | 11 (27.5%) |
| Total | 521 (45.2%) | 547 (47.4%) |
Disability Status by Sex by Age in Plummer
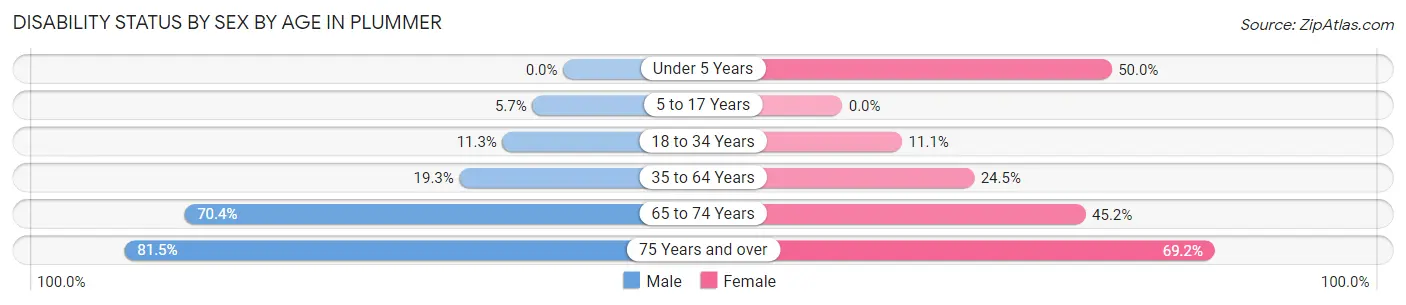
| Age Bracket | Male | Female |
| Under 5 Years | 0 (0.0%) | 9 (50.0%) |
| 5 to 17 Years | 6 (5.7%) | 0 (0.0%) |
| 18 to 34 Years | 17 (11.3%) | 18 (11.1%) |
| 35 to 64 Years | 52 (19.3%) | 48 (24.5%) |
| 65 to 74 Years | 19 (70.4%) | 14 (45.2%) |
| 75 Years and over | 22 (81.5%) | 9 (69.2%) |
Disability Class by Sex by Age in Plummer
Disability Class: Hearing Difficulty
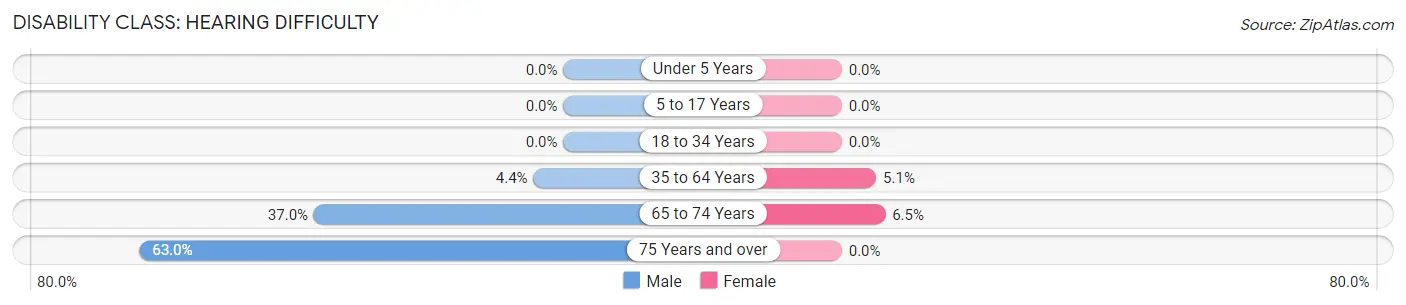
| Age Bracket | Male | Female |
| Under 5 Years | 0 (0.0%) | 0 (0.0%) |
| 5 to 17 Years | 0 (0.0%) | 0 (0.0%) |
| 18 to 34 Years | 0 (0.0%) | 0 (0.0%) |
| 35 to 64 Years | 12 (4.4%) | 10 (5.1%) |
| 65 to 74 Years | 10 (37.0%) | 2 (6.5%) |
| 75 Years and over | 17 (63.0%) | 0 (0.0%) |
Disability Class: Vision Difficulty
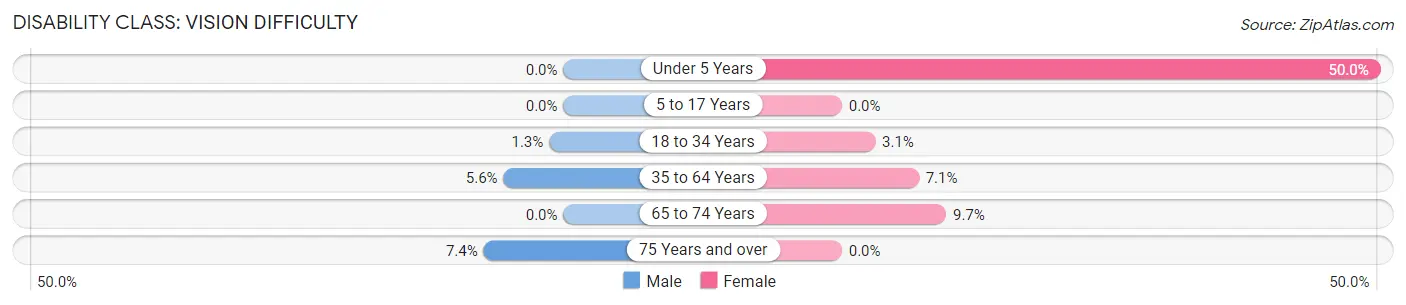
| Age Bracket | Male | Female |
| Under 5 Years | 0 (0.0%) | 9 (50.0%) |
| 5 to 17 Years | 0 (0.0%) | 0 (0.0%) |
| 18 to 34 Years | 2 (1.3%) | 5 (3.1%) |
| 35 to 64 Years | 15 (5.6%) | 14 (7.1%) |
| 65 to 74 Years | 0 (0.0%) | 3 (9.7%) |
| 75 Years and over | 2 (7.4%) | 0 (0.0%) |
Disability Class: Cognitive Difficulty
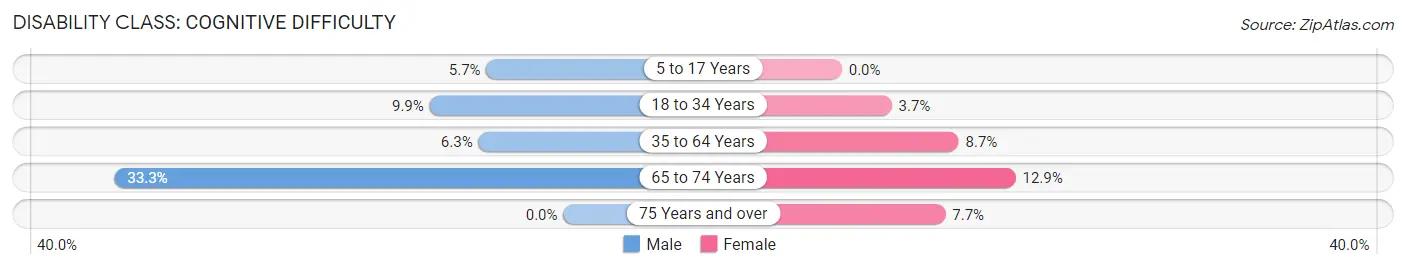
| Age Bracket | Male | Female |
| 5 to 17 Years | 6 (5.7%) | 0 (0.0%) |
| 18 to 34 Years | 15 (9.9%) | 6 (3.7%) |
| 35 to 64 Years | 17 (6.3%) | 17 (8.7%) |
| 65 to 74 Years | 9 (33.3%) | 4 (12.9%) |
| 75 Years and over | 0 (0.0%) | 1 (7.7%) |
Disability Class: Ambulatory Difficulty
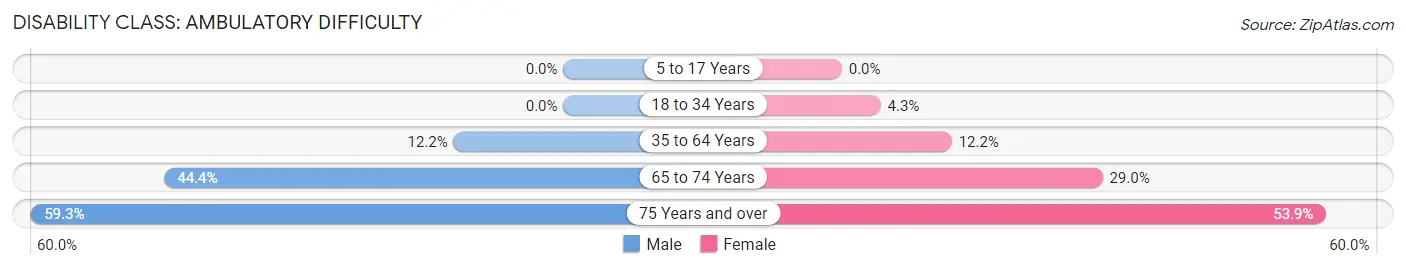
| Age Bracket | Male | Female |
| 5 to 17 Years | 0 (0.0%) | 0 (0.0%) |
| 18 to 34 Years | 0 (0.0%) | 7 (4.3%) |
| 35 to 64 Years | 33 (12.2%) | 24 (12.2%) |
| 65 to 74 Years | 12 (44.4%) | 9 (29.0%) |
| 75 Years and over | 16 (59.3%) | 7 (53.8%) |
Disability Class: Self-Care Difficulty
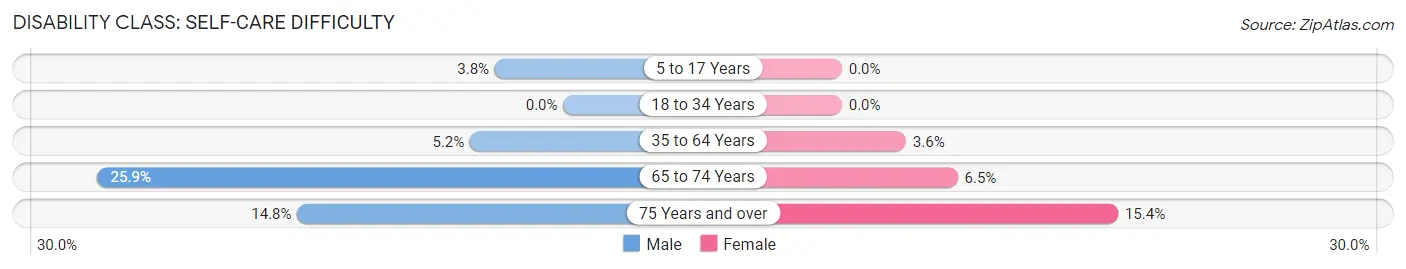
| Age Bracket | Male | Female |
| 5 to 17 Years | 4 (3.8%) | 0 (0.0%) |
| 18 to 34 Years | 0 (0.0%) | 0 (0.0%) |
| 35 to 64 Years | 14 (5.2%) | 7 (3.6%) |
| 65 to 74 Years | 7 (25.9%) | 2 (6.5%) |
| 75 Years and over | 4 (14.8%) | 2 (15.4%) |
Technology Access in Plummer
Computing Device Access in Plummer
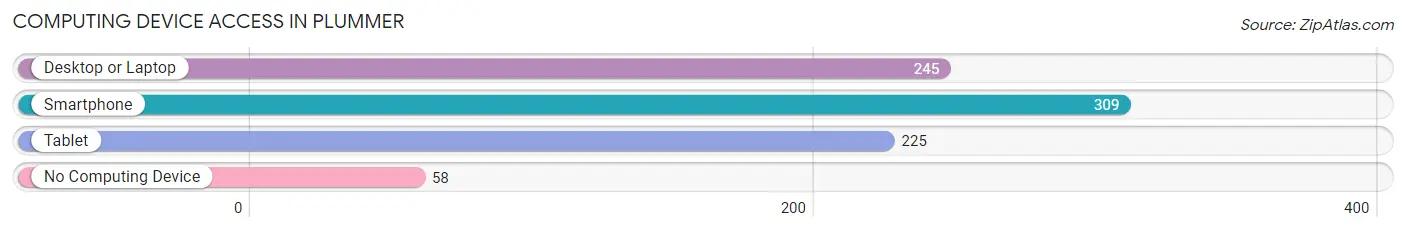
| Device Type | # Households | % Households |
| Desktop or Laptop | 245 | 61.6% |
| Smartphone | 309 | 77.6% |
| Tablet | 225 | 56.5% |
| No Computing Device | 58 | 14.6% |
| Total | 398 | 100.0% |
Internet Access in Plummer
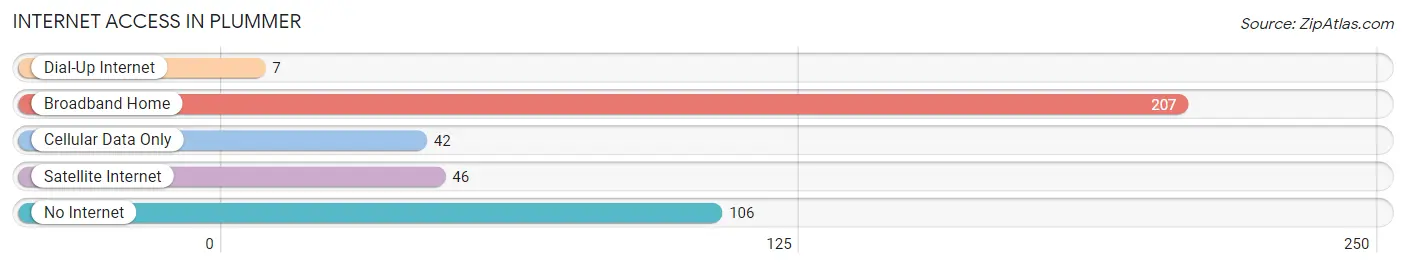
| Internet Type | # Households | % Households |
| Dial-Up Internet | 7 | 1.8% |
| Broadband Home | 207 | 52.0% |
| Cellular Data Only | 42 | 10.5% |
| Satellite Internet | 46 | 11.6% |
| No Internet | 106 | 26.6% |
| Total | 398 | 100.0% |
Plummer Summary
Plummer is a small city located in the northern part of the state of Idaho, in the United States. It is situated in the Coeur d'Alene Indian Reservation, and is the county seat of Benewah County. The city has a population of 1,715 people, according to the 2010 census.
History
The area that is now Plummer was originally inhabited by the Coeur d'Alene tribe of Native Americans. The tribe had lived in the area for centuries before the arrival of European settlers. The first white settlers arrived in the area in the late 1800s, and the town of Plummer was officially established in 1891. The town was named after the Plummer family, who were among the first settlers in the area.
The town grew slowly over the years, and by the early 1900s, it had become a bustling community. The town was home to a variety of businesses, including a hotel, a bank, a sawmill, and a general store. The town also had a school, a post office, and a newspaper.
Geography
Plummer is located in the northern part of Idaho, in the Coeur d'Alene Indian Reservation. The city is situated in the foothills of the Rocky Mountains, and is surrounded by forests and rolling hills. The city is located at an elevation of 2,743 feet above sea level.
The climate in Plummer is generally mild, with warm summers and cold winters. The average temperature in the summer is around 70 degrees Fahrenheit, and the average temperature in the winter is around 30 degrees Fahrenheit.
Economy
The economy of Plummer is largely based on agriculture and tourism. The city is home to several farms, which produce a variety of crops, including potatoes, wheat, and hay. The city is also home to several tourist attractions, including the Coeur d'Alene National Forest, the Coeur d'Alene River, and the Coeur d'Alene Lake.
The city is also home to several businesses, including a grocery store, a hardware store, and a variety of restaurants. The city is also home to a number of manufacturing companies, which produce a variety of products, including furniture, clothing, and electronics.
Demographics
According to the 2010 census, the population of Plummer was 1,715 people. The population is largely made up of Native Americans, with the majority of the population being of Coeur d'Alene descent. The city also has a small population of white people, as well as a small population of African Americans and Hispanics.
The median household income in Plummer is $30,000, and the median home value is $90,000. The city has a high rate of poverty, with nearly 30% of the population living below the poverty line. The unemployment rate in Plummer is also high, with nearly 10% of the population being unemployed.
Conclusion
Plummer is a small city located in the northern part of Idaho, in the Coeur d'Alene Indian Reservation. The city has a population of 1,715 people, and is largely made up of Native Americans. The economy of Plummer is largely based on agriculture and tourism, and the city is home to several businesses and tourist attractions. The median household income in Plummer is $30,000, and the median home value is $90,000. The city has a high rate of poverty, with nearly 30% of the population living below the poverty line.
Common Questions
What is Per Capita Income in Plummer?
Per Capita income in Plummer is $23,744.
What is the Median Family Income in Plummer?
Median Family Income in Plummer is $56,042.
What is the Median Household income in Plummer?
Median Household Income in Plummer is $50,227.
What is Income or Wage Gap in Plummer?
Income or Wage Gap in Plummer is 17.5%.
Women in Plummer earn 82.5 cents for every dollar earned by a man.
What is Family Income Deficit in Plummer?
Family Income Deficit in Plummer is $10,312.
Families that are below poverty line in Plummer earn $10,312 less on average than the poverty threshold level.
What is Inequality or Gini Index in Plummer?
Inequality or Gini Index in Plummer is 0.40.
What is the Total Population of Plummer?
Total Population of Plummer is 1,158.
What is the Total Male Population of Plummer?
Total Male Population of Plummer is 610.
What is the Total Female Population of Plummer?
Total Female Population of Plummer is 548.
What is the Ratio of Males per 100 Females in Plummer?
There are 111.31 Males per 100 Females in Plummer.
What is the Ratio of Females per 100 Males in Plummer?
There are 89.84 Females per 100 Males in Plummer.
What is the Median Population Age in Plummer?
Median Population Age in Plummer is 33.8 Years.
What is the Average Family Size in Plummer
Average Family Size in Plummer is 3.7 People.
What is the Average Household Size in Plummer
Average Household Size in Plummer is 2.9 People.
How Large is the Labor Force in Plummer?
There are 564 People in the Labor Forcein in Plummer.
What is the Percentage of People in the Labor Force in Plummer?
62.0% of People are in the Labor Force in Plummer.
What is the Unemployment Rate in Plummer?
Unemployment Rate in Plummer is 4.3%.