Minidoka, ID Map & Demographics
Minidoka Map
Minidoka Overview
$10,687
PER CAPITA INCOME
$38,571
AVG FAMILY INCOME
$37,946
AVG HOUSEHOLD INCOME
0.20
INEQUALITY / GINI INDEX
175
TOTAL POPULATION
92
MALE POPULATION
83
FEMALE POPULATION
110.84
MALES / 100 FEMALES
90.22
FEMALES / 100 MALES
24.5
MEDIAN AGE
4.3
AVG FAMILY SIZE
4.1
AVG HOUSEHOLD SIZE
63
LABOR FORCE [ PEOPLE ]
61.2%
PERCENT IN LABOR FORCE
20.6%
UNEMPLOYMENT RATE
Minidoka Area Codes
Income in Minidoka
Income Overview in Minidoka
Per Capita Income in Minidoka is $10,687, while median incomes of families and households are $38,571 and $37,946 respectively.
| Characteristic | Number | Measure |
| Per Capita Income | 175 | $10,687 |
| Median Family Income | 36 | $38,571 |
| Mean Family Income | 36 | $43,353 |
| Median Household Income | 43 | $37,946 |
| Mean Household Income | 43 | $41,267 |
| Income Deficit | 36 | $0 |
| Wage / Income Gap (%) | 175 | 0.00% |
| Wage / Income Gap ($) | 175 | 100.00¢ per $1 |
| Gini / Inequality Index | 175 | 0.20 |
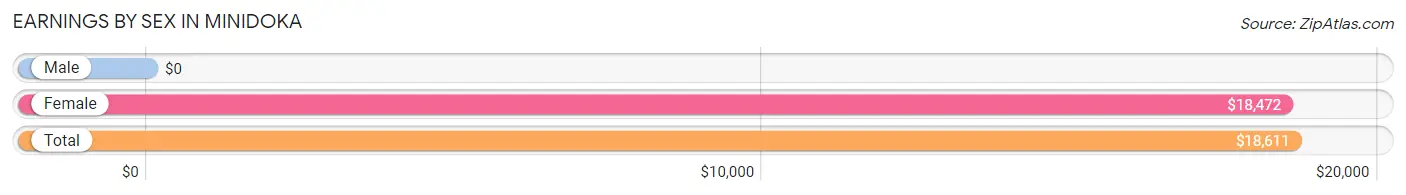
Earnings by Sex in Minidoka
| Sex | Number | Average Earnings |
| Male | 43 (63.2%) | $0 |
| Female | 25 (36.8%) | $18,472 |
| Total | 68 (100.0%) | $18,611 |
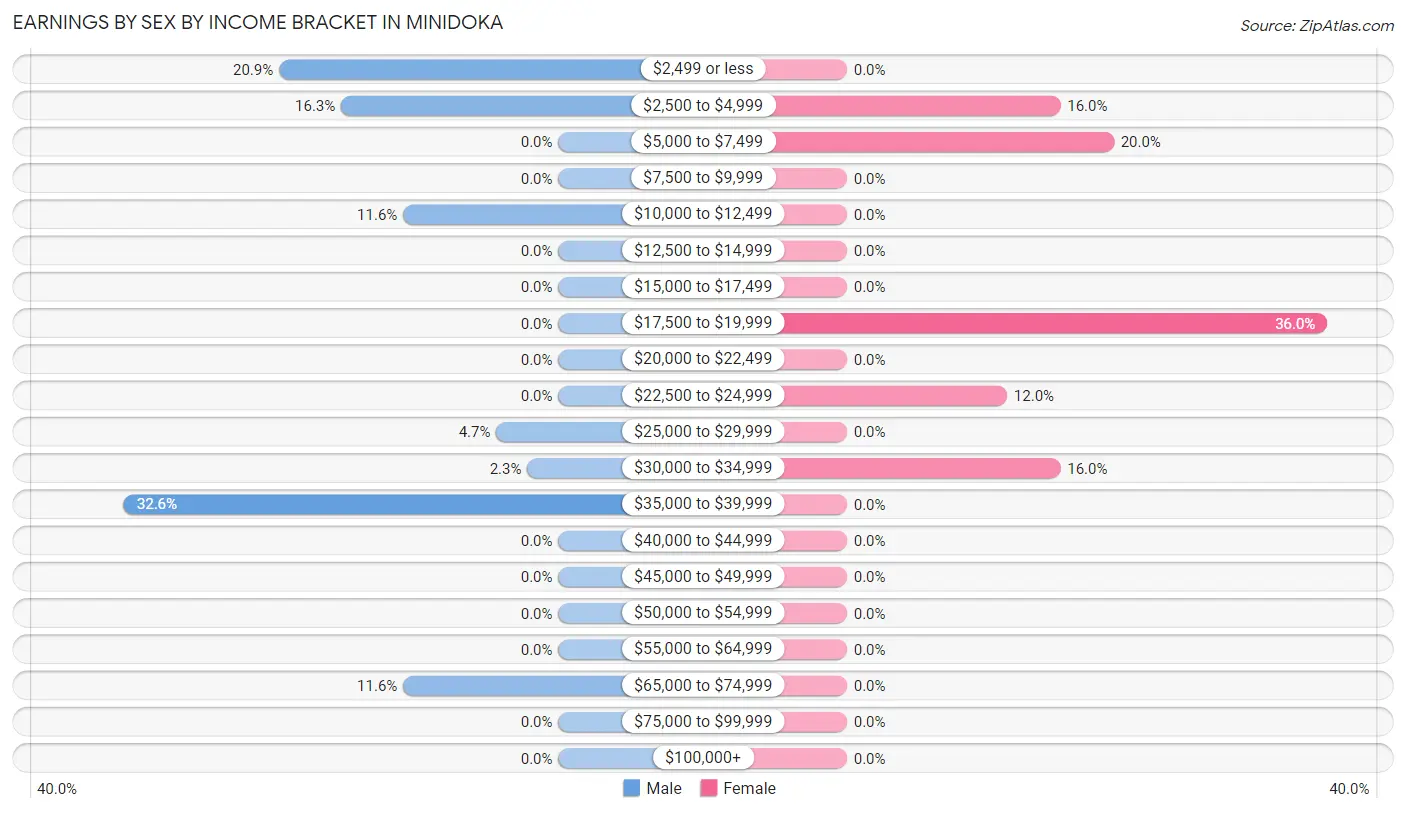
Earnings by Sex by Income Bracket in Minidoka
The most common earnings brackets in Minidoka are $35,000 to $39,999 for men (14 | 32.6%) and $17,500 to $19,999 for women (9 | 36.0%).
| Income | Male | Female |
| $2,499 or less | 9 (20.9%) | 0 (0.0%) |
| $2,500 to $4,999 | 7 (16.3%) | 4 (16.0%) |
| $5,000 to $7,499 | 0 (0.0%) | 5 (20.0%) |
| $7,500 to $9,999 | 0 (0.0%) | 0 (0.0%) |
| $10,000 to $12,499 | 5 (11.6%) | 0 (0.0%) |
| $12,500 to $14,999 | 0 (0.0%) | 0 (0.0%) |
| $15,000 to $17,499 | 0 (0.0%) | 0 (0.0%) |
| $17,500 to $19,999 | 0 (0.0%) | 9 (36.0%) |
| $20,000 to $22,499 | 0 (0.0%) | 0 (0.0%) |
| $22,500 to $24,999 | 0 (0.0%) | 3 (12.0%) |
| $25,000 to $29,999 | 2 (4.6%) | 0 (0.0%) |
| $30,000 to $34,999 | 1 (2.3%) | 4 (16.0%) |
| $35,000 to $39,999 | 14 (32.6%) | 0 (0.0%) |
| $40,000 to $44,999 | 0 (0.0%) | 0 (0.0%) |
| $45,000 to $49,999 | 0 (0.0%) | 0 (0.0%) |
| $50,000 to $54,999 | 0 (0.0%) | 0 (0.0%) |
| $55,000 to $64,999 | 0 (0.0%) | 0 (0.0%) |
| $65,000 to $74,999 | 5 (11.6%) | 0 (0.0%) |
| $75,000 to $99,999 | 0 (0.0%) | 0 (0.0%) |
| $100,000+ | 0 (0.0%) | 0 (0.0%) |
| Total | 43 (100.0%) | 25 (100.0%) |
Earnings by Sex by Educational Attainment in Minidoka
| Educational Attainment | Male Income | Female Income |
| Less than High School | - | - |
| High School Diploma | - | - |
| College or Associate's Degree | - | - |
| Bachelor's Degree | - | - |
| Graduate Degree | - | - |
| Total | - | - |
Family Income in Minidoka
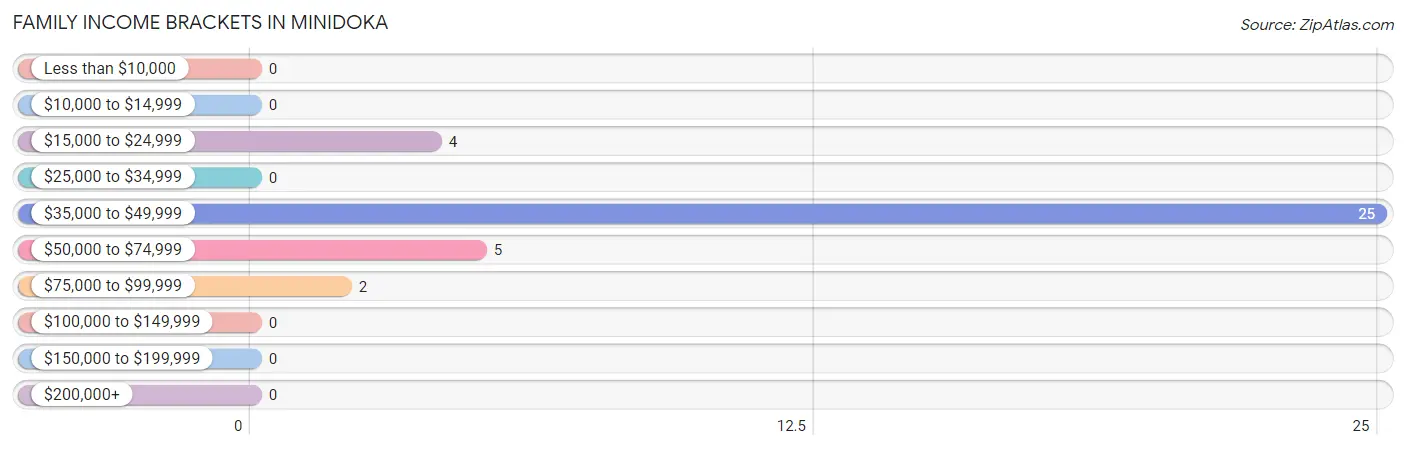
Family Income Brackets in Minidoka
According to the Minidoka family income data, there are 25 families falling into the $35,000 to $49,999 income range, which is the most common income bracket and makes up 69.4% of all families.
| Income Bracket | # Families | % Families |
| Less than $10,000 | 0 | 0.0% |
| $10,000 to $14,999 | 0 | 0.0% |
| $15,000 to $24,999 | 4 | 11.1% |
| $25,000 to $34,999 | 0 | 0.0% |
| $35,000 to $49,999 | 25 | 69.4% |
| $50,000 to $74,999 | 5 | 13.9% |
| $75,000 to $99,999 | 2 | 5.6% |
| $100,000 to $149,999 | 0 | 0.0% |
| $150,000 to $199,999 | 0 | 0.0% |
| $200,000+ | 0 | 0.0% |
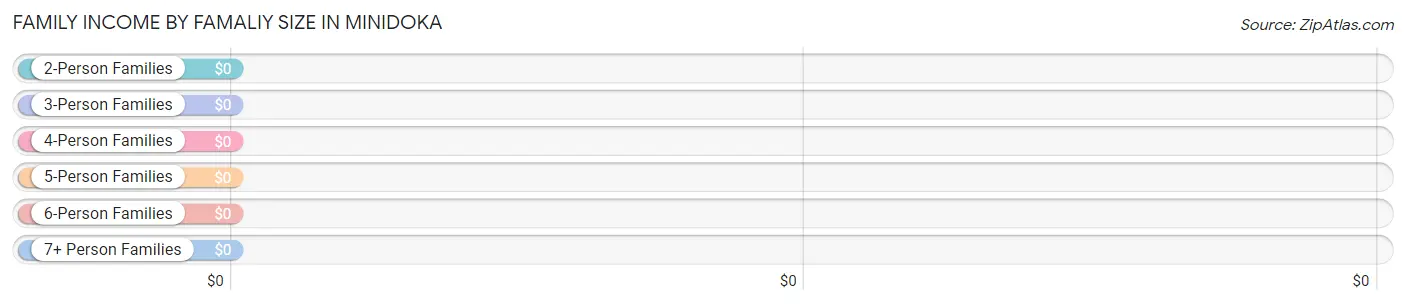
Family Income by Famaliy Size in Minidoka
| Income Bracket | # Families | Median Income |
| 2-Person Families | 12 (33.3%) | $0 |
| 3-Person Families | 4 (11.1%) | $0 |
| 4-Person Families | 0 (0.0%) | $0 |
| 5-Person Families | 14 (38.9%) | $0 |
| 6-Person Families | 4 (11.1%) | $0 |
| 7+ Person Families | 2 (5.6%) | $0 |
| Total | 36 (100.0%) | $38,571 |
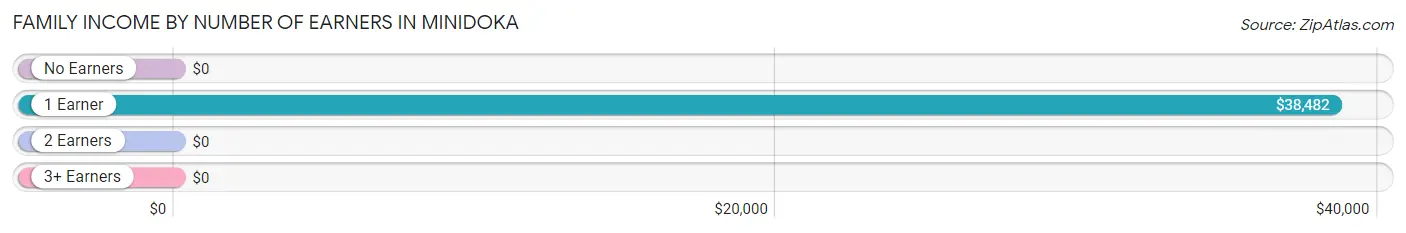
Family Income by Number of Earners in Minidoka
| Number of Earners | # Families | Median Income |
| No Earners | 0 (0.0%) | $0 |
| 1 Earner | 27 (75.0%) | $38,482 |
| 2 Earners | 3 (8.3%) | $0 |
| 3+ Earners | 6 (16.7%) | $0 |
| Total | 36 (100.0%) | $38,571 |
Household Income in Minidoka
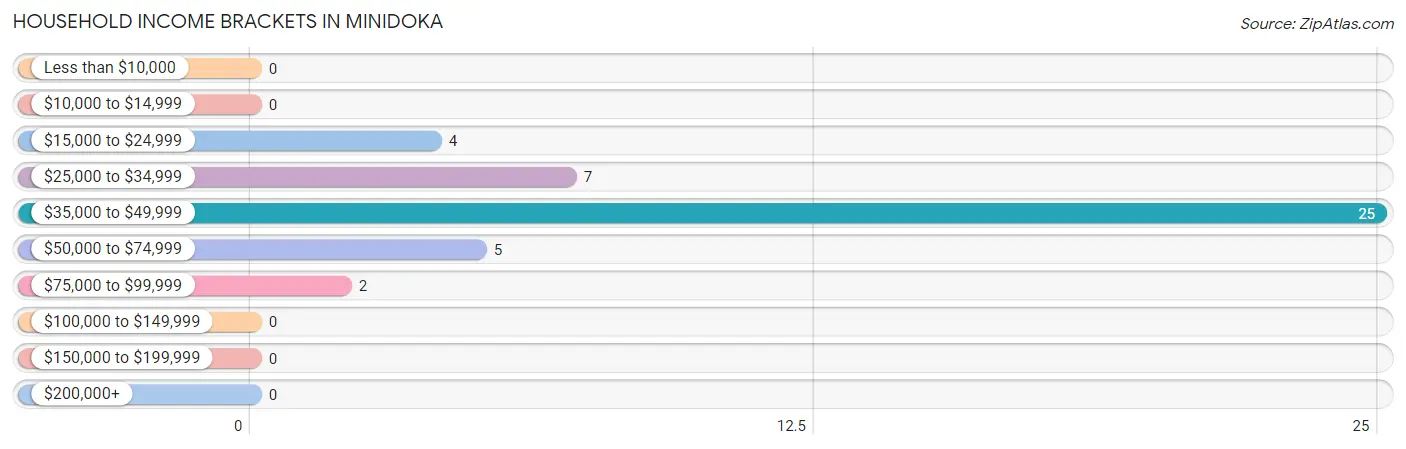
Household Income Brackets in Minidoka
With 25 households falling in the category, the $35,000 to $49,999 income range is the most frequent in Minidoka, accounting for 58.1% of all households.
| Income Bracket | # Households | % Households |
| Less than $10,000 | 0 | 0.0% |
| $10,000 to $14,999 | 0 | 0.0% |
| $15,000 to $24,999 | 4 | 9.3% |
| $25,000 to $34,999 | 7 | 16.3% |
| $35,000 to $49,999 | 25 | 58.1% |
| $50,000 to $74,999 | 5 | 11.6% |
| $75,000 to $99,999 | 2 | 4.7% |
| $100,000 to $149,999 | 0 | 0.0% |
| $150,000 to $199,999 | 0 | 0.0% |
| $200,000+ | 0 | 0.0% |
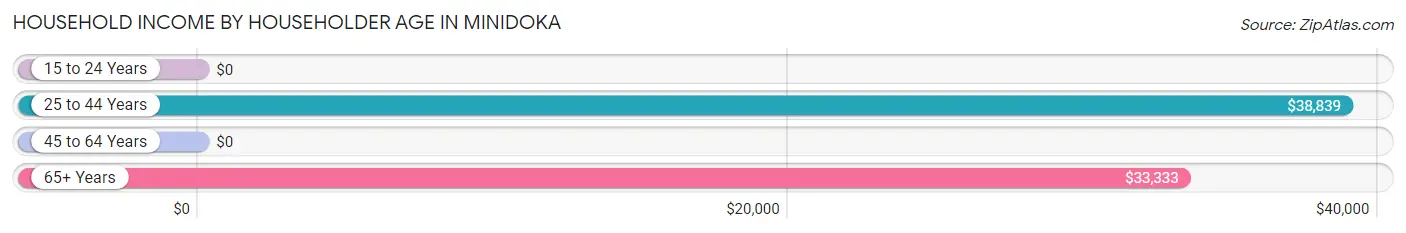
Household Income by Householder Age in Minidoka
The median household income in Minidoka is $37,946, with the highest median household income of $38,839 found in the 25 to 44 years age bracket for the primary householder. A total of 23 households (53.5%) fall into this category. Meanwhile, the 15 to 24 years age bracket for the primary householder has the lowest median household income of $0, with 4 households (9.3%) in this group.
| Income Bracket | # Households | Median Income |
| 15 to 24 Years | 4 (9.3%) | $0 |
| 25 to 44 Years | 23 (53.5%) | $38,839 |
| 45 to 64 Years | 6 (14.0%) | $0 |
| 65+ Years | 10 (23.3%) | $33,333 |
| Total | 43 (100.0%) | $37,946 |
Poverty in Minidoka
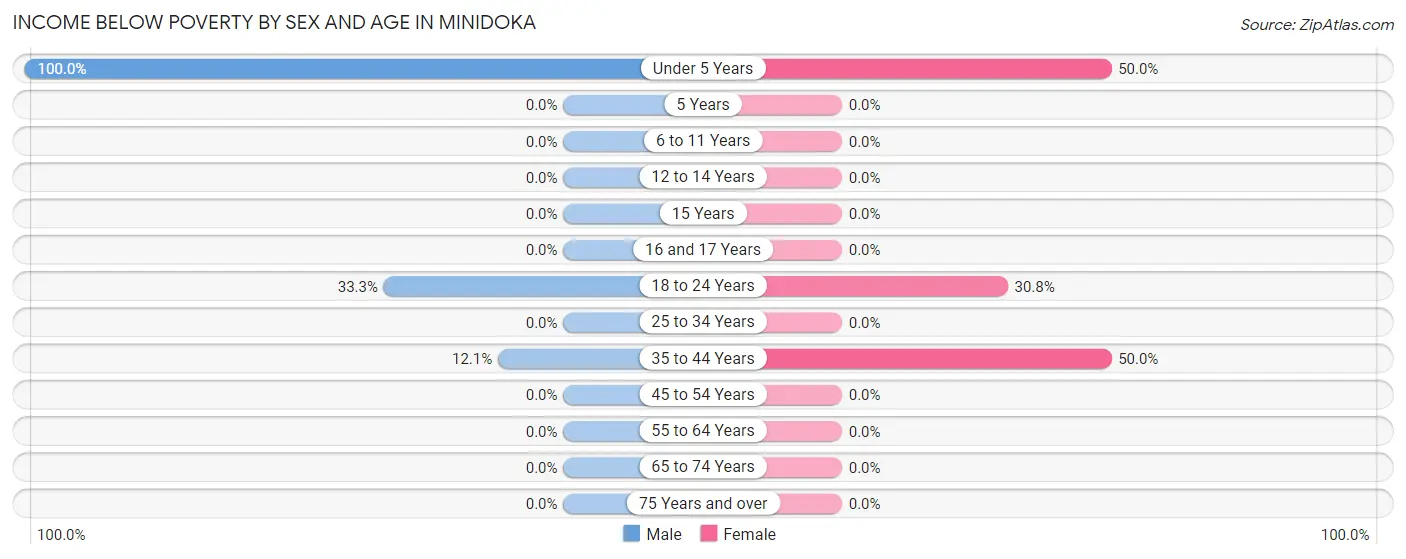
Income Below Poverty by Sex and Age in Minidoka
With 16.3% poverty level for males and 20.5% for females among the residents of Minidoka, under 5 year old males and under 5 year old females are the most vulnerable to poverty, with 10 males (100.0%) and 9 females (50.0%) in their respective age groups living below the poverty level.
| Age Bracket | Male | Female |
| Under 5 Years | 10 (100.0%) | 9 (50.0%) |
| 5 Years | 0 (0.0%) | 0 (0.0%) |
| 6 to 11 Years | 0 (0.0%) | 0 (0.0%) |
| 12 to 14 Years | 0 (0.0%) | 0 (0.0%) |
| 15 Years | 0 (0.0%) | 0 (0.0%) |
| 16 and 17 Years | 0 (0.0%) | 0 (0.0%) |
| 18 to 24 Years | 1 (33.3%) | 4 (30.8%) |
| 25 to 34 Years | 0 (0.0%) | 0 (0.0%) |
| 35 to 44 Years | 4 (12.1%) | 4 (50.0%) |
| 45 to 54 Years | 0 (0.0%) | 0 (0.0%) |
| 55 to 64 Years | 0 (0.0%) | 0 (0.0%) |
| 65 to 74 Years | 0 (0.0%) | 0 (0.0%) |
| 75 Years and over | 0 (0.0%) | 0 (0.0%) |
| Total | 15 (16.3%) | 17 (20.5%) |
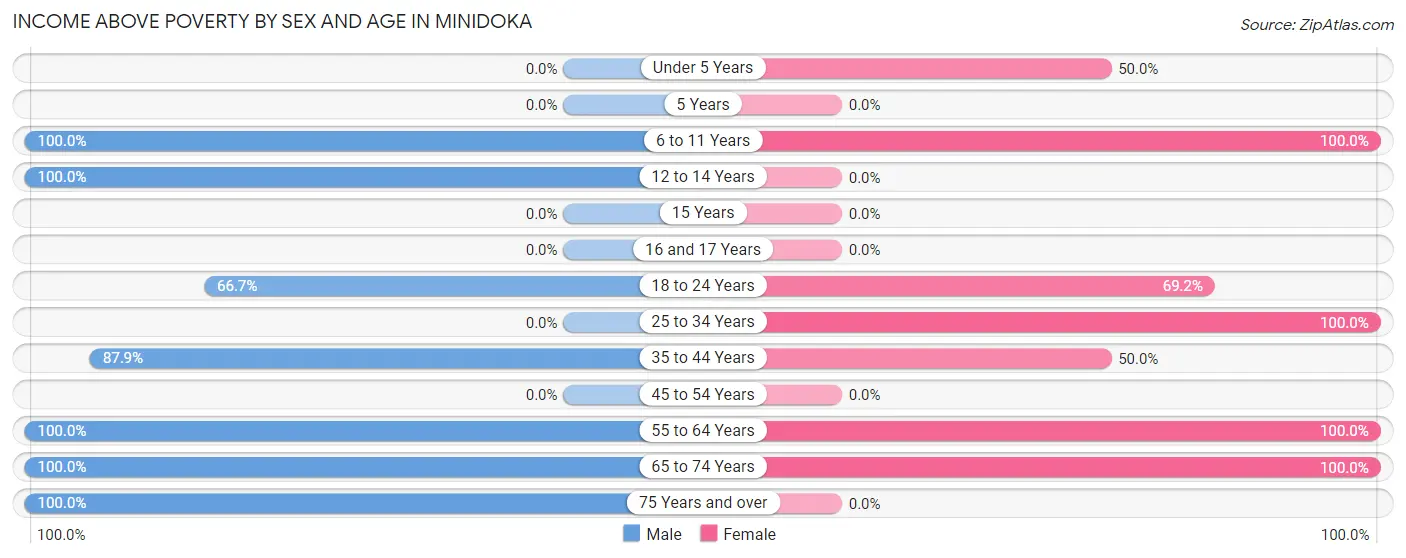
Income Above Poverty by Sex and Age in Minidoka
According to the poverty statistics in Minidoka, males aged 6 to 11 years and females aged 6 to 11 years are the age groups that are most secure financially, with 100.0% of males and 100.0% of females in these age groups living above the poverty line.
| Age Bracket | Male | Female |
| Under 5 Years | 0 (0.0%) | 9 (50.0%) |
| 5 Years | 0 (0.0%) | 0 (0.0%) |
| 6 to 11 Years | 25 (100.0%) | 12 (100.0%) |
| 12 to 14 Years | 7 (100.0%) | 0 (0.0%) |
| 15 Years | 0 (0.0%) | 0 (0.0%) |
| 16 and 17 Years | 0 (0.0%) | 0 (0.0%) |
| 18 to 24 Years | 2 (66.7%) | 9 (69.2%) |
| 25 to 34 Years | 0 (0.0%) | 10 (100.0%) |
| 35 to 44 Years | 29 (87.9%) | 4 (50.0%) |
| 45 to 54 Years | 0 (0.0%) | 0 (0.0%) |
| 55 to 64 Years | 7 (100.0%) | 8 (100.0%) |
| 65 to 74 Years | 4 (100.0%) | 14 (100.0%) |
| 75 Years and over | 3 (100.0%) | 0 (0.0%) |
| Total | 77 (83.7%) | 66 (79.5%) |
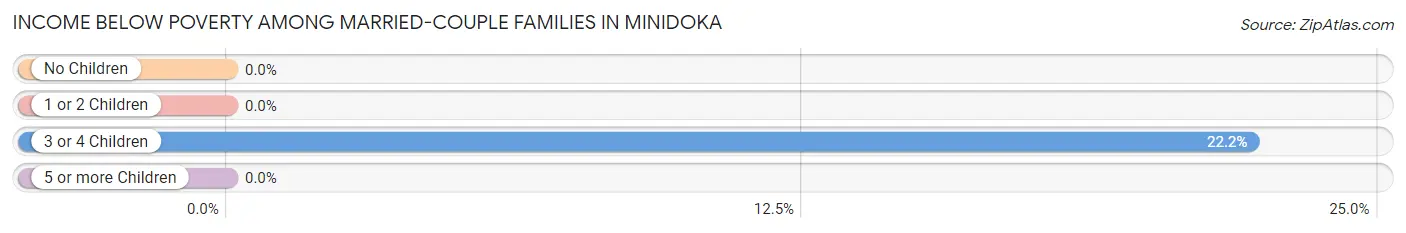
Income Below Poverty Among Married-Couple Families in Minidoka
The poverty statistics for married-couple families in Minidoka show that 12.9% or 4 of the total 31 families live below the poverty line. Families with 3 or 4 children have the highest poverty rate of 22.2%, comprising of 4 families. On the other hand, families with no children have the lowest poverty rate of 0.0%, which includes 0 families.
| Children | Above Poverty | Below Poverty |
| No Children | 11 (100.0%) | 0 (0.0%) |
| 1 or 2 Children | 2 (100.0%) | 0 (0.0%) |
| 3 or 4 Children | 14 (77.8%) | 4 (22.2%) |
| 5 or more Children | 0 (0.0%) | 0 (0.0%) |
| Total | 27 (87.1%) | 4 (12.9%) |
Income Below Poverty Among Single-Parent Households in Minidoka
| Children | Single Father | Single Mother |
| No Children | 0 (0.0%) | 0 (0.0%) |
| 1 or 2 Children | 0 (0.0%) | 0 (0.0%) |
| 3 or 4 Children | 0 (0.0%) | 0 (0.0%) |
| 5 or more Children | 0 (0.0%) | 0 (0.0%) |
| Total | 0 (0.0%) | 0 (0.0%) |
Income Below Poverty Among Married-Couple vs Single-Parent Households in Minidoka
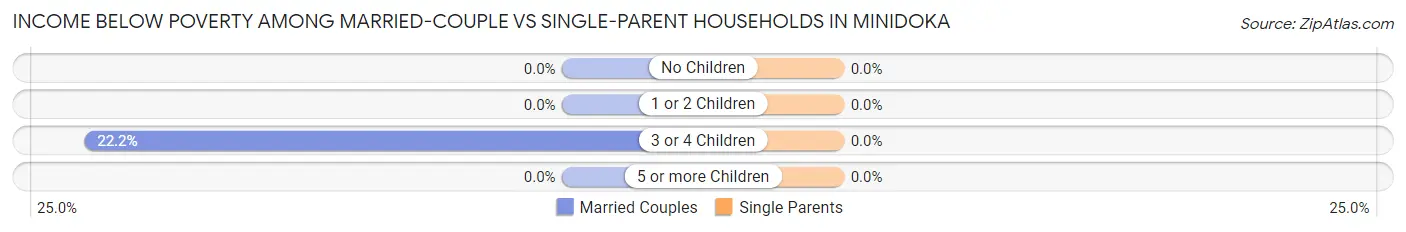
| Children | Married-Couple Families | Single-Parent Households |
| No Children | 0 (0.0%) | 0 (0.0%) |
| 1 or 2 Children | 0 (0.0%) | 0 (0.0%) |
| 3 or 4 Children | 4 (22.2%) | 0 (0.0%) |
| 5 or more Children | 0 (0.0%) | 0 (0.0%) |
| Total | 4 (12.9%) | 0 (0.0%) |
Race in Minidoka
The most populous races in Minidoka are Hispanic or Latino (129 | 73.7%), Some other Race (78 | 44.6%), and Two or more Races (51 | 29.1%).
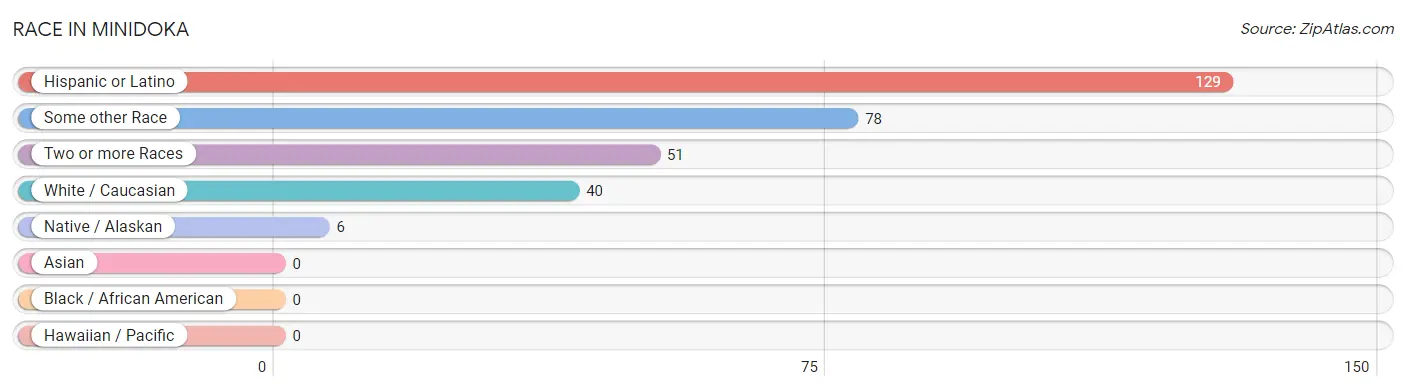
| Race | # Population | % Population |
| Asian | 0 | 0.0% |
| Black / African American | 0 | 0.0% |
| Hawaiian / Pacific | 0 | 0.0% |
| Hispanic or Latino | 129 | 73.7% |
| Native / Alaskan | 6 | 3.4% |
| White / Caucasian | 40 | 22.9% |
| Two or more Races | 51 | 29.1% |
| Some other Race | 78 | 44.6% |
| Total | 175 | 100.0% |
Ancestry in Minidoka
The most populous ancestries reported in Minidoka are Mexican (117 | 66.9%), French (12 | 6.9%), American (6 | 3.4%), Mexican American Indian (6 | 3.4%), and Scotch-Irish (4 | 2.3%), together accounting for 82.9% of all Minidoka residents.
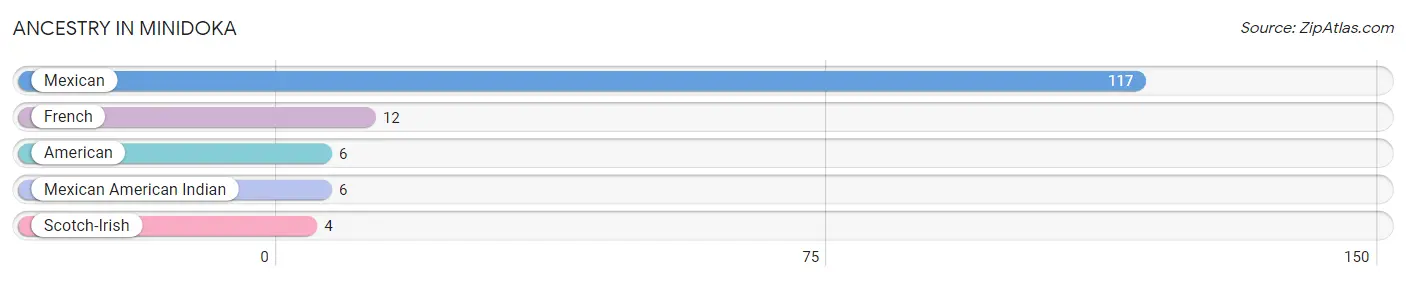
| Ancestry | # Population | % Population |
| American | 6 | 3.4% |
| French | 12 | 6.9% |
| Mexican | 117 | 66.9% |
| Mexican American Indian | 6 | 3.4% |
| Scotch-Irish | 4 | 2.3% | View All 5 Rows |
Immigrants in Minidoka
The most numerous immigrant groups reported in Minidoka came from Central America (51 | 29.1%), Latin America (51 | 29.1%), Mexico (51 | 29.1%), and Canada (3 | 1.7%), together accounting for 89.1% of all Minidoka residents.
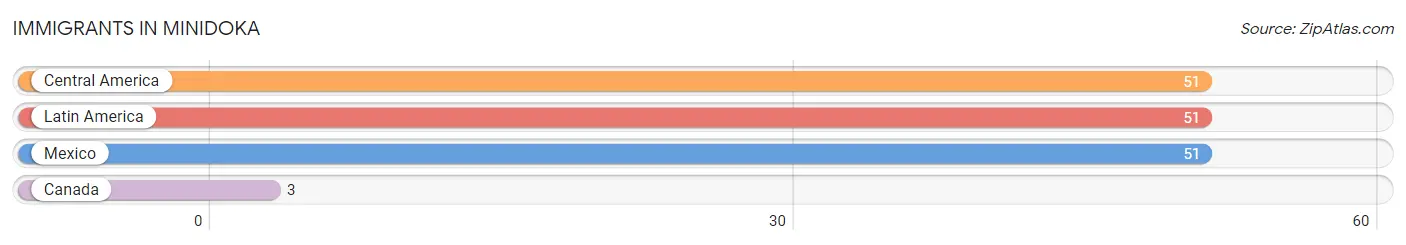
| Immigration Origin | # Population | % Population |
| Canada | 3 | 1.7% |
| Central America | 51 | 29.1% |
| Latin America | 51 | 29.1% |
| Mexico | 51 | 29.1% | View All 4 Rows |
Sex and Age in Minidoka
Sex and Age in Minidoka
The most populous age groups in Minidoka are 10 to 14 Years (28 | 30.4%) for men and Under 5 Years (18 | 21.7%) for women.
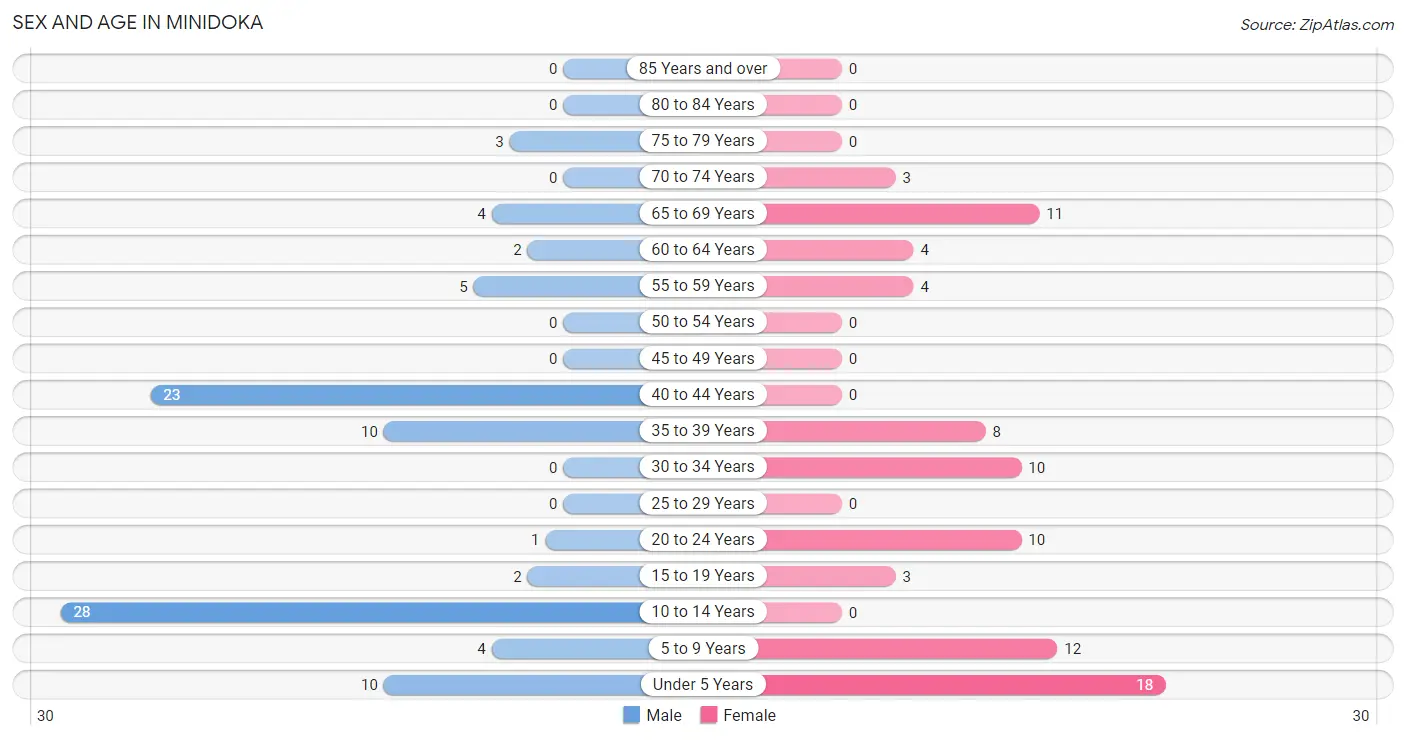
| Age Bracket | Male | Female |
| Under 5 Years | 10 (10.9%) | 18 (21.7%) |
| 5 to 9 Years | 4 (4.3%) | 12 (14.5%) |
| 10 to 14 Years | 28 (30.4%) | 0 (0.0%) |
| 15 to 19 Years | 2 (2.2%) | 3 (3.6%) |
| 20 to 24 Years | 1 (1.1%) | 10 (12.0%) |
| 25 to 29 Years | 0 (0.0%) | 0 (0.0%) |
| 30 to 34 Years | 0 (0.0%) | 10 (12.0%) |
| 35 to 39 Years | 10 (10.9%) | 8 (9.6%) |
| 40 to 44 Years | 23 (25.0%) | 0 (0.0%) |
| 45 to 49 Years | 0 (0.0%) | 0 (0.0%) |
| 50 to 54 Years | 0 (0.0%) | 0 (0.0%) |
| 55 to 59 Years | 5 (5.4%) | 4 (4.8%) |
| 60 to 64 Years | 2 (2.2%) | 4 (4.8%) |
| 65 to 69 Years | 4 (4.3%) | 11 (13.3%) |
| 70 to 74 Years | 0 (0.0%) | 3 (3.6%) |
| 75 to 79 Years | 3 (3.3%) | 0 (0.0%) |
| 80 to 84 Years | 0 (0.0%) | 0 (0.0%) |
| 85 Years and over | 0 (0.0%) | 0 (0.0%) |
| Total | 92 (100.0%) | 83 (100.0%) |
Families and Households in Minidoka
Median Family Size in Minidoka
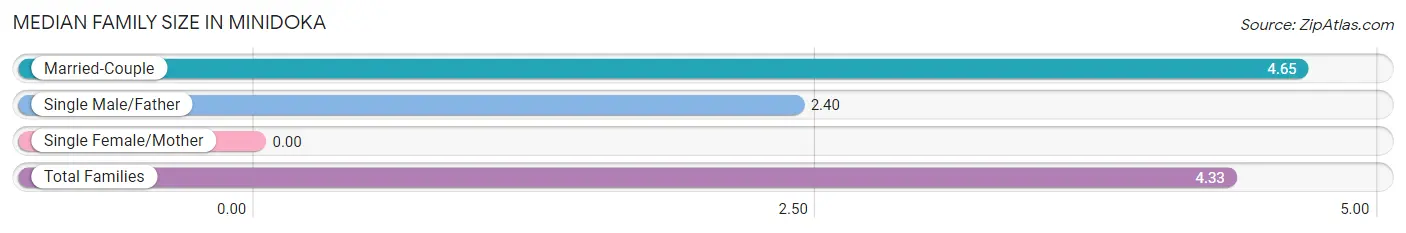
| Family Type | # Families | Family Size |
| Married-Couple | 31 (86.1%) | 4.65 |
| Single Male/Father | 5 (13.9%) | 2.40 |
| Single Female/Mother | 0 (0.0%) | - |
| Total Families | 36 (100.0%) | 4.33 |
Median Household Size in Minidoka
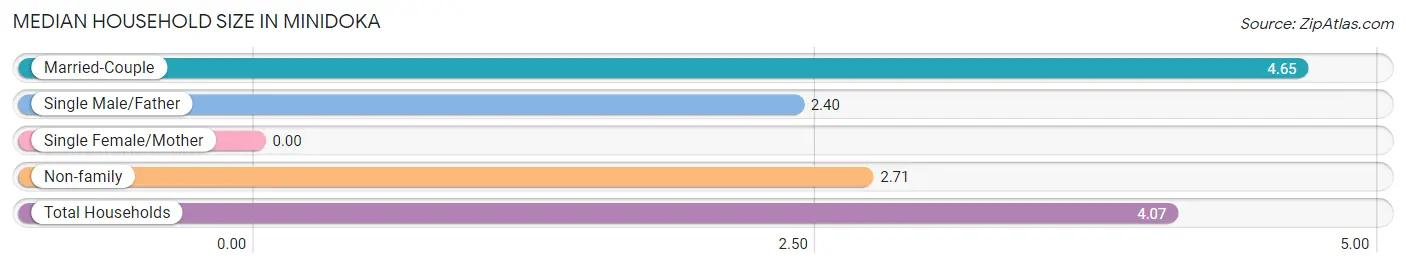
| Household Type | # Households | Household Size |
| Married-Couple | 31 (72.1%) | 4.65 |
| Single Male/Father | 5 (11.6%) | 2.40 |
| Single Female/Mother | 0 (0.0%) | - |
| Non-family | 7 (16.3%) | 2.71 |
| Total Households | 43 (100.0%) | 4.07 |
Household Size by Marriage Status in Minidoka
Out of a total of 43 households in Minidoka, 36 (83.7%) are family households, while 7 (16.3%) are nonfamily households. The most numerous type of family households are 5-person households, comprising 14, and the most common type of nonfamily households are 3-person households, comprising 4.

| Household Size | Family Households | Nonfamily Households |
| 1-Person Households | - | 3 (7.0%) |
| 2-Person Households | 12 (27.9%) | 0 (0.0%) |
| 3-Person Households | 4 (9.3%) | 4 (9.3%) |
| 4-Person Households | 0 (0.0%) | 0 (0.0%) |
| 5-Person Households | 14 (32.6%) | 0 (0.0%) |
| 6-Person Households | 4 (9.3%) | 0 (0.0%) |
| 7+ Person Households | 2 (4.6%) | 0 (0.0%) |
| Total | 36 (83.7%) | 7 (16.3%) |
Female Fertility in Minidoka
Fertility by Age in Minidoka
Average fertility rate in Minidoka is 129.0 births per 1,000 women. Women in the age bracket of 20 to 34 years have the highest fertility rate with 200.0 births per 1,000 women. Women in the age bracket of 20 to 34 years acount for 100.0% of all women with births.
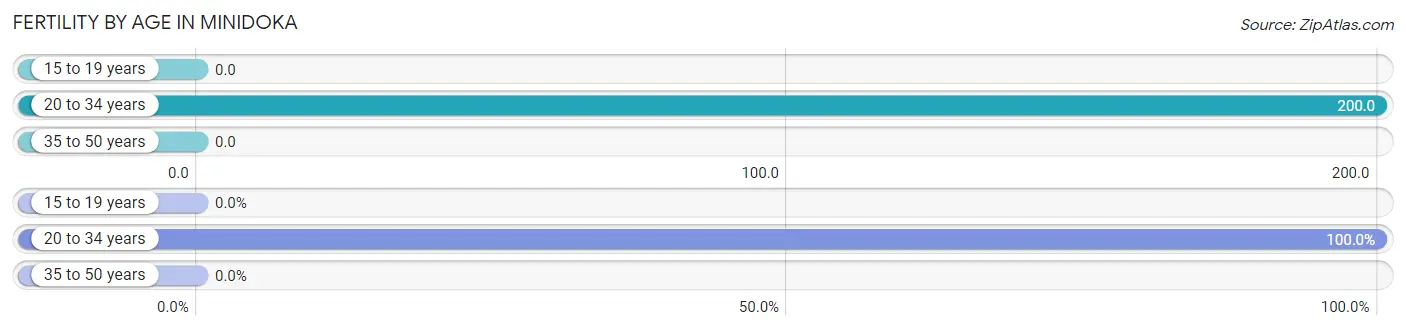
| Age Bracket | Women with Births | Births / 1,000 Women |
| 15 to 19 years | 0 (0.0%) | 0.0 |
| 20 to 34 years | 4 (100.0%) | 200.0 |
| 35 to 50 years | 0 (0.0%) | 0.0 |
| Total | 4 (100.0%) | 129.0 |
Fertility by Age by Marriage Status in Minidoka
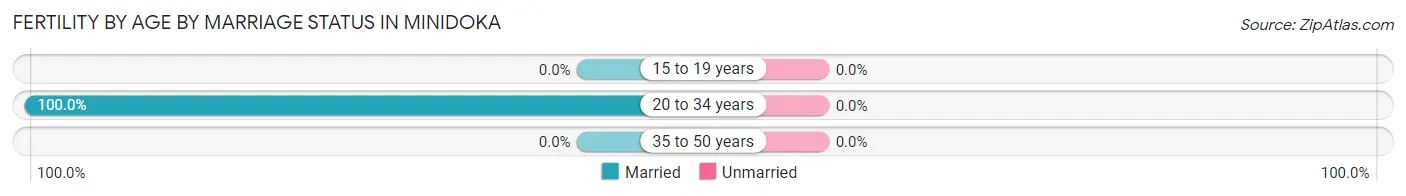
| Age Bracket | Married | Unmarried |
| 15 to 19 years | 0 (0.0%) | 0 (0.0%) |
| 20 to 34 years | 4 (100.0%) | 0 (0.0%) |
| 35 to 50 years | 0 (0.0%) | 0 (0.0%) |
| Total | 4 (100.0%) | 0 (0.0%) |
Fertility by Education in Minidoka
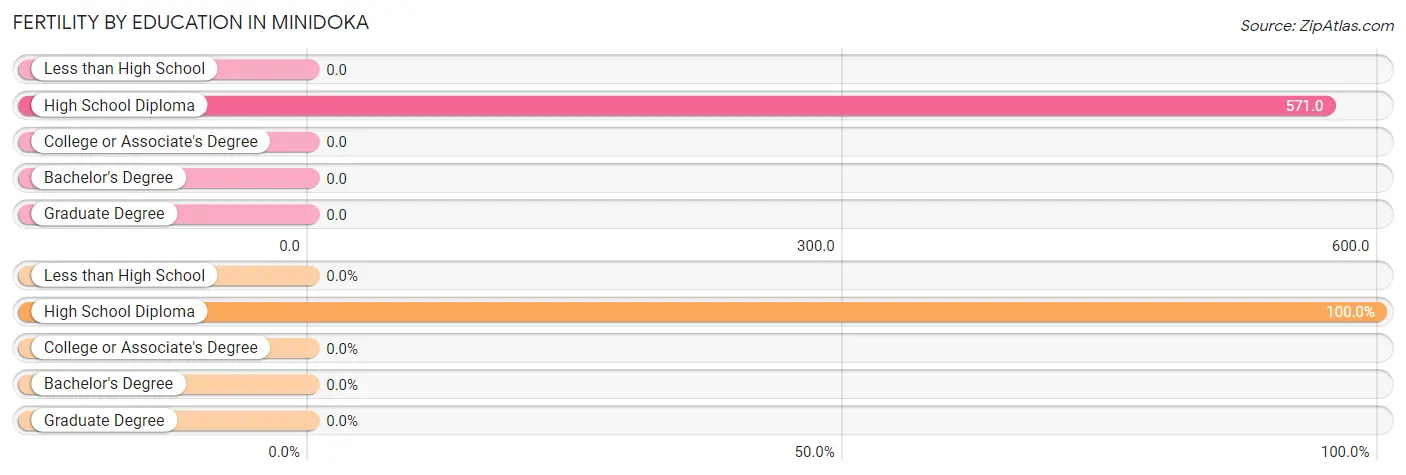
| Educational Attainment | Women with Births | Births / 1,000 Women |
| Less than High School | 0 (0.0%) | 0.0 |
| High School Diploma | 4 (100.0%) | 571.0 |
| College or Associate's Degree | 0 (0.0%) | 0.0 |
| Bachelor's Degree | 0 (0.0%) | 0.0 |
| Graduate Degree | 0 (0.0%) | 0.0 |
| Total | 4 (100.0%) | 129.0 |
Fertility by Education by Marriage Status in Minidoka
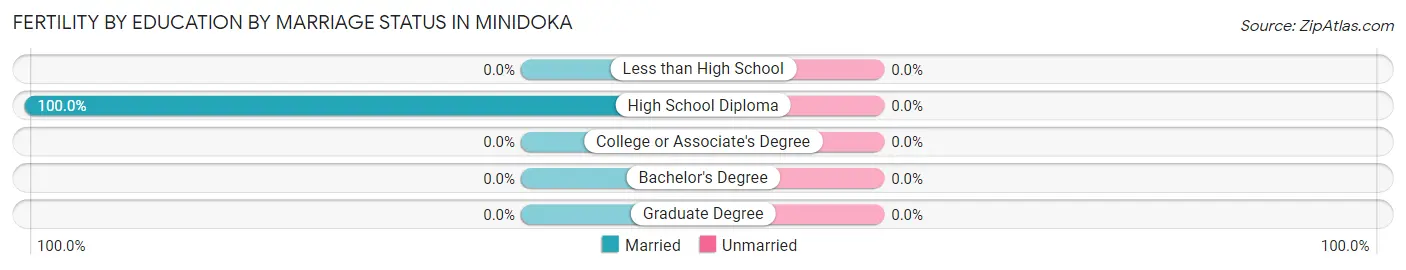
| Educational Attainment | Married | Unmarried |
| Less than High School | 0 (0.0%) | 0 (0.0%) |
| High School Diploma | 4 (100.0%) | 0 (0.0%) |
| College or Associate's Degree | 0 (0.0%) | 0 (0.0%) |
| Bachelor's Degree | 0 (0.0%) | 0 (0.0%) |
| Graduate Degree | 0 (0.0%) | 0 (0.0%) |
| Total | 4 (100.0%) | 0 (0.0%) |
Employment Characteristics in Minidoka
Employment by Class of Employer in Minidoka
Among the 50 employed individuals in Minidoka, private company employees (47 | 94.0%), and not-for-profit organizations (3 | 6.0%) make up the most common classes of employment.
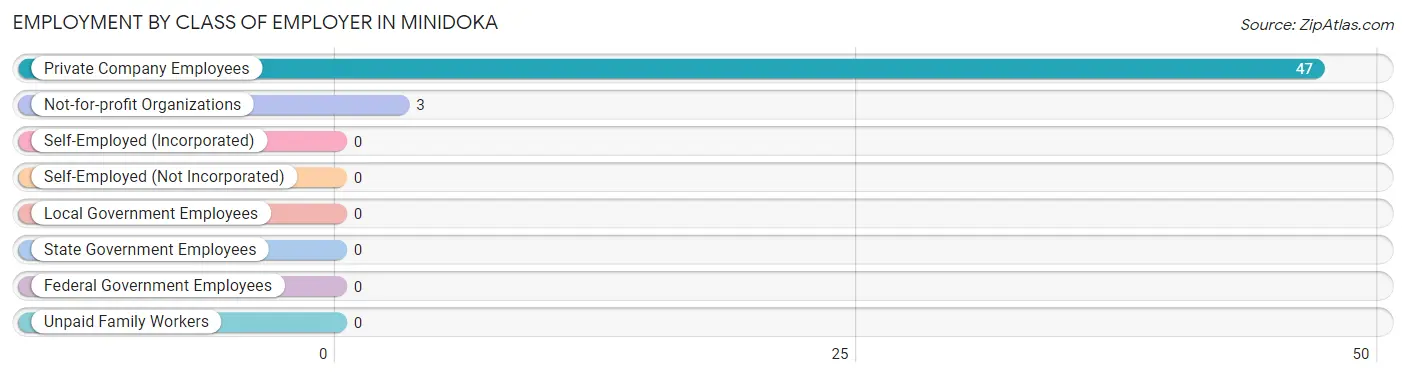
| Employer Class | # Employees | % Employees |
| Private Company Employees | 47 | 94.0% |
| Self-Employed (Incorporated) | 0 | 0.0% |
| Self-Employed (Not Incorporated) | 0 | 0.0% |
| Not-for-profit Organizations | 3 | 6.0% |
| Local Government Employees | 0 | 0.0% |
| State Government Employees | 0 | 0.0% |
| Federal Government Employees | 0 | 0.0% |
| Unpaid Family Workers | 0 | 0.0% |
| Total | 50 | 100.0% |
Employment Status by Age in Minidoka
According to the labor force statistics for Minidoka, out of the total population over 16 years of age (103), 61.2% or 63 individuals are in the labor force, with 20.6% or 13 of them unemployed. The age group with the highest labor force participation rate is 55 to 59 years, with 100.0% or 9 individuals in the labor force. Within the labor force, the 55 to 59 years age range has the highest percentage of unemployed individuals, with 100.0% or 9 of them being unemployed.
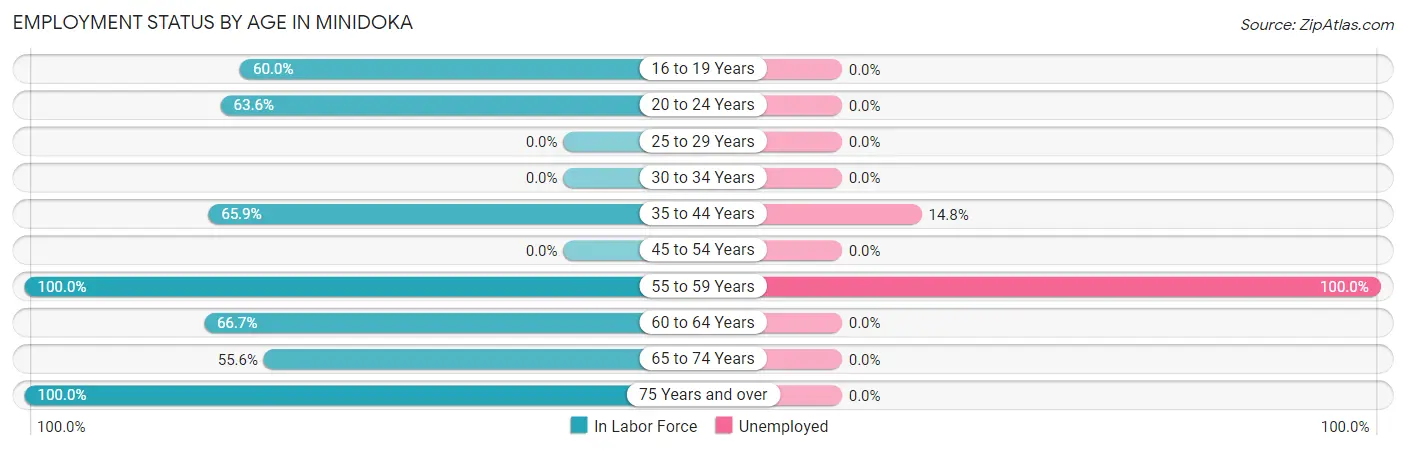
| Age Bracket | In Labor Force | Unemployed |
| 16 to 19 Years | 3 (60.0%) | 0 (0.0%) |
| 20 to 24 Years | 7 (63.6%) | 0 (0.0%) |
| 25 to 29 Years | 0 (0.0%) | 0 (0.0%) |
| 30 to 34 Years | 0 (0.0%) | 0 (0.0%) |
| 35 to 44 Years | 27 (65.9%) | 4 (14.8%) |
| 45 to 54 Years | 0 (0.0%) | 0 (0.0%) |
| 55 to 59 Years | 9 (100.0%) | 9 (100.0%) |
| 60 to 64 Years | 4 (66.7%) | 0 (0.0%) |
| 65 to 74 Years | 10 (55.6%) | 0 (0.0%) |
| 75 Years and over | 3 (100.0%) | 0 (0.0%) |
| Total | 63 (61.2%) | 13 (20.6%) |
Employment Status by Educational Attainment in Minidoka
According to labor force statistics for Minidoka, 60.6% of individuals (40) out of the total population between 25 and 64 years of age (66) are in the labor force, with 32.5% or 13 of them being unemployed. The group with the highest labor force participation rate are those with the educational attainment of high school diploma, with 100.0% or 4 individuals in the labor force. Within the labor force, individuals with high school diploma education have the highest percentage of unemployment, with 100.0% or 4 of them being unemployed.
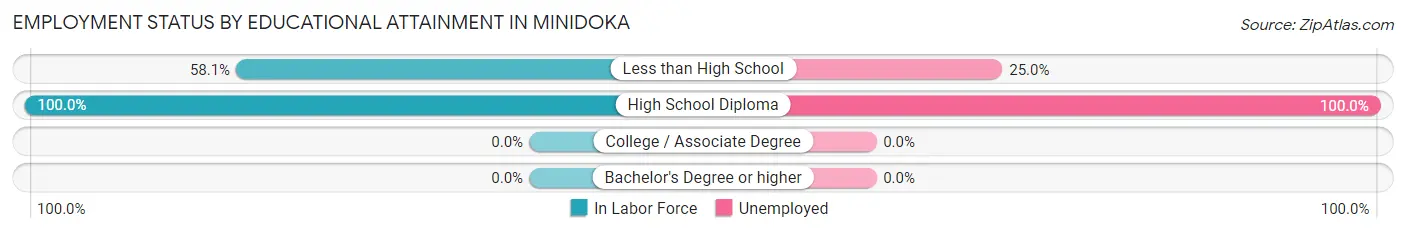
| Educational Attainment | In Labor Force | Unemployed |
| Less than High School | 36 (58.1%) | 16 (25.0%) |
| High School Diploma | 4 (100.0%) | 4 (100.0%) |
| College / Associate Degree | 0 (0.0%) | 0 (0.0%) |
| Bachelor's Degree or higher | 0 (0.0%) | 0 (0.0%) |
| Total | 40 (60.6%) | 21 (32.5%) |
Employment Occupations by Sex in Minidoka
Management, Business, Science and Arts Occupations
The most common Management, Business, Science and Arts occupations in Minidoka are Management (3 | 6.0%), Community & Social Service (3 | 6.0%), and Education Instruction & Library (3 | 6.0%).
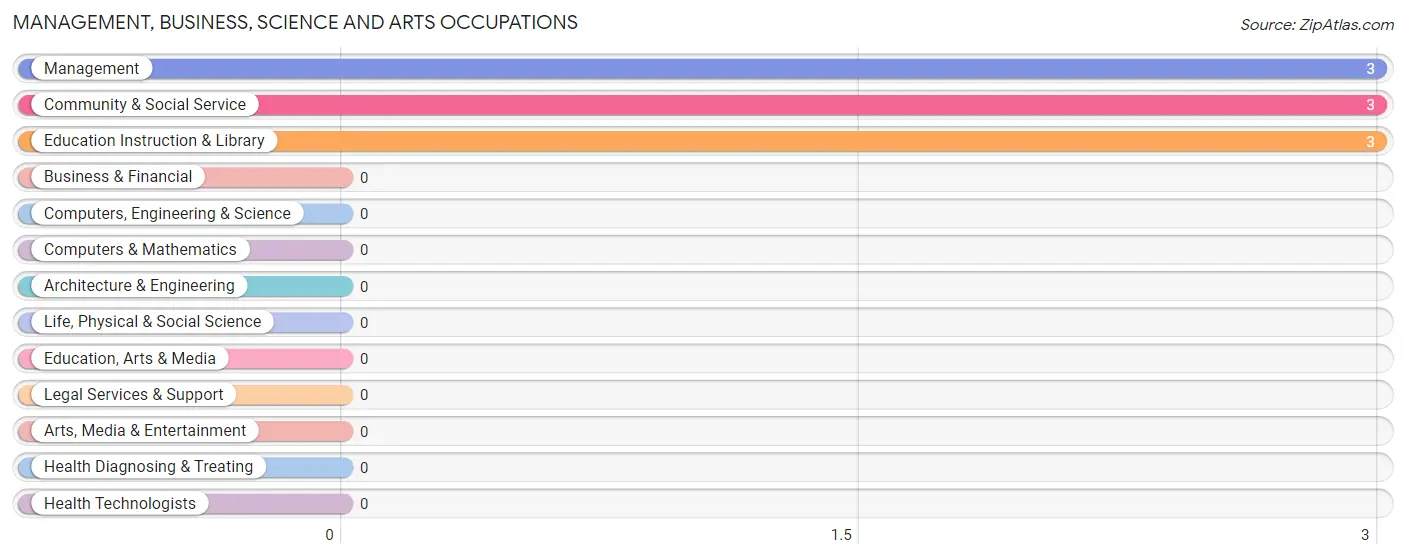
Management, Business, Science and Arts Occupations by Sex
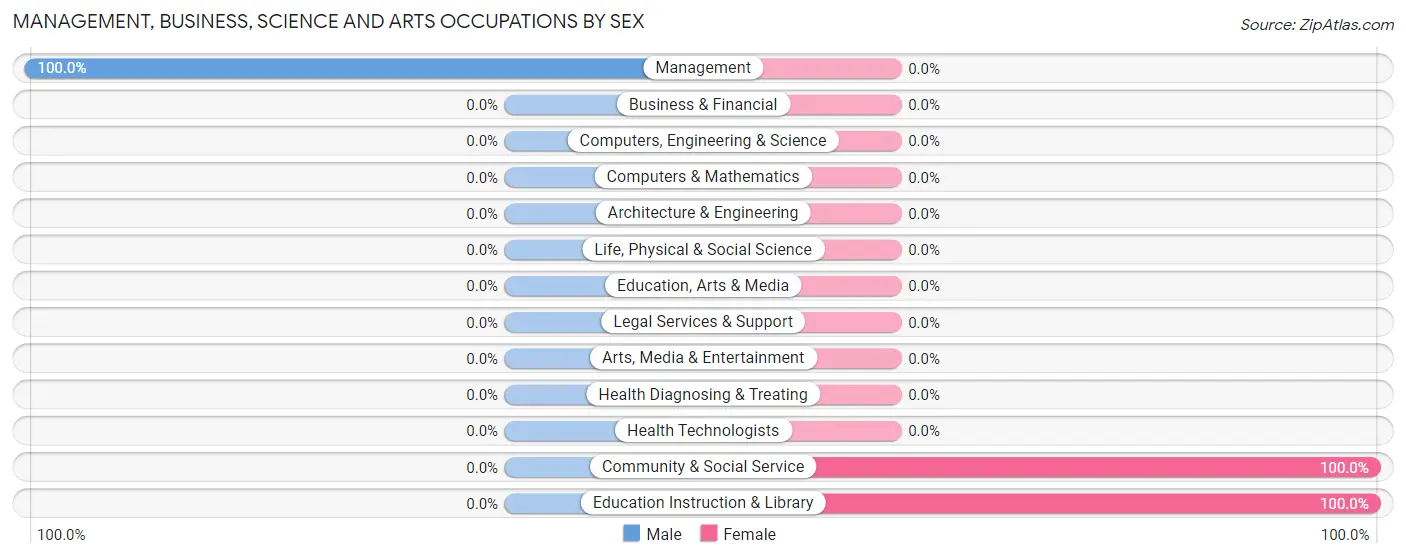
| Occupation | Male | Female |
| Management | 3 (100.0%) | 0 (0.0%) |
| Business & Financial | 0 (0.0%) | 0 (0.0%) |
| Computers, Engineering & Science | 0 (0.0%) | 0 (0.0%) |
| Computers & Mathematics | 0 (0.0%) | 0 (0.0%) |
| Architecture & Engineering | 0 (0.0%) | 0 (0.0%) |
| Life, Physical & Social Science | 0 (0.0%) | 0 (0.0%) |
| Community & Social Service | 0 (0.0%) | 3 (100.0%) |
| Education, Arts & Media | 0 (0.0%) | 0 (0.0%) |
| Legal Services & Support | 0 (0.0%) | 0 (0.0%) |
| Education Instruction & Library | 0 (0.0%) | 3 (100.0%) |
| Arts, Media & Entertainment | 0 (0.0%) | 0 (0.0%) |
| Health Diagnosing & Treating | 0 (0.0%) | 0 (0.0%) |
| Health Technologists | 0 (0.0%) | 0 (0.0%) |
| Total (Category) | 3 (50.0%) | 3 (50.0%) |
| Total (Overall) | 29 (58.0%) | 21 (42.0%) |
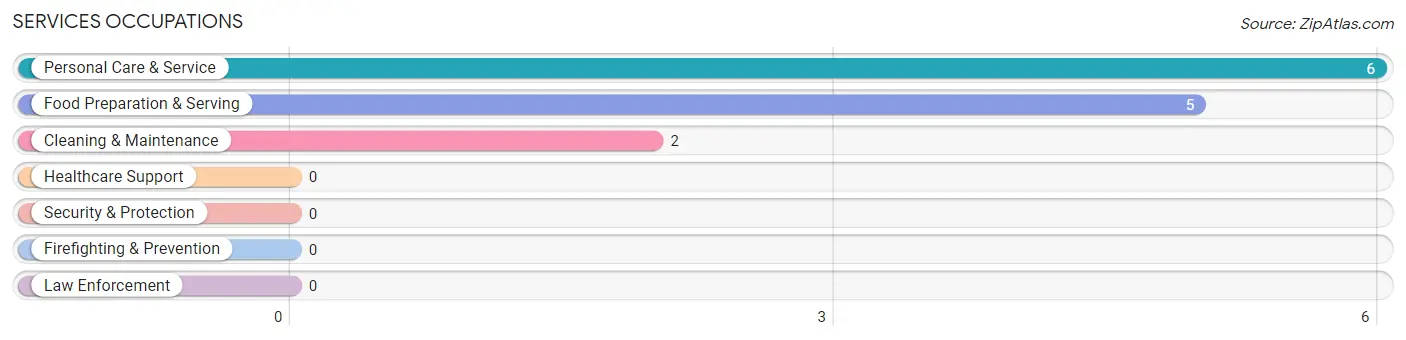
Services Occupations
The most common Services occupations in Minidoka are Personal Care & Service (6 | 12.0%), Food Preparation & Serving (5 | 10.0%), and Cleaning & Maintenance (2 | 4.0%).
Services Occupations by Sex
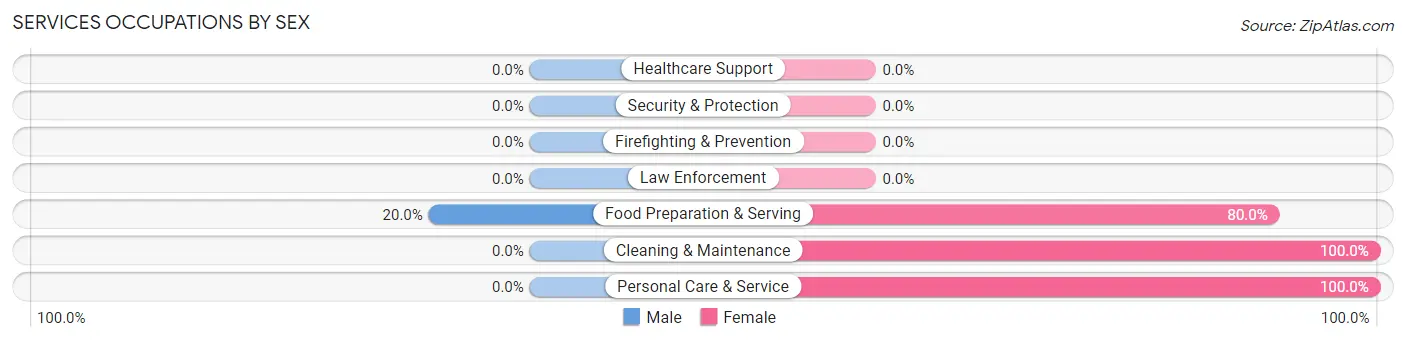
| Occupation | Male | Female |
| Healthcare Support | 0 (0.0%) | 0 (0.0%) |
| Security & Protection | 0 (0.0%) | 0 (0.0%) |
| Firefighting & Prevention | 0 (0.0%) | 0 (0.0%) |
| Law Enforcement | 0 (0.0%) | 0 (0.0%) |
| Food Preparation & Serving | 1 (20.0%) | 4 (80.0%) |
| Cleaning & Maintenance | 0 (0.0%) | 2 (100.0%) |
| Personal Care & Service | 0 (0.0%) | 6 (100.0%) |
| Total (Category) | 1 (7.7%) | 12 (92.3%) |
| Total (Overall) | 29 (58.0%) | 21 (42.0%) |
Sales and Office Occupations
The most common Sales and Office occupations in Minidoka are , and Office & Administration (3 | 6.0%).
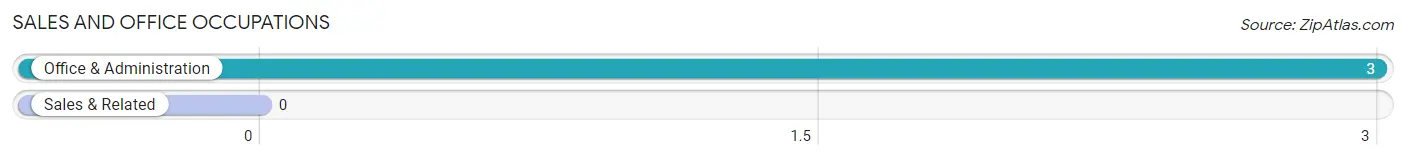
Sales and Office Occupations by Sex
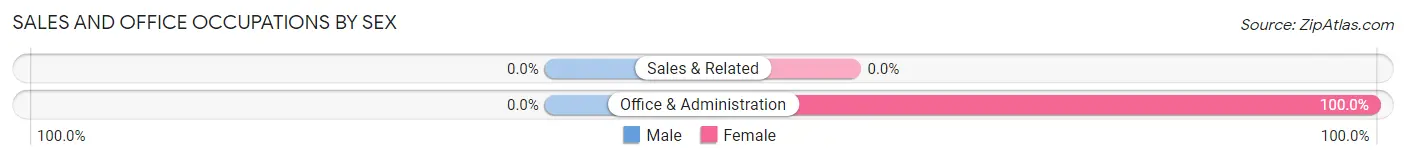
| Occupation | Male | Female |
| Sales & Related | 0 (0.0%) | 0 (0.0%) |
| Office & Administration | 0 (0.0%) | 3 (100.0%) |
| Total (Category) | 0 (0.0%) | 3 (100.0%) |
| Total (Overall) | 29 (58.0%) | 21 (42.0%) |
Natural Resources, Construction and Maintenance Occupations
The most common Natural Resources, Construction and Maintenance occupations in Minidoka are Installation, Maintenance & Repair (14 | 28.0%), and Farming, Fishing & Forestry (11 | 22.0%).
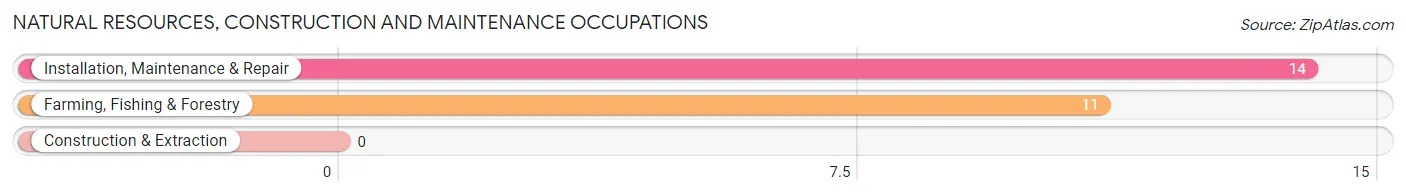
Natural Resources, Construction and Maintenance Occupations by Sex
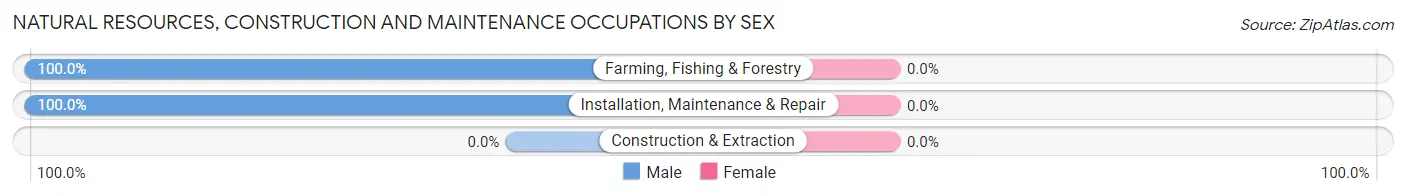
| Occupation | Male | Female |
| Farming, Fishing & Forestry | 11 (100.0%) | 0 (0.0%) |
| Construction & Extraction | 0 (0.0%) | 0 (0.0%) |
| Installation, Maintenance & Repair | 14 (100.0%) | 0 (0.0%) |
| Total (Category) | 25 (100.0%) | 0 (0.0%) |
| Total (Overall) | 29 (58.0%) | 21 (42.0%) |
Production, Transportation and Moving Occupations
The most common Production, Transportation and Moving occupations in Minidoka are , and Production (3 | 6.0%).
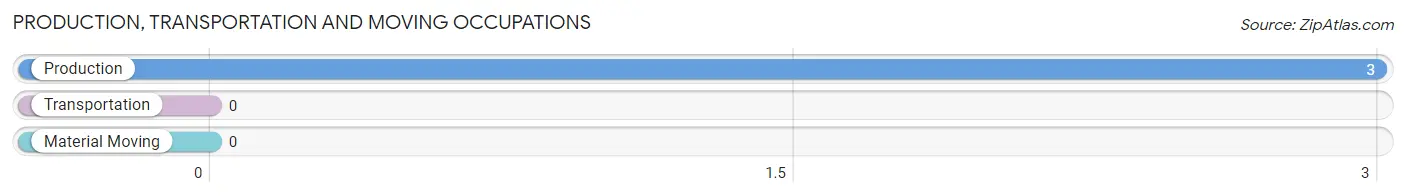
Production, Transportation and Moving Occupations by Sex
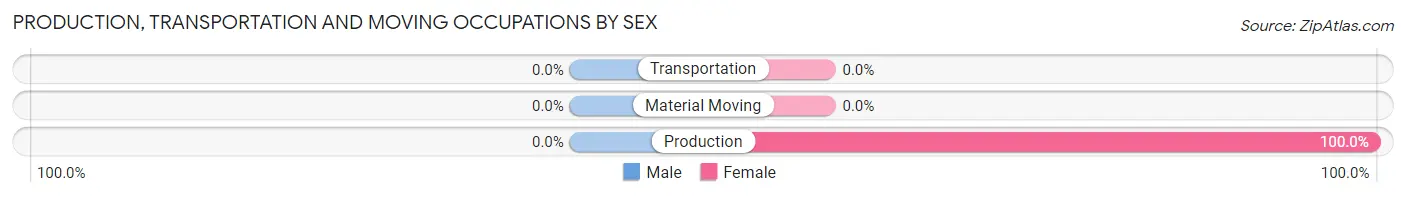
| Occupation | Male | Female |
| Production | 0 (0.0%) | 3 (100.0%) |
| Transportation | 0 (0.0%) | 0 (0.0%) |
| Material Moving | 0 (0.0%) | 0 (0.0%) |
| Total (Category) | 0 (0.0%) | 3 (100.0%) |
| Total (Overall) | 29 (58.0%) | 21 (42.0%) |
Employment Industries by Sex in Minidoka
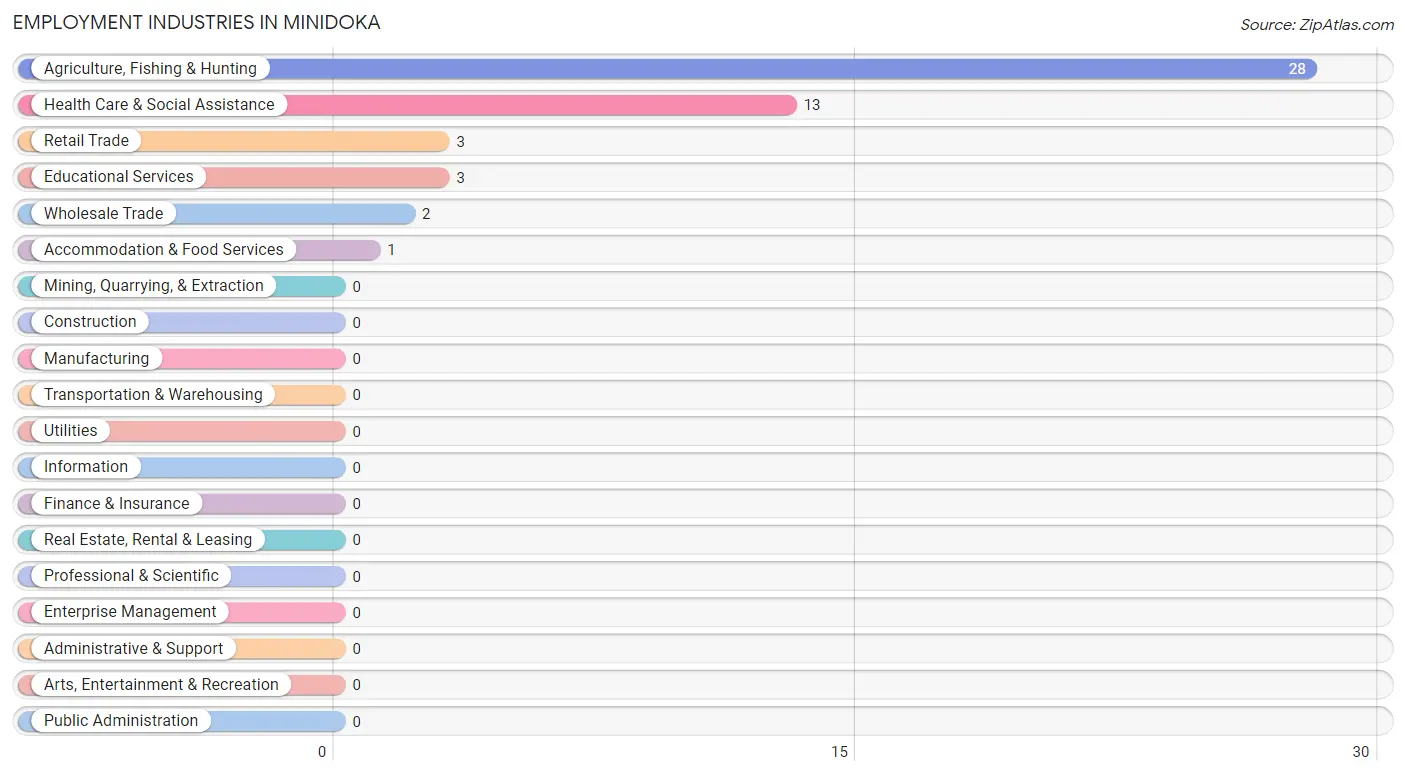
Employment Industries in Minidoka
The major employment industries in Minidoka include Agriculture, Fishing & Hunting (28 | 56.0%), Health Care & Social Assistance (13 | 26.0%), Retail Trade (3 | 6.0%), Educational Services (3 | 6.0%), and Wholesale Trade (2 | 4.0%).
Employment Industries by Sex in Minidoka
The Minidoka industries that see more men than women are Agriculture, Fishing & Hunting (100.0%), and Accommodation & Food Services (100.0%), whereas the industries that tend to have a higher number of women are Wholesale Trade (100.0%), Retail Trade (100.0%), and Educational Services (100.0%).
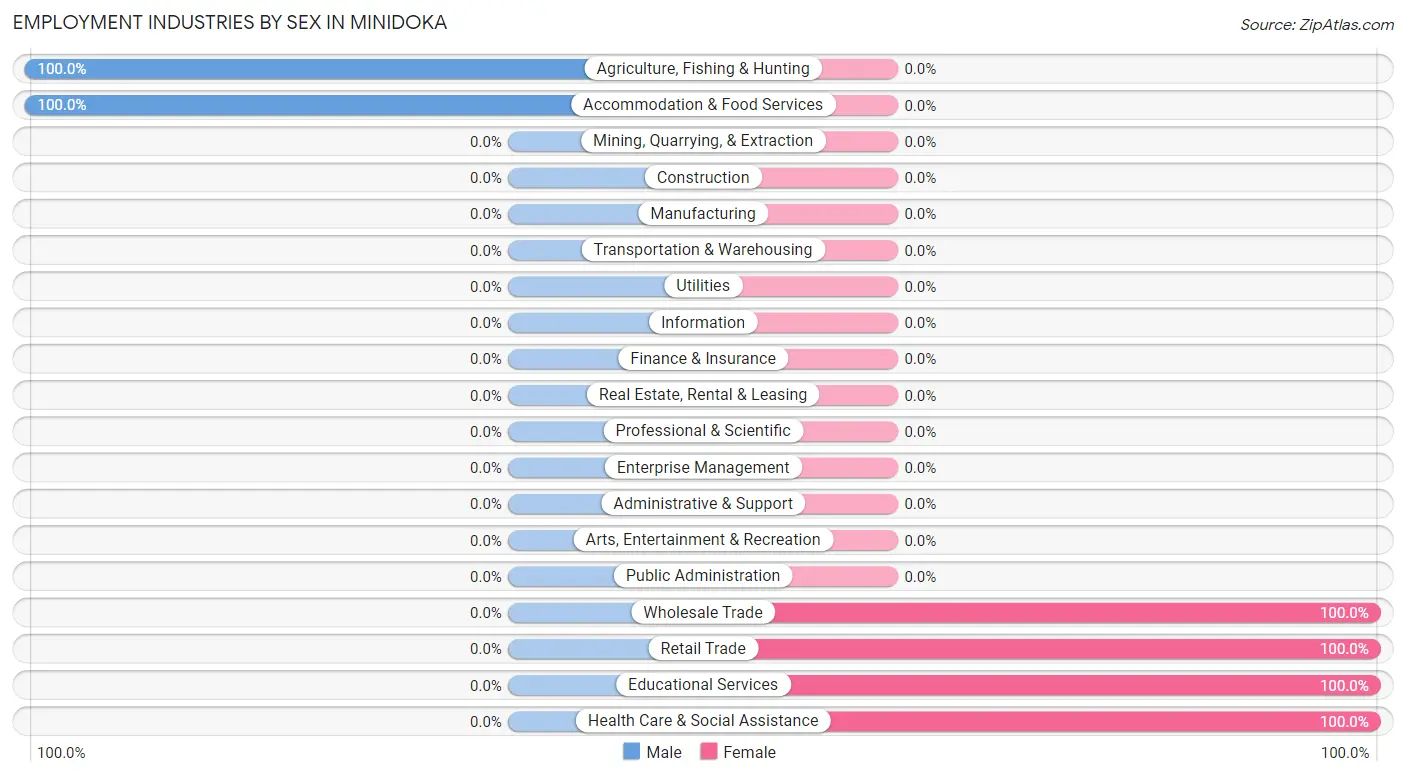
| Industry | Male | Female |
| Agriculture, Fishing & Hunting | 28 (100.0%) | 0 (0.0%) |
| Mining, Quarrying, & Extraction | 0 (0.0%) | 0 (0.0%) |
| Construction | 0 (0.0%) | 0 (0.0%) |
| Manufacturing | 0 (0.0%) | 0 (0.0%) |
| Wholesale Trade | 0 (0.0%) | 2 (100.0%) |
| Retail Trade | 0 (0.0%) | 3 (100.0%) |
| Transportation & Warehousing | 0 (0.0%) | 0 (0.0%) |
| Utilities | 0 (0.0%) | 0 (0.0%) |
| Information | 0 (0.0%) | 0 (0.0%) |
| Finance & Insurance | 0 (0.0%) | 0 (0.0%) |
| Real Estate, Rental & Leasing | 0 (0.0%) | 0 (0.0%) |
| Professional & Scientific | 0 (0.0%) | 0 (0.0%) |
| Enterprise Management | 0 (0.0%) | 0 (0.0%) |
| Administrative & Support | 0 (0.0%) | 0 (0.0%) |
| Educational Services | 0 (0.0%) | 3 (100.0%) |
| Health Care & Social Assistance | 0 (0.0%) | 13 (100.0%) |
| Arts, Entertainment & Recreation | 0 (0.0%) | 0 (0.0%) |
| Accommodation & Food Services | 1 (100.0%) | 0 (0.0%) |
| Public Administration | 0 (0.0%) | 0 (0.0%) |
| Total | 29 (58.0%) | 21 (42.0%) |
Education in Minidoka
School Enrollment in Minidoka
The most common levels of schooling among the 61 students in Minidoka are elementary school (37 | 60.7%), nursery / preschool (9 | 14.7%), and middle school (7 | 11.5%).
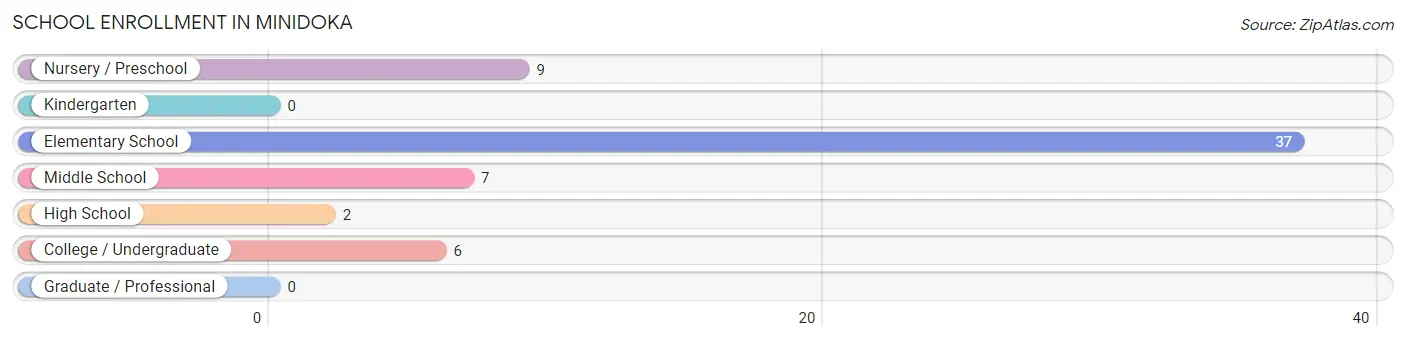
| School Level | # Students | % Students |
| Nursery / Preschool | 9 | 14.7% |
| Kindergarten | 0 | 0.0% |
| Elementary School | 37 | 60.7% |
| Middle School | 7 | 11.5% |
| High School | 2 | 3.3% |
| College / Undergraduate | 6 | 9.8% |
| Graduate / Professional | 0 | 0.0% |
| Total | 61 | 100.0% |
School Enrollment by Age by Funding Source in Minidoka
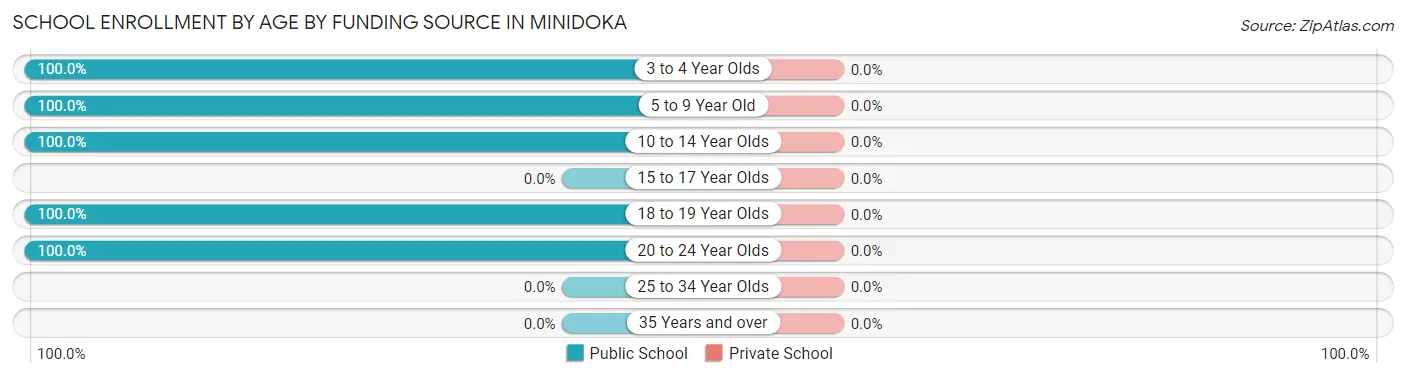
| Age Bracket | Public School | Private School |
| 3 to 4 Year Olds | 9 (100.0%) | 0 (0.0%) |
| 5 to 9 Year Old | 16 (100.0%) | 0 (0.0%) |
| 10 to 14 Year Olds | 28 (100.0%) | 0 (0.0%) |
| 15 to 17 Year Olds | 0 (0.0%) | 0 (0.0%) |
| 18 to 19 Year Olds | 2 (100.0%) | 0 (0.0%) |
| 20 to 24 Year Olds | 6 (100.0%) | 0 (0.0%) |
| 25 to 34 Year Olds | 0 (0.0%) | 0 (0.0%) |
| 35 Years and over | 0 (0.0%) | 0 (0.0%) |
| Total | 61 (100.0%) | 0 (0.0%) |
Educational Attainment by Field of Study in Minidoka
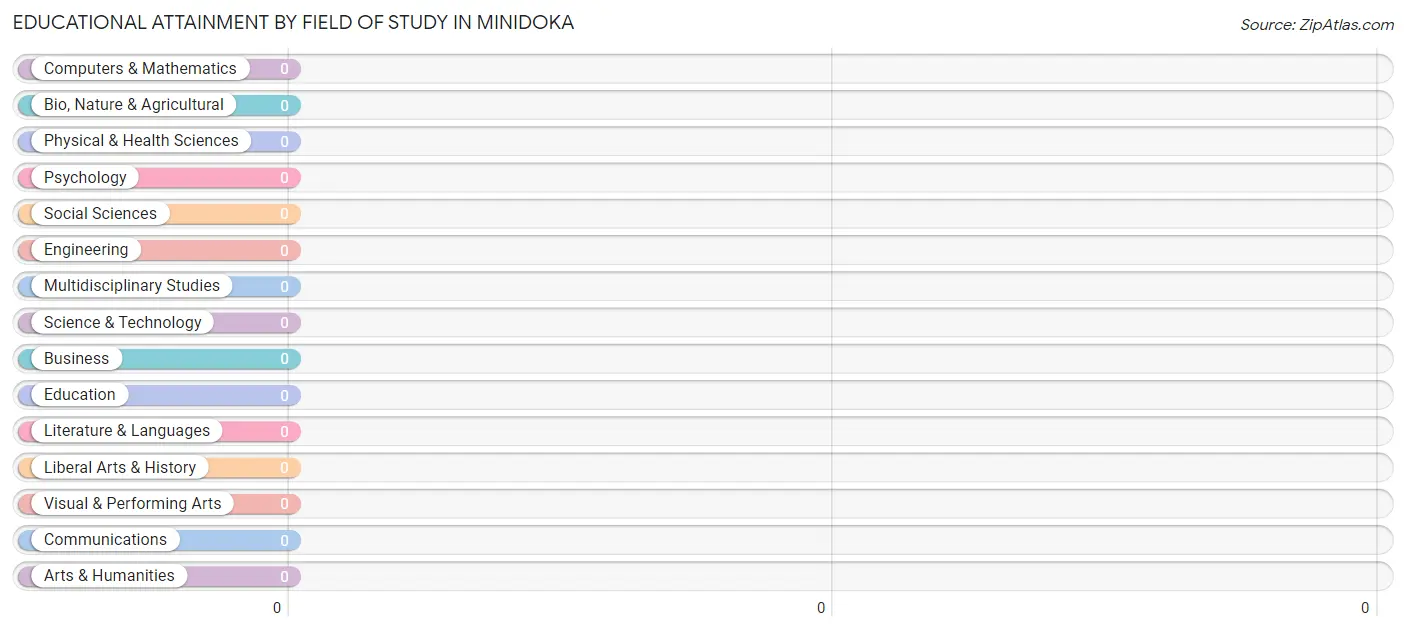
| Field of Study | # Graduates | % Graduates |
| Computers & Mathematics | 0 | 0.0% |
| Bio, Nature & Agricultural | 0 | 0.0% |
| Physical & Health Sciences | 0 | 0.0% |
| Psychology | 0 | 0.0% |
| Social Sciences | 0 | 0.0% |
| Engineering | 0 | 0.0% |
| Multidisciplinary Studies | 0 | 0.0% |
| Science & Technology | 0 | 0.0% |
| Business | 0 | 0.0% |
| Education | 0 | 0.0% |
| Literature & Languages | 0 | 0.0% |
| Liberal Arts & History | 0 | 0.0% |
| Visual & Performing Arts | 0 | 0.0% |
| Communications | 0 | 0.0% |
| Arts & Humanities | 0 | 0.0% |
| Total | 0 | 0.0% |
Transportation & Commute in Minidoka
Vehicle Availability by Sex in Minidoka
The most prevalent vehicle ownership categories in Minidoka are males with 3 vehicles (15, accounting for 51.7%) and females with 3 vehicles (0, making up 71.4%).
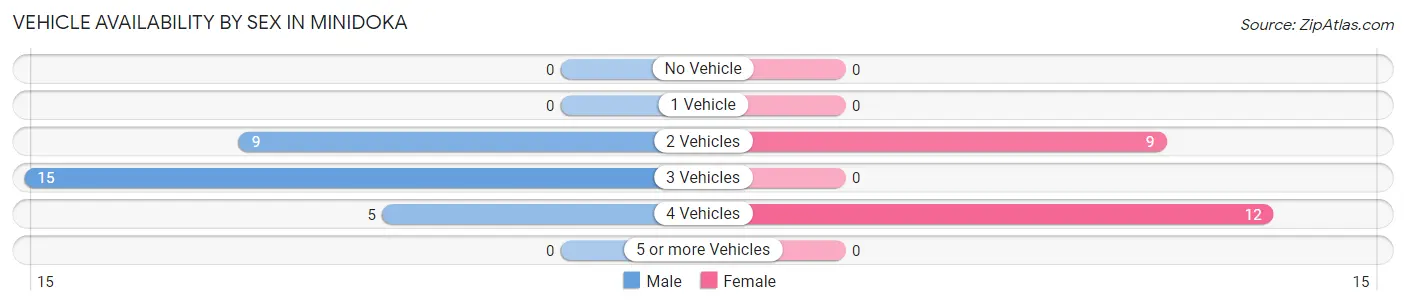
| Vehicles Available | Male | Female |
| No Vehicle | 0 (0.0%) | 0 (0.0%) |
| 1 Vehicle | 0 (0.0%) | 0 (0.0%) |
| 2 Vehicles | 9 (31.0%) | 9 (42.9%) |
| 3 Vehicles | 15 (51.7%) | 0 (0.0%) |
| 4 Vehicles | 5 (17.2%) | 12 (57.1%) |
| 5 or more Vehicles | 0 (0.0%) | 0 (0.0%) |
| Total | 29 (100.0%) | 21 (100.0%) |
Commute Time in Minidoka
The most frequently occuring commute durations in Minidoka are 10 to 14 minutes (17 commuters, 34.0%), 30 to 34 minutes (9 commuters, 18.0%), and 40 to 44 minutes (7 commuters, 14.0%).
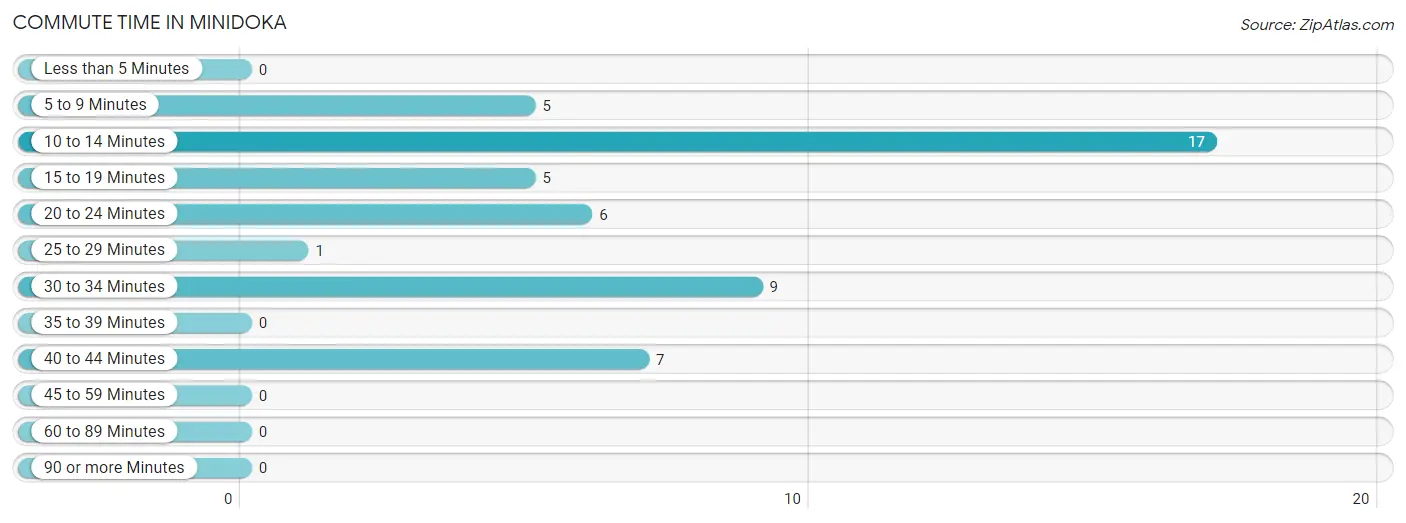
| Commute Time | # Commuters | % Commuters |
| Less than 5 Minutes | 0 | 0.0% |
| 5 to 9 Minutes | 5 | 10.0% |
| 10 to 14 Minutes | 17 | 34.0% |
| 15 to 19 Minutes | 5 | 10.0% |
| 20 to 24 Minutes | 6 | 12.0% |
| 25 to 29 Minutes | 1 | 2.0% |
| 30 to 34 Minutes | 9 | 18.0% |
| 35 to 39 Minutes | 0 | 0.0% |
| 40 to 44 Minutes | 7 | 14.0% |
| 45 to 59 Minutes | 0 | 0.0% |
| 60 to 89 Minutes | 0 | 0.0% |
| 90 or more Minutes | 0 | 0.0% |
Commute Time by Sex in Minidoka
The most common commute times in Minidoka are 10 to 14 minutes (14 commuters, 48.3%) for males and 40 to 44 minutes (7 commuters, 33.3%) for females.
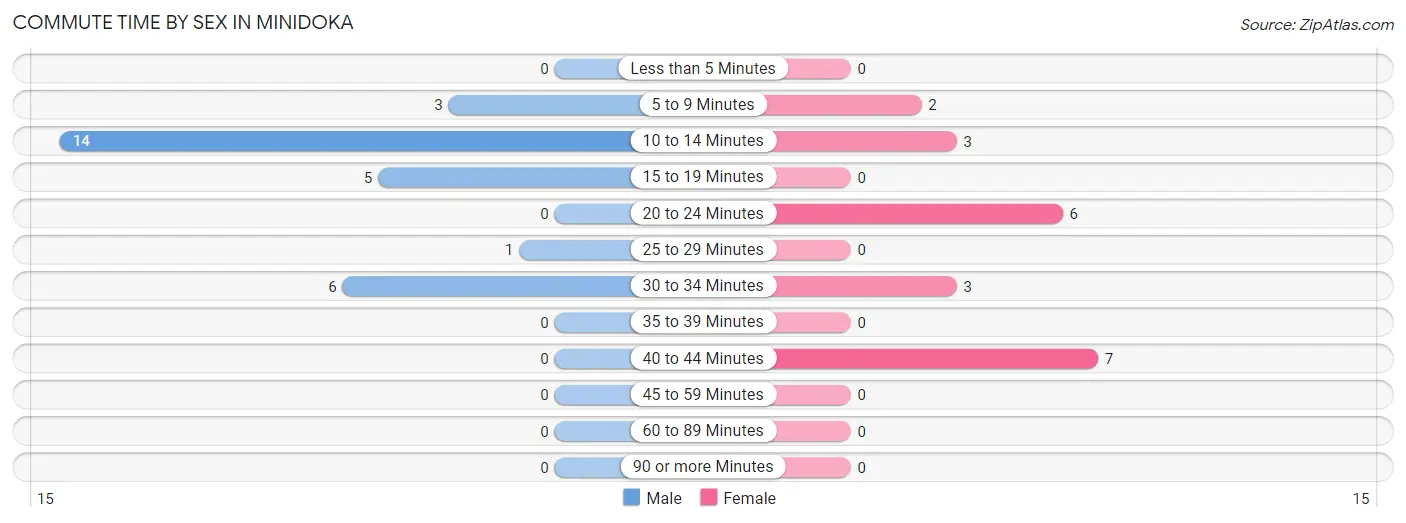
| Commute Time | Male | Female |
| Less than 5 Minutes | 0 (0.0%) | 0 (0.0%) |
| 5 to 9 Minutes | 3 (10.3%) | 2 (9.5%) |
| 10 to 14 Minutes | 14 (48.3%) | 3 (14.3%) |
| 15 to 19 Minutes | 5 (17.2%) | 0 (0.0%) |
| 20 to 24 Minutes | 0 (0.0%) | 6 (28.6%) |
| 25 to 29 Minutes | 1 (3.5%) | 0 (0.0%) |
| 30 to 34 Minutes | 6 (20.7%) | 3 (14.3%) |
| 35 to 39 Minutes | 0 (0.0%) | 0 (0.0%) |
| 40 to 44 Minutes | 0 (0.0%) | 7 (33.3%) |
| 45 to 59 Minutes | 0 (0.0%) | 0 (0.0%) |
| 60 to 89 Minutes | 0 (0.0%) | 0 (0.0%) |
| 90 or more Minutes | 0 (0.0%) | 0 (0.0%) |
Time of Departure to Work by Sex in Minidoka
The most frequent times of departure to work in Minidoka are 7:00 AM to 7:29 AM (25, 86.2%) for males and 9:00 AM to 9:59 AM (9, 42.9%) for females.
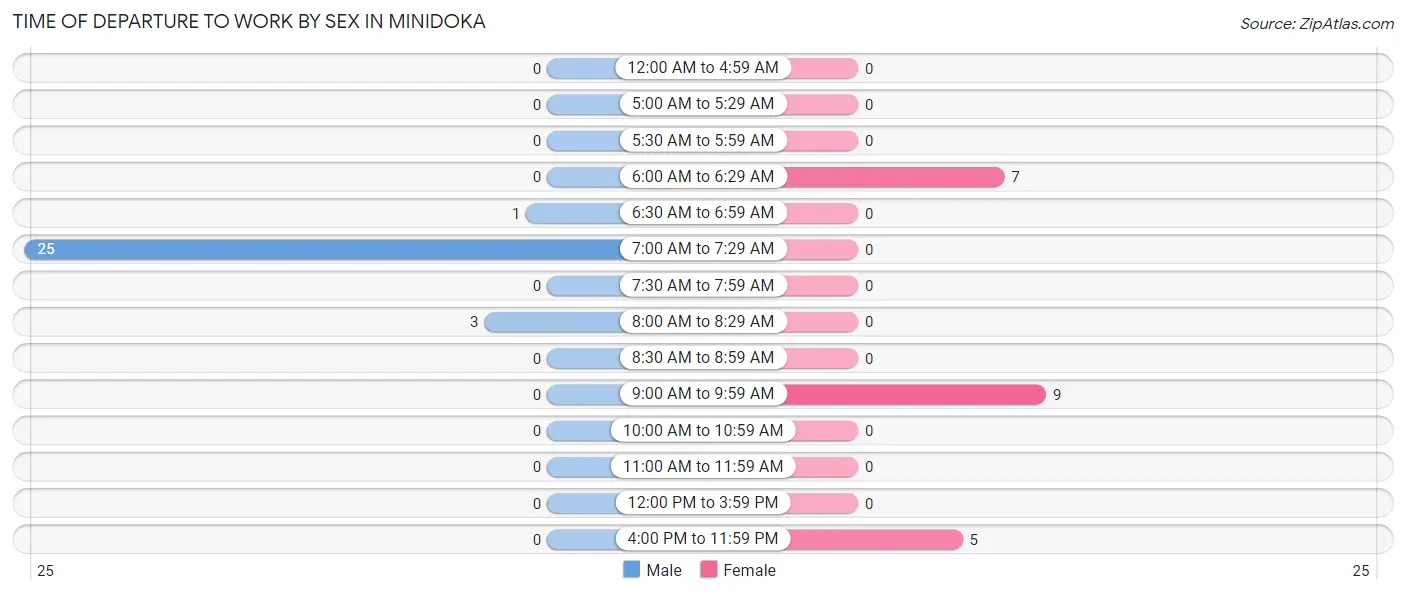
| Time of Departure | Male | Female |
| 12:00 AM to 4:59 AM | 0 (0.0%) | 0 (0.0%) |
| 5:00 AM to 5:29 AM | 0 (0.0%) | 0 (0.0%) |
| 5:30 AM to 5:59 AM | 0 (0.0%) | 0 (0.0%) |
| 6:00 AM to 6:29 AM | 0 (0.0%) | 7 (33.3%) |
| 6:30 AM to 6:59 AM | 1 (3.5%) | 0 (0.0%) |
| 7:00 AM to 7:29 AM | 25 (86.2%) | 0 (0.0%) |
| 7:30 AM to 7:59 AM | 0 (0.0%) | 0 (0.0%) |
| 8:00 AM to 8:29 AM | 3 (10.3%) | 0 (0.0%) |
| 8:30 AM to 8:59 AM | 0 (0.0%) | 0 (0.0%) |
| 9:00 AM to 9:59 AM | 0 (0.0%) | 9 (42.9%) |
| 10:00 AM to 10:59 AM | 0 (0.0%) | 0 (0.0%) |
| 11:00 AM to 11:59 AM | 0 (0.0%) | 0 (0.0%) |
| 12:00 PM to 3:59 PM | 0 (0.0%) | 0 (0.0%) |
| 4:00 PM to 11:59 PM | 0 (0.0%) | 5 (23.8%) |
| Total | 29 (100.0%) | 21 (100.0%) |
Housing Occupancy in Minidoka
Occupancy by Ownership in Minidoka
Of the total 43 dwellings in Minidoka, owner-occupied units account for 21 (48.8%), while renter-occupied units make up 22 (51.2%).
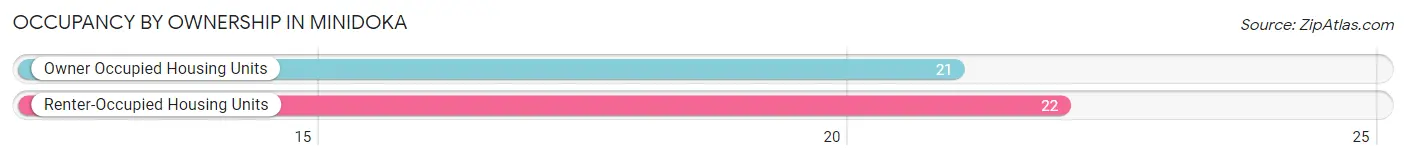
| Occupancy | # Housing Units | % Housing Units |
| Owner Occupied Housing Units | 21 | 48.8% |
| Renter-Occupied Housing Units | 22 | 51.2% |
| Total Occupied Housing Units | 43 | 100.0% |
Occupancy by Household Size in Minidoka
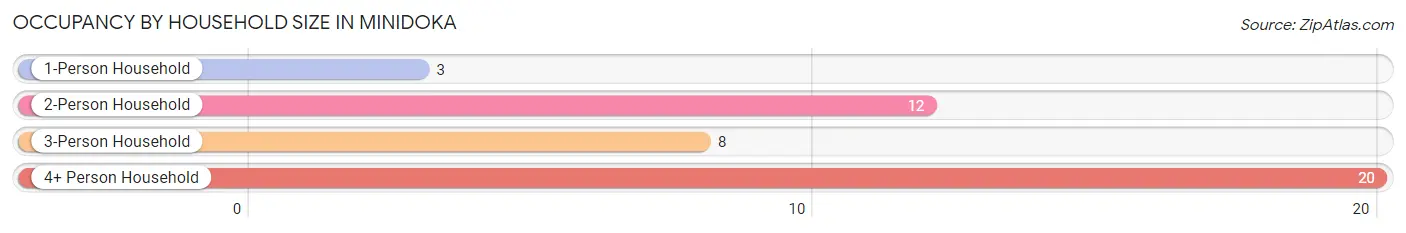
| Household Size | # Housing Units | % Housing Units |
| 1-Person Household | 3 | 7.0% |
| 2-Person Household | 12 | 27.9% |
| 3-Person Household | 8 | 18.6% |
| 4+ Person Household | 20 | 46.5% |
| Total Housing Units | 43 | 100.0% |
Occupancy by Ownership by Household Size in Minidoka
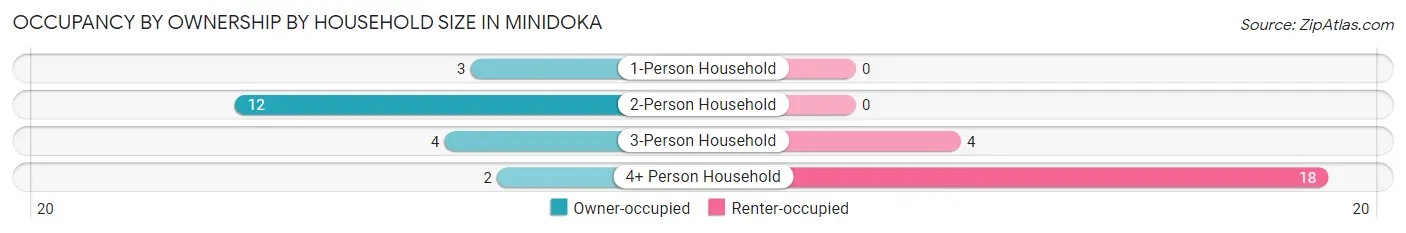
| Household Size | Owner-occupied | Renter-occupied |
| 1-Person Household | 3 (100.0%) | 0 (0.0%) |
| 2-Person Household | 12 (100.0%) | 0 (0.0%) |
| 3-Person Household | 4 (50.0%) | 4 (50.0%) |
| 4+ Person Household | 2 (10.0%) | 18 (90.0%) |
| Total Housing Units | 21 (48.8%) | 22 (51.2%) |
Occupancy by Educational Attainment in Minidoka
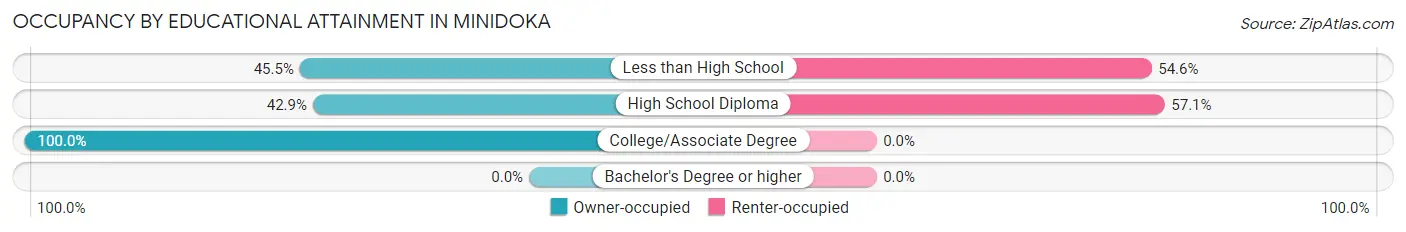
| Household Size | Owner-occupied | Renter-occupied |
| Less than High School | 15 (45.5%) | 18 (54.5%) |
| High School Diploma | 3 (42.9%) | 4 (57.1%) |
| College/Associate Degree | 3 (100.0%) | 0 (0.0%) |
| Bachelor's Degree or higher | 0 (0.0%) | 0 (0.0%) |
Occupancy by Age of Householder in Minidoka
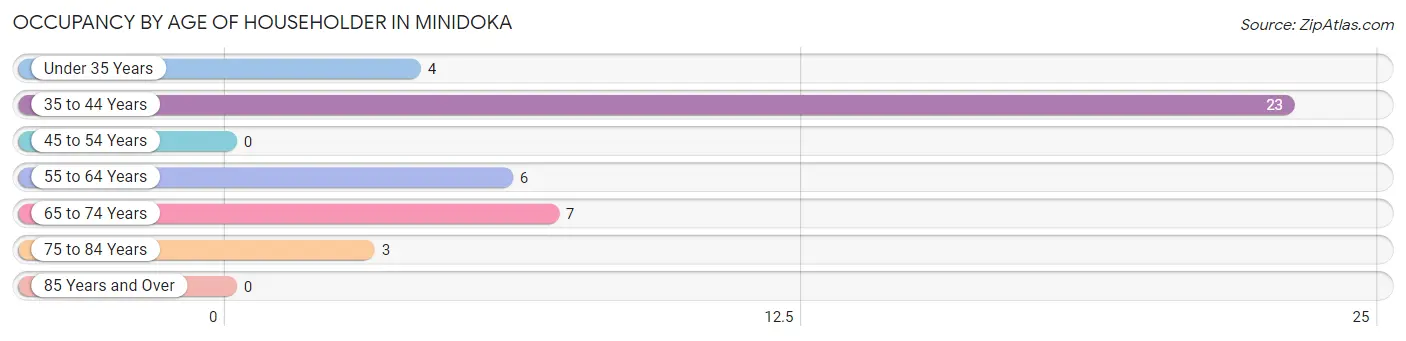
| Age Bracket | # Households | % Households |
| Under 35 Years | 4 | 9.3% |
| 35 to 44 Years | 23 | 53.5% |
| 45 to 54 Years | 0 | 0.0% |
| 55 to 64 Years | 6 | 14.0% |
| 65 to 74 Years | 7 | 16.3% |
| 75 to 84 Years | 3 | 7.0% |
| 85 Years and Over | 0 | 0.0% |
| Total | 43 | 100.0% |
Housing Finances in Minidoka
Median Income by Occupancy in Minidoka
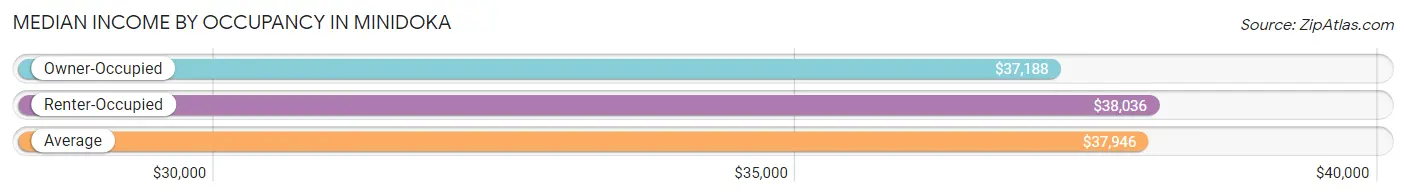
| Occupancy Type | # Households | Median Income |
| Owner-Occupied | 21 (48.8%) | $37,188 |
| Renter-Occupied | 22 (51.2%) | $38,036 |
| Average | 43 (100.0%) | $37,946 |
Occupancy by Householder Income Bracket in Minidoka
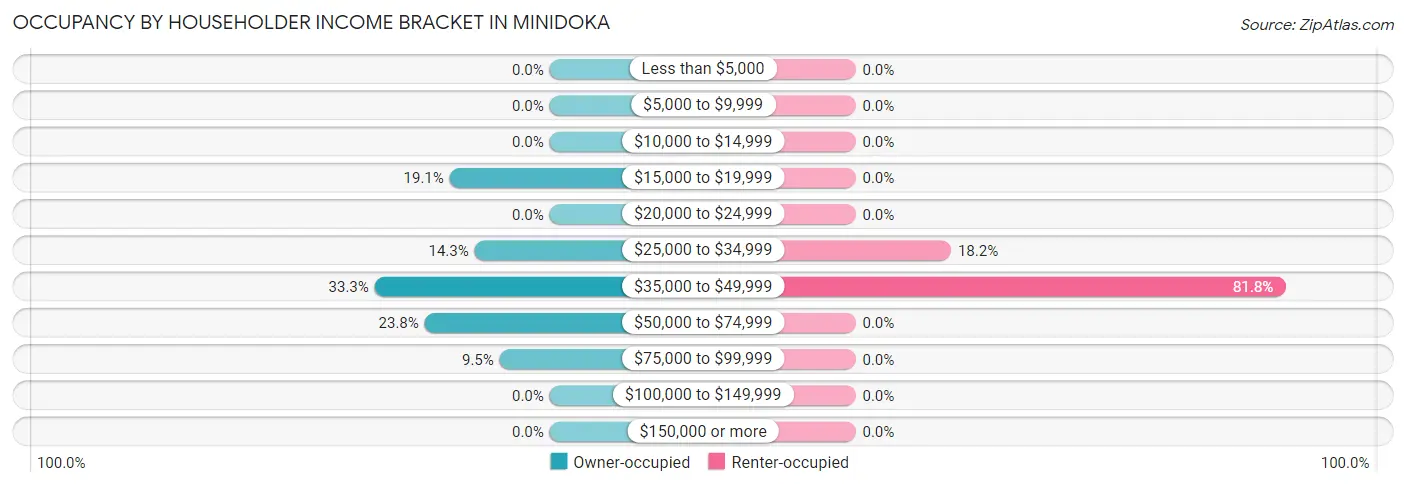
| Income Bracket | Owner-occupied | Renter-occupied |
| Less than $5,000 | 0 (0.0%) | 0 (0.0%) |
| $5,000 to $9,999 | 0 (0.0%) | 0 (0.0%) |
| $10,000 to $14,999 | 0 (0.0%) | 0 (0.0%) |
| $15,000 to $19,999 | 4 (19.1%) | 0 (0.0%) |
| $20,000 to $24,999 | 0 (0.0%) | 0 (0.0%) |
| $25,000 to $34,999 | 3 (14.3%) | 4 (18.2%) |
| $35,000 to $49,999 | 7 (33.3%) | 18 (81.8%) |
| $50,000 to $74,999 | 5 (23.8%) | 0 (0.0%) |
| $75,000 to $99,999 | 2 (9.5%) | 0 (0.0%) |
| $100,000 to $149,999 | 0 (0.0%) | 0 (0.0%) |
| $150,000 or more | 0 (0.0%) | 0 (0.0%) |
| Total | 21 (100.0%) | 22 (100.0%) |
Monthly Housing Cost Tiers in Minidoka
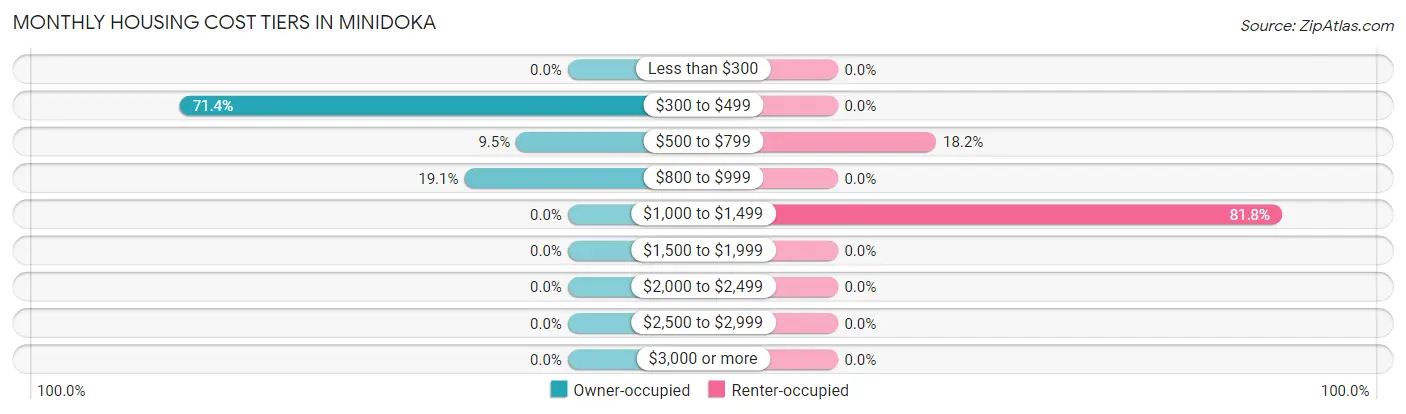
| Monthly Cost | Owner-occupied | Renter-occupied |
| Less than $300 | 0 (0.0%) | 0 (0.0%) |
| $300 to $499 | 15 (71.4%) | 0 (0.0%) |
| $500 to $799 | 2 (9.5%) | 4 (18.2%) |
| $800 to $999 | 4 (19.1%) | 0 (0.0%) |
| $1,000 to $1,499 | 0 (0.0%) | 18 (81.8%) |
| $1,500 to $1,999 | 0 (0.0%) | 0 (0.0%) |
| $2,000 to $2,499 | 0 (0.0%) | 0 (0.0%) |
| $2,500 to $2,999 | 0 (0.0%) | 0 (0.0%) |
| $3,000 or more | 0 (0.0%) | 0 (0.0%) |
| Total | 21 (100.0%) | 22 (100.0%) |
Physical Housing Characteristics in Minidoka
Housing Structures in Minidoka
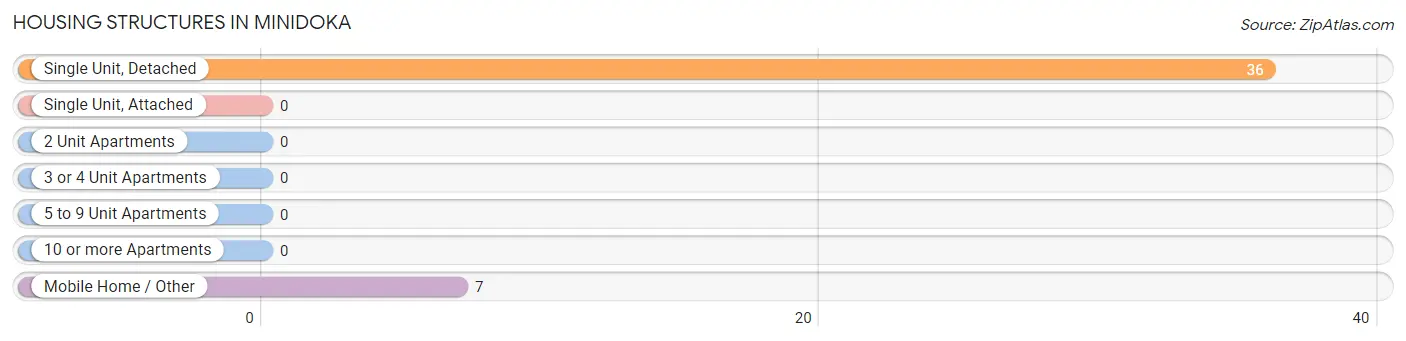
| Structure Type | # Housing Units | % Housing Units |
| Single Unit, Detached | 36 | 83.7% |
| Single Unit, Attached | 0 | 0.0% |
| 2 Unit Apartments | 0 | 0.0% |
| 3 or 4 Unit Apartments | 0 | 0.0% |
| 5 to 9 Unit Apartments | 0 | 0.0% |
| 10 or more Apartments | 0 | 0.0% |
| Mobile Home / Other | 7 | 16.3% |
| Total | 43 | 100.0% |
Housing Structures by Occupancy in Minidoka
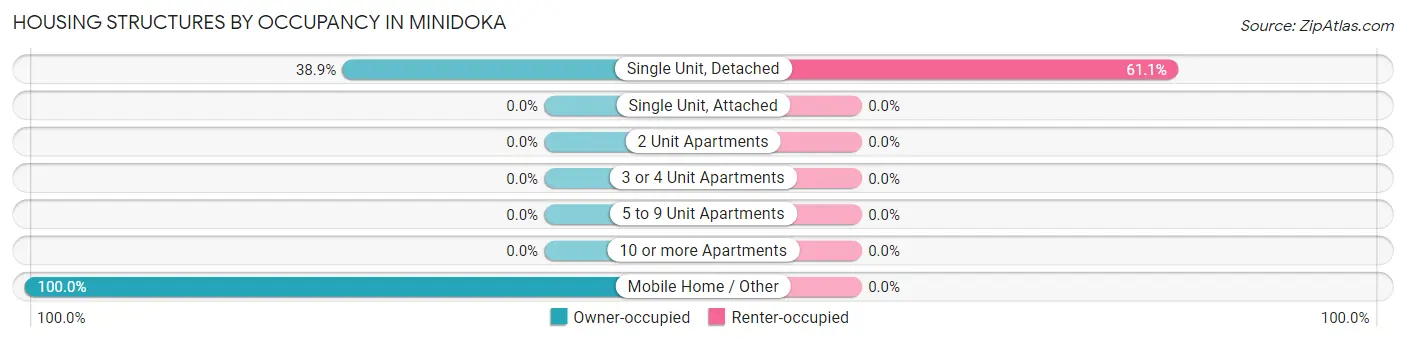
| Structure Type | Owner-occupied | Renter-occupied |
| Single Unit, Detached | 14 (38.9%) | 22 (61.1%) |
| Single Unit, Attached | 0 (0.0%) | 0 (0.0%) |
| 2 Unit Apartments | 0 (0.0%) | 0 (0.0%) |
| 3 or 4 Unit Apartments | 0 (0.0%) | 0 (0.0%) |
| 5 to 9 Unit Apartments | 0 (0.0%) | 0 (0.0%) |
| 10 or more Apartments | 0 (0.0%) | 0 (0.0%) |
| Mobile Home / Other | 7 (100.0%) | 0 (0.0%) |
| Total | 21 (48.8%) | 22 (51.2%) |
Housing Structures by Number of Rooms in Minidoka
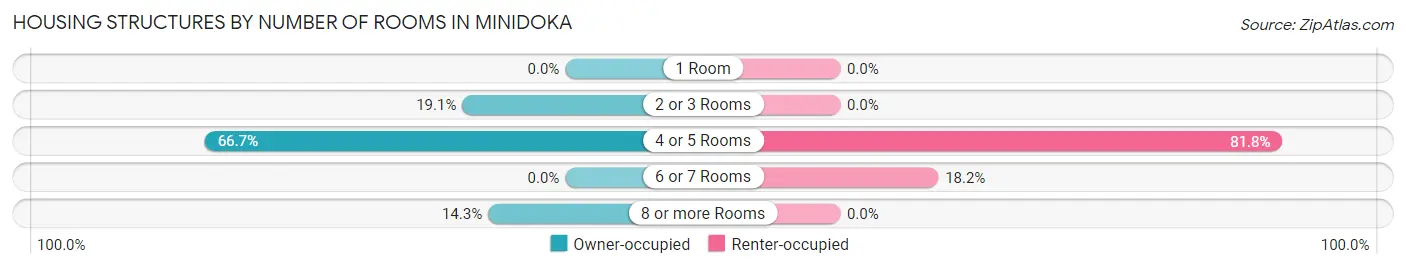
| Number of Rooms | Owner-occupied | Renter-occupied |
| 1 Room | 0 (0.0%) | 0 (0.0%) |
| 2 or 3 Rooms | 4 (19.1%) | 0 (0.0%) |
| 4 or 5 Rooms | 14 (66.7%) | 18 (81.8%) |
| 6 or 7 Rooms | 0 (0.0%) | 4 (18.2%) |
| 8 or more Rooms | 3 (14.3%) | 0 (0.0%) |
| Total | 21 (100.0%) | 22 (100.0%) |
Housing Structure by Heating Type in Minidoka
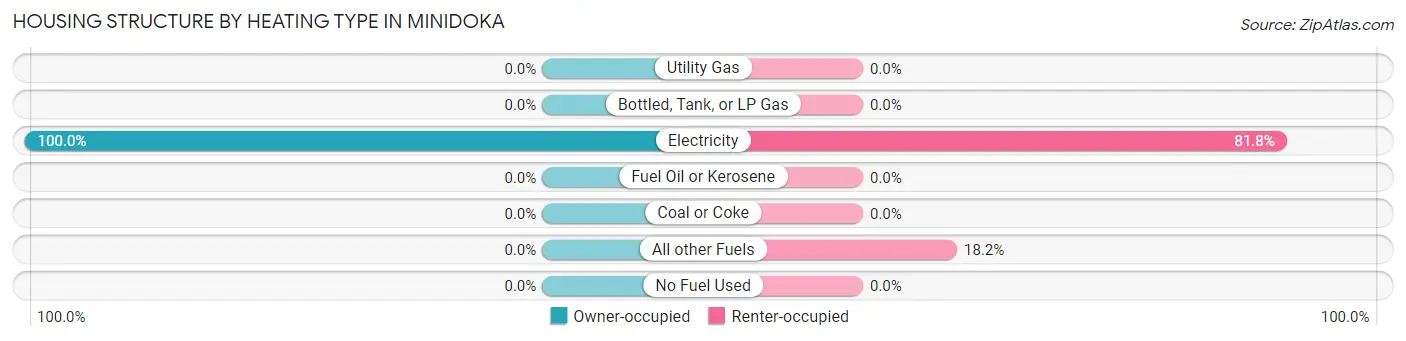
| Heating Type | Owner-occupied | Renter-occupied |
| Utility Gas | 0 (0.0%) | 0 (0.0%) |
| Bottled, Tank, or LP Gas | 0 (0.0%) | 0 (0.0%) |
| Electricity | 21 (100.0%) | 18 (81.8%) |
| Fuel Oil or Kerosene | 0 (0.0%) | 0 (0.0%) |
| Coal or Coke | 0 (0.0%) | 0 (0.0%) |
| All other Fuels | 0 (0.0%) | 4 (18.2%) |
| No Fuel Used | 0 (0.0%) | 0 (0.0%) |
| Total | 21 (100.0%) | 22 (100.0%) |
Household Vehicle Usage in Minidoka
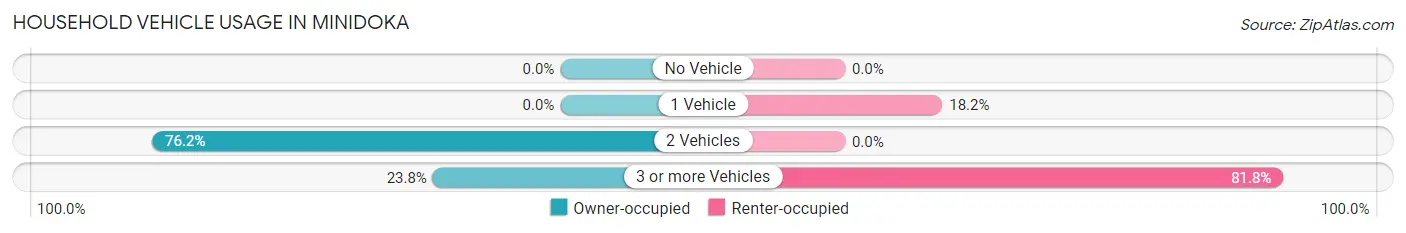
| Vehicles per Household | Owner-occupied | Renter-occupied |
| No Vehicle | 0 (0.0%) | 0 (0.0%) |
| 1 Vehicle | 0 (0.0%) | 4 (18.2%) |
| 2 Vehicles | 16 (76.2%) | 0 (0.0%) |
| 3 or more Vehicles | 5 (23.8%) | 18 (81.8%) |
| Total | 21 (100.0%) | 22 (100.0%) |
Real Estate & Mortgages in Minidoka
Real Estate and Mortgage Overview in Minidoka
| Characteristic | Without Mortgage | With Mortgage |
| Housing Units | 17 | 4 |
| Median Property Value | $104,700 | $0 |
| Median Household Income | $43,750 | $0 |
| Monthly Housing Costs | $343 | $0 |
| Real Estate Taxes | $586 | $0 |
Property Value by Mortgage Status in Minidoka
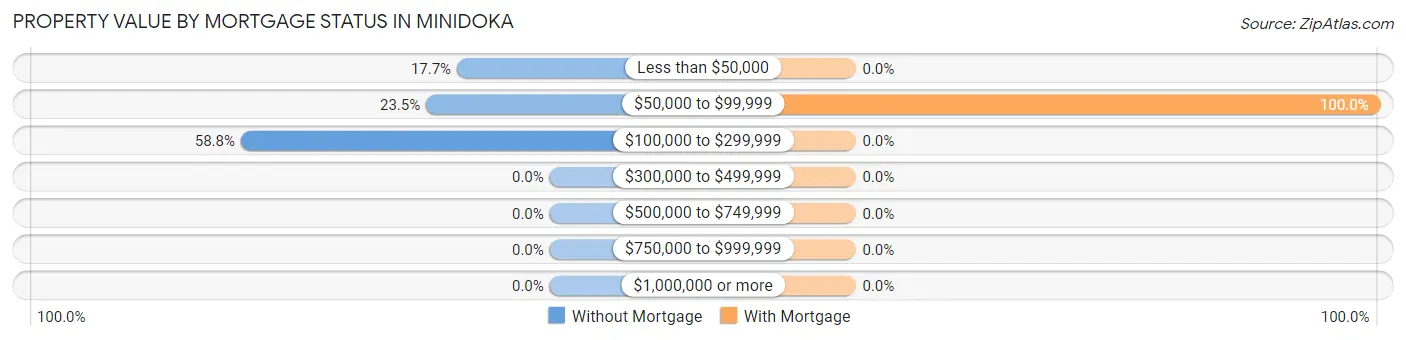
| Property Value | Without Mortgage | With Mortgage |
| Less than $50,000 | 3 (17.6%) | 0 (0.0%) |
| $50,000 to $99,999 | 4 (23.5%) | 4 (100.0%) |
| $100,000 to $299,999 | 10 (58.8%) | 0 (0.0%) |
| $300,000 to $499,999 | 0 (0.0%) | 0 (0.0%) |
| $500,000 to $749,999 | 0 (0.0%) | 0 (0.0%) |
| $750,000 to $999,999 | 0 (0.0%) | 0 (0.0%) |
| $1,000,000 or more | 0 (0.0%) | 0 (0.0%) |
| Total | 17 (100.0%) | 4 (100.0%) |
Household Income by Mortgage Status in Minidoka
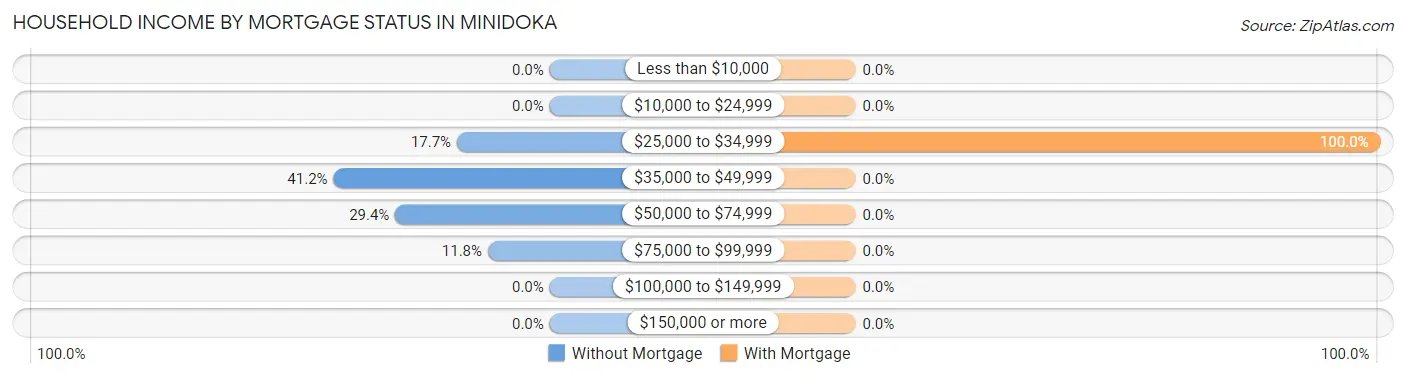
| Household Income | Without Mortgage | With Mortgage |
| Less than $10,000 | 0 (0.0%) | 0 (0.0%) |
| $10,000 to $24,999 | 0 (0.0%) | 0 (0.0%) |
| $25,000 to $34,999 | 3 (17.6%) | 4 (100.0%) |
| $35,000 to $49,999 | 7 (41.2%) | 0 (0.0%) |
| $50,000 to $74,999 | 5 (29.4%) | 0 (0.0%) |
| $75,000 to $99,999 | 2 (11.8%) | 0 (0.0%) |
| $100,000 to $149,999 | 0 (0.0%) | 0 (0.0%) |
| $150,000 or more | 0 (0.0%) | 0 (0.0%) |
| Total | 17 (100.0%) | 4 (100.0%) |
Property Value to Household Income Ratio in Minidoka
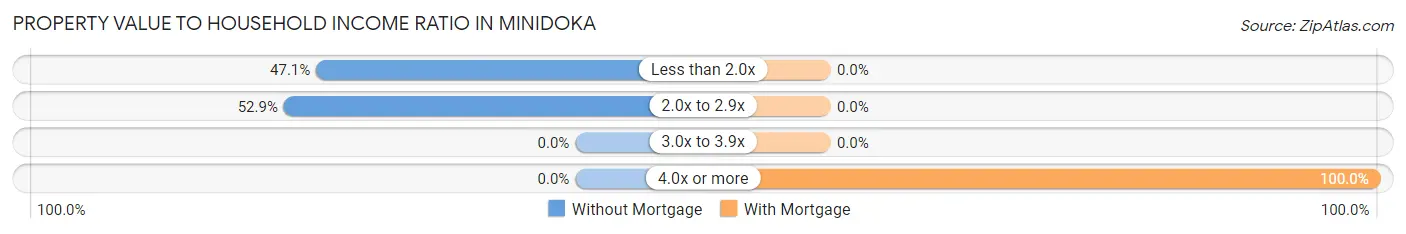
| Value-to-Income Ratio | Without Mortgage | With Mortgage |
| Less than 2.0x | 8 (47.1%) | 0 (0.0%) |
| 2.0x to 2.9x | 9 (52.9%) | 0 (0.0%) |
| 3.0x to 3.9x | 0 (0.0%) | 0 (0.0%) |
| 4.0x or more | 0 (0.0%) | 4 (100.0%) |
| Total | 17 (100.0%) | 4 (100.0%) |
Real Estate Taxes by Mortgage Status in Minidoka
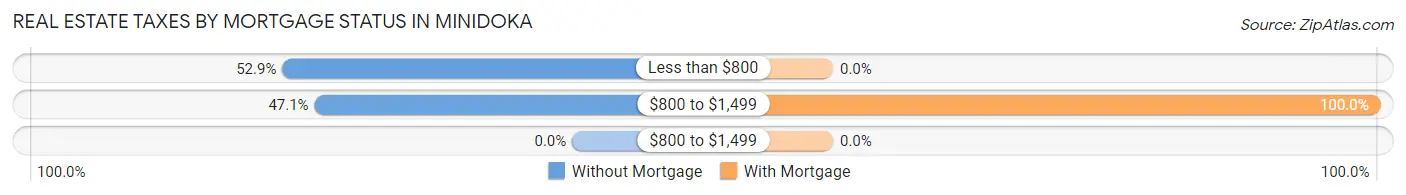
| Property Taxes | Without Mortgage | With Mortgage |
| Less than $800 | 9 (52.9%) | 0 (0.0%) |
| $800 to $1,499 | 8 (47.1%) | 4 (100.0%) |
| $800 to $1,499 | 0 (0.0%) | 0 (0.0%) |
| Total | 17 (100.0%) | 4 (100.0%) |
Health & Disability in Minidoka
Health Insurance Coverage by Age in Minidoka
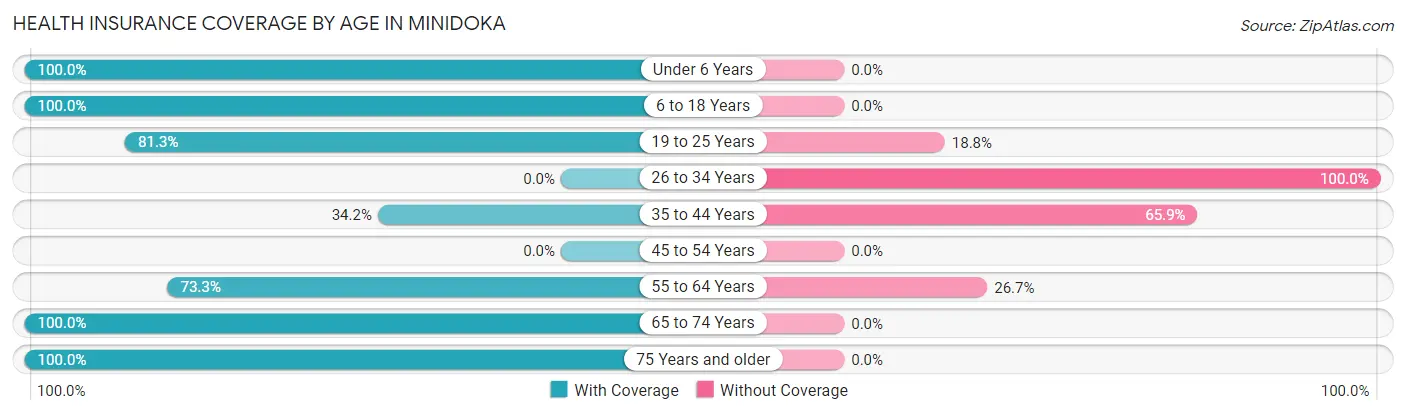
| Age Bracket | With Coverage | Without Coverage |
| Under 6 Years | 28 (100.0%) | 0 (0.0%) |
| 6 to 18 Years | 44 (100.0%) | 0 (0.0%) |
| 19 to 25 Years | 13 (81.2%) | 3 (18.8%) |
| 26 to 34 Years | 0 (0.0%) | 10 (100.0%) |
| 35 to 44 Years | 14 (34.2%) | 27 (65.8%) |
| 45 to 54 Years | 0 (0.0%) | 0 (0.0%) |
| 55 to 64 Years | 11 (73.3%) | 4 (26.7%) |
| 65 to 74 Years | 18 (100.0%) | 0 (0.0%) |
| 75 Years and older | 3 (100.0%) | 0 (0.0%) |
| Total | 131 (74.9%) | 44 (25.1%) |
Health Insurance Coverage by Citizenship Status in Minidoka
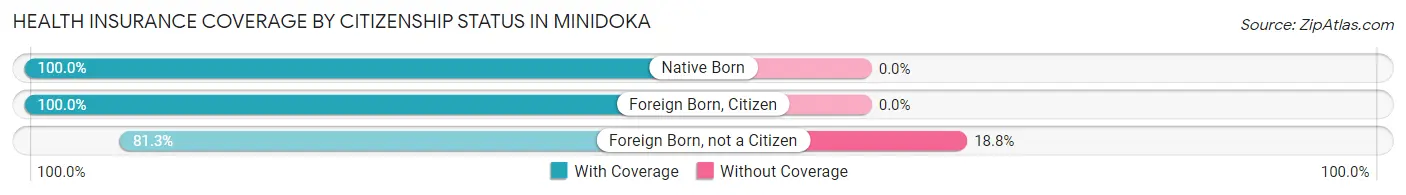
| Citizenship Status | With Coverage | Without Coverage |
| Native Born | 28 (100.0%) | 0 (0.0%) |
| Foreign Born, Citizen | 44 (100.0%) | 0 (0.0%) |
| Foreign Born, not a Citizen | 13 (81.2%) | 3 (18.8%) |
Health Insurance Coverage by Household Income in Minidoka
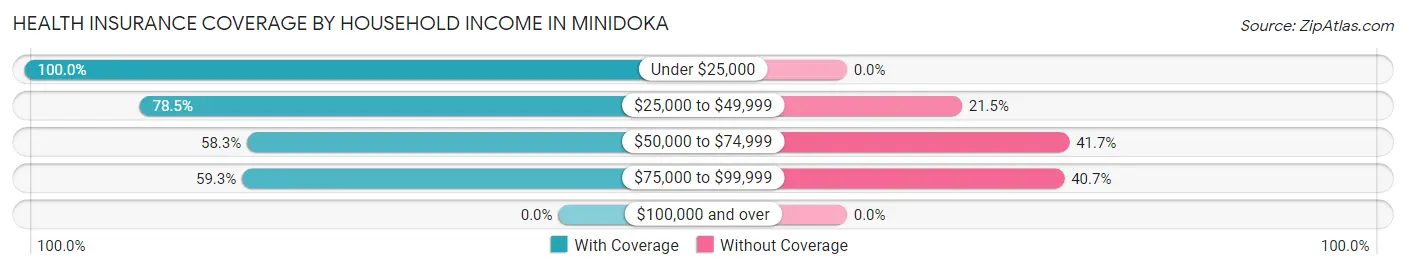
| Household Income | With Coverage | Without Coverage |
| Under $25,000 | 6 (100.0%) | 0 (0.0%) |
| $25,000 to $49,999 | 102 (78.5%) | 28 (21.5%) |
| $50,000 to $74,999 | 7 (58.3%) | 5 (41.7%) |
| $75,000 to $99,999 | 16 (59.3%) | 11 (40.7%) |
| $100,000 and over | 0 (0.0%) | 0 (0.0%) |
Public vs Private Health Insurance Coverage by Age in Minidoka
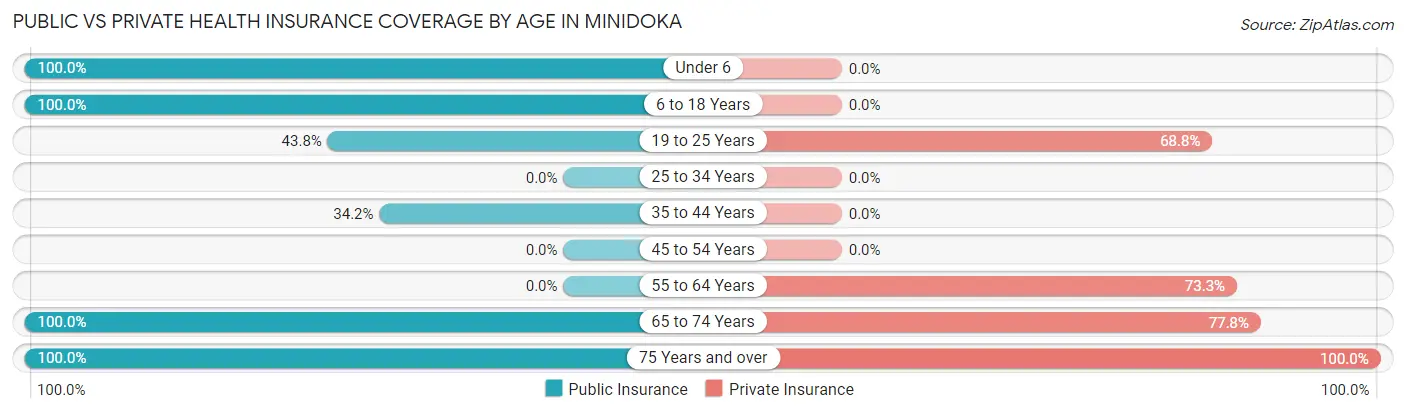
| Age Bracket | Public Insurance | Private Insurance |
| Under 6 | 28 (100.0%) | 0 (0.0%) |
| 6 to 18 Years | 44 (100.0%) | 0 (0.0%) |
| 19 to 25 Years | 7 (43.8%) | 11 (68.8%) |
| 25 to 34 Years | 0 (0.0%) | 0 (0.0%) |
| 35 to 44 Years | 14 (34.2%) | 0 (0.0%) |
| 45 to 54 Years | 0 (0.0%) | 0 (0.0%) |
| 55 to 64 Years | 0 (0.0%) | 11 (73.3%) |
| 65 to 74 Years | 18 (100.0%) | 14 (77.8%) |
| 75 Years and over | 3 (100.0%) | 3 (100.0%) |
| Total | 114 (65.1%) | 39 (22.3%) |
Disability Status by Sex by Age in Minidoka
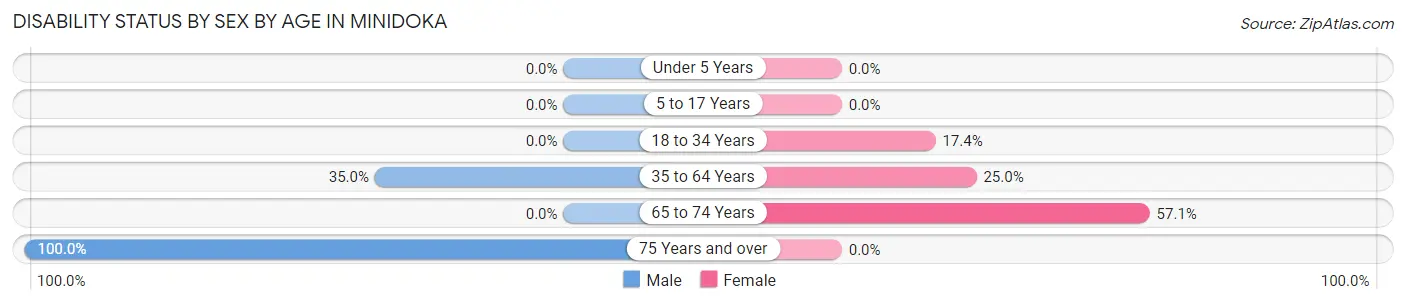
| Age Bracket | Male | Female |
| Under 5 Years | 0 (0.0%) | 0 (0.0%) |
| 5 to 17 Years | 0 (0.0%) | 0 (0.0%) |
| 18 to 34 Years | 0 (0.0%) | 4 (17.4%) |
| 35 to 64 Years | 14 (35.0%) | 4 (25.0%) |
| 65 to 74 Years | 0 (0.0%) | 8 (57.1%) |
| 75 Years and over | 3 (100.0%) | 0 (0.0%) |
Disability Class by Sex by Age in Minidoka
Disability Class: Hearing Difficulty
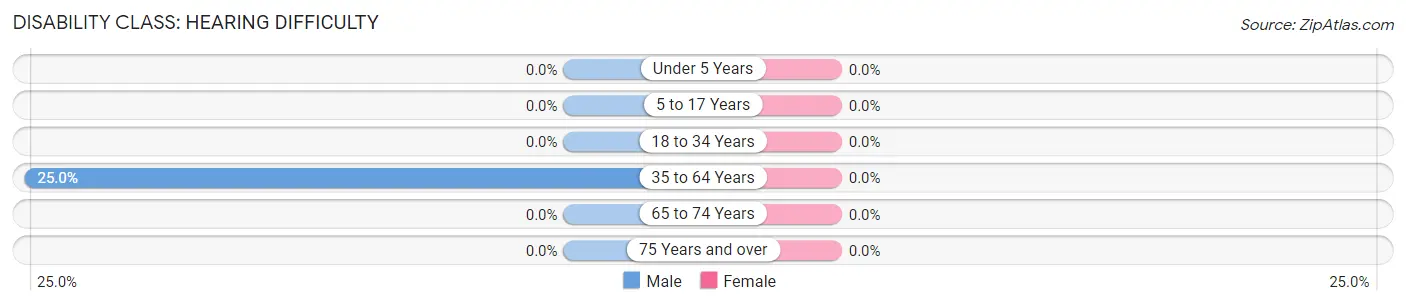
| Age Bracket | Male | Female |
| Under 5 Years | 0 (0.0%) | 0 (0.0%) |
| 5 to 17 Years | 0 (0.0%) | 0 (0.0%) |
| 18 to 34 Years | 0 (0.0%) | 0 (0.0%) |
| 35 to 64 Years | 10 (25.0%) | 0 (0.0%) |
| 65 to 74 Years | 0 (0.0%) | 0 (0.0%) |
| 75 Years and over | 0 (0.0%) | 0 (0.0%) |
Disability Class: Vision Difficulty
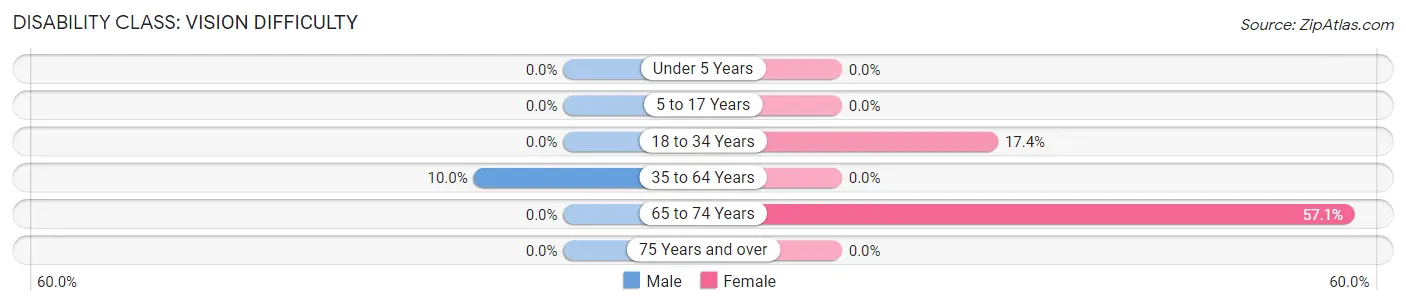
| Age Bracket | Male | Female |
| Under 5 Years | 0 (0.0%) | 0 (0.0%) |
| 5 to 17 Years | 0 (0.0%) | 0 (0.0%) |
| 18 to 34 Years | 0 (0.0%) | 4 (17.4%) |
| 35 to 64 Years | 4 (10.0%) | 0 (0.0%) |
| 65 to 74 Years | 0 (0.0%) | 8 (57.1%) |
| 75 Years and over | 0 (0.0%) | 0 (0.0%) |
Disability Class: Cognitive Difficulty
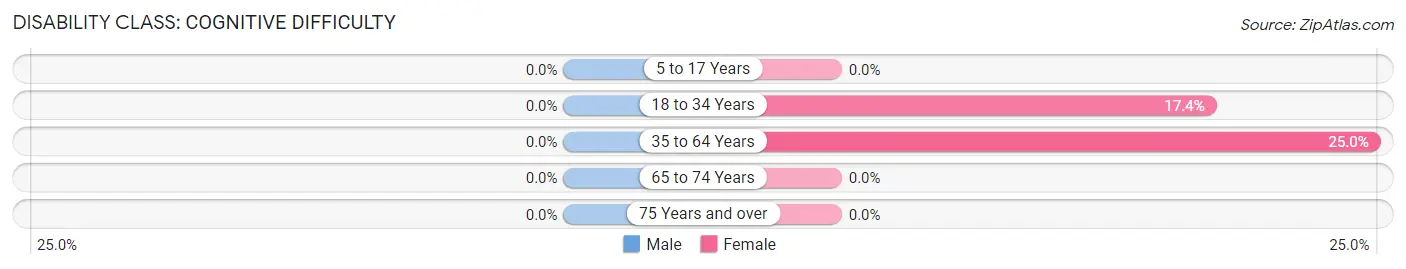
| Age Bracket | Male | Female |
| 5 to 17 Years | 0 (0.0%) | 0 (0.0%) |
| 18 to 34 Years | 0 (0.0%) | 4 (17.4%) |
| 35 to 64 Years | 0 (0.0%) | 4 (25.0%) |
| 65 to 74 Years | 0 (0.0%) | 0 (0.0%) |
| 75 Years and over | 0 (0.0%) | 0 (0.0%) |
Disability Class: Ambulatory Difficulty
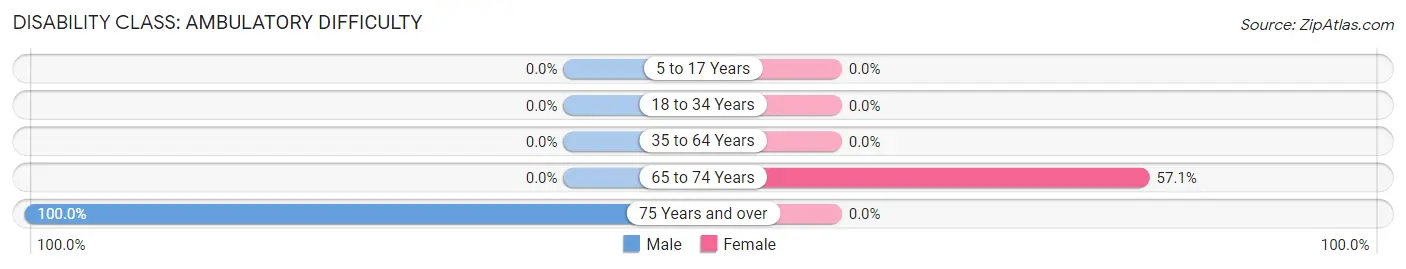
| Age Bracket | Male | Female |
| 5 to 17 Years | 0 (0.0%) | 0 (0.0%) |
| 18 to 34 Years | 0 (0.0%) | 0 (0.0%) |
| 35 to 64 Years | 0 (0.0%) | 0 (0.0%) |
| 65 to 74 Years | 0 (0.0%) | 8 (57.1%) |
| 75 Years and over | 3 (100.0%) | 0 (0.0%) |
Disability Class: Self-Care Difficulty
| Age Bracket | Male | Female |
| 5 to 17 Years | 0 (0.0%) | 0 (0.0%) |
| 18 to 34 Years | 0 (0.0%) | 0 (0.0%) |
| 35 to 64 Years | 0 (0.0%) | 0 (0.0%) |
| 65 to 74 Years | 0 (0.0%) | 0 (0.0%) |
| 75 Years and over | 0 (0.0%) | 0 (0.0%) |
Technology Access in Minidoka
Computing Device Access in Minidoka
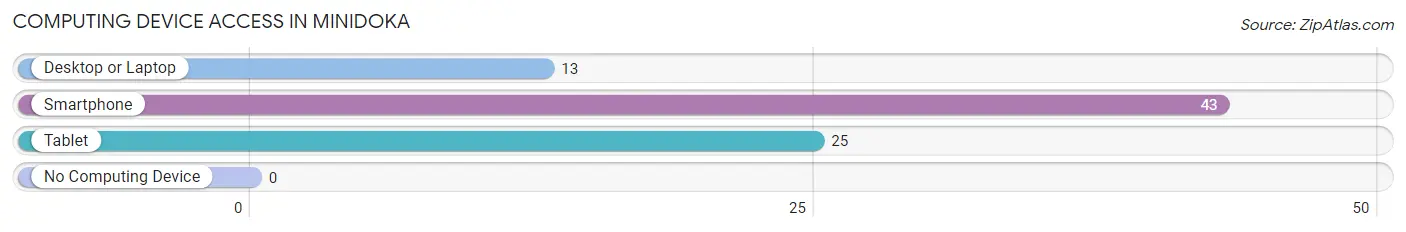
| Device Type | # Households | % Households |
| Desktop or Laptop | 13 | 30.2% |
| Smartphone | 43 | 100.0% |
| Tablet | 25 | 58.1% |
| No Computing Device | 0 | 0.0% |
| Total | 43 | 100.0% |
Internet Access in Minidoka
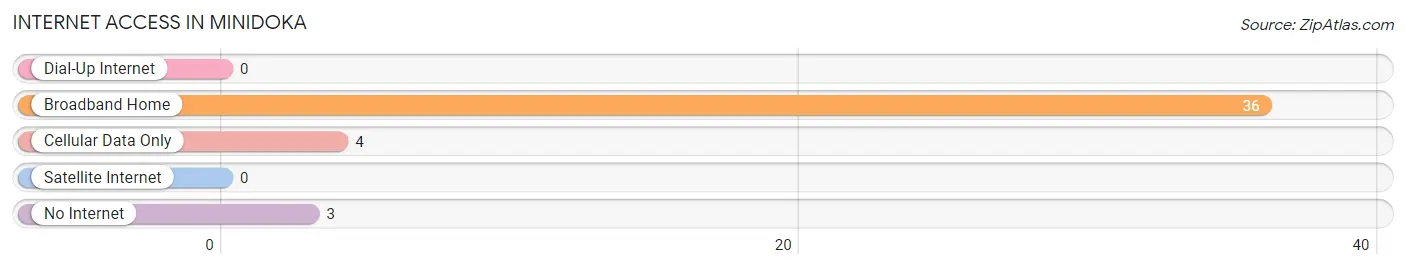
| Internet Type | # Households | % Households |
| Dial-Up Internet | 0 | 0.0% |
| Broadband Home | 36 | 83.7% |
| Cellular Data Only | 4 | 9.3% |
| Satellite Internet | 0 | 0.0% |
| No Internet | 3 | 7.0% |
| Total | 43 | 100.0% |
Minidoka Summary
Minidoka is a small city located in the south-central part of the state of Idaho. It is situated in the Snake River Plain, a region of the state that is known for its agricultural production. The city is located in Minidoka County, which is part of the Magic Valley region of Idaho. The city is located about 30 miles south of Twin Falls, the largest city in the region.
Minidoka was founded in 1906 and was named after the Minidoka Irrigation Project, which was established in the area in 1904. The project was part of the larger Reclamation Act of 1902, which was designed to bring irrigation to the arid western states. The project was successful in bringing water to the area, and the city of Minidoka was established as a result.
The city of Minidoka has a population of approximately 1,500 people. The population is largely made up of people of Hispanic and Latino descent, with a significant portion of the population being of Mexican descent. The city is also home to a large number of Native Americans, with the largest group being the Shoshone-Bannock Tribe.
The economy of Minidoka is largely based on agriculture. The city is located in an area that is known for its production of potatoes, sugar beets, and other crops. The city is also home to a number of food processing plants, which process the crops grown in the area. The city is also home to a number of small businesses, including restaurants, retail stores, and other services.
The city of Minidoka is served by the Minidoka County School District, which operates a number of elementary, middle, and high schools in the area. The city is also home to a number of private schools, including a Catholic school and a Christian school.
The city of Minidoka is located in an area that is known for its outdoor recreation opportunities. The city is located near the Snake River, which provides a number of opportunities for fishing, boating, and other water activities. The city is also home to a number of parks and trails, which provide opportunities for hiking, biking, and other outdoor activities.
The city of Minidoka is a small city with a rich history and a vibrant economy. The city is home to a diverse population and is a great place to live and work. The city is also home to a number of outdoor recreation opportunities, making it a great place to visit and explore.
Common Questions
What is Per Capita Income in Minidoka?
Per Capita income in Minidoka is $10,687.
What is the Median Family Income in Minidoka?
Median Family Income in Minidoka is $38,571.
What is the Median Household income in Minidoka?
Median Household Income in Minidoka is $37,946.
What is Inequality or Gini Index in Minidoka?
Inequality or Gini Index in Minidoka is 0.20.
What is the Total Population of Minidoka?
Total Population of Minidoka is 175.
What is the Total Male Population of Minidoka?
Total Male Population of Minidoka is 92.
What is the Total Female Population of Minidoka?
Total Female Population of Minidoka is 83.
What is the Ratio of Males per 100 Females in Minidoka?
There are 110.84 Males per 100 Females in Minidoka.
What is the Ratio of Females per 100 Males in Minidoka?
There are 90.22 Females per 100 Males in Minidoka.
What is the Median Population Age in Minidoka?
Median Population Age in Minidoka is 24.5 Years.
What is the Average Family Size in Minidoka
Average Family Size in Minidoka is 4.3 People.
What is the Average Household Size in Minidoka
Average Household Size in Minidoka is 4.1 People.
How Large is the Labor Force in Minidoka?
There are 63 People in the Labor Forcein in Minidoka.
What is the Percentage of People in the Labor Force in Minidoka?
61.2% of People are in the Labor Force in Minidoka.
What is the Unemployment Rate in Minidoka?
Unemployment Rate in Minidoka is 20.6%.