De Smet, ID Map & Demographics
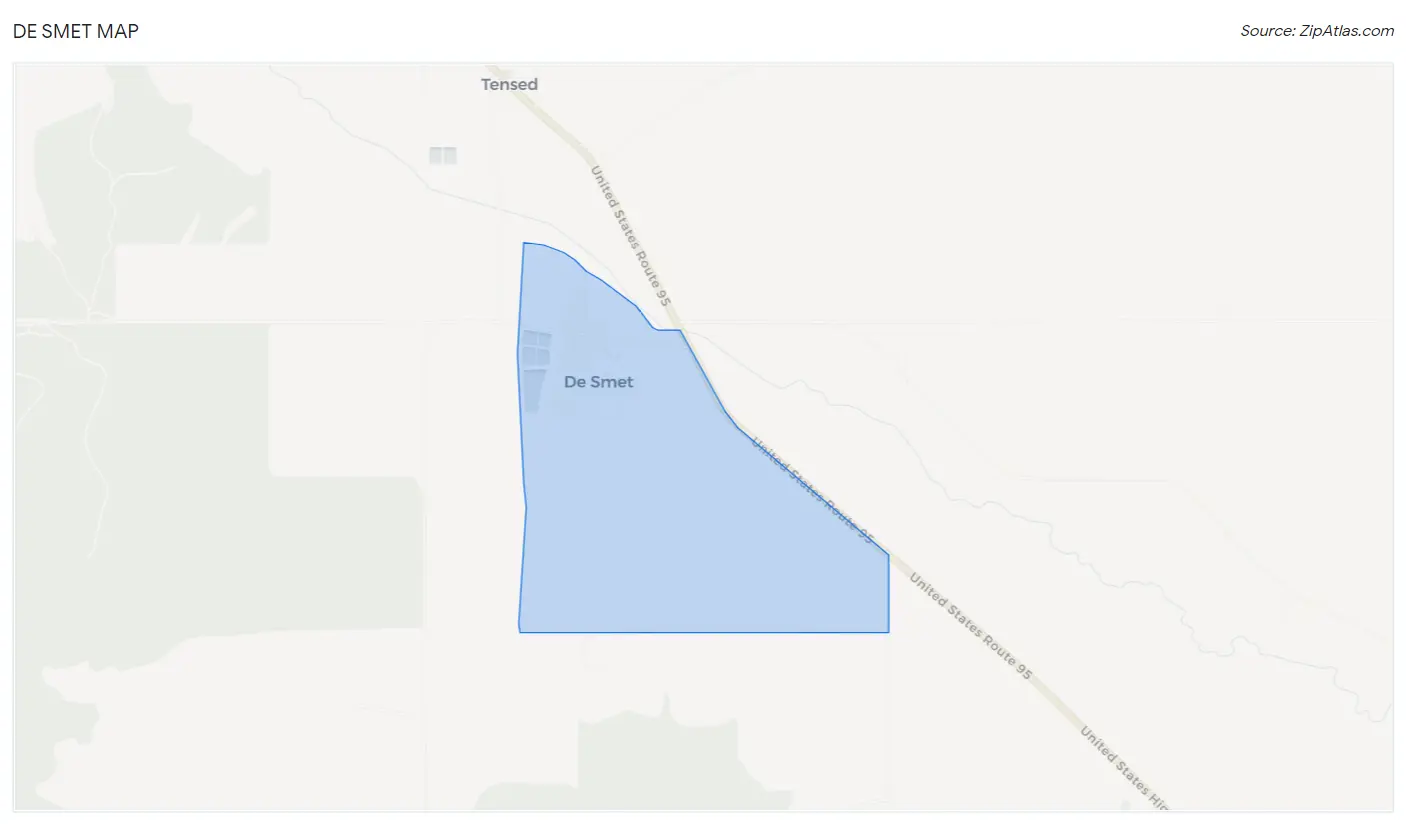
De Smet Map
De Smet Overview
$10,541
PER CAPITA INCOME
$50,893
AVG FAMILY INCOME
$44,286
AVG HOUSEHOLD INCOME
90.4%
WAGE / INCOME GAP [ % ]
9.6¢/ $1
WAGE / INCOME GAP [ $ ]
0.26
INEQUALITY / GINI INDEX
122
TOTAL POPULATION
55
MALE POPULATION
67
FEMALE POPULATION
82.09
MALES / 100 FEMALES
121.82
FEMALES / 100 MALES
29.4
MEDIAN AGE
7.0
AVG FAMILY SIZE
5.1
AVG HOUSEHOLD SIZE
35
LABOR FORCE [ PEOPLE ]
44.9%
PERCENT IN LABOR FORCE
Income in De Smet
Income Overview in De Smet
Per Capita Income in De Smet is $10,541, while median incomes of families and households are $50,893 and $44,286 respectively.
| Characteristic | Number | Measure |
| Per Capita Income | 122 | $10,541 |
| Median Family Income | 15 | $50,893 |
| Mean Family Income | 15 | $53,707 |
| Median Household Income | 24 | $44,286 |
| Mean Household Income | 24 | $48,196 |
| Income Deficit | 15 | $0 |
| Wage / Income Gap (%) | 122 | 90.41% |
| Wage / Income Gap ($) | 122 | 9.59¢ per $1 |
| Gini / Inequality Index | 122 | 0.26 |
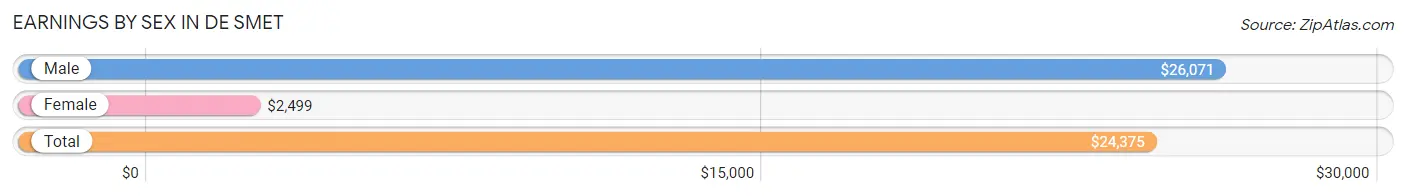
Earnings by Sex in De Smet
Average Earnings in De Smet are $24,375, $26,071 for men and $2,499 for women, a difference of 90.4%.
| Sex | Number | Average Earnings |
| Male | 22 (62.9%) | $26,071 |
| Female | 13 (37.1%) | $2,499 |
| Total | 35 (100.0%) | $24,375 |
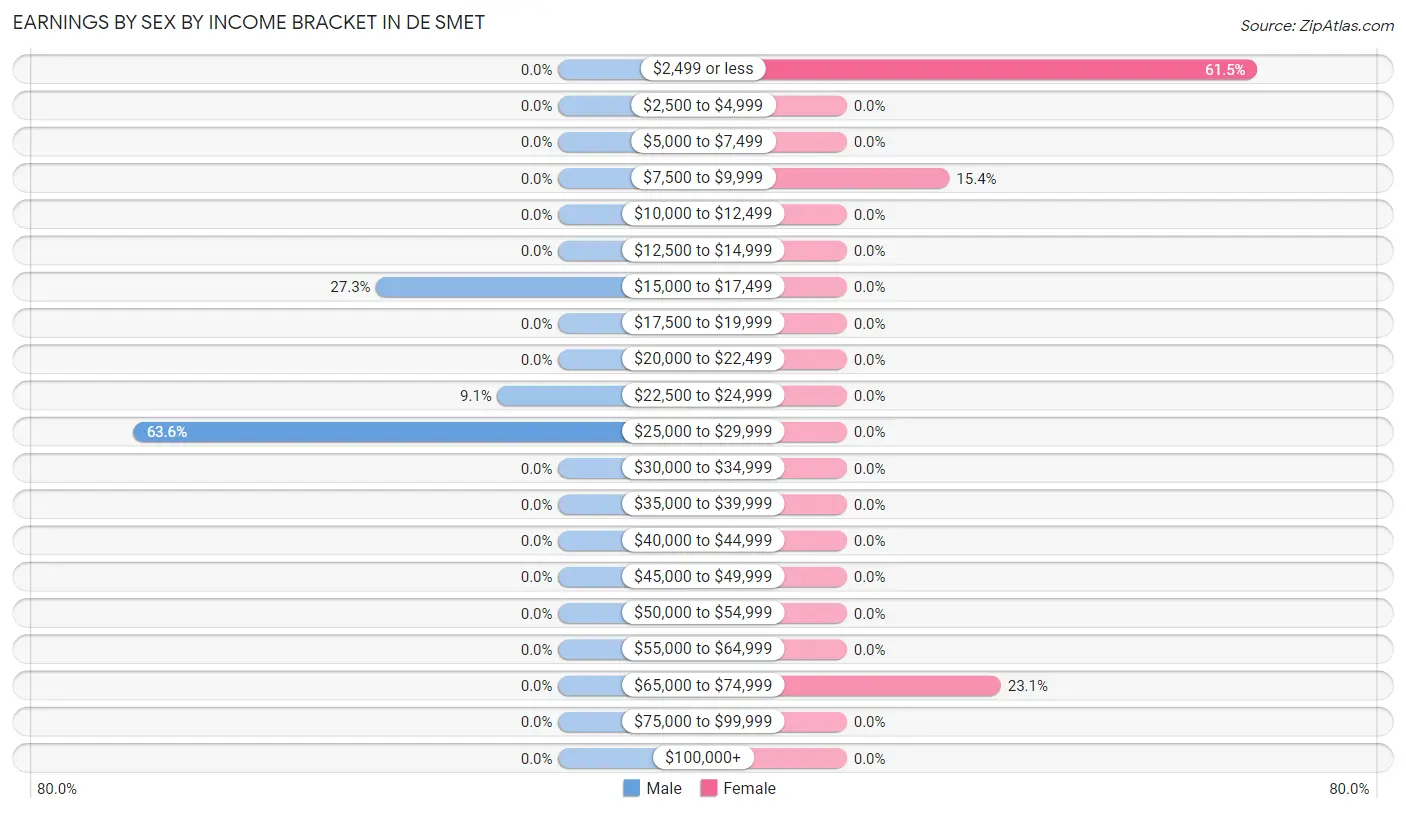
Earnings by Sex by Income Bracket in De Smet
The most common earnings brackets in De Smet are $25,000 to $29,999 for men (14 | 63.6%) and $2,499 or less for women (8 | 61.5%).
| Income | Male | Female |
| $2,499 or less | 0 (0.0%) | 8 (61.5%) |
| $2,500 to $4,999 | 0 (0.0%) | 0 (0.0%) |
| $5,000 to $7,499 | 0 (0.0%) | 0 (0.0%) |
| $7,500 to $9,999 | 0 (0.0%) | 2 (15.4%) |
| $10,000 to $12,499 | 0 (0.0%) | 0 (0.0%) |
| $12,500 to $14,999 | 0 (0.0%) | 0 (0.0%) |
| $15,000 to $17,499 | 6 (27.3%) | 0 (0.0%) |
| $17,500 to $19,999 | 0 (0.0%) | 0 (0.0%) |
| $20,000 to $22,499 | 0 (0.0%) | 0 (0.0%) |
| $22,500 to $24,999 | 2 (9.1%) | 0 (0.0%) |
| $25,000 to $29,999 | 14 (63.6%) | 0 (0.0%) |
| $30,000 to $34,999 | 0 (0.0%) | 0 (0.0%) |
| $35,000 to $39,999 | 0 (0.0%) | 0 (0.0%) |
| $40,000 to $44,999 | 0 (0.0%) | 0 (0.0%) |
| $45,000 to $49,999 | 0 (0.0%) | 0 (0.0%) |
| $50,000 to $54,999 | 0 (0.0%) | 0 (0.0%) |
| $55,000 to $64,999 | 0 (0.0%) | 0 (0.0%) |
| $65,000 to $74,999 | 0 (0.0%) | 3 (23.1%) |
| $75,000 to $99,999 | 0 (0.0%) | 0 (0.0%) |
| $100,000+ | 0 (0.0%) | 0 (0.0%) |
| Total | 22 (100.0%) | 13 (100.0%) |
Earnings by Sex by Educational Attainment in De Smet
| Educational Attainment | Male Income | Female Income |
| Less than High School | - | - |
| High School Diploma | - | - |
| College or Associate's Degree | - | - |
| Bachelor's Degree | - | - |
| Graduate Degree | - | - |
| Total | $24,375 | $0 |
Family Income in De Smet
Family Income Brackets in De Smet
According to the De Smet family income data, there are 7 families falling into the $50,000 to $74,999 income range, which is the most common income bracket and makes up 46.7% of all families.
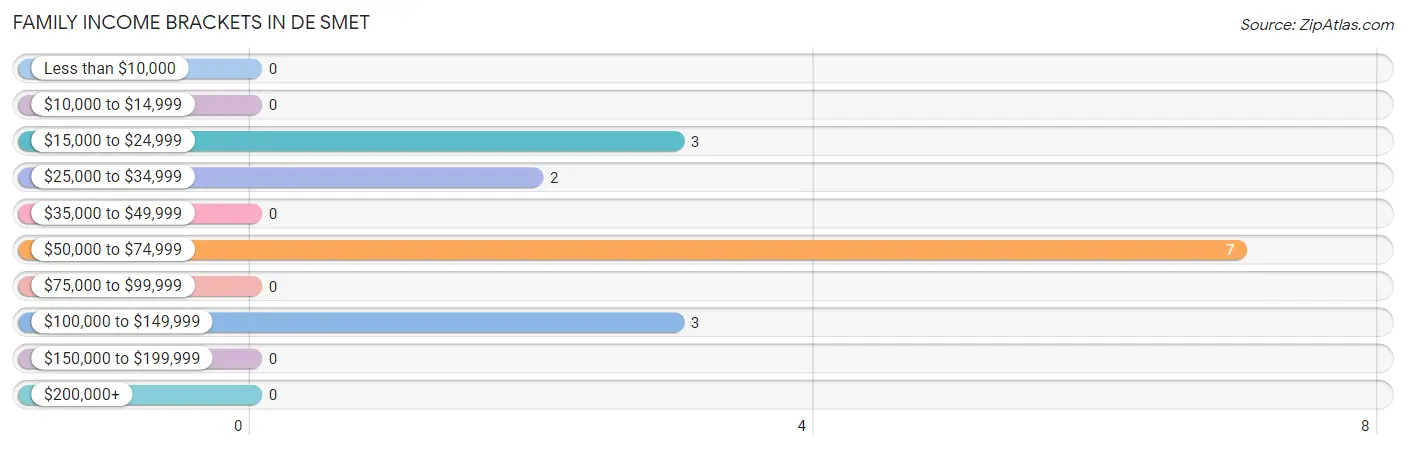
| Income Bracket | # Families | % Families |
| Less than $10,000 | 0 | 0.0% |
| $10,000 to $14,999 | 0 | 0.0% |
| $15,000 to $24,999 | 3 | 20.0% |
| $25,000 to $34,999 | 2 | 13.3% |
| $35,000 to $49,999 | 0 | 0.0% |
| $50,000 to $74,999 | 7 | 46.7% |
| $75,000 to $99,999 | 0 | 0.0% |
| $100,000 to $149,999 | 3 | 20.0% |
| $150,000 to $199,999 | 0 | 0.0% |
| $200,000+ | 0 | 0.0% |
Family Income by Famaliy Size in De Smet
| Income Bracket | # Families | Median Income |
| 2-Person Families | 0 (0.0%) | $0 |
| 3-Person Families | 6 (40.0%) | $0 |
| 4-Person Families | 0 (0.0%) | $0 |
| 5-Person Families | 0 (0.0%) | $0 |
| 6-Person Families | 9 (60.0%) | $0 |
| 7+ Person Families | 0 (0.0%) | $0 |
| Total | 15 (100.0%) | $50,893 |
Family Income by Number of Earners in De Smet
| Number of Earners | # Families | Median Income |
| No Earners | 3 (20.0%) | $0 |
| 1 Earner | 10 (66.7%) | $0 |
| 2 Earners | 2 (13.3%) | $0 |
| 3+ Earners | 0 (0.0%) | $0 |
| Total | 15 (100.0%) | $50,893 |
Household Income in De Smet
Household Income Brackets in De Smet
With 7 households falling in the category, the $35,000 to $49,999 income range is the most frequent in De Smet, accounting for 29.2% of all households.
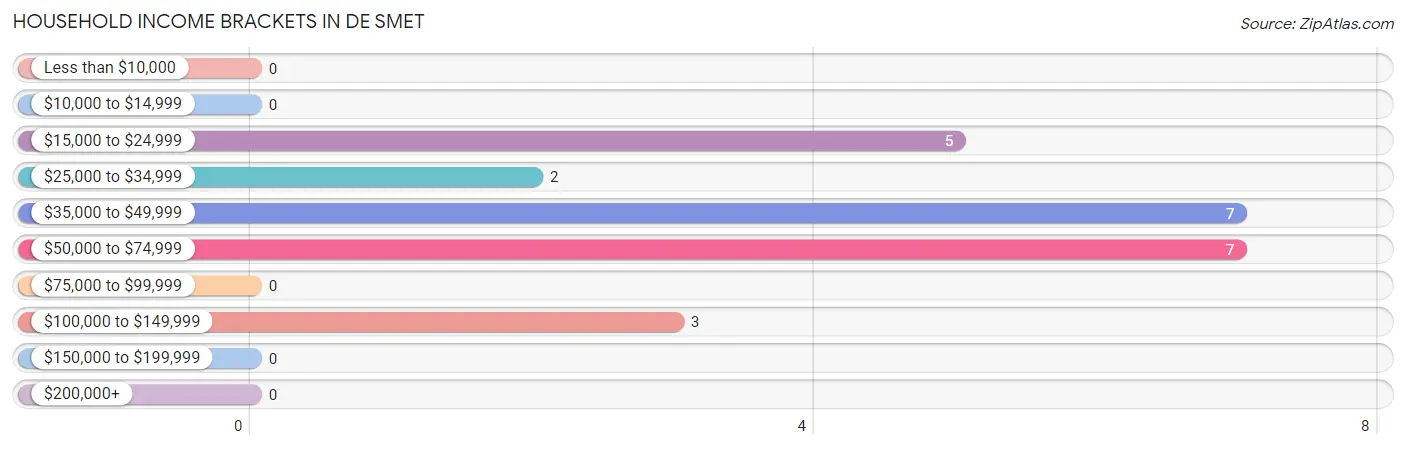
| Income Bracket | # Households | % Households |
| Less than $10,000 | 0 | 0.0% |
| $10,000 to $14,999 | 0 | 0.0% |
| $15,000 to $24,999 | 5 | 20.8% |
| $25,000 to $34,999 | 2 | 8.3% |
| $35,000 to $49,999 | 7 | 29.2% |
| $50,000 to $74,999 | 7 | 29.2% |
| $75,000 to $99,999 | 0 | 0.0% |
| $100,000 to $149,999 | 3 | 12.5% |
| $150,000 to $199,999 | 0 | 0.0% |
| $200,000+ | 0 | 0.0% |
Household Income by Householder Age in De Smet
| Income Bracket | # Households | Median Income |
| 15 to 24 Years | 7 (29.2%) | $0 |
| 25 to 44 Years | 2 (8.3%) | $0 |
| 45 to 64 Years | 9 (37.5%) | $0 |
| 65+ Years | 6 (25.0%) | $0 |
| Total | 24 (100.0%) | $44,286 |
Poverty in De Smet
Income Below Poverty by Sex and Age in De Smet
With 23.6% poverty level for males and 44.8% for females among the residents of De Smet, 45 to 54 year old males and under 5 year old females are the most vulnerable to poverty, with 6 males (100.0%) and 2 females (100.0%) in their respective age groups living below the poverty level.
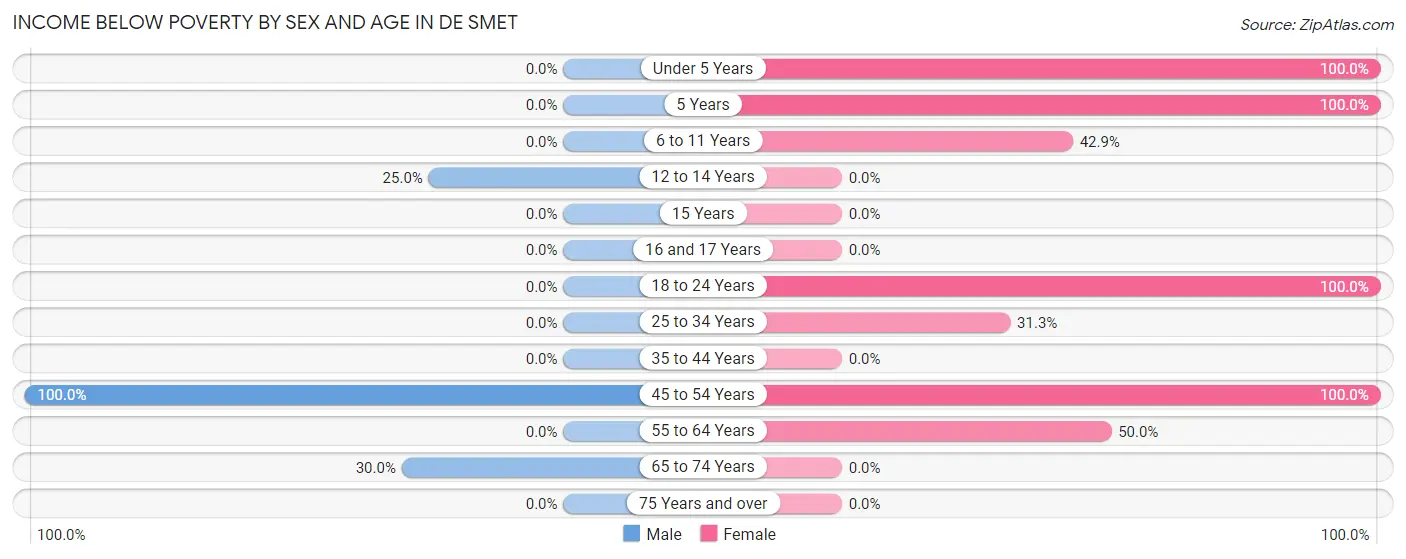
| Age Bracket | Male | Female |
| Under 5 Years | 0 (0.0%) | 2 (100.0%) |
| 5 Years | 0 (0.0%) | 3 (100.0%) |
| 6 to 11 Years | 0 (0.0%) | 3 (42.9%) |
| 12 to 14 Years | 4 (25.0%) | 0 (0.0%) |
| 15 Years | 0 (0.0%) | 0 (0.0%) |
| 16 and 17 Years | 0 (0.0%) | 0 (0.0%) |
| 18 to 24 Years | 0 (0.0%) | 8 (100.0%) |
| 25 to 34 Years | 0 (0.0%) | 5 (31.2%) |
| 35 to 44 Years | 0 (0.0%) | 0 (0.0%) |
| 45 to 54 Years | 6 (100.0%) | 2 (100.0%) |
| 55 to 64 Years | 0 (0.0%) | 7 (50.0%) |
| 65 to 74 Years | 3 (30.0%) | 0 (0.0%) |
| 75 Years and over | 0 (0.0%) | 0 (0.0%) |
| Total | 13 (23.6%) | 30 (44.8%) |
Income Above Poverty by Sex and Age in De Smet
According to the poverty statistics in De Smet, males aged 6 to 11 years and females aged 15 years are the age groups that are most secure financially, with 100.0% of males and 100.0% of females in these age groups living above the poverty line.
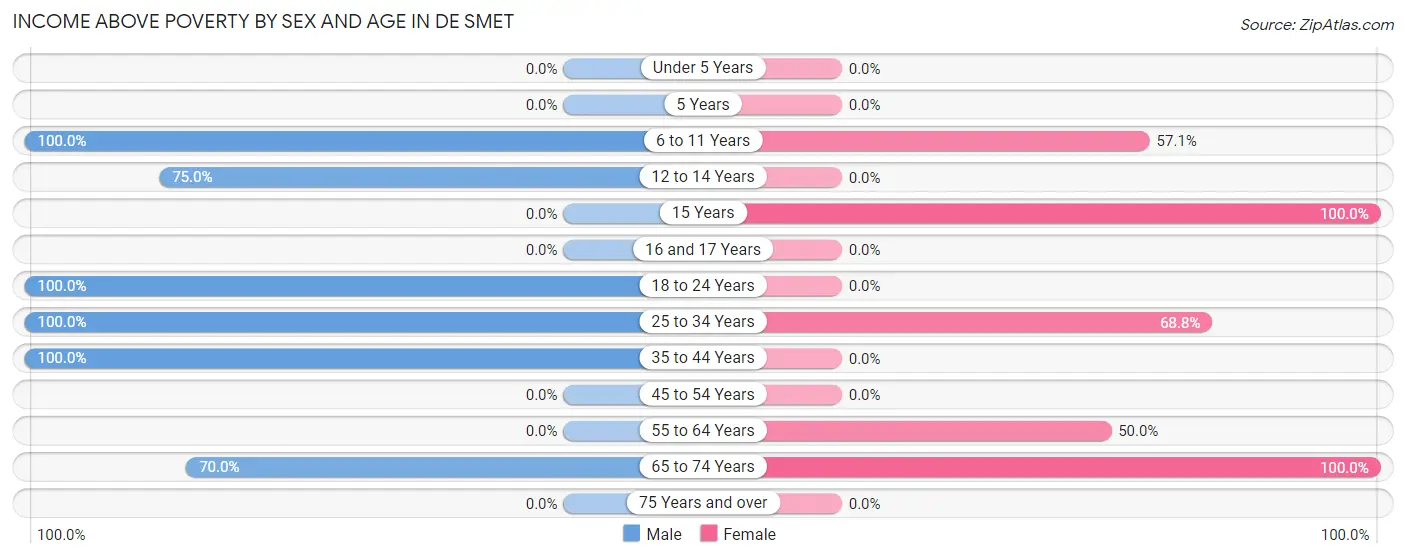
| Age Bracket | Male | Female |
| Under 5 Years | 0 (0.0%) | 0 (0.0%) |
| 5 Years | 0 (0.0%) | 0 (0.0%) |
| 6 to 11 Years | 4 (100.0%) | 4 (57.1%) |
| 12 to 14 Years | 12 (75.0%) | 0 (0.0%) |
| 15 Years | 0 (0.0%) | 12 (100.0%) |
| 16 and 17 Years | 0 (0.0%) | 0 (0.0%) |
| 18 to 24 Years | 7 (100.0%) | 0 (0.0%) |
| 25 to 34 Years | 2 (100.0%) | 11 (68.8%) |
| 35 to 44 Years | 10 (100.0%) | 0 (0.0%) |
| 45 to 54 Years | 0 (0.0%) | 0 (0.0%) |
| 55 to 64 Years | 0 (0.0%) | 7 (50.0%) |
| 65 to 74 Years | 7 (70.0%) | 3 (100.0%) |
| 75 Years and over | 0 (0.0%) | 0 (0.0%) |
| Total | 42 (76.4%) | 37 (55.2%) |
Income Below Poverty Among Married-Couple Families in De Smet
The poverty statistics for married-couple families in De Smet show that 41.7% or 5 of the total 12 families live below the poverty line. Families with 3 or 4 children have the highest poverty rate of 100.0%, comprising of 2 families. On the other hand, families with 1 or 2 children have the lowest poverty rate of 30.0%, which includes 3 families.
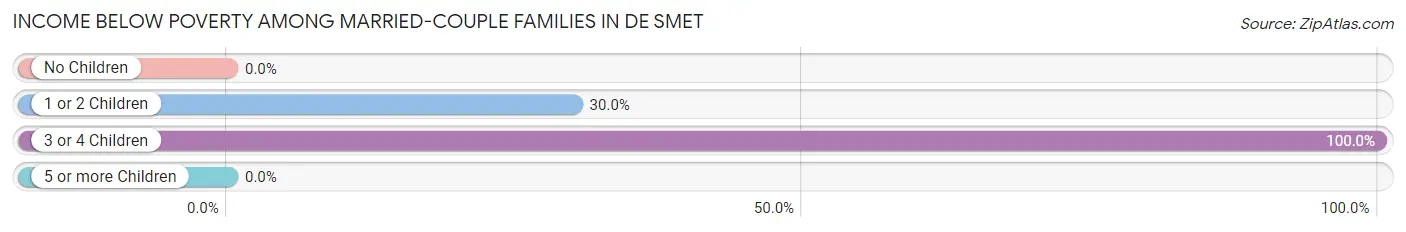
| Children | Above Poverty | Below Poverty |
| No Children | 0 (0.0%) | 0 (0.0%) |
| 1 or 2 Children | 7 (70.0%) | 3 (30.0%) |
| 3 or 4 Children | 0 (0.0%) | 2 (100.0%) |
| 5 or more Children | 0 (0.0%) | 0 (0.0%) |
| Total | 7 (58.3%) | 5 (41.7%) |
Income Below Poverty Among Single-Parent Households in De Smet
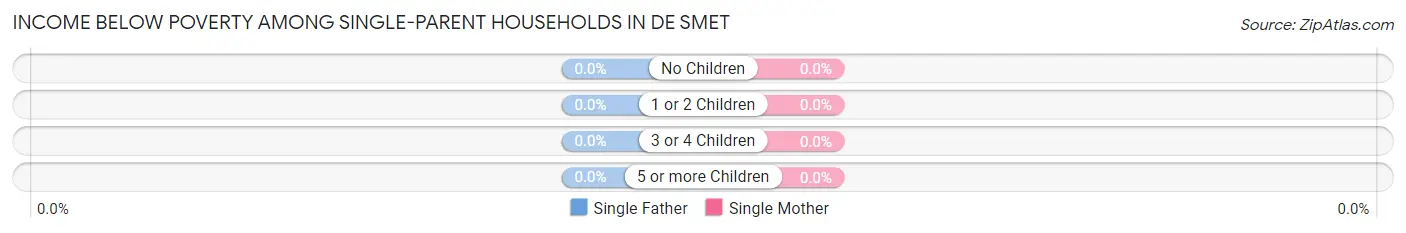
| Children | Single Father | Single Mother |
| No Children | 0 (0.0%) | 0 (0.0%) |
| 1 or 2 Children | 0 (0.0%) | 0 (0.0%) |
| 3 or 4 Children | 0 (0.0%) | 0 (0.0%) |
| 5 or more Children | 0 (0.0%) | 0 (0.0%) |
| Total | 0 (0.0%) | 0 (0.0%) |
Income Below Poverty Among Married-Couple vs Single-Parent Households in De Smet
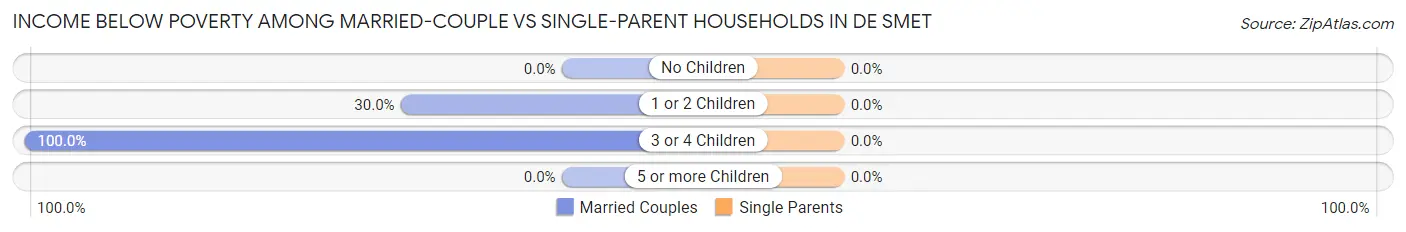
| Children | Married-Couple Families | Single-Parent Households |
| No Children | 0 (0.0%) | 0 (0.0%) |
| 1 or 2 Children | 3 (30.0%) | 0 (0.0%) |
| 3 or 4 Children | 2 (100.0%) | 0 (0.0%) |
| 5 or more Children | 0 (0.0%) | 0 (0.0%) |
| Total | 5 (41.7%) | 0 (0.0%) |
Race in De Smet
The most populous races in De Smet are Native / Alaskan (100 | 82.0%), Hispanic or Latino (80 | 65.6%), and White / Caucasian (14 | 11.5%).
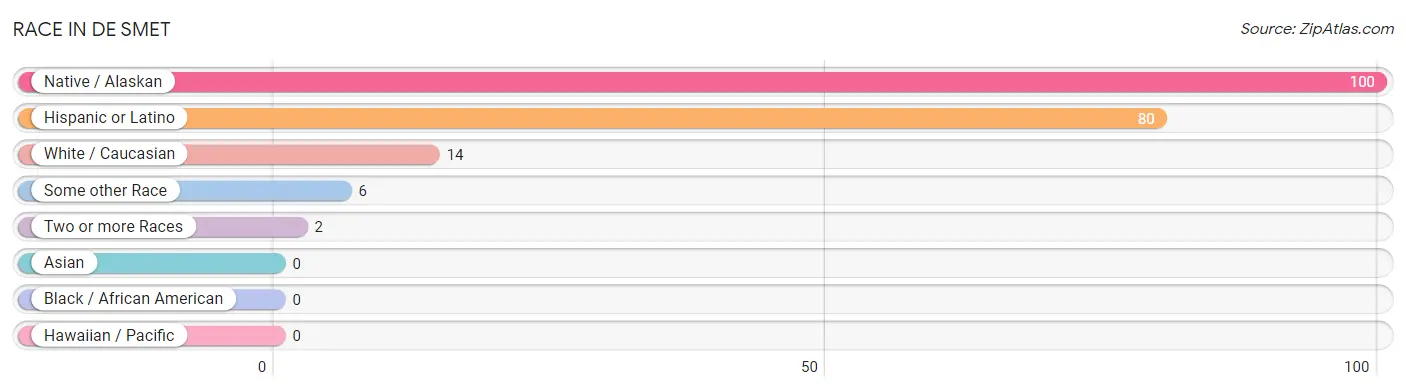
| Race | # Population | % Population |
| Asian | 0 | 0.0% |
| Black / African American | 0 | 0.0% |
| Hawaiian / Pacific | 0 | 0.0% |
| Hispanic or Latino | 80 | 65.6% |
| Native / Alaskan | 100 | 82.0% |
| White / Caucasian | 14 | 11.5% |
| Two or more Races | 2 | 1.6% |
| Some other Race | 6 | 4.9% |
| Total | 122 | 100.0% |
Ancestry in De Smet
The most populous ancestries reported in De Smet are Mexican (65 | 53.3%), and Colville (13 | 10.7%), together accounting for 63.9% of all De Smet residents.
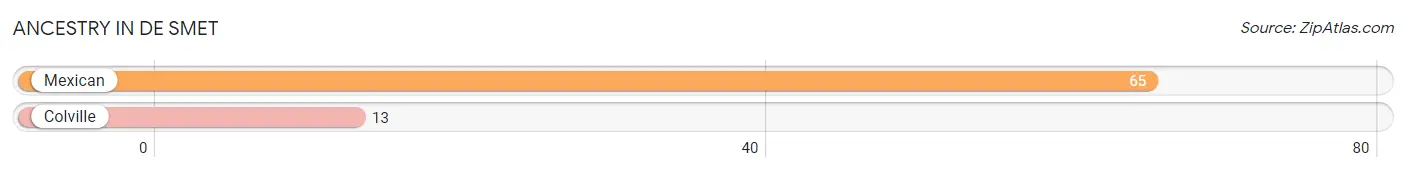
| Ancestry | # Population | % Population |
| Colville | 13 | 10.7% |
| Mexican | 65 | 53.3% | View All 2 Rows |
Immigrants in De Smet
The most numerous immigrant groups reported in De Smet came from Central America (6 | 4.9%), Latin America (6 | 4.9%), and Mexico (6 | 4.9%), together accounting for 14.8% of all De Smet residents.
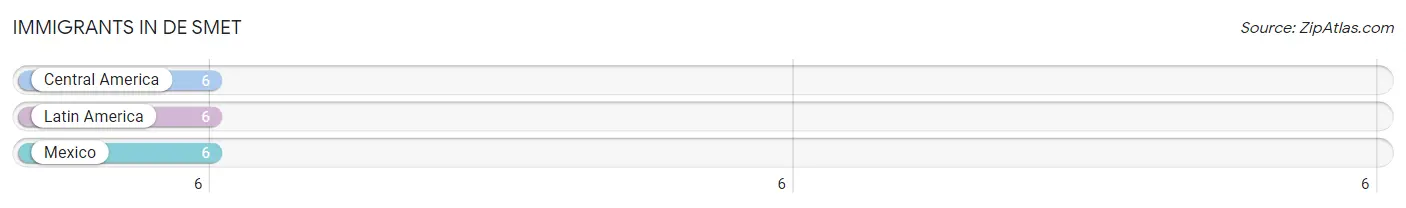
| Immigration Origin | # Population | % Population |
| Central America | 6 | 4.9% |
| Latin America | 6 | 4.9% |
| Mexico | 6 | 4.9% | View All 3 Rows |
Sex and Age in De Smet
Sex and Age in De Smet
The most populous age groups in De Smet are 10 to 14 Years (16 | 29.1%) for men and 15 to 19 Years (20 | 29.8%) for women.
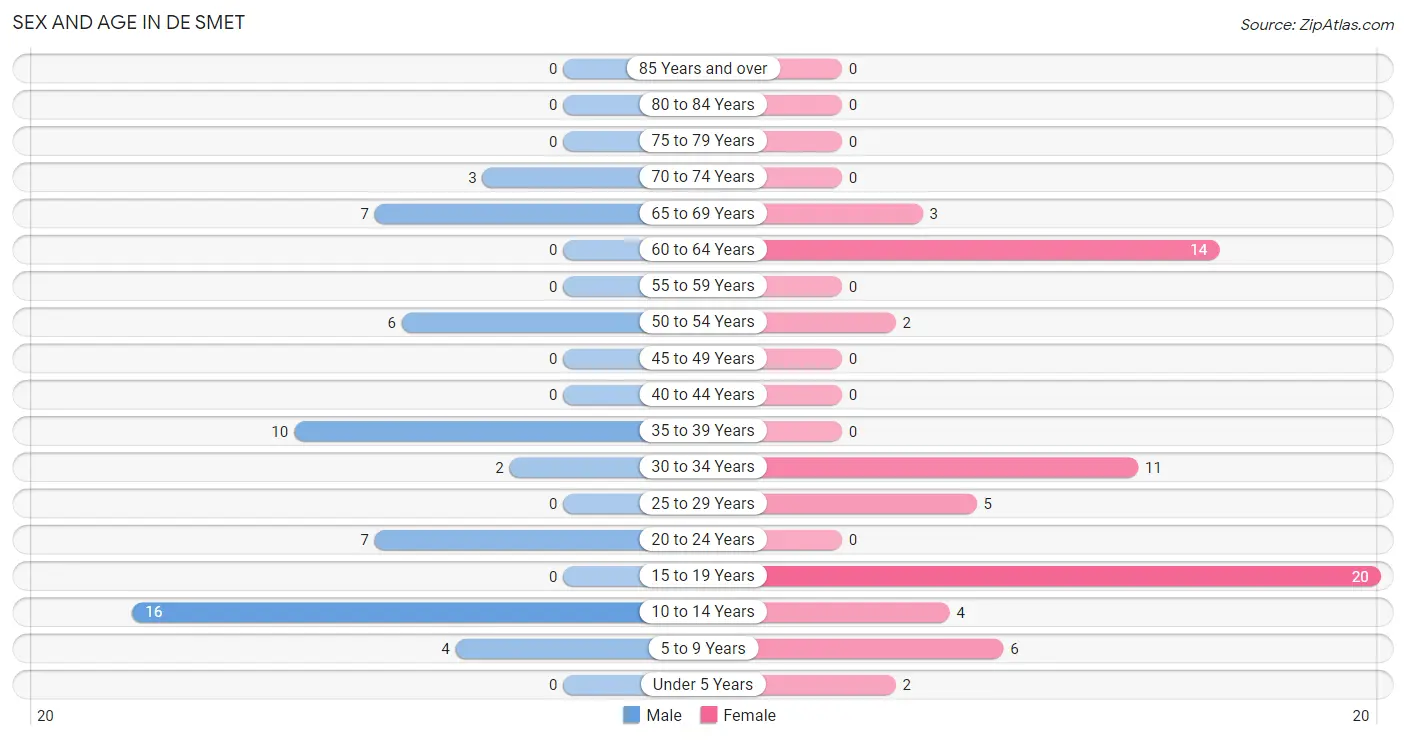
| Age Bracket | Male | Female |
| Under 5 Years | 0 (0.0%) | 2 (3.0%) |
| 5 to 9 Years | 4 (7.3%) | 6 (9.0%) |
| 10 to 14 Years | 16 (29.1%) | 4 (6.0%) |
| 15 to 19 Years | 0 (0.0%) | 20 (29.8%) |
| 20 to 24 Years | 7 (12.7%) | 0 (0.0%) |
| 25 to 29 Years | 0 (0.0%) | 5 (7.5%) |
| 30 to 34 Years | 2 (3.6%) | 11 (16.4%) |
| 35 to 39 Years | 10 (18.2%) | 0 (0.0%) |
| 40 to 44 Years | 0 (0.0%) | 0 (0.0%) |
| 45 to 49 Years | 0 (0.0%) | 0 (0.0%) |
| 50 to 54 Years | 6 (10.9%) | 2 (3.0%) |
| 55 to 59 Years | 0 (0.0%) | 0 (0.0%) |
| 60 to 64 Years | 0 (0.0%) | 14 (20.9%) |
| 65 to 69 Years | 7 (12.7%) | 3 (4.5%) |
| 70 to 74 Years | 3 (5.4%) | 0 (0.0%) |
| 75 to 79 Years | 0 (0.0%) | 0 (0.0%) |
| 80 to 84 Years | 0 (0.0%) | 0 (0.0%) |
| 85 Years and over | 0 (0.0%) | 0 (0.0%) |
| Total | 55 (100.0%) | 67 (100.0%) |
Families and Households in De Smet
Median Family Size in De Smet
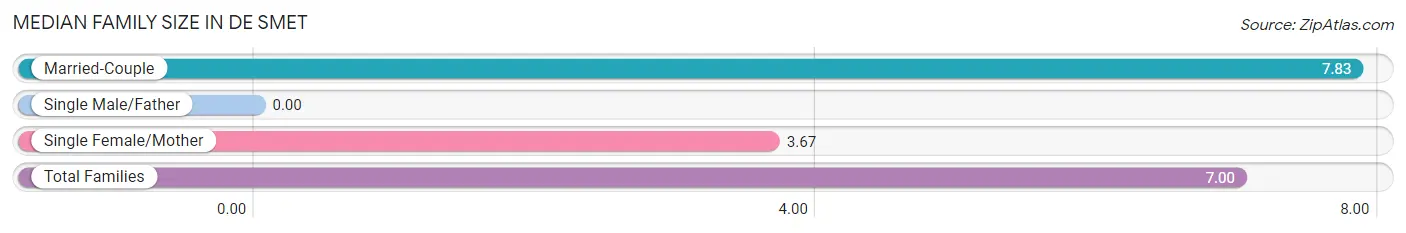
| Family Type | # Families | Family Size |
| Married-Couple | 12 (80.0%) | 7.83 |
| Single Male/Father | 0 (0.0%) | - |
| Single Female/Mother | 3 (20.0%) | 3.67 |
| Total Families | 15 (100.0%) | 7.00 |
Median Household Size in De Smet
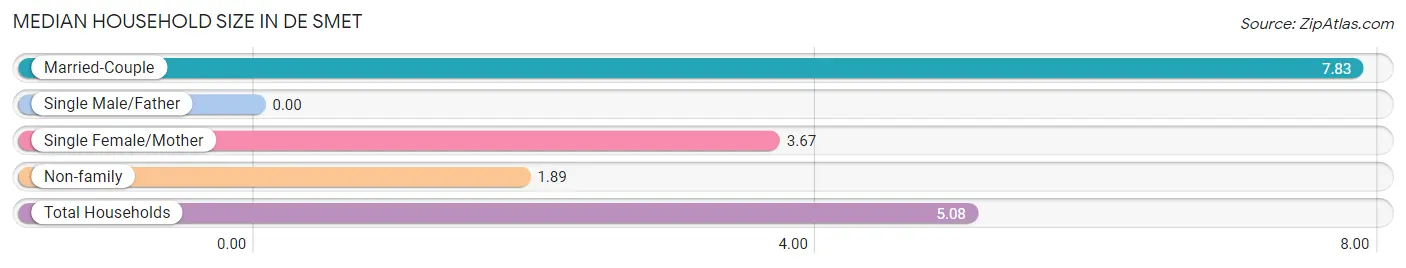
| Household Type | # Households | Household Size |
| Married-Couple | 12 (50.0%) | 7.83 |
| Single Male/Father | 0 (0.0%) | - |
| Single Female/Mother | 3 (12.5%) | 3.67 |
| Non-family | 9 (37.5%) | 1.89 |
| Total Households | 24 (100.0%) | 5.08 |
Household Size by Marriage Status in De Smet
Out of a total of 24 households in De Smet, 15 (62.5%) are family households, while 9 (37.5%) are nonfamily households. The most numerous type of family households are 6-person households, comprising 9, and the most common type of nonfamily households are 2-person households, comprising 7.
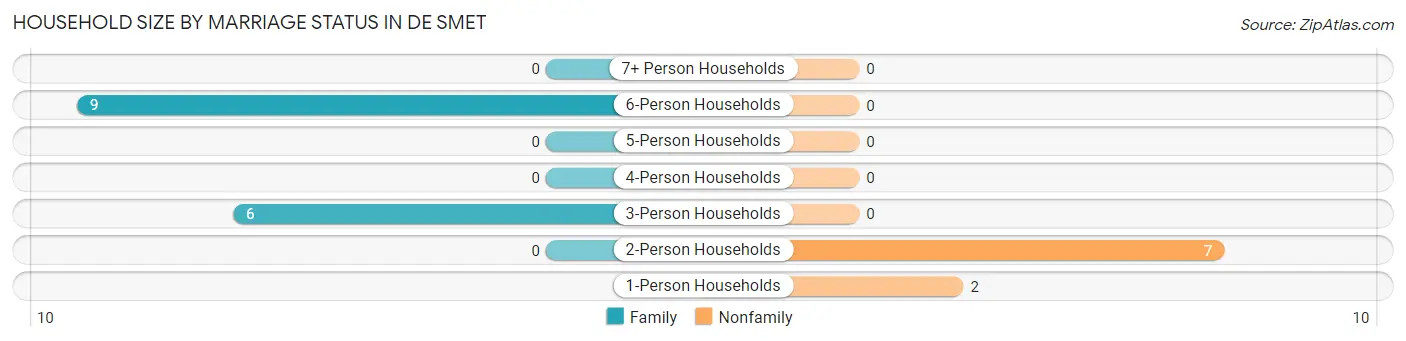
| Household Size | Family Households | Nonfamily Households |
| 1-Person Households | - | 2 (8.3%) |
| 2-Person Households | 0 (0.0%) | 7 (29.2%) |
| 3-Person Households | 6 (25.0%) | 0 (0.0%) |
| 4-Person Households | 0 (0.0%) | 0 (0.0%) |
| 5-Person Households | 0 (0.0%) | 0 (0.0%) |
| 6-Person Households | 9 (37.5%) | 0 (0.0%) |
| 7+ Person Households | 0 (0.0%) | 0 (0.0%) |
| Total | 15 (62.5%) | 9 (37.5%) |
Female Fertility in De Smet
Fertility by Age in De Smet
| Age Bracket | Women with Births | Births / 1,000 Women |
| 15 to 19 years | 0 (0.0%) | 0.0 |
| 20 to 34 years | 0 (0.0%) | 0.0 |
| 35 to 50 years | 0 (0.0%) | 0.0 |
| Total | 0 (0.0%) | 0.0 |
Fertility by Age by Marriage Status in De Smet
| Age Bracket | Married | Unmarried |
| 15 to 19 years | 0 (0.0%) | 0 (0.0%) |
| 20 to 34 years | 0 (0.0%) | 0 (0.0%) |
| 35 to 50 years | 0 (0.0%) | 0 (0.0%) |
| Total | 0 (0.0%) | 0 (0.0%) |
Fertility by Education in De Smet
| Educational Attainment | Women with Births | Births / 1,000 Women |
| Less than High School | 0 (0.0%) | 0.0 |
| High School Diploma | 0 (0.0%) | 0.0 |
| College or Associate's Degree | 0 (0.0%) | 0.0 |
| Bachelor's Degree | 0 (0.0%) | 0.0 |
| Graduate Degree | 0 (0.0%) | 0.0 |
| Total | 0 (0.0%) | 0.0 |
Fertility by Education by Marriage Status in De Smet
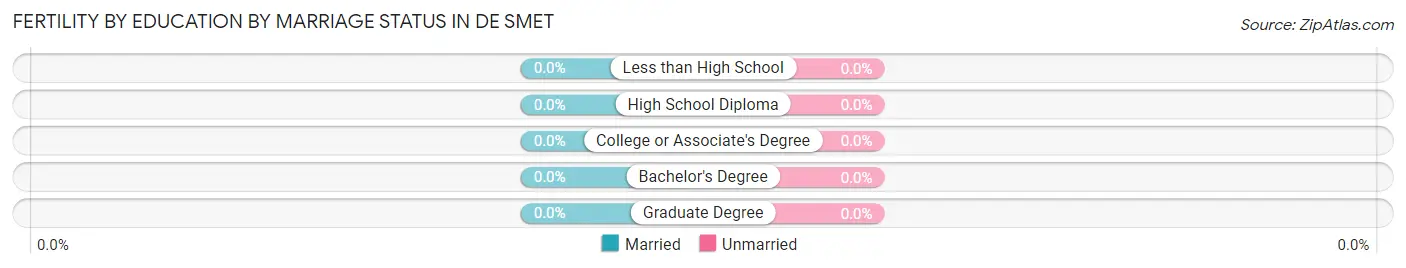
| Educational Attainment | Married | Unmarried |
| Less than High School | 0 (0.0%) | 0 (0.0%) |
| High School Diploma | 0 (0.0%) | 0 (0.0%) |
| College or Associate's Degree | 0 (0.0%) | 0 (0.0%) |
| Bachelor's Degree | 0 (0.0%) | 0 (0.0%) |
| Graduate Degree | 0 (0.0%) | 0 (0.0%) |
| Total | 0 (0.0%) | 0 (0.0%) |
Employment Characteristics in De Smet
Employment by Class of Employer in De Smet
Among the 35 employed individuals in De Smet, private company employees (23 | 65.7%), state government employees (7 | 20.0%), and local government employees (3 | 8.6%) make up the most common classes of employment.
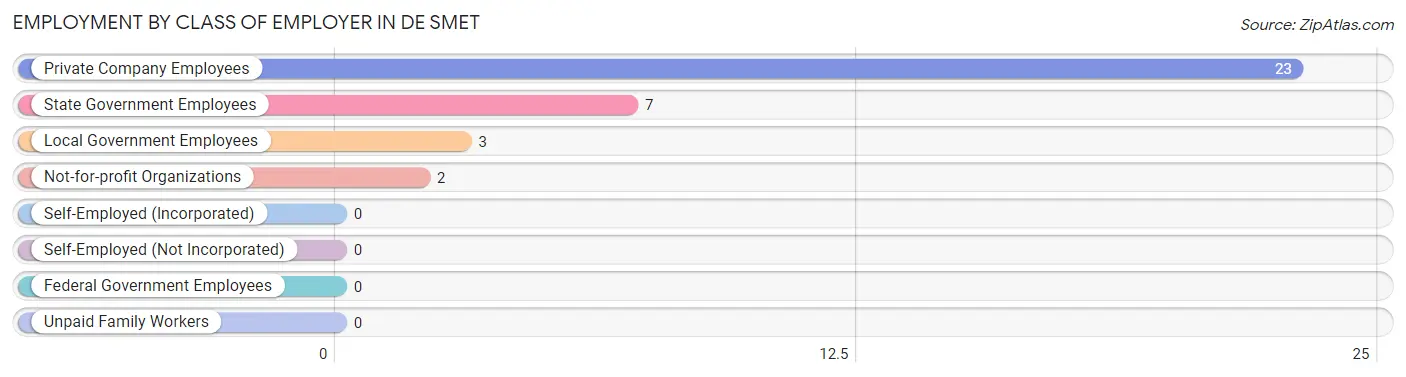
| Employer Class | # Employees | % Employees |
| Private Company Employees | 23 | 65.7% |
| Self-Employed (Incorporated) | 0 | 0.0% |
| Self-Employed (Not Incorporated) | 0 | 0.0% |
| Not-for-profit Organizations | 2 | 5.7% |
| Local Government Employees | 3 | 8.6% |
| State Government Employees | 7 | 20.0% |
| Federal Government Employees | 0 | 0.0% |
| Unpaid Family Workers | 0 | 0.0% |
| Total | 35 | 100.0% |
Employment Status by Age in De Smet
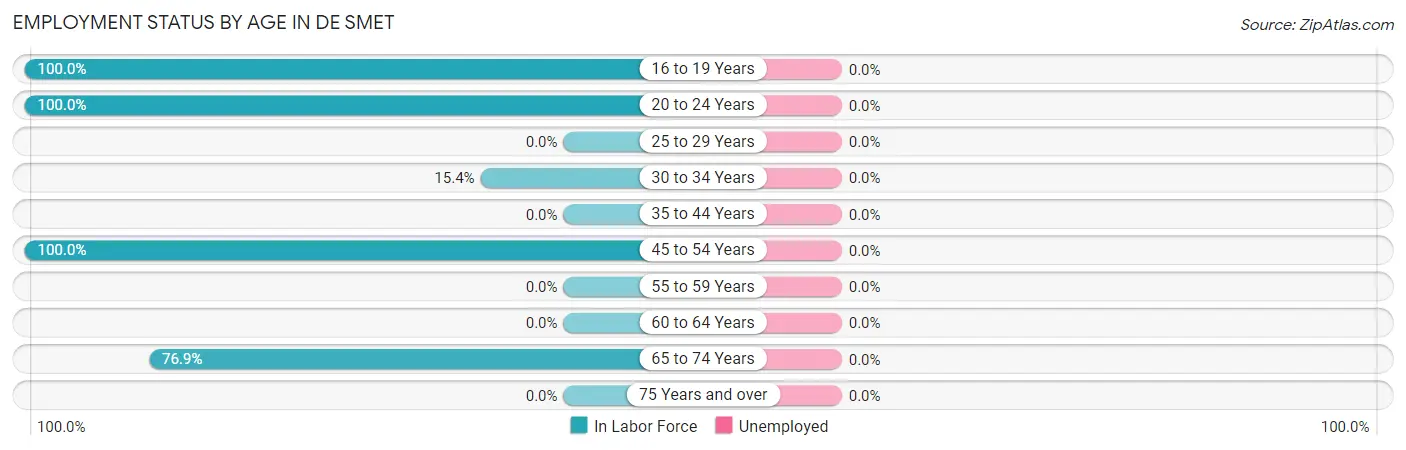
| Age Bracket | In Labor Force | Unemployed |
| 16 to 19 Years | 8 (100.0%) | 0 (0.0%) |
| 20 to 24 Years | 7 (100.0%) | 0 (0.0%) |
| 25 to 29 Years | 0 (0.0%) | 0 (0.0%) |
| 30 to 34 Years | 2 (15.4%) | 0 (0.0%) |
| 35 to 44 Years | 0 (0.0%) | 0 (0.0%) |
| 45 to 54 Years | 8 (100.0%) | 0 (0.0%) |
| 55 to 59 Years | 0 (0.0%) | 0 (0.0%) |
| 60 to 64 Years | 0 (0.0%) | 0 (0.0%) |
| 65 to 74 Years | 10 (76.9%) | 0 (0.0%) |
| 75 Years and over | 0 (0.0%) | 0 (0.0%) |
| Total | 35 (44.9%) | 0 (0.0%) |
Employment Status by Educational Attainment in De Smet
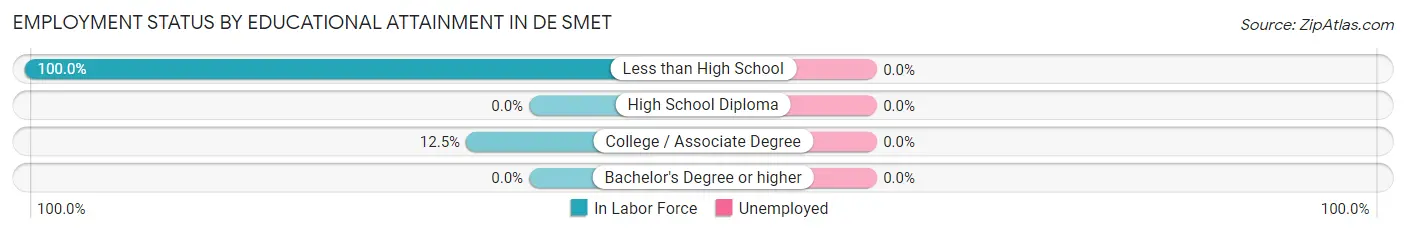
| Educational Attainment | In Labor Force | Unemployed |
| Less than High School | 8 (100.0%) | 0 (0.0%) |
| High School Diploma | 0 (0.0%) | 0 (0.0%) |
| College / Associate Degree | 2 (12.5%) | 0 (0.0%) |
| Bachelor's Degree or higher | 0 (0.0%) | 0 (0.0%) |
| Total | 10 (20.0%) | 0 (0.0%) |
Employment Occupations by Sex in De Smet
Management, Business, Science and Arts Occupations
Management, Business, Science and Arts Occupations by Sex
| Occupation | Male | Female |
| Management | 0 (0.0%) | 0 (0.0%) |
| Business & Financial | 0 (0.0%) | 0 (0.0%) |
| Computers, Engineering & Science | 0 (0.0%) | 0 (0.0%) |
| Computers & Mathematics | 0 (0.0%) | 0 (0.0%) |
| Architecture & Engineering | 0 (0.0%) | 0 (0.0%) |
| Life, Physical & Social Science | 0 (0.0%) | 0 (0.0%) |
| Community & Social Service | 0 (0.0%) | 0 (0.0%) |
| Education, Arts & Media | 0 (0.0%) | 0 (0.0%) |
| Legal Services & Support | 0 (0.0%) | 0 (0.0%) |
| Education Instruction & Library | 0 (0.0%) | 0 (0.0%) |
| Arts, Media & Entertainment | 0 (0.0%) | 0 (0.0%) |
| Health Diagnosing & Treating | 0 (0.0%) | 0 (0.0%) |
| Health Technologists | 0 (0.0%) | 0 (0.0%) |
| Total (Category) | 0 (0.0%) | 0 (0.0%) |
| Total (Overall) | 22 (62.9%) | 13 (37.1%) |
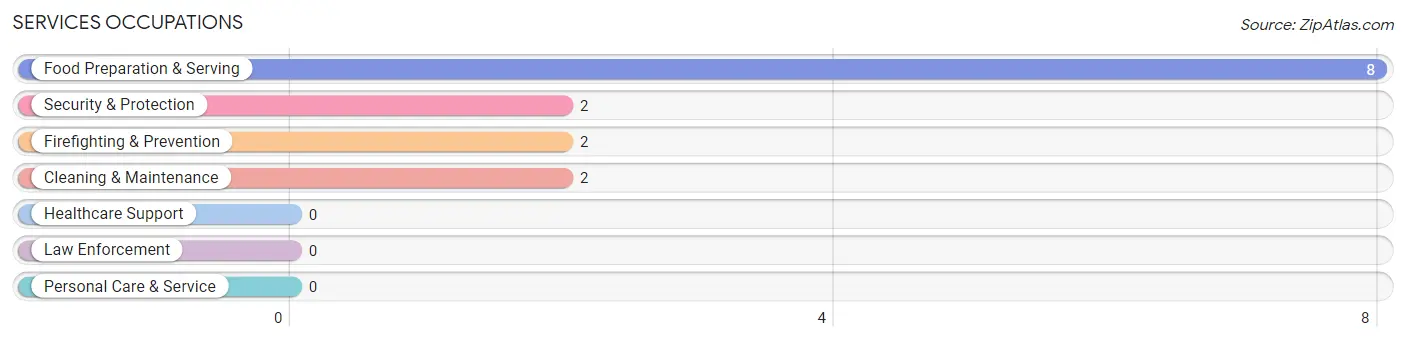
Services Occupations
The most common Services occupations in De Smet are Food Preparation & Serving (8 | 22.9%), Security & Protection (2 | 5.7%), Firefighting & Prevention (2 | 5.7%), and Cleaning & Maintenance (2 | 5.7%).
Services Occupations by Sex
Within the Services occupations in De Smet, the most male-oriented occupations are Security & Protection (100.0%), and Firefighting & Prevention (100.0%), while the most female-oriented occupations are Food Preparation & Serving (100.0%), and Cleaning & Maintenance (100.0%).
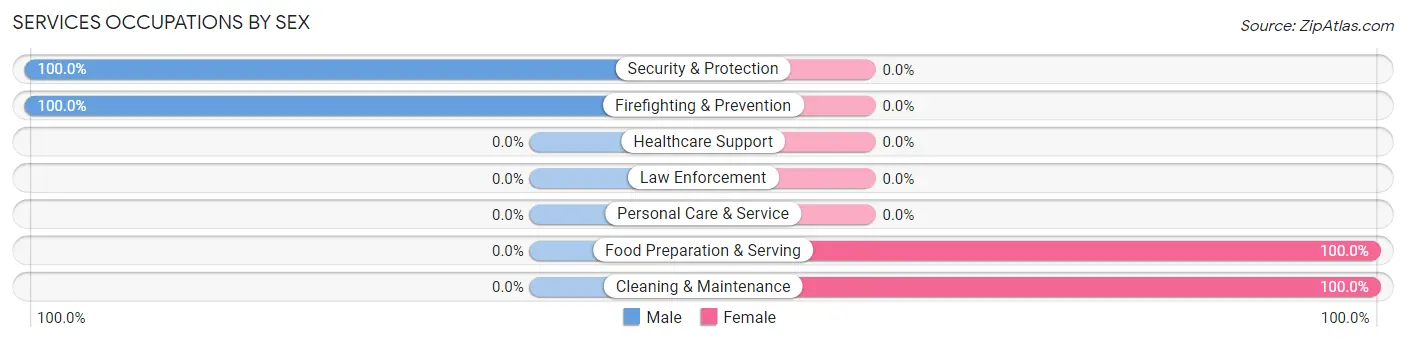
| Occupation | Male | Female |
| Healthcare Support | 0 (0.0%) | 0 (0.0%) |
| Security & Protection | 2 (100.0%) | 0 (0.0%) |
| Firefighting & Prevention | 2 (100.0%) | 0 (0.0%) |
| Law Enforcement | 0 (0.0%) | 0 (0.0%) |
| Food Preparation & Serving | 0 (0.0%) | 8 (100.0%) |
| Cleaning & Maintenance | 0 (0.0%) | 2 (100.0%) |
| Personal Care & Service | 0 (0.0%) | 0 (0.0%) |
| Total (Category) | 2 (16.7%) | 10 (83.3%) |
| Total (Overall) | 22 (62.9%) | 13 (37.1%) |
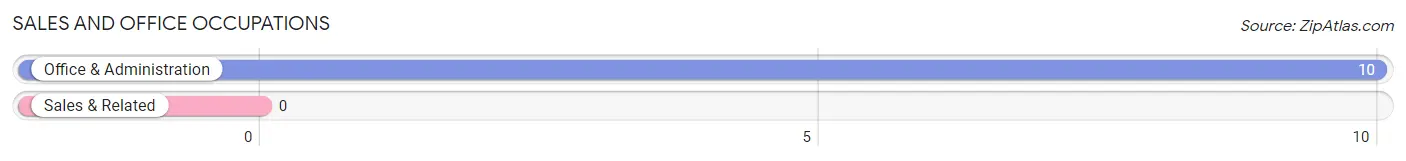
Sales and Office Occupations
The most common Sales and Office occupations in De Smet are , and Office & Administration (10 | 28.6%).
Sales and Office Occupations by Sex
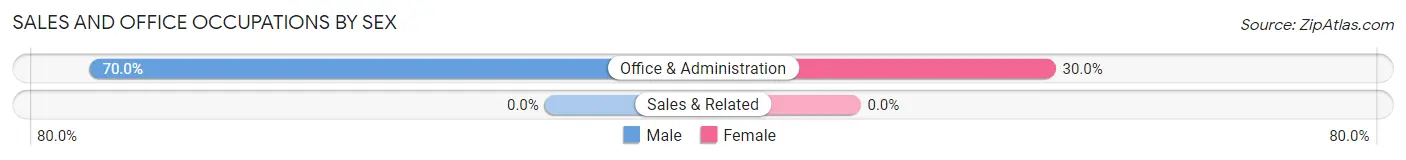
| Occupation | Male | Female |
| Sales & Related | 0 (0.0%) | 0 (0.0%) |
| Office & Administration | 7 (70.0%) | 3 (30.0%) |
| Total (Category) | 7 (70.0%) | 3 (30.0%) |
| Total (Overall) | 22 (62.9%) | 13 (37.1%) |
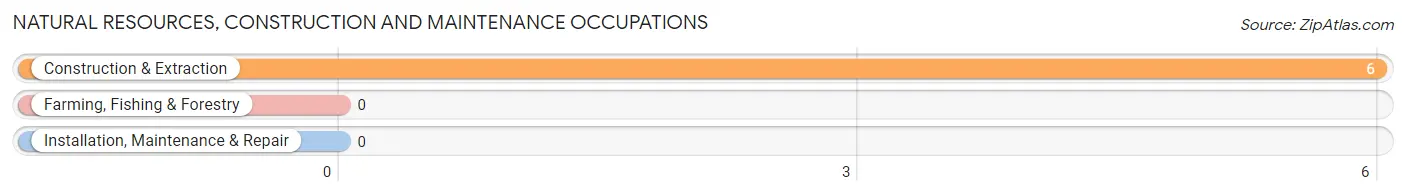
Natural Resources, Construction and Maintenance Occupations
The most common Natural Resources, Construction and Maintenance occupations in De Smet are , and Construction & Extraction (6 | 17.1%).
Natural Resources, Construction and Maintenance Occupations by Sex
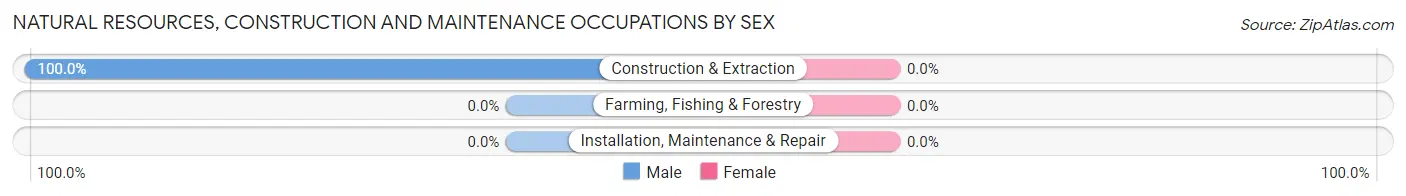
| Occupation | Male | Female |
| Farming, Fishing & Forestry | 0 (0.0%) | 0 (0.0%) |
| Construction & Extraction | 6 (100.0%) | 0 (0.0%) |
| Installation, Maintenance & Repair | 0 (0.0%) | 0 (0.0%) |
| Total (Category) | 6 (100.0%) | 0 (0.0%) |
| Total (Overall) | 22 (62.9%) | 13 (37.1%) |
Production, Transportation and Moving Occupations
The most common Production, Transportation and Moving occupations in De Smet are , and Production (7 | 20.0%).
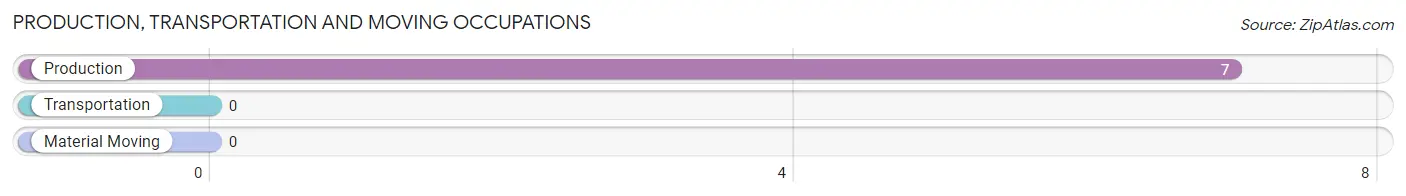
Production, Transportation and Moving Occupations by Sex
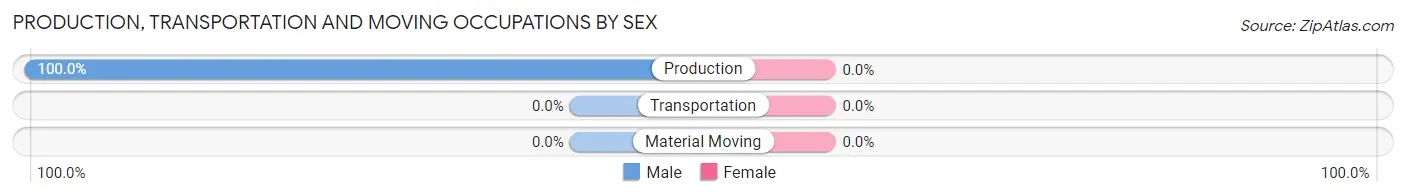
| Occupation | Male | Female |
| Production | 7 (100.0%) | 0 (0.0%) |
| Transportation | 0 (0.0%) | 0 (0.0%) |
| Material Moving | 0 (0.0%) | 0 (0.0%) |
| Total (Category) | 7 (100.0%) | 0 (0.0%) |
| Total (Overall) | 22 (62.9%) | 13 (37.1%) |
Employment Industries by Sex in De Smet
Employment Industries in De Smet
The major employment industries in De Smet include Accommodation & Food Services (14 | 40.0%), Manufacturing (7 | 20.0%), Public Administration (7 | 20.0%), Arts, Entertainment & Recreation (4 | 11.4%), and Health Care & Social Assistance (3 | 8.6%).
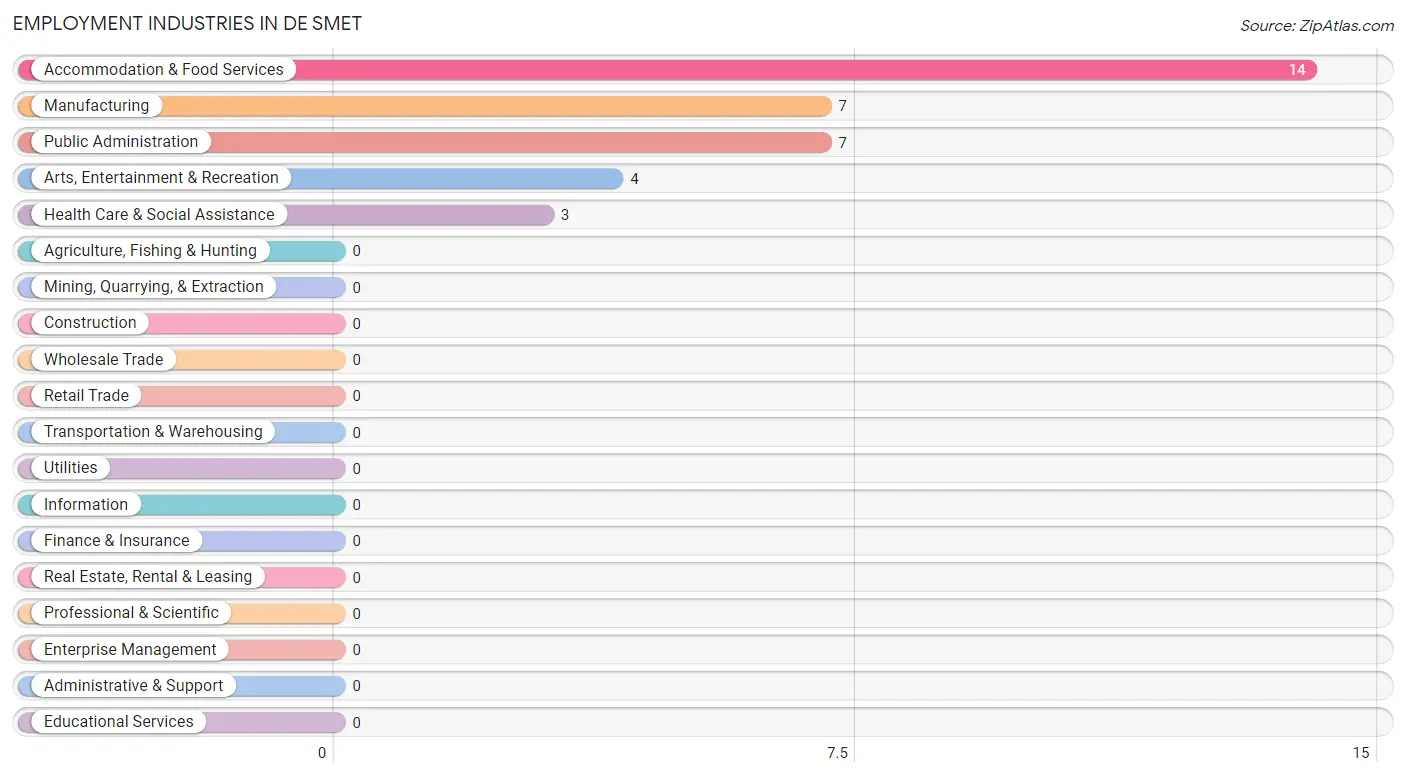
Employment Industries by Sex in De Smet
The De Smet industries that see more men than women are Manufacturing (100.0%), Public Administration (100.0%), and Arts, Entertainment & Recreation (50.0%), whereas the industries that tend to have a higher number of women are Health Care & Social Assistance (100.0%), Accommodation & Food Services (57.1%), and Arts, Entertainment & Recreation (50.0%).
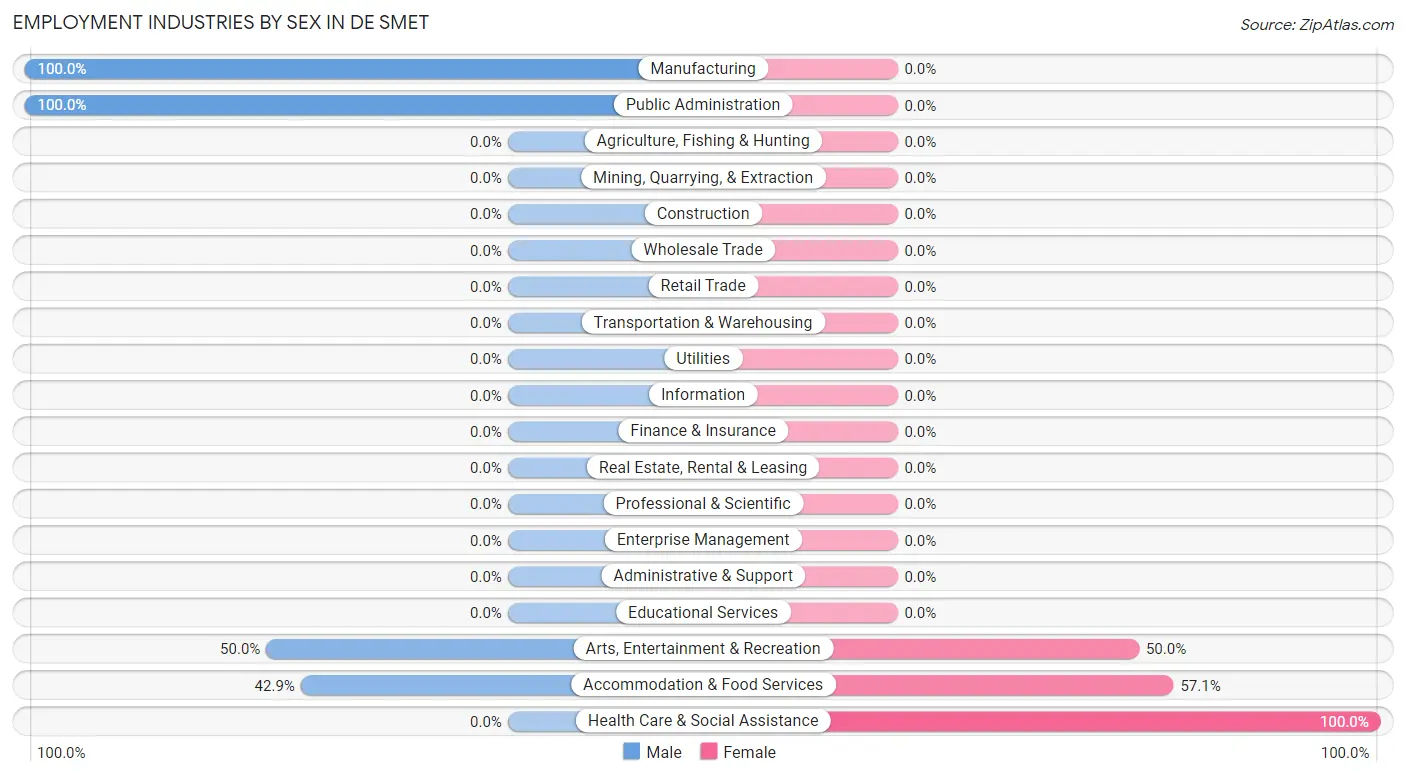
| Industry | Male | Female |
| Agriculture, Fishing & Hunting | 0 (0.0%) | 0 (0.0%) |
| Mining, Quarrying, & Extraction | 0 (0.0%) | 0 (0.0%) |
| Construction | 0 (0.0%) | 0 (0.0%) |
| Manufacturing | 7 (100.0%) | 0 (0.0%) |
| Wholesale Trade | 0 (0.0%) | 0 (0.0%) |
| Retail Trade | 0 (0.0%) | 0 (0.0%) |
| Transportation & Warehousing | 0 (0.0%) | 0 (0.0%) |
| Utilities | 0 (0.0%) | 0 (0.0%) |
| Information | 0 (0.0%) | 0 (0.0%) |
| Finance & Insurance | 0 (0.0%) | 0 (0.0%) |
| Real Estate, Rental & Leasing | 0 (0.0%) | 0 (0.0%) |
| Professional & Scientific | 0 (0.0%) | 0 (0.0%) |
| Enterprise Management | 0 (0.0%) | 0 (0.0%) |
| Administrative & Support | 0 (0.0%) | 0 (0.0%) |
| Educational Services | 0 (0.0%) | 0 (0.0%) |
| Health Care & Social Assistance | 0 (0.0%) | 3 (100.0%) |
| Arts, Entertainment & Recreation | 2 (50.0%) | 2 (50.0%) |
| Accommodation & Food Services | 6 (42.9%) | 8 (57.1%) |
| Public Administration | 7 (100.0%) | 0 (0.0%) |
| Total | 22 (62.9%) | 13 (37.1%) |
Education in De Smet
School Enrollment in De Smet
The most common levels of schooling among the 49 students in De Smet are middle school (20 | 40.8%), high school (20 | 40.8%), and elementary school (7 | 14.3%).
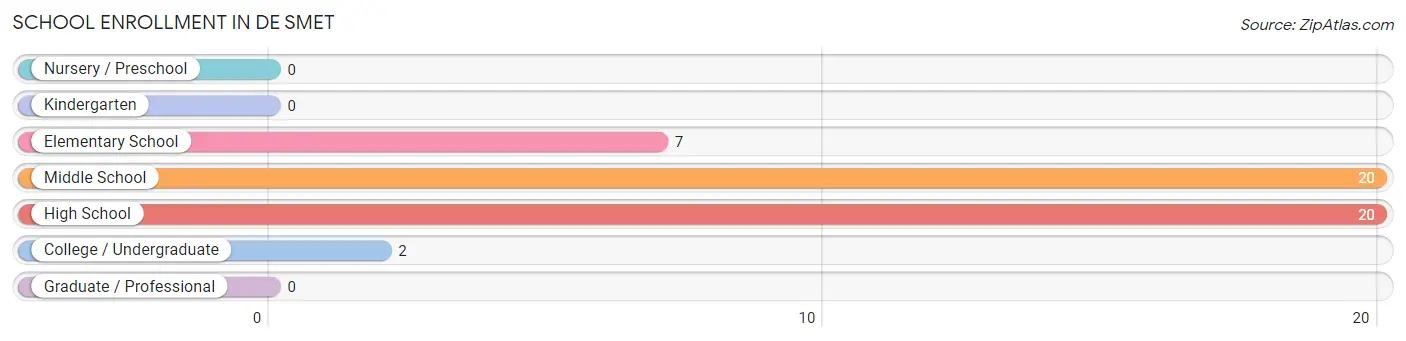
| School Level | # Students | % Students |
| Nursery / Preschool | 0 | 0.0% |
| Kindergarten | 0 | 0.0% |
| Elementary School | 7 | 14.3% |
| Middle School | 20 | 40.8% |
| High School | 20 | 40.8% |
| College / Undergraduate | 2 | 4.1% |
| Graduate / Professional | 0 | 0.0% |
| Total | 49 | 100.0% |
School Enrollment by Age by Funding Source in De Smet
Out of a total of 49 students who are enrolled in schools in De Smet, 20 (40.8%) attend a private institution, while the remaining 29 (59.2%) are enrolled in public schools. The age group of 10 to 14 year olds has the highest likelihood of being enrolled in private schools, with 16 (80.0% in the age bracket) enrolled. Conversely, the age group of 15 to 17 year olds has the lowest likelihood of being enrolled in a private school, with 12 (100.0% in the age bracket) attending a public institution.
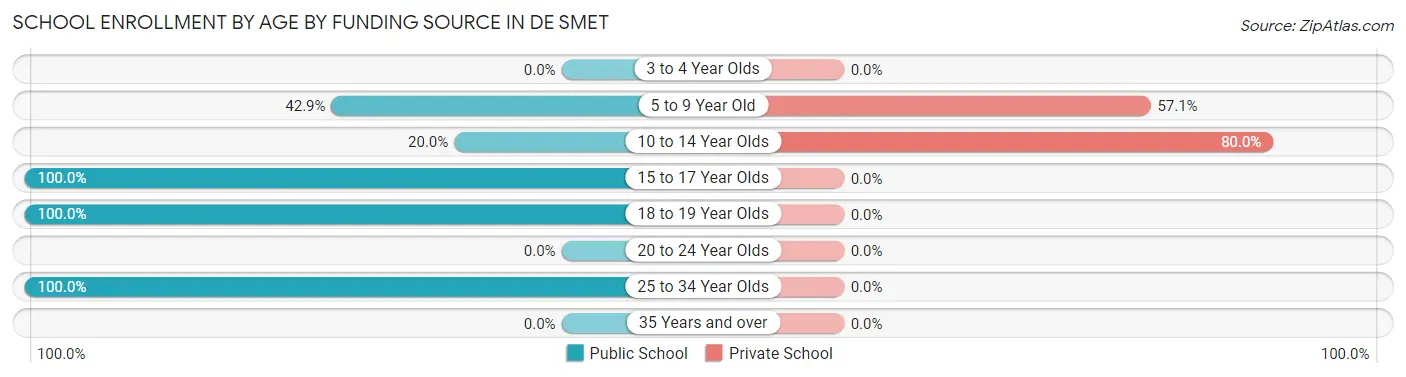
| Age Bracket | Public School | Private School |
| 3 to 4 Year Olds | 0 (0.0%) | 0 (0.0%) |
| 5 to 9 Year Old | 3 (42.9%) | 4 (57.1%) |
| 10 to 14 Year Olds | 4 (20.0%) | 16 (80.0%) |
| 15 to 17 Year Olds | 12 (100.0%) | 0 (0.0%) |
| 18 to 19 Year Olds | 8 (100.0%) | 0 (0.0%) |
| 20 to 24 Year Olds | 0 (0.0%) | 0 (0.0%) |
| 25 to 34 Year Olds | 2 (100.0%) | 0 (0.0%) |
| 35 Years and over | 0 (0.0%) | 0 (0.0%) |
| Total | 29 (59.2%) | 20 (40.8%) |
Educational Attainment by Field of Study in De Smet
| Field of Study | # Graduates | % Graduates |
| Computers & Mathematics | 0 | 0.0% |
| Bio, Nature & Agricultural | 0 | 0.0% |
| Physical & Health Sciences | 0 | 0.0% |
| Psychology | 0 | 0.0% |
| Social Sciences | 0 | 0.0% |
| Engineering | 0 | 0.0% |
| Multidisciplinary Studies | 0 | 0.0% |
| Science & Technology | 0 | 0.0% |
| Business | 0 | 0.0% |
| Education | 0 | 0.0% |
| Literature & Languages | 0 | 0.0% |
| Liberal Arts & History | 0 | 0.0% |
| Visual & Performing Arts | 0 | 0.0% |
| Communications | 0 | 0.0% |
| Arts & Humanities | 0 | 0.0% |
| Total | 0 | 0.0% |
Transportation & Commute in De Smet
Vehicle Availability by Sex in De Smet
The most prevalent vehicle ownership categories in De Smet are males with 2 vehicles (16, accounting for 72.7%) and females with 2 vehicles (8, making up 123.1%).
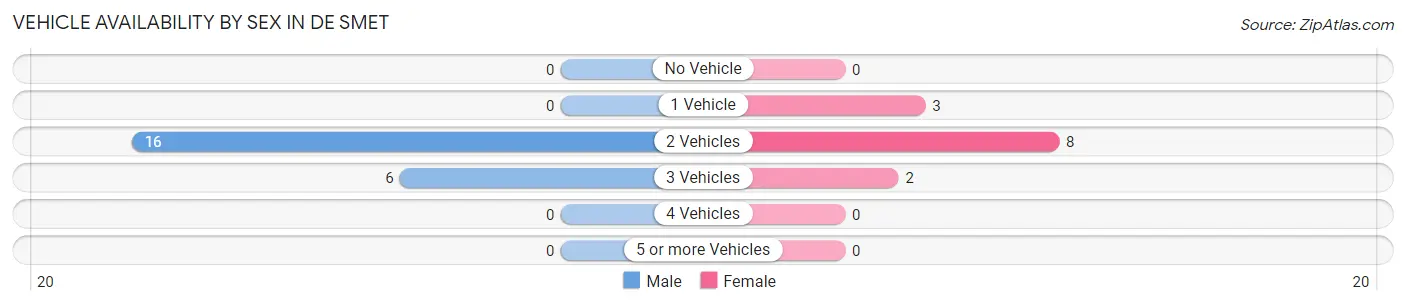
| Vehicles Available | Male | Female |
| No Vehicle | 0 (0.0%) | 0 (0.0%) |
| 1 Vehicle | 0 (0.0%) | 3 (23.1%) |
| 2 Vehicles | 16 (72.7%) | 8 (61.5%) |
| 3 Vehicles | 6 (27.3%) | 2 (15.4%) |
| 4 Vehicles | 0 (0.0%) | 0 (0.0%) |
| 5 or more Vehicles | 0 (0.0%) | 0 (0.0%) |
| Total | 22 (100.0%) | 13 (100.0%) |
Commute Time in De Smet
The most frequently occuring commute durations in De Smet are 25 to 29 minutes (15 commuters, 42.9%), 20 to 24 minutes (10 commuters, 28.6%), and 60 to 89 minutes (6 commuters, 17.1%).
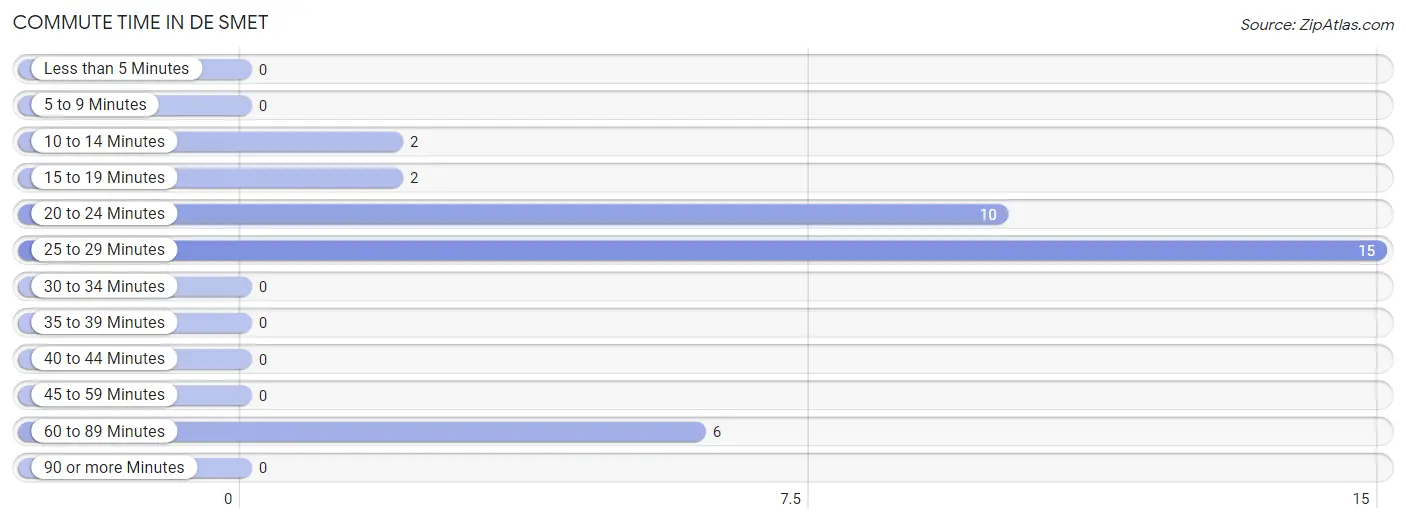
| Commute Time | # Commuters | % Commuters |
| Less than 5 Minutes | 0 | 0.0% |
| 5 to 9 Minutes | 0 | 0.0% |
| 10 to 14 Minutes | 2 | 5.7% |
| 15 to 19 Minutes | 2 | 5.7% |
| 20 to 24 Minutes | 10 | 28.6% |
| 25 to 29 Minutes | 15 | 42.9% |
| 30 to 34 Minutes | 0 | 0.0% |
| 35 to 39 Minutes | 0 | 0.0% |
| 40 to 44 Minutes | 0 | 0.0% |
| 45 to 59 Minutes | 0 | 0.0% |
| 60 to 89 Minutes | 6 | 17.1% |
| 90 or more Minutes | 0 | 0.0% |
Commute Time by Sex in De Smet
The most common commute times in De Smet are 20 to 24 minutes (7 commuters, 31.8%) for males and 25 to 29 minutes (8 commuters, 61.5%) for females.
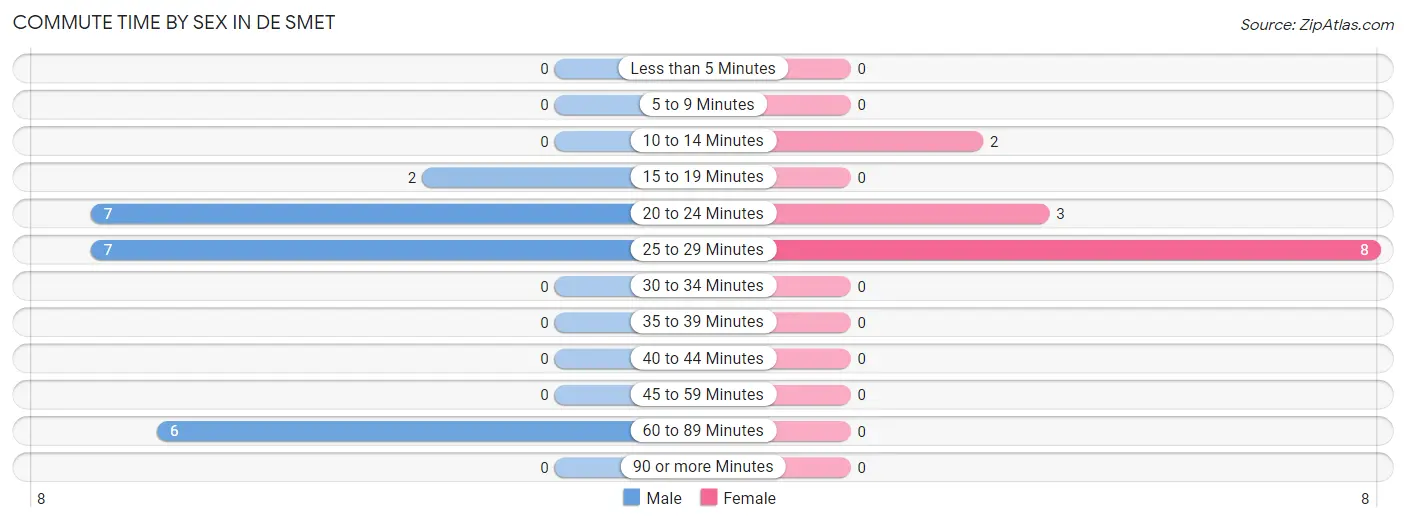
| Commute Time | Male | Female |
| Less than 5 Minutes | 0 (0.0%) | 0 (0.0%) |
| 5 to 9 Minutes | 0 (0.0%) | 0 (0.0%) |
| 10 to 14 Minutes | 0 (0.0%) | 2 (15.4%) |
| 15 to 19 Minutes | 2 (9.1%) | 0 (0.0%) |
| 20 to 24 Minutes | 7 (31.8%) | 3 (23.1%) |
| 25 to 29 Minutes | 7 (31.8%) | 8 (61.5%) |
| 30 to 34 Minutes | 0 (0.0%) | 0 (0.0%) |
| 35 to 39 Minutes | 0 (0.0%) | 0 (0.0%) |
| 40 to 44 Minutes | 0 (0.0%) | 0 (0.0%) |
| 45 to 59 Minutes | 0 (0.0%) | 0 (0.0%) |
| 60 to 89 Minutes | 6 (27.3%) | 0 (0.0%) |
| 90 or more Minutes | 0 (0.0%) | 0 (0.0%) |
Time of Departure to Work by Sex in De Smet
The most frequent times of departure to work in De Smet are 12:00 AM to 4:59 AM (7, 31.8%) for males and 4:00 PM to 11:59 PM (8, 61.5%) for females.
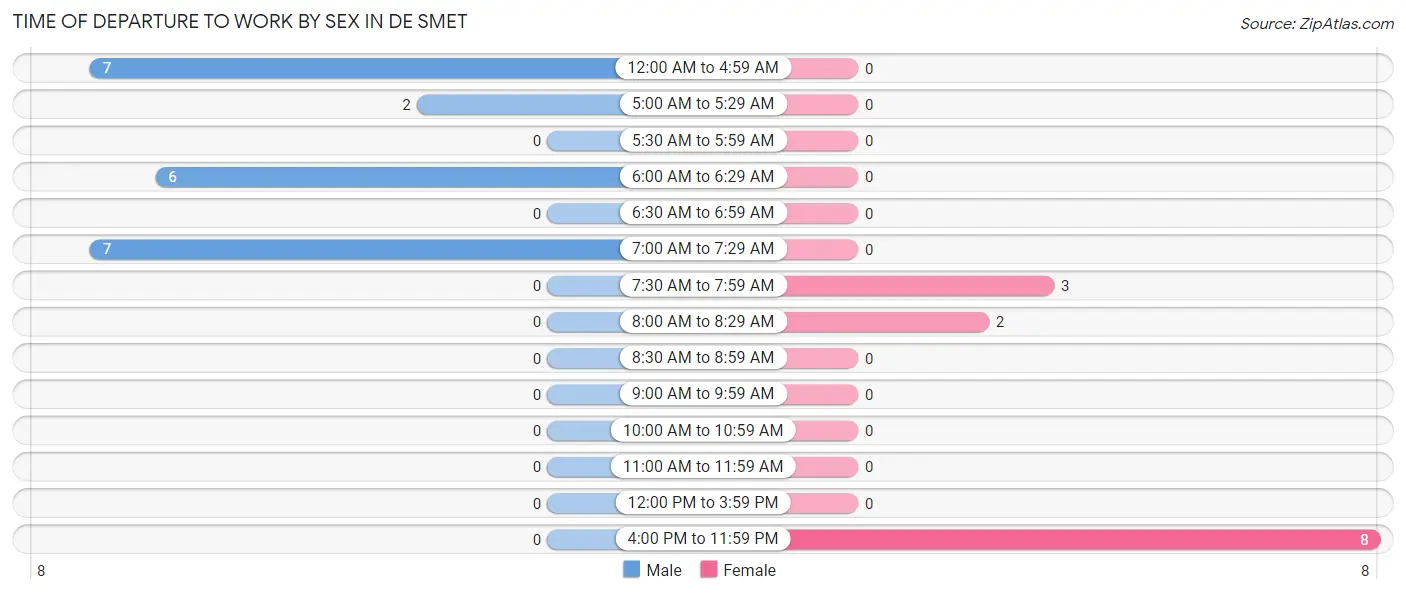
| Time of Departure | Male | Female |
| 12:00 AM to 4:59 AM | 7 (31.8%) | 0 (0.0%) |
| 5:00 AM to 5:29 AM | 2 (9.1%) | 0 (0.0%) |
| 5:30 AM to 5:59 AM | 0 (0.0%) | 0 (0.0%) |
| 6:00 AM to 6:29 AM | 6 (27.3%) | 0 (0.0%) |
| 6:30 AM to 6:59 AM | 0 (0.0%) | 0 (0.0%) |
| 7:00 AM to 7:29 AM | 7 (31.8%) | 0 (0.0%) |
| 7:30 AM to 7:59 AM | 0 (0.0%) | 3 (23.1%) |
| 8:00 AM to 8:29 AM | 0 (0.0%) | 2 (15.4%) |
| 8:30 AM to 8:59 AM | 0 (0.0%) | 0 (0.0%) |
| 9:00 AM to 9:59 AM | 0 (0.0%) | 0 (0.0%) |
| 10:00 AM to 10:59 AM | 0 (0.0%) | 0 (0.0%) |
| 11:00 AM to 11:59 AM | 0 (0.0%) | 0 (0.0%) |
| 12:00 PM to 3:59 PM | 0 (0.0%) | 0 (0.0%) |
| 4:00 PM to 11:59 PM | 0 (0.0%) | 8 (61.5%) |
| Total | 22 (100.0%) | 13 (100.0%) |
Housing Occupancy in De Smet
Occupancy by Ownership in De Smet
Of the total 24 dwellings in De Smet, owner-occupied units account for 15 (62.5%), while renter-occupied units make up 9 (37.5%).
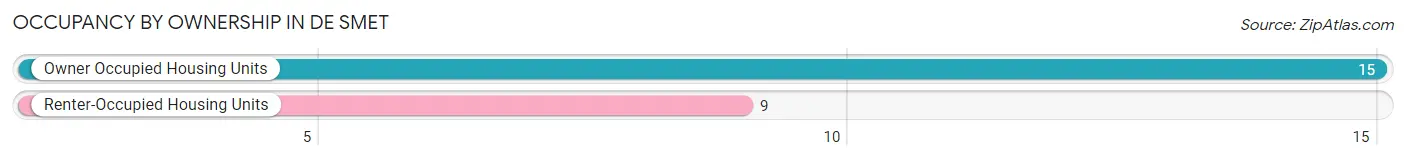
| Occupancy | # Housing Units | % Housing Units |
| Owner Occupied Housing Units | 15 | 62.5% |
| Renter-Occupied Housing Units | 9 | 37.5% |
| Total Occupied Housing Units | 24 | 100.0% |
Occupancy by Household Size in De Smet
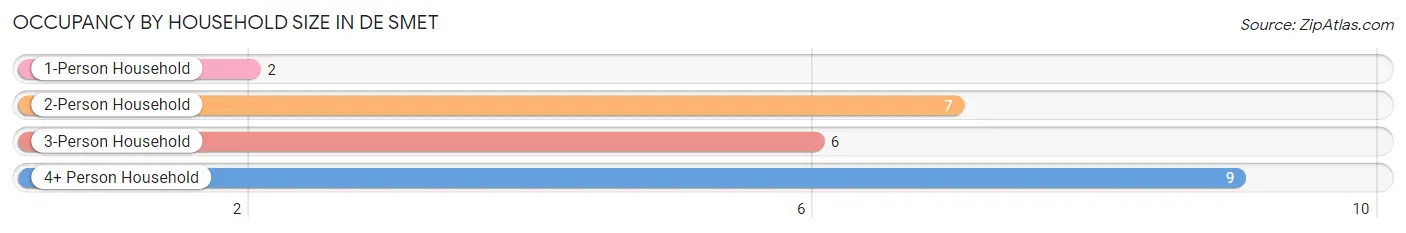
| Household Size | # Housing Units | % Housing Units |
| 1-Person Household | 2 | 8.3% |
| 2-Person Household | 7 | 29.2% |
| 3-Person Household | 6 | 25.0% |
| 4+ Person Household | 9 | 37.5% |
| Total Housing Units | 24 | 100.0% |
Occupancy by Ownership by Household Size in De Smet
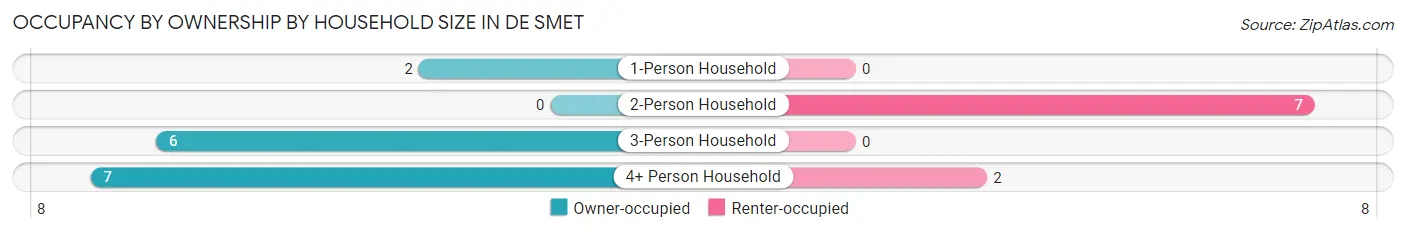
| Household Size | Owner-occupied | Renter-occupied |
| 1-Person Household | 2 (100.0%) | 0 (0.0%) |
| 2-Person Household | 0 (0.0%) | 7 (100.0%) |
| 3-Person Household | 6 (100.0%) | 0 (0.0%) |
| 4+ Person Household | 7 (77.8%) | 2 (22.2%) |
| Total Housing Units | 15 (62.5%) | 9 (37.5%) |
Occupancy by Educational Attainment in De Smet
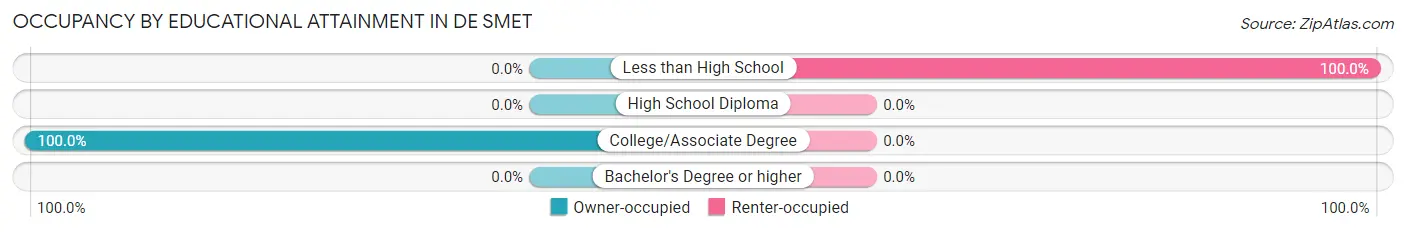
| Household Size | Owner-occupied | Renter-occupied |
| Less than High School | 0 (0.0%) | 9 (100.0%) |
| High School Diploma | 0 (0.0%) | 0 (0.0%) |
| College/Associate Degree | 15 (100.0%) | 0 (0.0%) |
| Bachelor's Degree or higher | 0 (0.0%) | 0 (0.0%) |
Occupancy by Age of Householder in De Smet
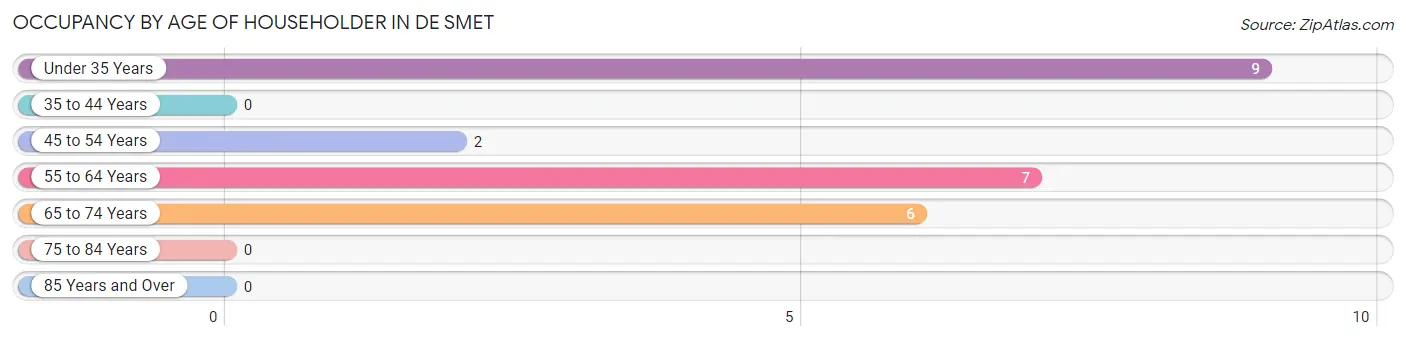
| Age Bracket | # Households | % Households |
| Under 35 Years | 9 | 37.5% |
| 35 to 44 Years | 0 | 0.0% |
| 45 to 54 Years | 2 | 8.3% |
| 55 to 64 Years | 7 | 29.2% |
| 65 to 74 Years | 6 | 25.0% |
| 75 to 84 Years | 0 | 0.0% |
| 85 Years and Over | 0 | 0.0% |
| Total | 24 | 100.0% |
Housing Finances in De Smet
Median Income by Occupancy in De Smet
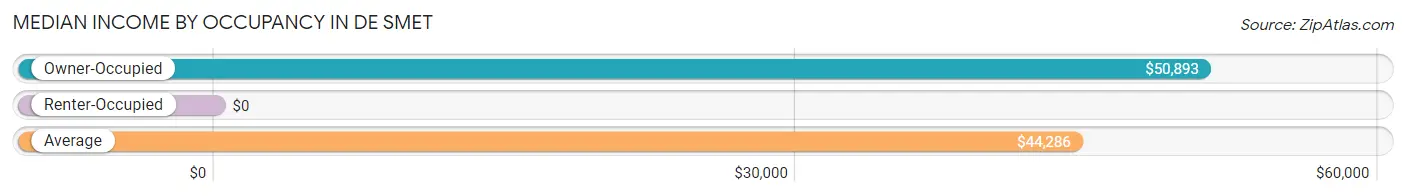
| Occupancy Type | # Households | Median Income |
| Owner-Occupied | 15 (62.5%) | $50,893 |
| Renter-Occupied | 9 (37.5%) | $0 |
| Average | 24 (100.0%) | $44,286 |
Occupancy by Householder Income Bracket in De Smet
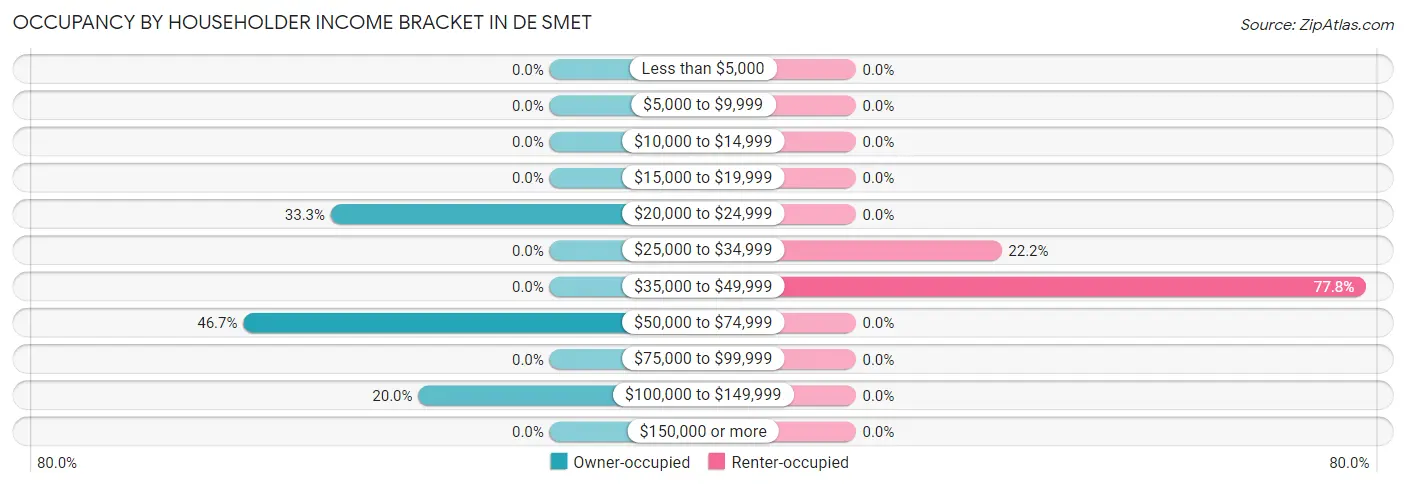
| Income Bracket | Owner-occupied | Renter-occupied |
| Less than $5,000 | 0 (0.0%) | 0 (0.0%) |
| $5,000 to $9,999 | 0 (0.0%) | 0 (0.0%) |
| $10,000 to $14,999 | 0 (0.0%) | 0 (0.0%) |
| $15,000 to $19,999 | 0 (0.0%) | 0 (0.0%) |
| $20,000 to $24,999 | 5 (33.3%) | 0 (0.0%) |
| $25,000 to $34,999 | 0 (0.0%) | 2 (22.2%) |
| $35,000 to $49,999 | 0 (0.0%) | 7 (77.8%) |
| $50,000 to $74,999 | 7 (46.7%) | 0 (0.0%) |
| $75,000 to $99,999 | 0 (0.0%) | 0 (0.0%) |
| $100,000 to $149,999 | 3 (20.0%) | 0 (0.0%) |
| $150,000 or more | 0 (0.0%) | 0 (0.0%) |
| Total | 15 (100.0%) | 9 (100.0%) |
Monthly Housing Cost Tiers in De Smet
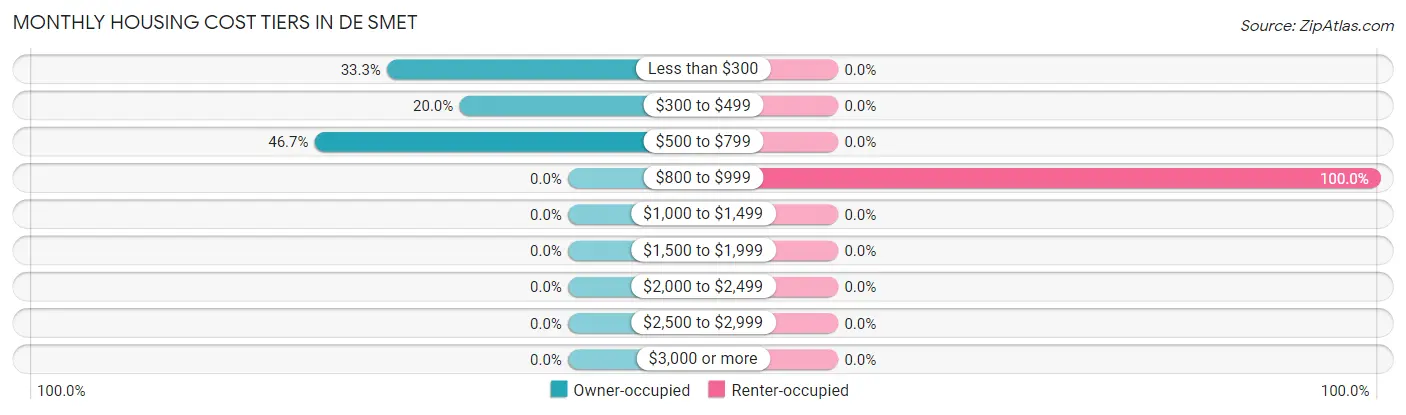
| Monthly Cost | Owner-occupied | Renter-occupied |
| Less than $300 | 5 (33.3%) | 0 (0.0%) |
| $300 to $499 | 3 (20.0%) | 0 (0.0%) |
| $500 to $799 | 7 (46.7%) | 0 (0.0%) |
| $800 to $999 | 0 (0.0%) | 9 (100.0%) |
| $1,000 to $1,499 | 0 (0.0%) | 0 (0.0%) |
| $1,500 to $1,999 | 0 (0.0%) | 0 (0.0%) |
| $2,000 to $2,499 | 0 (0.0%) | 0 (0.0%) |
| $2,500 to $2,999 | 0 (0.0%) | 0 (0.0%) |
| $3,000 or more | 0 (0.0%) | 0 (0.0%) |
| Total | 15 (100.0%) | 9 (100.0%) |
Physical Housing Characteristics in De Smet
Housing Structures in De Smet
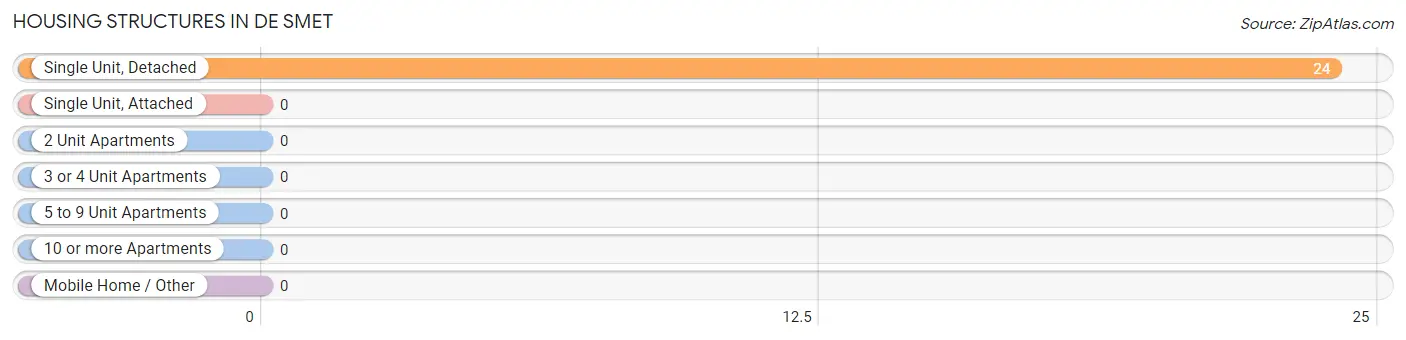
| Structure Type | # Housing Units | % Housing Units |
| Single Unit, Detached | 24 | 100.0% |
| Single Unit, Attached | 0 | 0.0% |
| 2 Unit Apartments | 0 | 0.0% |
| 3 or 4 Unit Apartments | 0 | 0.0% |
| 5 to 9 Unit Apartments | 0 | 0.0% |
| 10 or more Apartments | 0 | 0.0% |
| Mobile Home / Other | 0 | 0.0% |
| Total | 24 | 100.0% |
Housing Structures by Occupancy in De Smet
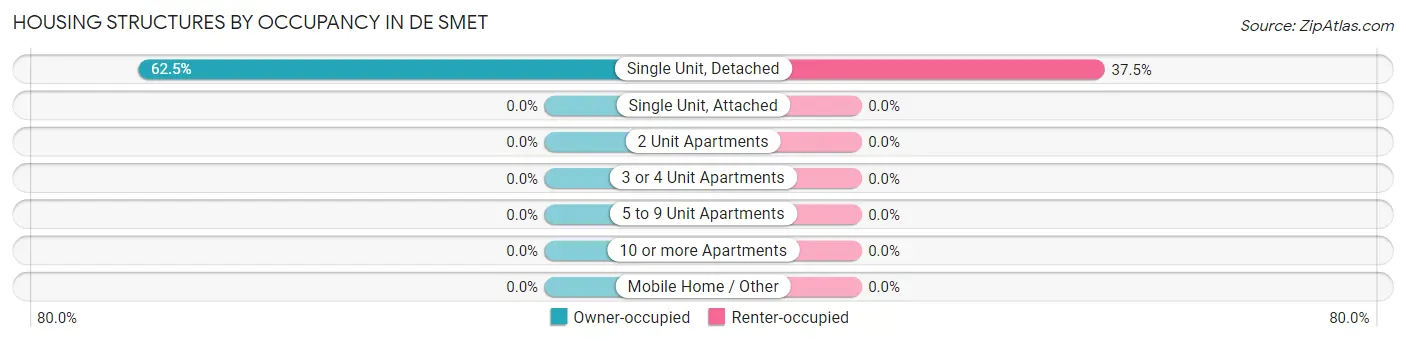
| Structure Type | Owner-occupied | Renter-occupied |
| Single Unit, Detached | 15 (62.5%) | 9 (37.5%) |
| Single Unit, Attached | 0 (0.0%) | 0 (0.0%) |
| 2 Unit Apartments | 0 (0.0%) | 0 (0.0%) |
| 3 or 4 Unit Apartments | 0 (0.0%) | 0 (0.0%) |
| 5 to 9 Unit Apartments | 0 (0.0%) | 0 (0.0%) |
| 10 or more Apartments | 0 (0.0%) | 0 (0.0%) |
| Mobile Home / Other | 0 (0.0%) | 0 (0.0%) |
| Total | 15 (62.5%) | 9 (37.5%) |
Housing Structures by Number of Rooms in De Smet
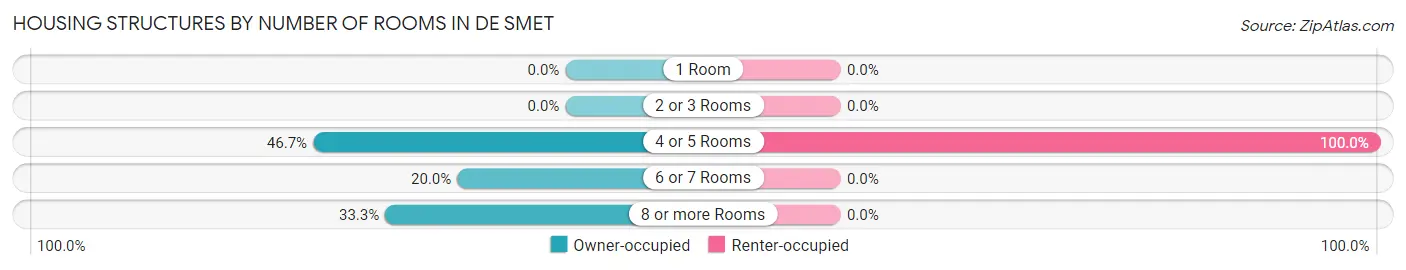
| Number of Rooms | Owner-occupied | Renter-occupied |
| 1 Room | 0 (0.0%) | 0 (0.0%) |
| 2 or 3 Rooms | 0 (0.0%) | 0 (0.0%) |
| 4 or 5 Rooms | 7 (46.7%) | 9 (100.0%) |
| 6 or 7 Rooms | 3 (20.0%) | 0 (0.0%) |
| 8 or more Rooms | 5 (33.3%) | 0 (0.0%) |
| Total | 15 (100.0%) | 9 (100.0%) |
Housing Structure by Heating Type in De Smet
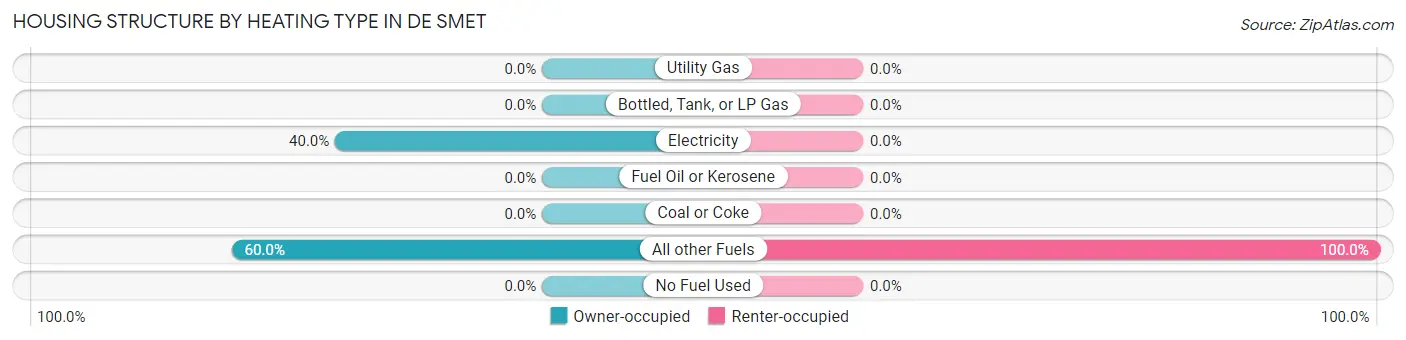
| Heating Type | Owner-occupied | Renter-occupied |
| Utility Gas | 0 (0.0%) | 0 (0.0%) |
| Bottled, Tank, or LP Gas | 0 (0.0%) | 0 (0.0%) |
| Electricity | 6 (40.0%) | 0 (0.0%) |
| Fuel Oil or Kerosene | 0 (0.0%) | 0 (0.0%) |
| Coal or Coke | 0 (0.0%) | 0 (0.0%) |
| All other Fuels | 9 (60.0%) | 9 (100.0%) |
| No Fuel Used | 0 (0.0%) | 0 (0.0%) |
| Total | 15 (100.0%) | 9 (100.0%) |
Household Vehicle Usage in De Smet
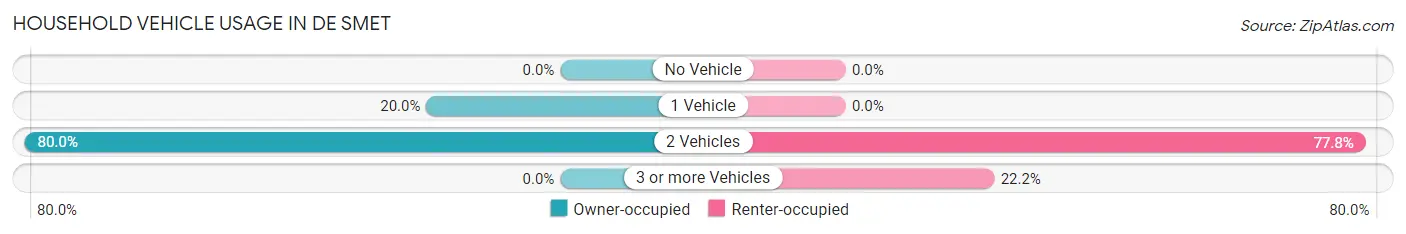
| Vehicles per Household | Owner-occupied | Renter-occupied |
| No Vehicle | 0 (0.0%) | 0 (0.0%) |
| 1 Vehicle | 3 (20.0%) | 0 (0.0%) |
| 2 Vehicles | 12 (80.0%) | 7 (77.8%) |
| 3 or more Vehicles | 0 (0.0%) | 2 (22.2%) |
| Total | 15 (100.0%) | 9 (100.0%) |
Real Estate & Mortgages in De Smet
Real Estate and Mortgage Overview in De Smet
| Characteristic | Without Mortgage | With Mortgage |
| Housing Units | 15 | 0 |
| Median Property Value | $92,100 | $0 |
| Median Household Income | $50,893 | $0 |
| Monthly Housing Costs | $392 | $0 |
| Real Estate Taxes | - | - |
Property Value by Mortgage Status in De Smet
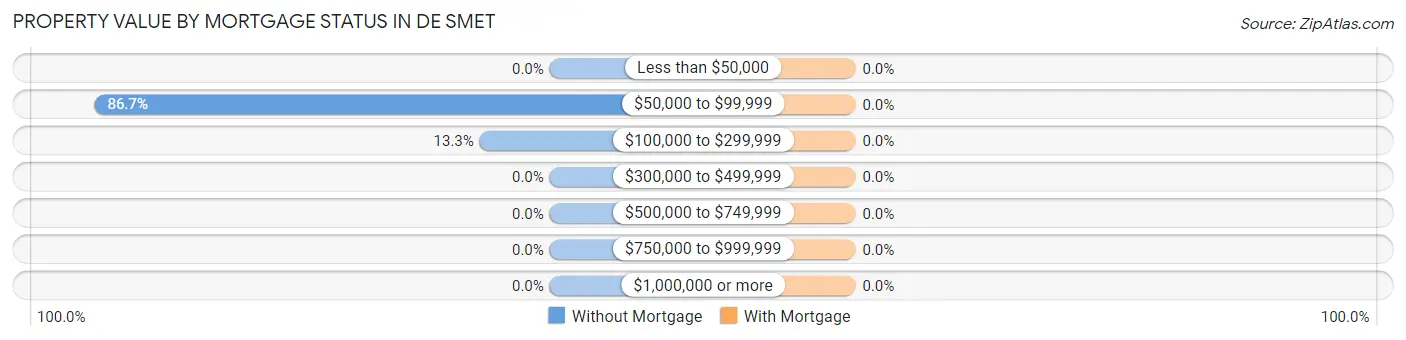
| Property Value | Without Mortgage | With Mortgage |
| Less than $50,000 | 0 (0.0%) | 0 (0.0%) |
| $50,000 to $99,999 | 13 (86.7%) | 0 (0.0%) |
| $100,000 to $299,999 | 2 (13.3%) | 0 (0.0%) |
| $300,000 to $499,999 | 0 (0.0%) | 0 (0.0%) |
| $500,000 to $749,999 | 0 (0.0%) | 0 (0.0%) |
| $750,000 to $999,999 | 0 (0.0%) | 0 (0.0%) |
| $1,000,000 or more | 0 (0.0%) | 0 (0.0%) |
| Total | 15 (100.0%) | 0 (0.0%) |
Household Income by Mortgage Status in De Smet
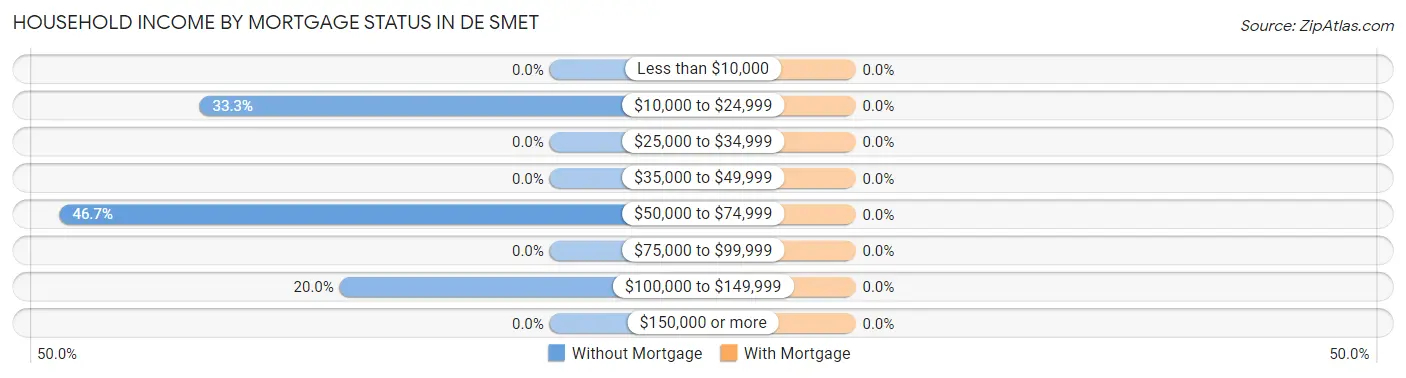
| Household Income | Without Mortgage | With Mortgage |
| Less than $10,000 | 0 (0.0%) | 0 (0.0%) |
| $10,000 to $24,999 | 5 (33.3%) | 0 (0.0%) |
| $25,000 to $34,999 | 0 (0.0%) | 0 (0.0%) |
| $35,000 to $49,999 | 0 (0.0%) | 0 (0.0%) |
| $50,000 to $74,999 | 7 (46.7%) | 0 (0.0%) |
| $75,000 to $99,999 | 0 (0.0%) | 0 (0.0%) |
| $100,000 to $149,999 | 3 (20.0%) | 0 (0.0%) |
| $150,000 or more | 0 (0.0%) | 0 (0.0%) |
| Total | 15 (100.0%) | 0 (0.0%) |
Property Value to Household Income Ratio in De Smet
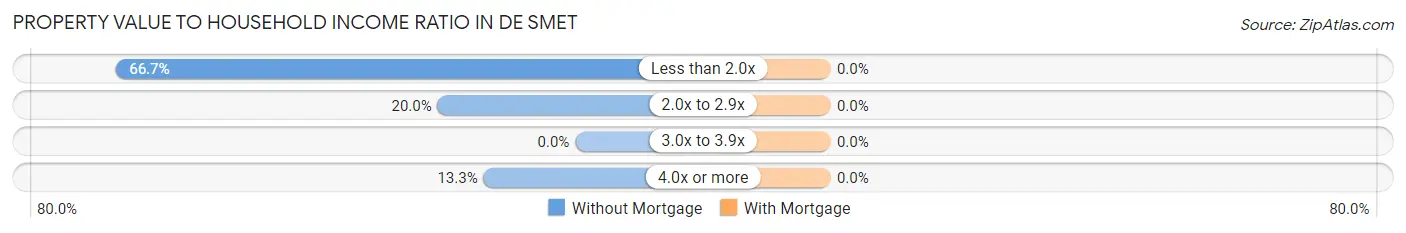
| Value-to-Income Ratio | Without Mortgage | With Mortgage |
| Less than 2.0x | 10 (66.7%) | 0 (0.0%) |
| 2.0x to 2.9x | 3 (20.0%) | 0 (0.0%) |
| 3.0x to 3.9x | 0 (0.0%) | 0 (0.0%) |
| 4.0x or more | 2 (13.3%) | 0 (0.0%) |
| Total | 15 (100.0%) | 0 (0.0%) |
Real Estate Taxes by Mortgage Status in De Smet
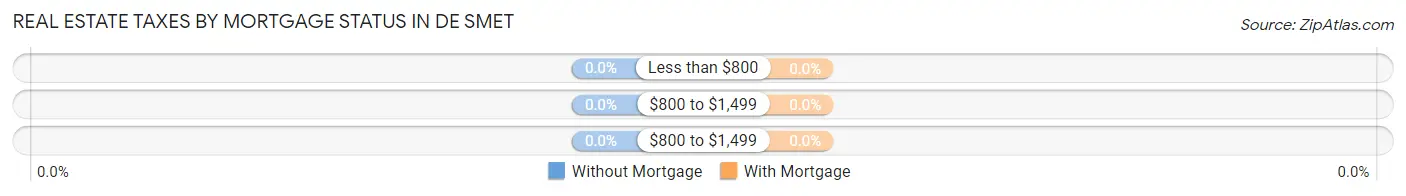
| Property Taxes | Without Mortgage | With Mortgage |
| Less than $800 | 0 (0.0%) | 0 (0.0%) |
| $800 to $1,499 | 0 (0.0%) | 0 (0.0%) |
| $800 to $1,499 | 0 (0.0%) | 0 (0.0%) |
| Total | 15 (100.0%) | 0 (0.0%) |
Health & Disability in De Smet
Health Insurance Coverage by Age in De Smet
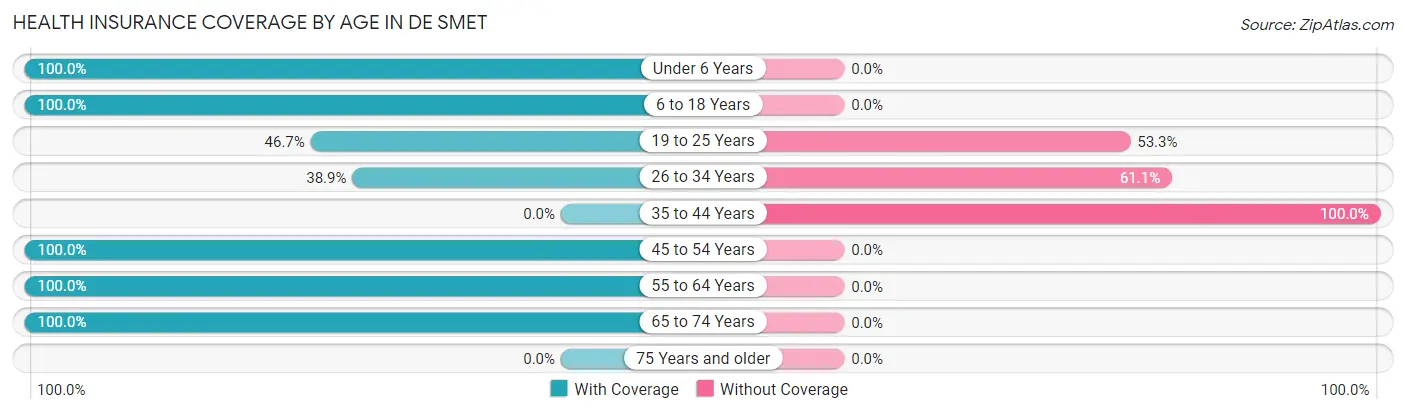
| Age Bracket | With Coverage | Without Coverage |
| Under 6 Years | 5 (100.0%) | 0 (0.0%) |
| 6 to 18 Years | 39 (100.0%) | 0 (0.0%) |
| 19 to 25 Years | 7 (46.7%) | 8 (53.3%) |
| 26 to 34 Years | 7 (38.9%) | 11 (61.1%) |
| 35 to 44 Years | 0 (0.0%) | 10 (100.0%) |
| 45 to 54 Years | 8 (100.0%) | 0 (0.0%) |
| 55 to 64 Years | 14 (100.0%) | 0 (0.0%) |
| 65 to 74 Years | 13 (100.0%) | 0 (0.0%) |
| 75 Years and older | 0 (0.0%) | 0 (0.0%) |
| Total | 93 (76.2%) | 29 (23.8%) |
Health Insurance Coverage by Citizenship Status in De Smet
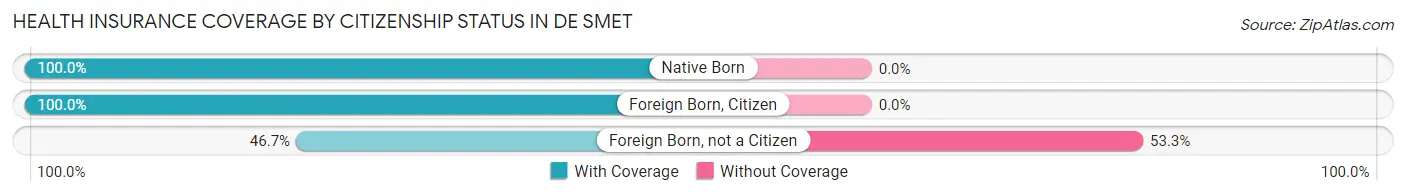
| Citizenship Status | With Coverage | Without Coverage |
| Native Born | 5 (100.0%) | 0 (0.0%) |
| Foreign Born, Citizen | 39 (100.0%) | 0 (0.0%) |
| Foreign Born, not a Citizen | 7 (46.7%) | 8 (53.3%) |
Health Insurance Coverage by Household Income in De Smet
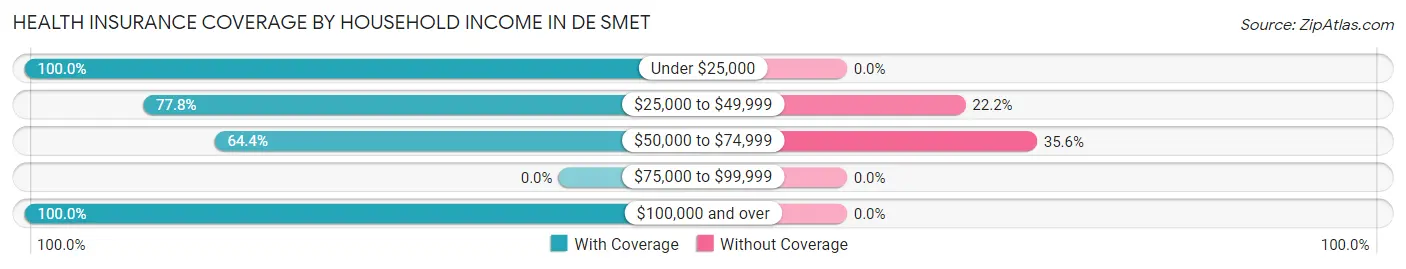
| Household Income | With Coverage | Without Coverage |
| Under $25,000 | 16 (100.0%) | 0 (0.0%) |
| $25,000 to $49,999 | 28 (77.8%) | 8 (22.2%) |
| $50,000 to $74,999 | 38 (64.4%) | 21 (35.6%) |
| $75,000 to $99,999 | 0 (0.0%) | 0 (0.0%) |
| $100,000 and over | 11 (100.0%) | 0 (0.0%) |
Public vs Private Health Insurance Coverage by Age in De Smet
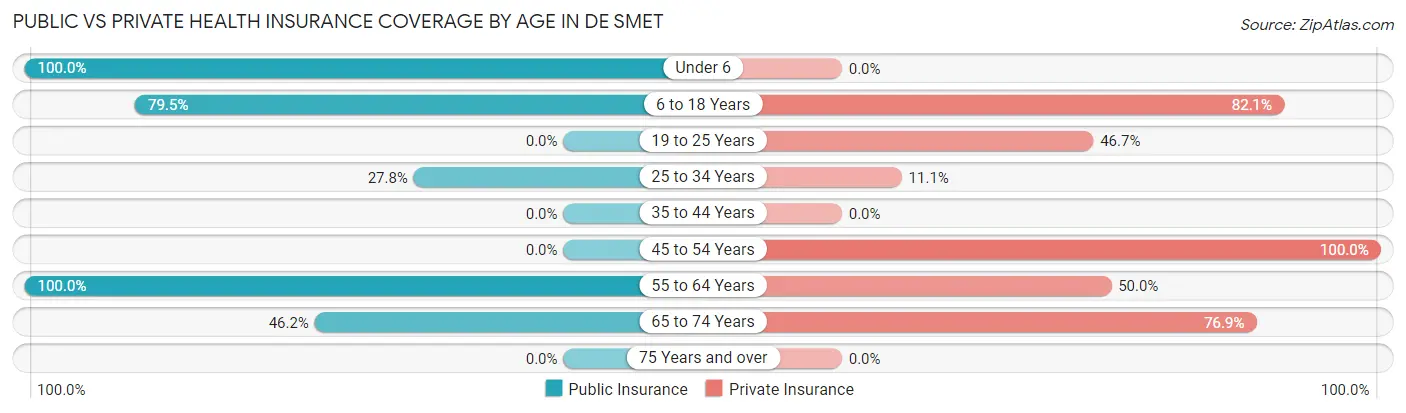
| Age Bracket | Public Insurance | Private Insurance |
| Under 6 | 5 (100.0%) | 0 (0.0%) |
| 6 to 18 Years | 31 (79.5%) | 32 (82.1%) |
| 19 to 25 Years | 0 (0.0%) | 7 (46.7%) |
| 25 to 34 Years | 5 (27.8%) | 2 (11.1%) |
| 35 to 44 Years | 0 (0.0%) | 0 (0.0%) |
| 45 to 54 Years | 0 (0.0%) | 8 (100.0%) |
| 55 to 64 Years | 14 (100.0%) | 7 (50.0%) |
| 65 to 74 Years | 6 (46.2%) | 10 (76.9%) |
| 75 Years and over | 0 (0.0%) | 0 (0.0%) |
| Total | 61 (50.0%) | 66 (54.1%) |
Disability Status by Sex by Age in De Smet
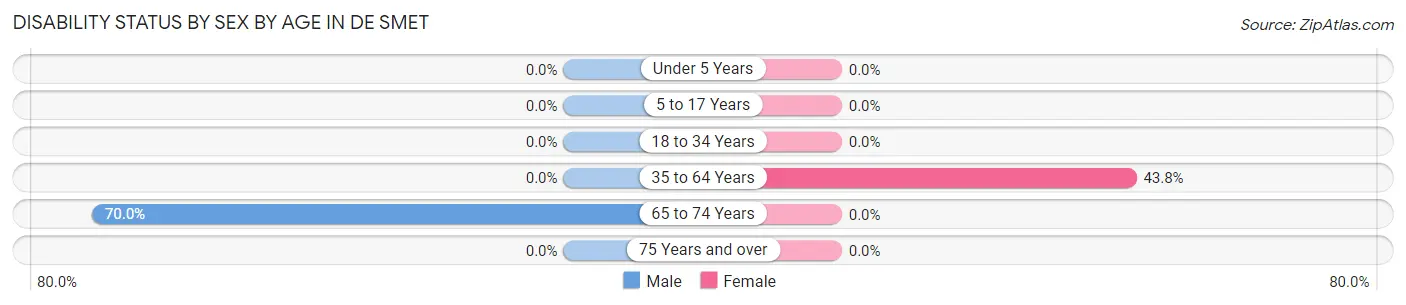
| Age Bracket | Male | Female |
| Under 5 Years | 0 (0.0%) | 0 (0.0%) |
| 5 to 17 Years | 0 (0.0%) | 0 (0.0%) |
| 18 to 34 Years | 0 (0.0%) | 0 (0.0%) |
| 35 to 64 Years | 0 (0.0%) | 7 (43.8%) |
| 65 to 74 Years | 7 (70.0%) | 0 (0.0%) |
| 75 Years and over | 0 (0.0%) | 0 (0.0%) |
Disability Class by Sex by Age in De Smet
Disability Class: Hearing Difficulty
| Age Bracket | Male | Female |
| Under 5 Years | 0 (0.0%) | 0 (0.0%) |
| 5 to 17 Years | 0 (0.0%) | 0 (0.0%) |
| 18 to 34 Years | 0 (0.0%) | 0 (0.0%) |
| 35 to 64 Years | 0 (0.0%) | 0 (0.0%) |
| 65 to 74 Years | 0 (0.0%) | 0 (0.0%) |
| 75 Years and over | 0 (0.0%) | 0 (0.0%) |
Disability Class: Vision Difficulty
| Age Bracket | Male | Female |
| Under 5 Years | 0 (0.0%) | 0 (0.0%) |
| 5 to 17 Years | 0 (0.0%) | 0 (0.0%) |
| 18 to 34 Years | 0 (0.0%) | 0 (0.0%) |
| 35 to 64 Years | 0 (0.0%) | 0 (0.0%) |
| 65 to 74 Years | 0 (0.0%) | 0 (0.0%) |
| 75 Years and over | 0 (0.0%) | 0 (0.0%) |
Disability Class: Cognitive Difficulty

| Age Bracket | Male | Female |
| 5 to 17 Years | 0 (0.0%) | 0 (0.0%) |
| 18 to 34 Years | 0 (0.0%) | 0 (0.0%) |
| 35 to 64 Years | 0 (0.0%) | 0 (0.0%) |
| 65 to 74 Years | 0 (0.0%) | 0 (0.0%) |
| 75 Years and over | 0 (0.0%) | 0 (0.0%) |
Disability Class: Ambulatory Difficulty
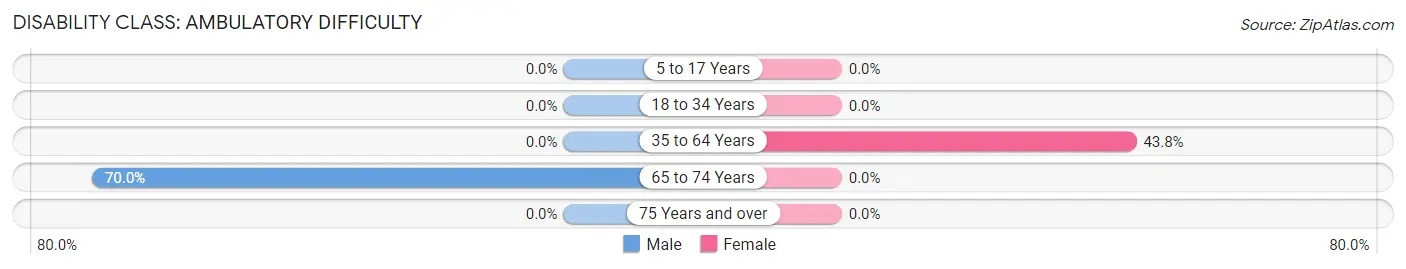
| Age Bracket | Male | Female |
| 5 to 17 Years | 0 (0.0%) | 0 (0.0%) |
| 18 to 34 Years | 0 (0.0%) | 0 (0.0%) |
| 35 to 64 Years | 0 (0.0%) | 7 (43.8%) |
| 65 to 74 Years | 7 (70.0%) | 0 (0.0%) |
| 75 Years and over | 0 (0.0%) | 0 (0.0%) |
Disability Class: Self-Care Difficulty
| Age Bracket | Male | Female |
| 5 to 17 Years | 0 (0.0%) | 0 (0.0%) |
| 18 to 34 Years | 0 (0.0%) | 0 (0.0%) |
| 35 to 64 Years | 0 (0.0%) | 0 (0.0%) |
| 65 to 74 Years | 0 (0.0%) | 0 (0.0%) |
| 75 Years and over | 0 (0.0%) | 0 (0.0%) |
Technology Access in De Smet
Computing Device Access in De Smet
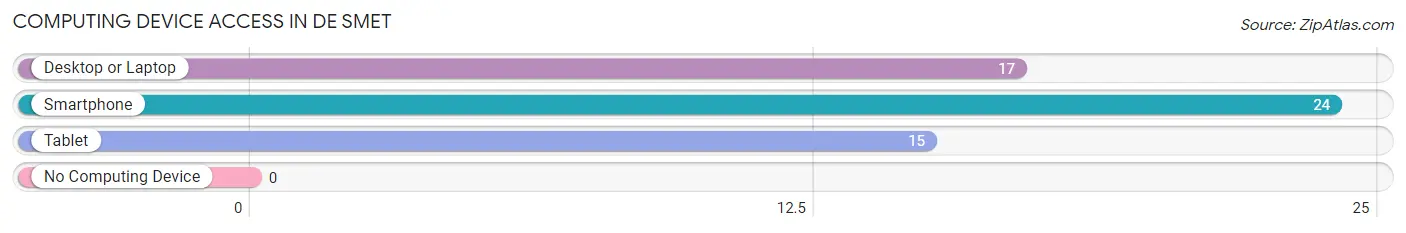
| Device Type | # Households | % Households |
| Desktop or Laptop | 17 | 70.8% |
| Smartphone | 24 | 100.0% |
| Tablet | 15 | 62.5% |
| No Computing Device | 0 | 0.0% |
| Total | 24 | 100.0% |
Internet Access in De Smet
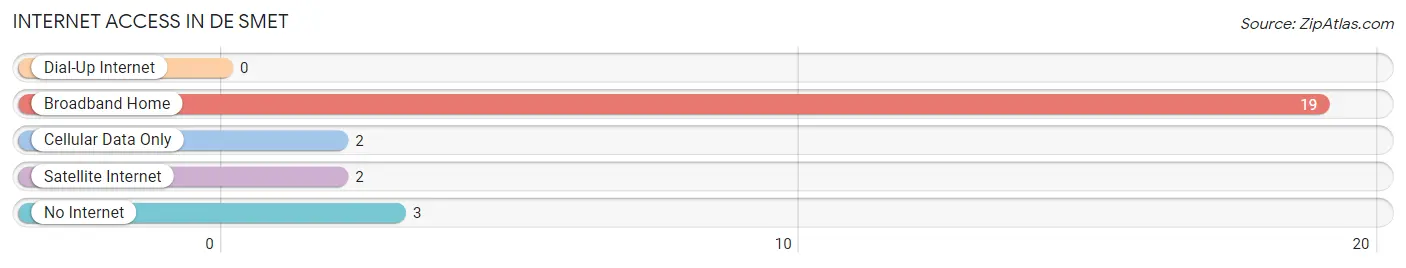
| Internet Type | # Households | % Households |
| Dial-Up Internet | 0 | 0.0% |
| Broadband Home | 19 | 79.2% |
| Cellular Data Only | 2 | 8.3% |
| Satellite Internet | 2 | 8.3% |
| No Internet | 3 | 12.5% |
| Total | 24 | 100.0% |
De Smet Summary
De Smet, Idaho is a small town located in the northern part of the state, near the border of Montana. It is situated in the middle of a large agricultural area, and is home to a population of just over 500 people. The town was founded in 1883 by a group of settlers from the Netherlands, and has since become a popular destination for tourists and outdoor enthusiasts.
History
De Smet was founded in 1883 by a group of Dutch settlers who had traveled from the Netherlands to the United States. The settlers were led by Reverend Cornelius Vander Meulen, who had been sent by the Dutch Reformed Church to establish a new settlement in the area. The settlers chose the name De Smet, which is Dutch for “the meadow”, in honor of the area’s lush grasslands.
The settlers quickly established a thriving community, and the town soon became a popular destination for travelers and settlers from all over the United States. The town was incorporated in 1891, and by the early 1900s, it had become a bustling center of commerce and industry. The town was home to several businesses, including a flour mill, a sawmill, a blacksmith shop, and a general store.
In the early 1900s, De Smet was also home to a large population of Dutch immigrants. The immigrants brought with them their culture and traditions, and the town quickly became known for its Dutch heritage. The town’s Dutch heritage is still evident today, with many of the buildings and homes in the area still displaying Dutch architecture.
Geography
De Smet is located in the northern part of Idaho, near the border of Montana. The town is situated in the middle of a large agricultural area, and is surrounded by rolling hills and lush grasslands. The town is located at an elevation of 4,500 feet, and has a total area of 0.7 square miles.
The climate in De Smet is generally mild, with temperatures ranging from the low 30s in the winter to the high 80s in the summer. The town receives an average of 18 inches of precipitation each year, and is known for its mild winters and hot summers.
Economy
The economy of De Smet is largely based on agriculture. The town is home to several large farms, and the surrounding area is known for its production of wheat, barley, and other grains. The town is also home to several small businesses, including a grocery store, a hardware store, and a restaurant.
The town is also home to a small tourism industry, and is a popular destination for outdoor enthusiasts. The town is home to several parks and trails, and is known for its scenic views and wildlife.
Demographics
As of the 2010 census, the population of De Smet was 514. The town is predominantly white, with 95.3% of the population identifying as white. The town is also home to a small Hispanic population, with 4.7% of the population identifying as Hispanic or Latino. The median household income in De Smet is $41,250, and the median home value is $117,000.
De Smet is a small town with a rich history and a vibrant culture. The town is home to a diverse population, and is a popular destination for tourists and outdoor enthusiasts. The town is known for its Dutch heritage, and is a great place to visit for those looking to experience a unique and historic part of Idaho.
Common Questions
What is Per Capita Income in De Smet?
Per Capita income in De Smet is $10,541.
What is the Median Family Income in De Smet?
Median Family Income in De Smet is $50,893.
What is the Median Household income in De Smet?
Median Household Income in De Smet is $44,286.
What is Income or Wage Gap in De Smet?
Income or Wage Gap in De Smet is 90.4%.
Women in De Smet earn 9.6 cents for every dollar earned by a man.
What is Inequality or Gini Index in De Smet?
Inequality or Gini Index in De Smet is 0.26.
What is the Total Population of De Smet?
Total Population of De Smet is 122.
What is the Total Male Population of De Smet?
Total Male Population of De Smet is 55.
What is the Total Female Population of De Smet?
Total Female Population of De Smet is 67.
What is the Ratio of Males per 100 Females in De Smet?
There are 82.09 Males per 100 Females in De Smet.
What is the Ratio of Females per 100 Males in De Smet?
There are 121.82 Females per 100 Males in De Smet.
What is the Median Population Age in De Smet?
Median Population Age in De Smet is 29.4 Years.
What is the Average Family Size in De Smet
Average Family Size in De Smet is 7.0 People.
What is the Average Household Size in De Smet
Average Household Size in De Smet is 5.1 People.
How Large is the Labor Force in De Smet?
There are 35 People in the Labor Forcein in De Smet.
What is the Percentage of People in the Labor Force in De Smet?
44.9% of People are in the Labor Force in De Smet.