St Maries, ID Map & Demographics
St Maries Map
St Maries Overview
$27,283
PER CAPITA INCOME
$70,667
AVG FAMILY INCOME
$47,564
AVG HOUSEHOLD INCOME
47.8%
WAGE / INCOME GAP [ % ]
52.2¢/ $1
WAGE / INCOME GAP [ $ ]
0.46
INEQUALITY / GINI INDEX
2,410
TOTAL POPULATION
1,196
MALE POPULATION
1,214
FEMALE POPULATION
98.52
MALES / 100 FEMALES
101.51
FEMALES / 100 MALES
40.0
MEDIAN AGE
3.2
AVG FAMILY SIZE
2.4
AVG HOUSEHOLD SIZE
1,034
LABOR FORCE [ PEOPLE ]
53.9%
PERCENT IN LABOR FORCE
5.3%
UNEMPLOYMENT RATE
St Maries Area Codes
Income in St Maries
Income Overview in St Maries
Per Capita Income in St Maries is $27,283, while median incomes of families and households are $70,667 and $47,564 respectively.
| Characteristic | Number | Measure |
| Per Capita Income | 2,410 | $27,283 |
| Median Family Income | 552 | $70,667 |
| Mean Family Income | 552 | $81,448 |
| Median Household Income | 948 | $47,564 |
| Mean Household Income | 948 | $62,489 |
| Income Deficit | 552 | $0 |
| Wage / Income Gap (%) | 2,410 | 47.75% |
| Wage / Income Gap ($) | 2,410 | 52.25¢ per $1 |
| Gini / Inequality Index | 2,410 | 0.46 |
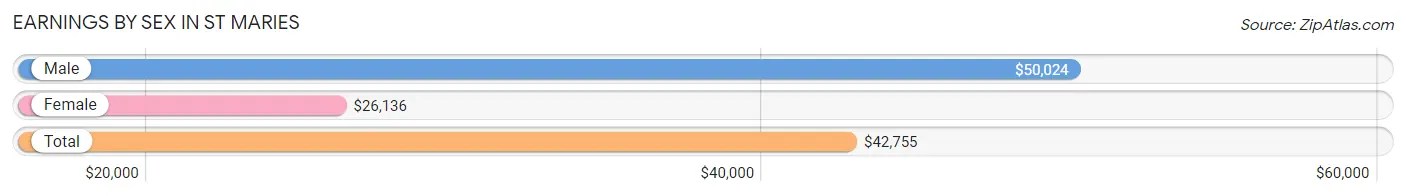
Earnings by Sex in St Maries
Average Earnings in St Maries are $42,755, $50,024 for men and $26,136 for women, a difference of 47.7%.
| Sex | Number | Average Earnings |
| Male | 655 (60.2%) | $50,024 |
| Female | 434 (39.9%) | $26,136 |
| Total | 1,089 (100.0%) | $42,755 |
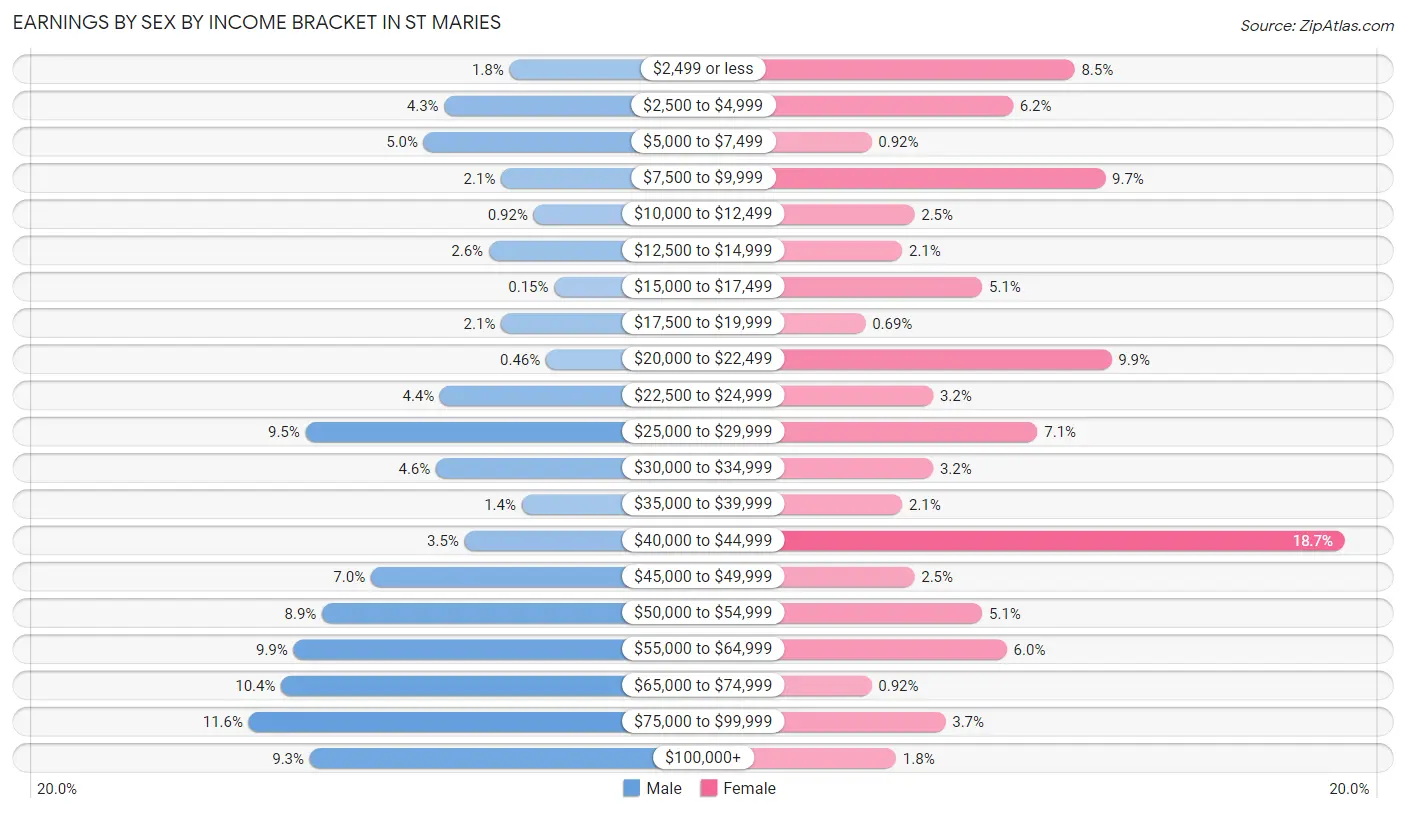
Earnings by Sex by Income Bracket in St Maries
The most common earnings brackets in St Maries are $75,000 to $99,999 for men (76 | 11.6%) and $40,000 to $44,999 for women (81 | 18.7%).
| Income | Male | Female |
| $2,499 or less | 12 (1.8%) | 37 (8.5%) |
| $2,500 to $4,999 | 28 (4.3%) | 27 (6.2%) |
| $5,000 to $7,499 | 33 (5.0%) | 4 (0.9%) |
| $7,500 to $9,999 | 14 (2.1%) | 42 (9.7%) |
| $10,000 to $12,499 | 6 (0.9%) | 11 (2.5%) |
| $12,500 to $14,999 | 17 (2.6%) | 9 (2.1%) |
| $15,000 to $17,499 | 1 (0.2%) | 22 (5.1%) |
| $17,500 to $19,999 | 14 (2.1%) | 3 (0.7%) |
| $20,000 to $22,499 | 3 (0.5%) | 43 (9.9%) |
| $22,500 to $24,999 | 29 (4.4%) | 14 (3.2%) |
| $25,000 to $29,999 | 62 (9.5%) | 31 (7.1%) |
| $30,000 to $34,999 | 30 (4.6%) | 14 (3.2%) |
| $35,000 to $39,999 | 9 (1.4%) | 9 (2.1%) |
| $40,000 to $44,999 | 23 (3.5%) | 81 (18.7%) |
| $45,000 to $49,999 | 46 (7.0%) | 11 (2.5%) |
| $50,000 to $54,999 | 58 (8.8%) | 22 (5.1%) |
| $55,000 to $64,999 | 65 (9.9%) | 26 (6.0%) |
| $65,000 to $74,999 | 68 (10.4%) | 4 (0.9%) |
| $75,000 to $99,999 | 76 (11.6%) | 16 (3.7%) |
| $100,000+ | 61 (9.3%) | 8 (1.8%) |
| Total | 655 (100.0%) | 434 (100.0%) |
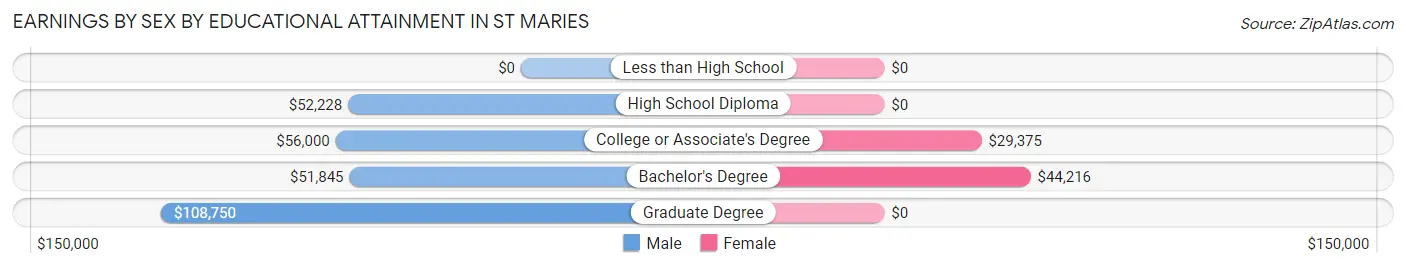
Earnings by Sex by Educational Attainment in St Maries
Average earnings in St Maries are $51,779 for men and $28,688 for women, a difference of 44.6%. Men with an educational attainment of graduate degree enjoy the highest average annual earnings of $108,750, while those with bachelor's degree education earn the least with $51,845. Women with an educational attainment of bachelor's degree earn the most with the average annual earnings of $44,216, while those with college or associate's degree education have the smallest earnings of $29,375.
| Educational Attainment | Male Income | Female Income |
| Less than High School | - | - |
| High School Diploma | $52,228 | $0 |
| College or Associate's Degree | $56,000 | $29,375 |
| Bachelor's Degree | $51,845 | $44,216 |
| Graduate Degree | $108,750 | $0 |
| Total | $51,779 | $28,688 |
Family Income in St Maries
Family Income Brackets in St Maries
According to the St Maries family income data, there are 125 families falling into the $50,000 to $74,999 income range, which is the most common income bracket and makes up 22.6% of all families. Conversely, the $10,000 to $14,999 income bracket is the least frequent group with only 10 families (1.8%) belonging to this category.
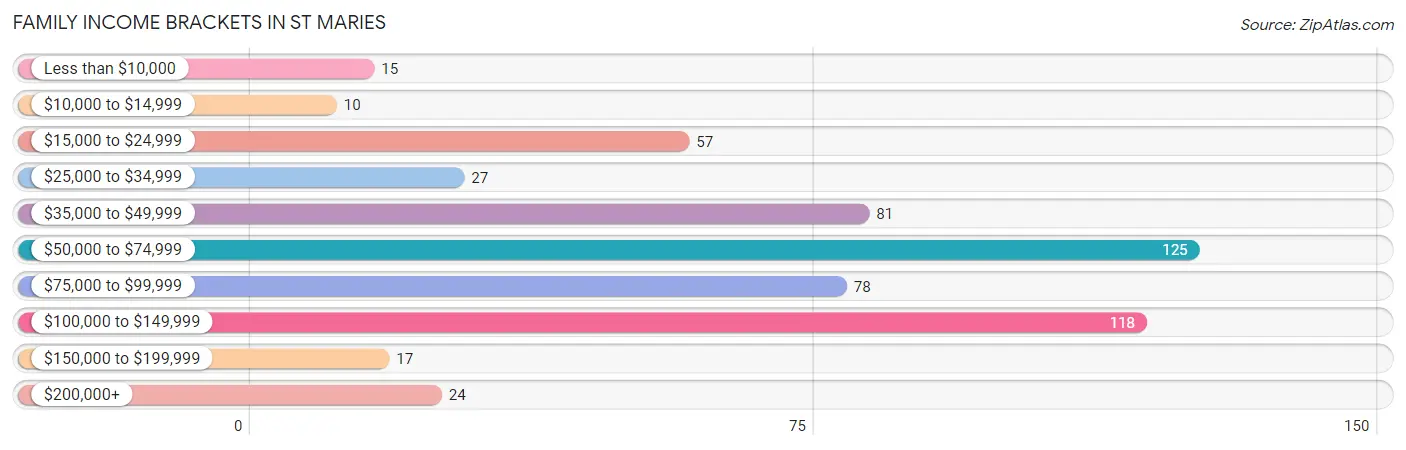
| Income Bracket | # Families | % Families |
| Less than $10,000 | 15 | 2.7% |
| $10,000 to $14,999 | 10 | 1.8% |
| $15,000 to $24,999 | 57 | 10.3% |
| $25,000 to $34,999 | 27 | 4.9% |
| $35,000 to $49,999 | 81 | 14.7% |
| $50,000 to $74,999 | 125 | 22.6% |
| $75,000 to $99,999 | 78 | 14.1% |
| $100,000 to $149,999 | 118 | 21.4% |
| $150,000 to $199,999 | 17 | 3.1% |
| $200,000+ | 24 | 4.3% |
Family Income by Famaliy Size in St Maries
5-person families (31 | 5.6%) account for the highest median family income in St Maries with $101,641 per family, while 2-person families (252 | 45.7%) have the highest median income of $30,000 per family member.
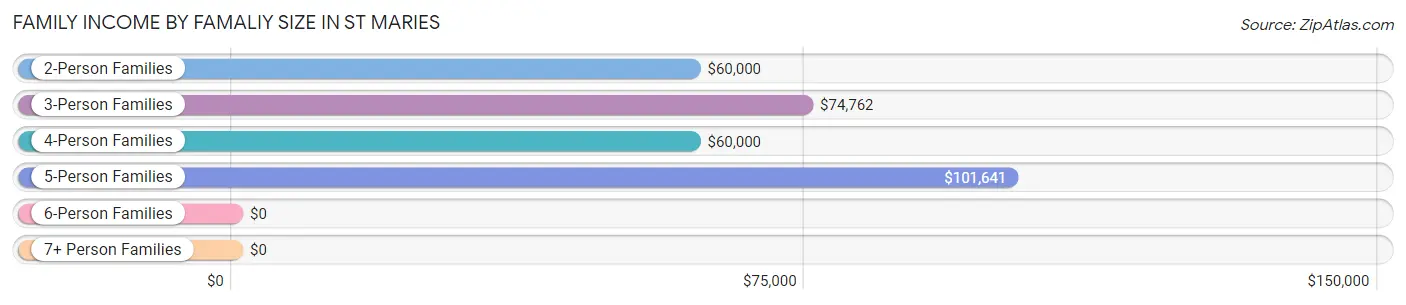
| Income Bracket | # Families | Median Income |
| 2-Person Families | 252 (45.7%) | $60,000 |
| 3-Person Families | 134 (24.3%) | $74,762 |
| 4-Person Families | 110 (19.9%) | $60,000 |
| 5-Person Families | 31 (5.6%) | $101,641 |
| 6-Person Families | 20 (3.6%) | $0 |
| 7+ Person Families | 5 (0.9%) | $0 |
| Total | 552 (100.0%) | $70,667 |
Family Income by Number of Earners in St Maries
The median family income in St Maries is $70,667, with families comprising 3+ earners (48) having the highest median family income of $109,286, while families with no earners (110) have the lowest median family income of $30,750, accounting for 8.7% and 19.9% of families, respectively.
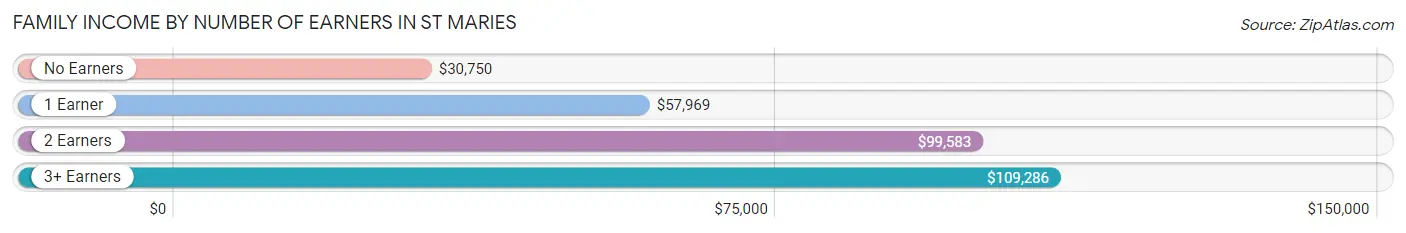
| Number of Earners | # Families | Median Income |
| No Earners | 110 (19.9%) | $30,750 |
| 1 Earner | 188 (34.1%) | $57,969 |
| 2 Earners | 206 (37.3%) | $99,583 |
| 3+ Earners | 48 (8.7%) | $109,286 |
| Total | 552 (100.0%) | $70,667 |
Household Income in St Maries
Household Income Brackets in St Maries
With 154 households falling in the category, the $50,000 to $74,999 income range is the most frequent in St Maries, accounting for 16.2% of all households. In contrast, only 17 households (1.8%) fall into the $150,000 to $199,999 income bracket, making it the least populous group.
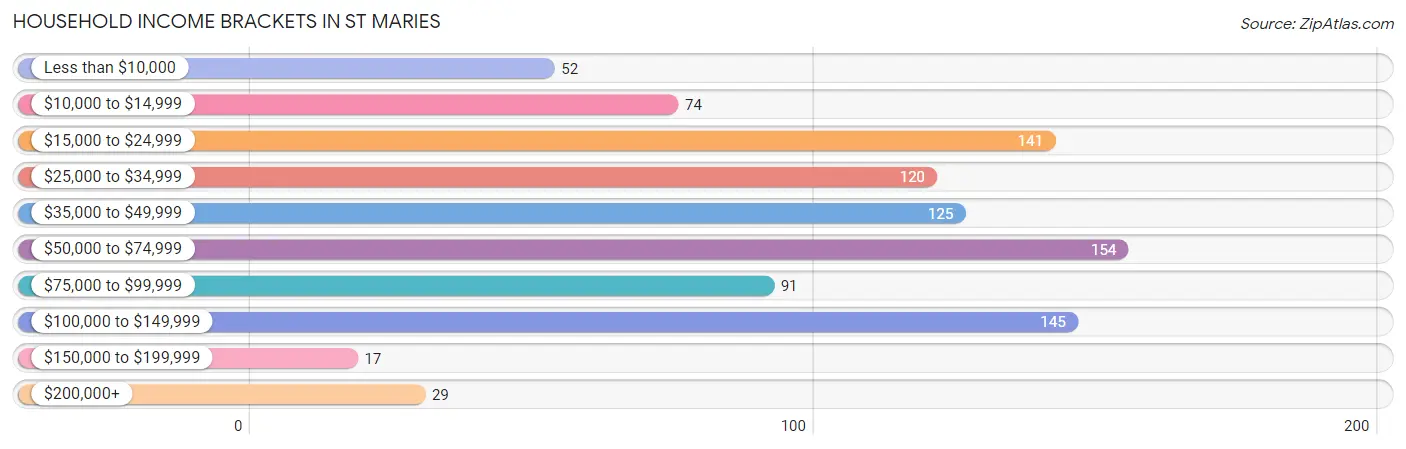
| Income Bracket | # Households | % Households |
| Less than $10,000 | 52 | 5.5% |
| $10,000 to $14,999 | 74 | 7.8% |
| $15,000 to $24,999 | 141 | 14.9% |
| $25,000 to $34,999 | 120 | 12.7% |
| $35,000 to $49,999 | 125 | 13.2% |
| $50,000 to $74,999 | 154 | 16.2% |
| $75,000 to $99,999 | 91 | 9.6% |
| $100,000 to $149,999 | 145 | 15.3% |
| $150,000 to $199,999 | 17 | 1.8% |
| $200,000+ | 29 | 3.1% |
Household Income by Householder Age in St Maries
The median household income in St Maries is $47,564, with the highest median household income of $85,000 found in the 15 to 24 years age bracket for the primary householder. A total of 48 households (5.1%) fall into this category. Meanwhile, the 65+ years age bracket for the primary householder has the lowest median household income of $31,667, with 220 households (23.2%) in this group.
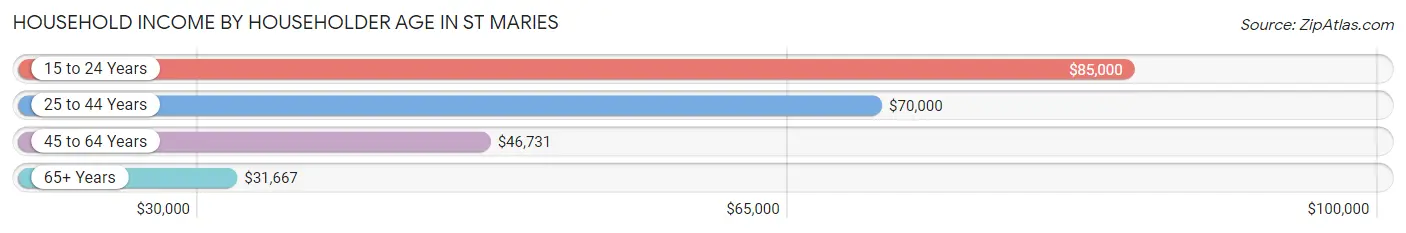
| Income Bracket | # Households | Median Income |
| 15 to 24 Years | 48 (5.1%) | $85,000 |
| 25 to 44 Years | 278 (29.3%) | $70,000 |
| 45 to 64 Years | 402 (42.4%) | $46,731 |
| 65+ Years | 220 (23.2%) | $31,667 |
| Total | 948 (100.0%) | $47,564 |
Poverty in St Maries
Income Below Poverty by Sex and Age in St Maries
With 12.9% poverty level for males and 25.5% for females among the residents of St Maries, 6 to 11 year old males and 6 to 11 year old females are the most vulnerable to poverty, with 40 males (25.2%) and 41 females (52.6%) in their respective age groups living below the poverty level.
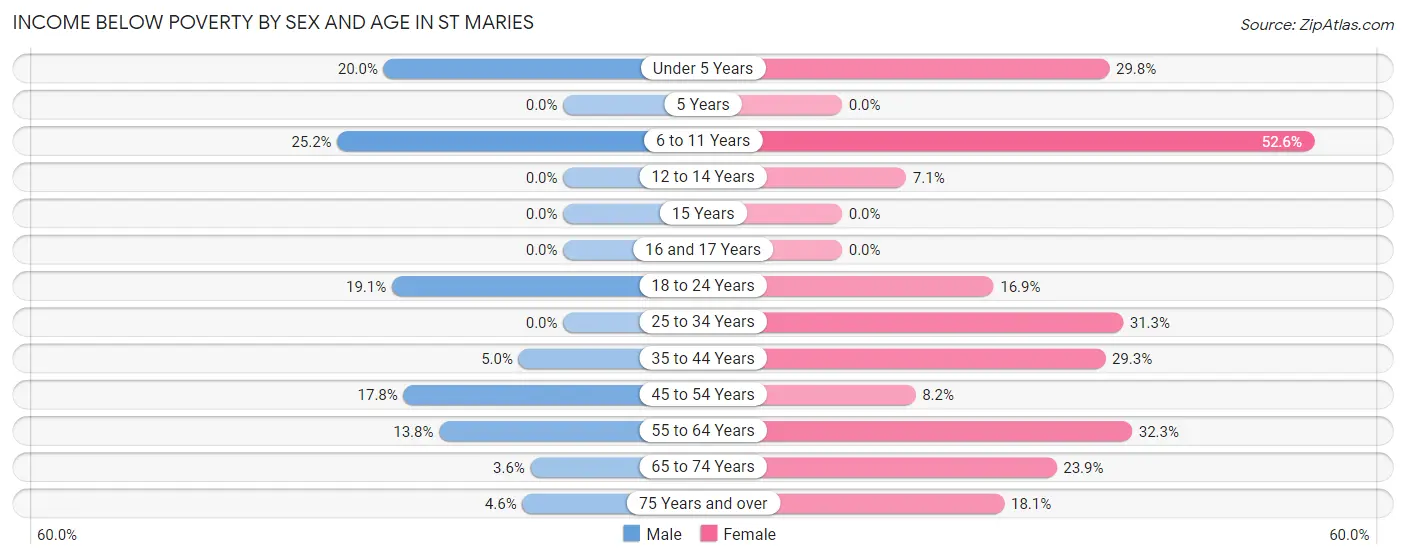
| Age Bracket | Male | Female |
| Under 5 Years | 9 (20.0%) | 25 (29.8%) |
| 5 Years | 0 (0.0%) | 0 (0.0%) |
| 6 to 11 Years | 40 (25.2%) | 41 (52.6%) |
| 12 to 14 Years | 0 (0.0%) | 3 (7.1%) |
| 15 Years | 0 (0.0%) | 0 (0.0%) |
| 16 and 17 Years | 0 (0.0%) | 0 (0.0%) |
| 18 to 24 Years | 29 (19.1%) | 14 (16.9%) |
| 25 to 34 Years | 0 (0.0%) | 51 (31.3%) |
| 35 to 44 Years | 7 (5.0%) | 34 (29.3%) |
| 45 to 54 Years | 37 (17.8%) | 9 (8.2%) |
| 55 to 64 Years | 21 (13.8%) | 73 (32.3%) |
| 65 to 74 Years | 2 (3.6%) | 27 (23.9%) |
| 75 Years and over | 4 (4.5%) | 15 (18.1%) |
| Total | 149 (12.9%) | 292 (25.5%) |
Income Above Poverty by Sex and Age in St Maries
According to the poverty statistics in St Maries, males aged 5 years and females aged 5 years are the age groups that are most secure financially, with 100.0% of males and 100.0% of females in these age groups living above the poverty line.
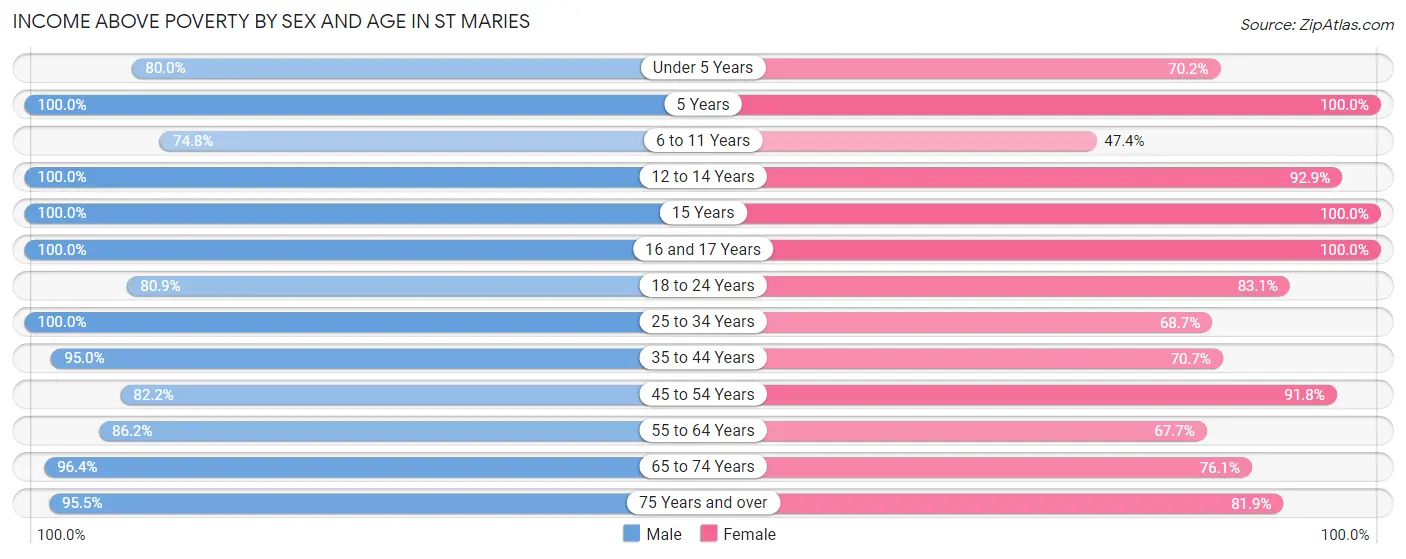
| Age Bracket | Male | Female |
| Under 5 Years | 36 (80.0%) | 59 (70.2%) |
| 5 Years | 3 (100.0%) | 18 (100.0%) |
| 6 to 11 Years | 119 (74.8%) | 37 (47.4%) |
| 12 to 14 Years | 45 (100.0%) | 39 (92.9%) |
| 15 Years | 3 (100.0%) | 15 (100.0%) |
| 16 and 17 Years | 22 (100.0%) | 16 (100.0%) |
| 18 to 24 Years | 123 (80.9%) | 69 (83.1%) |
| 25 to 34 Years | 83 (100.0%) | 112 (68.7%) |
| 35 to 44 Years | 134 (95.0%) | 82 (70.7%) |
| 45 to 54 Years | 171 (82.2%) | 101 (91.8%) |
| 55 to 64 Years | 131 (86.2%) | 153 (67.7%) |
| 65 to 74 Years | 53 (96.4%) | 86 (76.1%) |
| 75 Years and over | 84 (95.5%) | 68 (81.9%) |
| Total | 1,007 (87.1%) | 855 (74.5%) |
Income Below Poverty Among Married-Couple Families in St Maries
The poverty statistics for married-couple families in St Maries show that 5.8% or 25 of the total 431 families live below the poverty line. Families with 3 or 4 children have the highest poverty rate of 43.8%, comprising of 21 families. On the other hand, families with 1 or 2 children have the lowest poverty rate of 0.0%, which includes 0 families.
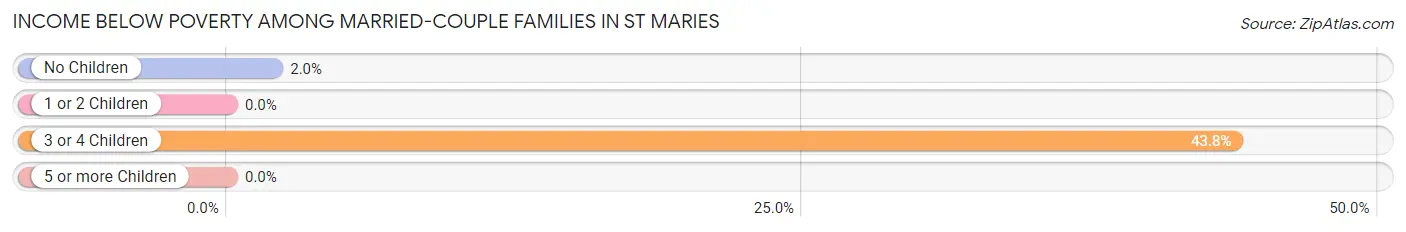
| Children | Above Poverty | Below Poverty |
| No Children | 199 (98.0%) | 4 (2.0%) |
| 1 or 2 Children | 175 (100.0%) | 0 (0.0%) |
| 3 or 4 Children | 27 (56.2%) | 21 (43.8%) |
| 5 or more Children | 5 (100.0%) | 0 (0.0%) |
| Total | 406 (94.2%) | 25 (5.8%) |
Income Below Poverty Among Single-Parent Households in St Maries
According to the poverty data in St Maries, 28.2% or 11 single-father households and 50.0% or 41 single-mother households are living below the poverty line. Among single-father households, those with 1 or 2 children have the highest poverty rate, with 6 households (35.3%) experiencing poverty. Likewise, among single-mother households, those with no children have the highest poverty rate, with 31 households (75.6%) falling below the poverty line.
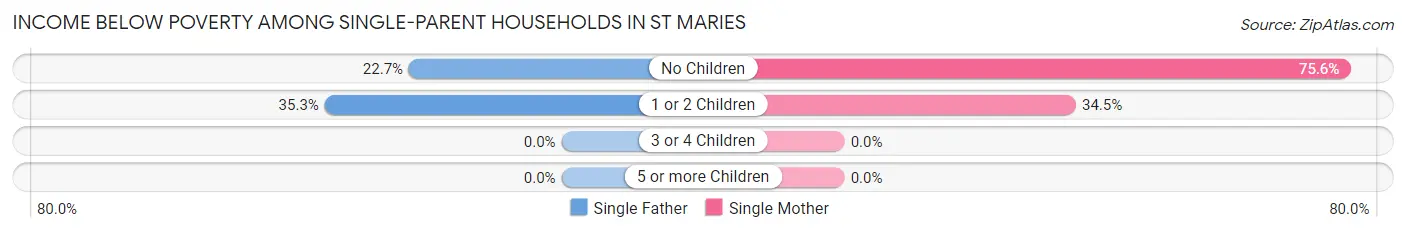
| Children | Single Father | Single Mother |
| No Children | 5 (22.7%) | 31 (75.6%) |
| 1 or 2 Children | 6 (35.3%) | 10 (34.5%) |
| 3 or 4 Children | 0 (0.0%) | 0 (0.0%) |
| 5 or more Children | 0 (0.0%) | 0 (0.0%) |
| Total | 11 (28.2%) | 41 (50.0%) |
Income Below Poverty Among Married-Couple vs Single-Parent Households in St Maries
The poverty data for St Maries shows that 25 of the married-couple family households (5.8%) and 52 of the single-parent households (43.0%) are living below the poverty level. Within the married-couple family households, those with 3 or 4 children have the highest poverty rate, with 21 households (43.8%) falling below the poverty line. Among the single-parent households, those with no children have the highest poverty rate, with 36 household (57.1%) living below poverty.
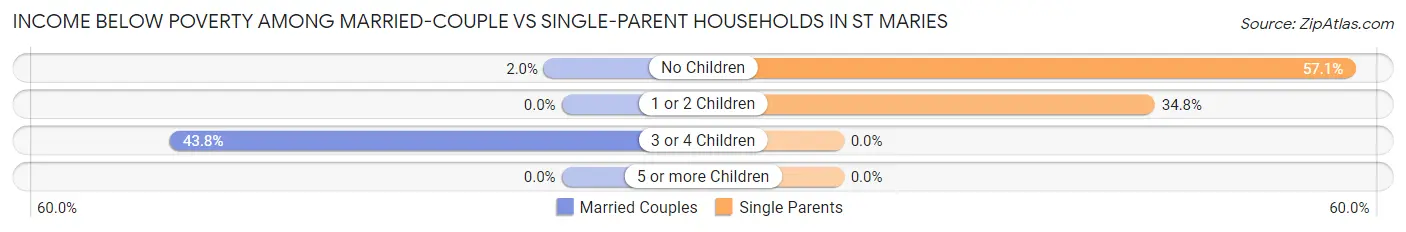
| Children | Married-Couple Families | Single-Parent Households |
| No Children | 4 (2.0%) | 36 (57.1%) |
| 1 or 2 Children | 0 (0.0%) | 16 (34.8%) |
| 3 or 4 Children | 21 (43.8%) | 0 (0.0%) |
| 5 or more Children | 0 (0.0%) | 0 (0.0%) |
| Total | 25 (5.8%) | 52 (43.0%) |
Race in St Maries
The most populous races in St Maries are White / Caucasian (2,337 | 97.0%), Two or more Races (55 | 2.3%), and Hispanic or Latino (50 | 2.1%).
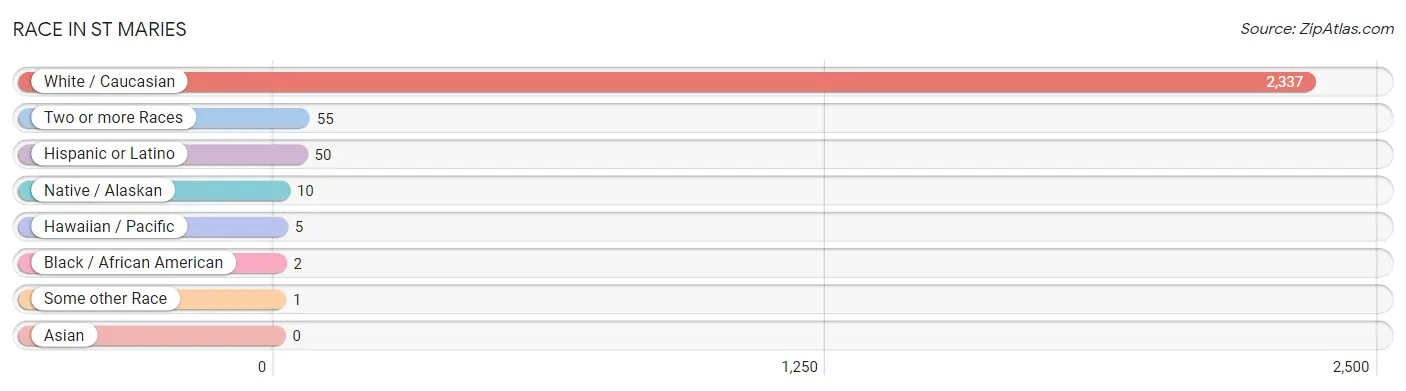
| Race | # Population | % Population |
| Asian | 0 | 0.0% |
| Black / African American | 2 | 0.1% |
| Hawaiian / Pacific | 5 | 0.2% |
| Hispanic or Latino | 50 | 2.1% |
| Native / Alaskan | 10 | 0.4% |
| White / Caucasian | 2,337 | 97.0% |
| Two or more Races | 55 | 2.3% |
| Some other Race | 1 | 0.0% |
| Total | 2,410 | 100.0% |
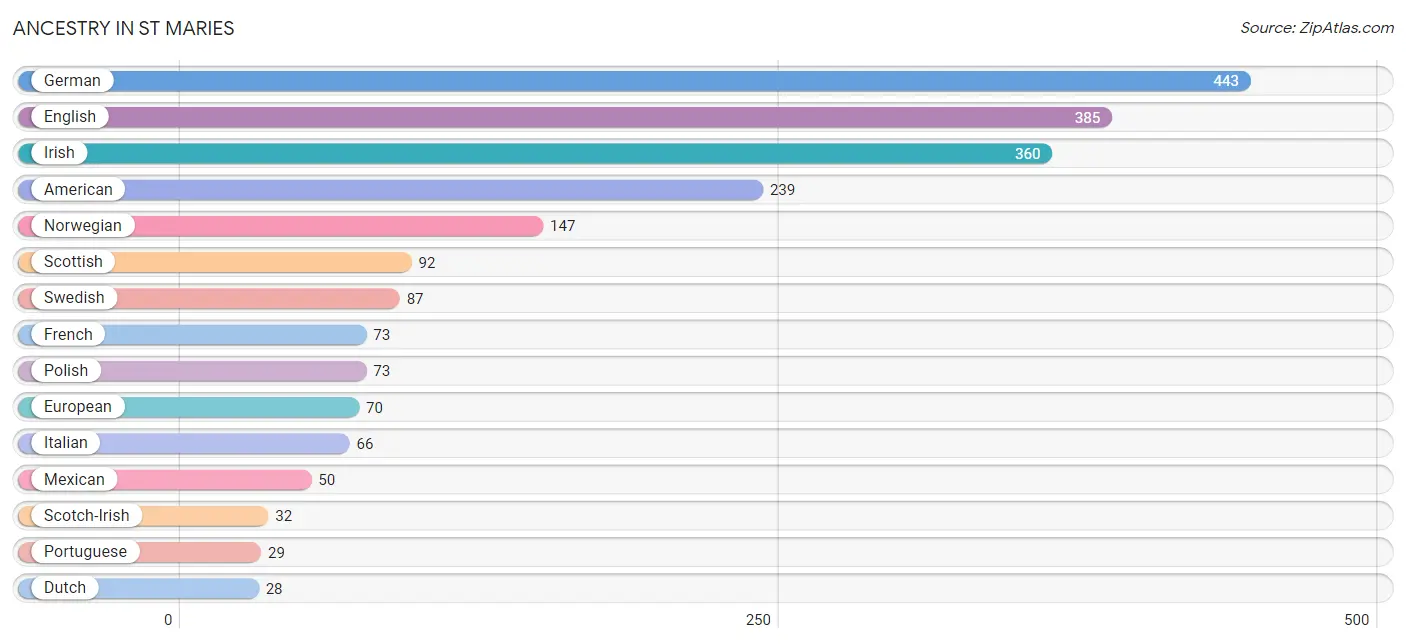
Ancestry in St Maries
The most populous ancestries reported in St Maries are German (443 | 18.4%), English (385 | 16.0%), Irish (360 | 14.9%), American (239 | 9.9%), and Norwegian (147 | 6.1%), together accounting for 65.3% of all St Maries residents.
| Ancestry | # Population | % Population |
| African | 2 | 0.1% |
| American | 239 | 9.9% |
| Austrian | 13 | 0.5% |
| Belizean | 1 | 0.0% |
| Blackfeet | 6 | 0.3% |
| Cajun | 3 | 0.1% |
| Cherokee | 4 | 0.2% |
| Czech | 15 | 0.6% |
| Danish | 12 | 0.5% |
| Dutch | 28 | 1.2% |
| Eastern European | 7 | 0.3% |
| English | 385 | 16.0% |
| European | 70 | 2.9% |
| Fijian | 5 | 0.2% |
| Finnish | 13 | 0.5% |
| French | 73 | 3.0% |
| French Canadian | 24 | 1.0% |
| German | 443 | 18.4% |
| Hungarian | 13 | 0.5% |
| Icelander | 4 | 0.2% |
| Irish | 360 | 14.9% |
| Iroquois | 1 | 0.0% |
| Italian | 66 | 2.7% |
| Mexican | 50 | 2.1% |
| Norwegian | 147 | 6.1% |
| Pennsylvania German | 8 | 0.3% |
| Polish | 73 | 3.0% |
| Portuguese | 29 | 1.2% |
| Russian | 11 | 0.5% |
| Scandinavian | 17 | 0.7% |
| Scotch-Irish | 32 | 1.3% |
| Scottish | 92 | 3.8% |
| Sioux | 1 | 0.0% |
| Subsaharan African | 2 | 0.1% |
| Swedish | 87 | 3.6% |
| Swiss | 7 | 0.3% |
| Turkish | 27 | 1.1% |
| Ukrainian | 3 | 0.1% |
| Welsh | 25 | 1.0% | View All 39 Rows |
Immigrants in St Maries
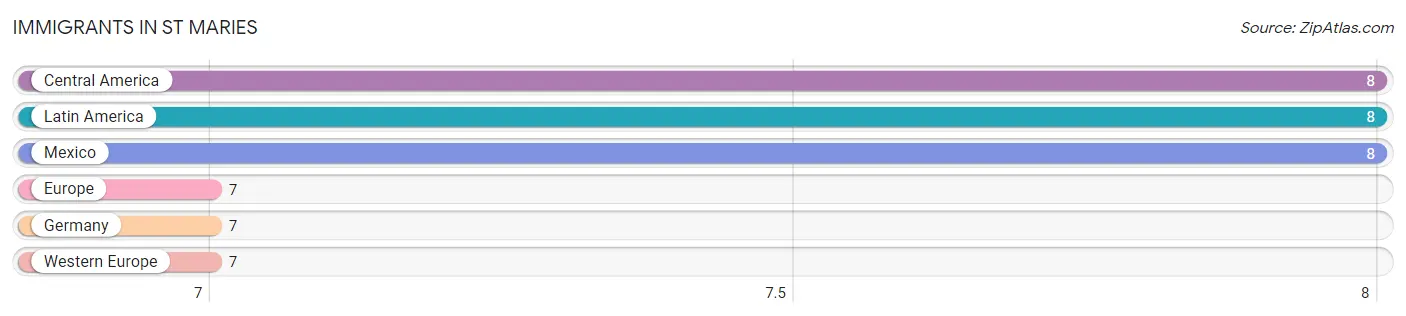
The most numerous immigrant groups reported in St Maries came from Central America (8 | 0.3%), Latin America (8 | 0.3%), Mexico (8 | 0.3%), Europe (7 | 0.3%), and Germany (7 | 0.3%), together accounting for 1.6% of all St Maries residents.
| Immigration Origin | # Population | % Population |
| Central America | 8 | 0.3% |
| Europe | 7 | 0.3% |
| Germany | 7 | 0.3% |
| Latin America | 8 | 0.3% |
| Mexico | 8 | 0.3% |
| Western Europe | 7 | 0.3% | View All 6 Rows |
Sex and Age in St Maries
Sex and Age in St Maries
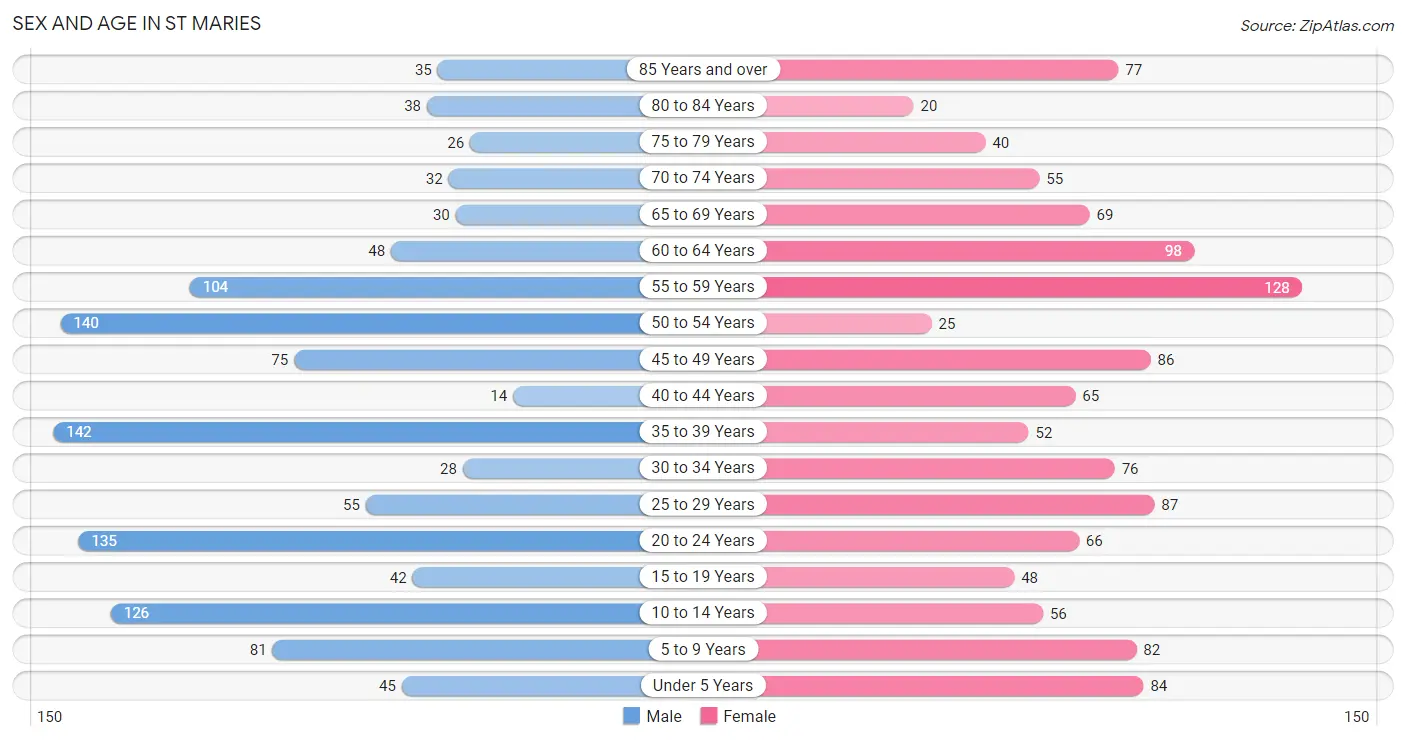
The most populous age groups in St Maries are 35 to 39 Years (142 | 11.9%) for men and 55 to 59 Years (128 | 10.5%) for women.
| Age Bracket | Male | Female |
| Under 5 Years | 45 (3.8%) | 84 (6.9%) |
| 5 to 9 Years | 81 (6.8%) | 82 (6.8%) |
| 10 to 14 Years | 126 (10.5%) | 56 (4.6%) |
| 15 to 19 Years | 42 (3.5%) | 48 (4.0%) |
| 20 to 24 Years | 135 (11.3%) | 66 (5.4%) |
| 25 to 29 Years | 55 (4.6%) | 87 (7.2%) |
| 30 to 34 Years | 28 (2.3%) | 76 (6.3%) |
| 35 to 39 Years | 142 (11.9%) | 52 (4.3%) |
| 40 to 44 Years | 14 (1.2%) | 65 (5.3%) |
| 45 to 49 Years | 75 (6.3%) | 86 (7.1%) |
| 50 to 54 Years | 140 (11.7%) | 25 (2.1%) |
| 55 to 59 Years | 104 (8.7%) | 128 (10.5%) |
| 60 to 64 Years | 48 (4.0%) | 98 (8.1%) |
| 65 to 69 Years | 30 (2.5%) | 69 (5.7%) |
| 70 to 74 Years | 32 (2.7%) | 55 (4.5%) |
| 75 to 79 Years | 26 (2.2%) | 40 (3.3%) |
| 80 to 84 Years | 38 (3.2%) | 20 (1.7%) |
| 85 Years and over | 35 (2.9%) | 77 (6.3%) |
| Total | 1,196 (100.0%) | 1,214 (100.0%) |
Families and Households in St Maries
Median Family Size in St Maries
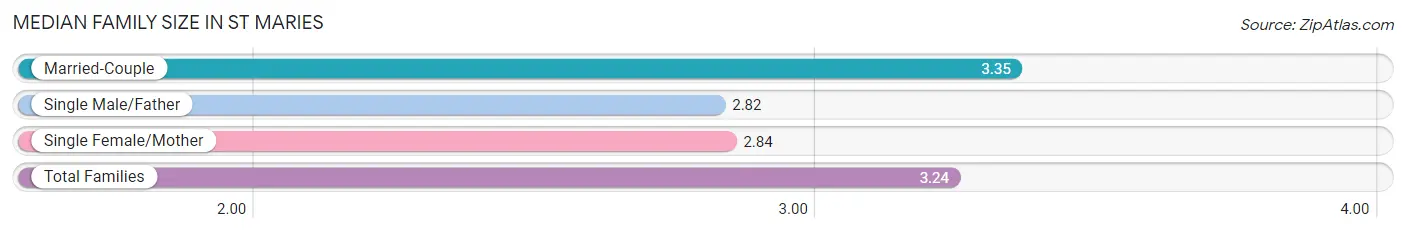
The median family size in St Maries is 3.24 persons per family, with married-couple families (431 | 78.1%) accounting for the largest median family size of 3.35 persons per family. On the other hand, single male/father families (39 | 7.1%) represent the smallest median family size with 2.82 persons per family.
| Family Type | # Families | Family Size |
| Married-Couple | 431 (78.1%) | 3.35 |
| Single Male/Father | 39 (7.1%) | 2.82 |
| Single Female/Mother | 82 (14.9%) | 2.84 |
| Total Families | 552 (100.0%) | 3.24 |
Median Household Size in St Maries
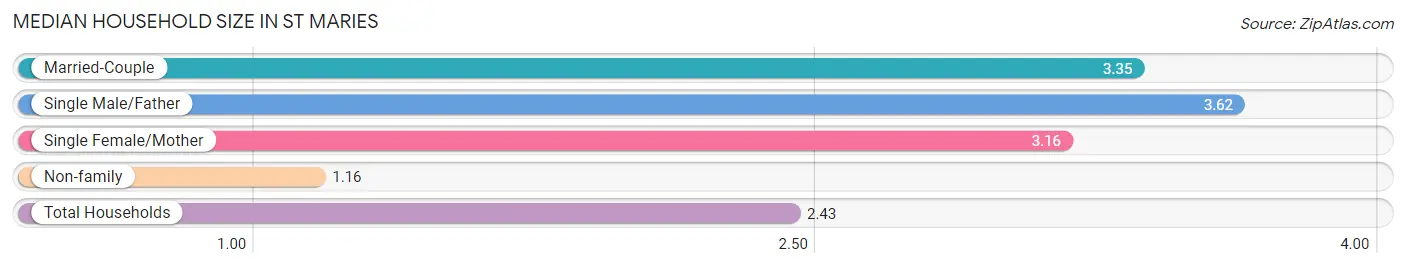
The median household size in St Maries is 2.43 persons per household, with single male/father households (39 | 4.1%) accounting for the largest median household size of 3.62 persons per household. non-family households (396 | 41.8%) represent the smallest median household size with 1.16 persons per household.
| Household Type | # Households | Household Size |
| Married-Couple | 431 (45.5%) | 3.35 |
| Single Male/Father | 39 (4.1%) | 3.62 |
| Single Female/Mother | 82 (8.6%) | 3.16 |
| Non-family | 396 (41.8%) | 1.16 |
| Total Households | 948 (100.0%) | 2.43 |
Household Size by Marriage Status in St Maries
Out of a total of 948 households in St Maries, 552 (58.2%) are family households, while 396 (41.8%) are nonfamily households. The most numerous type of family households are 2-person households, comprising 237, and the most common type of nonfamily households are 1-person households, comprising 349.
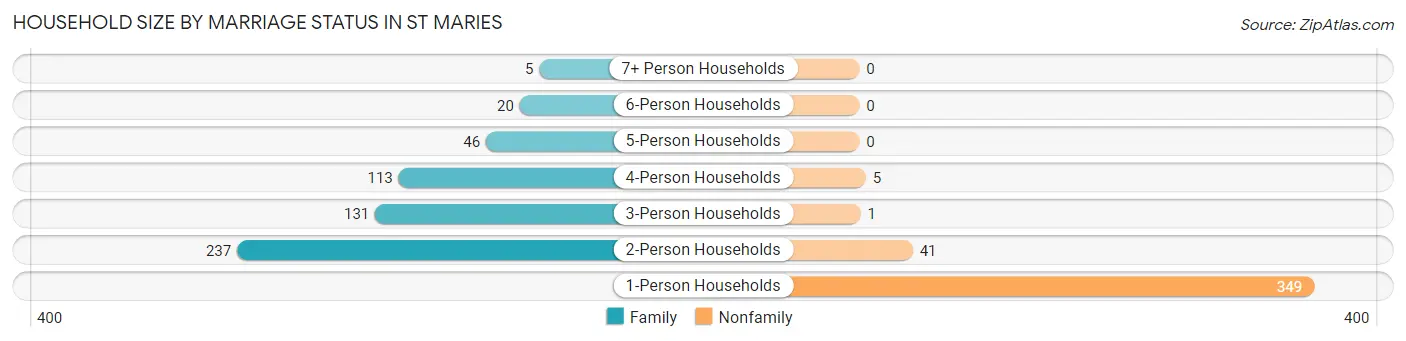
| Household Size | Family Households | Nonfamily Households |
| 1-Person Households | - | 349 (36.8%) |
| 2-Person Households | 237 (25.0%) | 41 (4.3%) |
| 3-Person Households | 131 (13.8%) | 1 (0.1%) |
| 4-Person Households | 113 (11.9%) | 5 (0.5%) |
| 5-Person Households | 46 (4.9%) | 0 (0.0%) |
| 6-Person Households | 20 (2.1%) | 0 (0.0%) |
| 7+ Person Households | 5 (0.5%) | 0 (0.0%) |
| Total | 552 (58.2%) | 396 (41.8%) |
Female Fertility in St Maries
Fertility by Age in St Maries
Average fertility rate in St Maries is 33.0 births per 1,000 women. Women in the age bracket of 20 to 34 years have the highest fertility rate with 57.0 births per 1,000 women. Women in the age bracket of 20 to 34 years acount for 81.2% of all women with births.
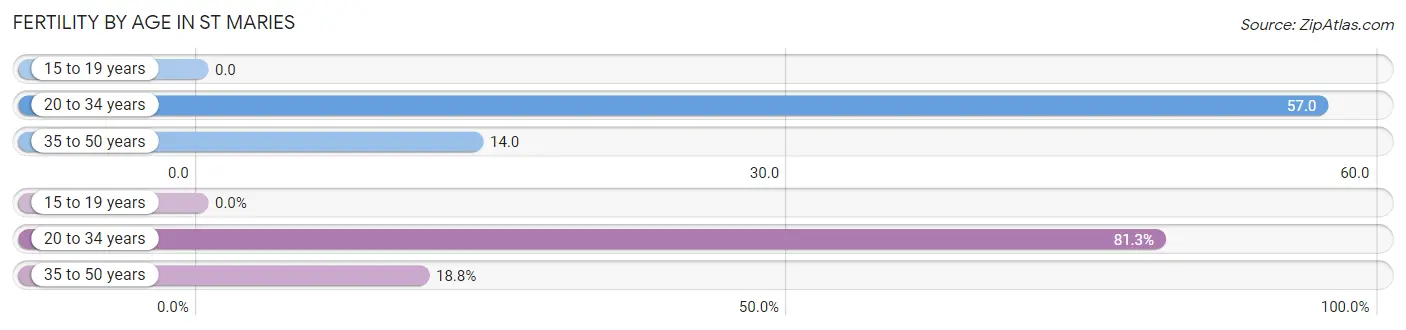
| Age Bracket | Women with Births | Births / 1,000 Women |
| 15 to 19 years | 0 (0.0%) | 0.0 |
| 20 to 34 years | 13 (81.2%) | 57.0 |
| 35 to 50 years | 3 (18.8%) | 14.0 |
| Total | 16 (100.0%) | 33.0 |
Fertility by Age by Marriage Status in St Maries
87.5% of women with births (16) in St Maries are married. The highest percentage of unmarried women with births falls into 20 to 34 years age bracket with 15.4% of them unmarried at the time of birth, while the lowest percentage of unmarried women with births belong to 35 to 50 years age bracket with 0.0% of them unmarried.
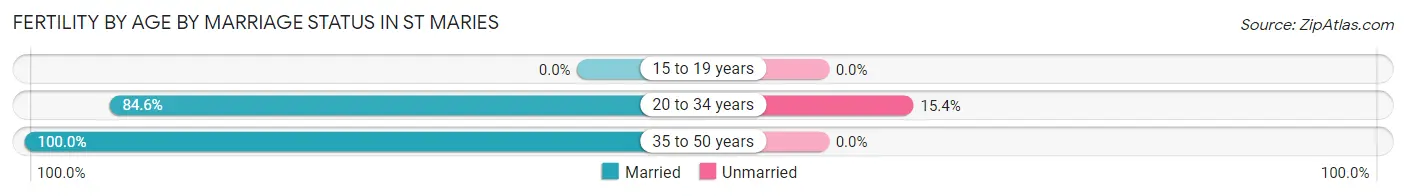
| Age Bracket | Married | Unmarried |
| 15 to 19 years | 0 (0.0%) | 0 (0.0%) |
| 20 to 34 years | 11 (84.6%) | 2 (15.4%) |
| 35 to 50 years | 3 (100.0%) | 0 (0.0%) |
| Total | 14 (87.5%) | 2 (12.5%) |
Fertility by Education in St Maries
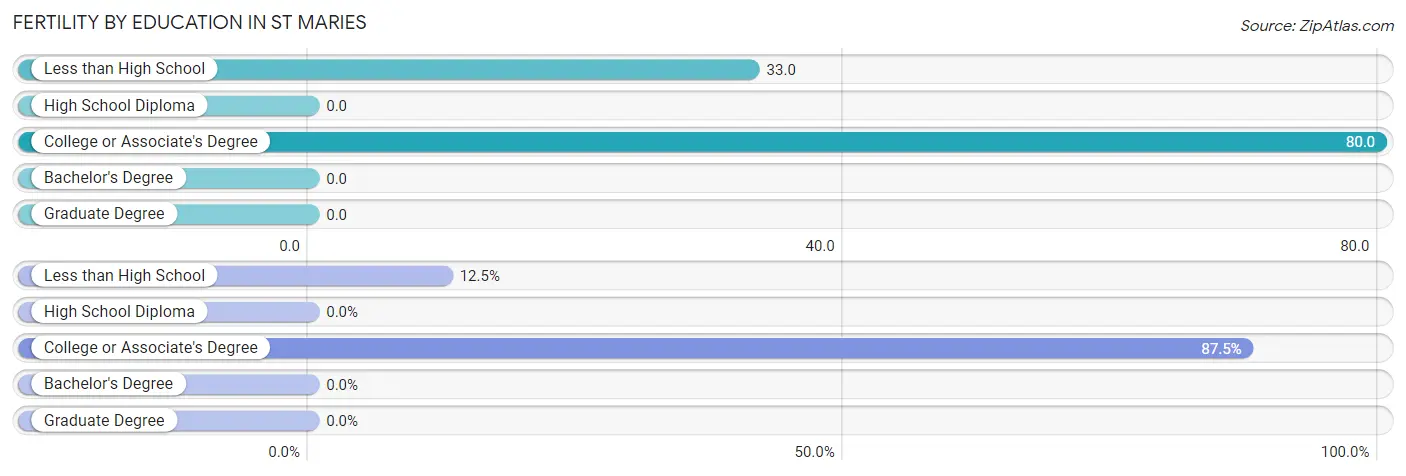
| Educational Attainment | Women with Births | Births / 1,000 Women |
| Less than High School | 2 (12.5%) | 33.0 |
| High School Diploma | 0 (0.0%) | 0.0 |
| College or Associate's Degree | 14 (87.5%) | 80.0 |
| Bachelor's Degree | 0 (0.0%) | 0.0 |
| Graduate Degree | 0 (0.0%) | 0.0 |
| Total | 16 (100.0%) | 33.0 |
Fertility by Education by Marriage Status in St Maries
12.5% of women with births in St Maries are unmarried. Women with the educational attainment of college or associate's degree are most likely to be married with 100.0% of them married at childbirth, while women with the educational attainment of less than high school are least likely to be married with 100.0% of them unmarried at childbirth.
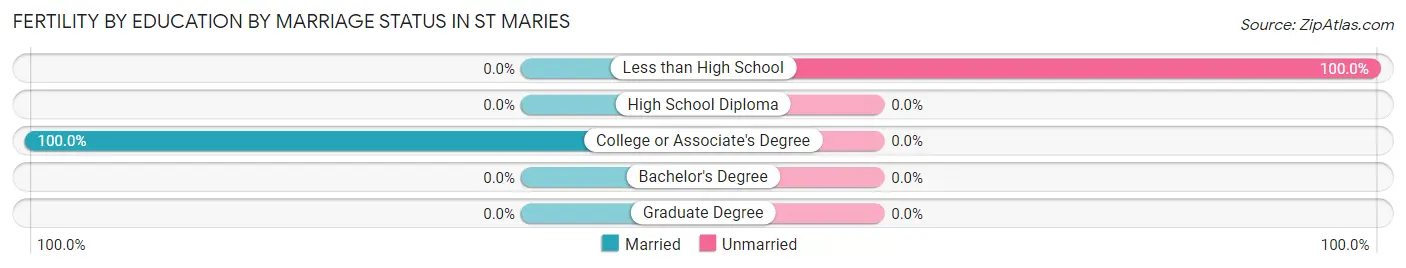
| Educational Attainment | Married | Unmarried |
| Less than High School | 0 (0.0%) | 2 (100.0%) |
| High School Diploma | 0 (0.0%) | 0 (0.0%) |
| College or Associate's Degree | 14 (100.0%) | 0 (0.0%) |
| Bachelor's Degree | 0 (0.0%) | 0 (0.0%) |
| Graduate Degree | 0 (0.0%) | 0 (0.0%) |
| Total | 14 (87.5%) | 2 (12.5%) |
Employment Characteristics in St Maries
Employment by Class of Employer in St Maries
Among the 960 employed individuals in St Maries, private company employees (649 | 67.6%), not-for-profit organizations (94 | 9.8%), and self-employed (not incorporated) (81 | 8.4%) make up the most common classes of employment.
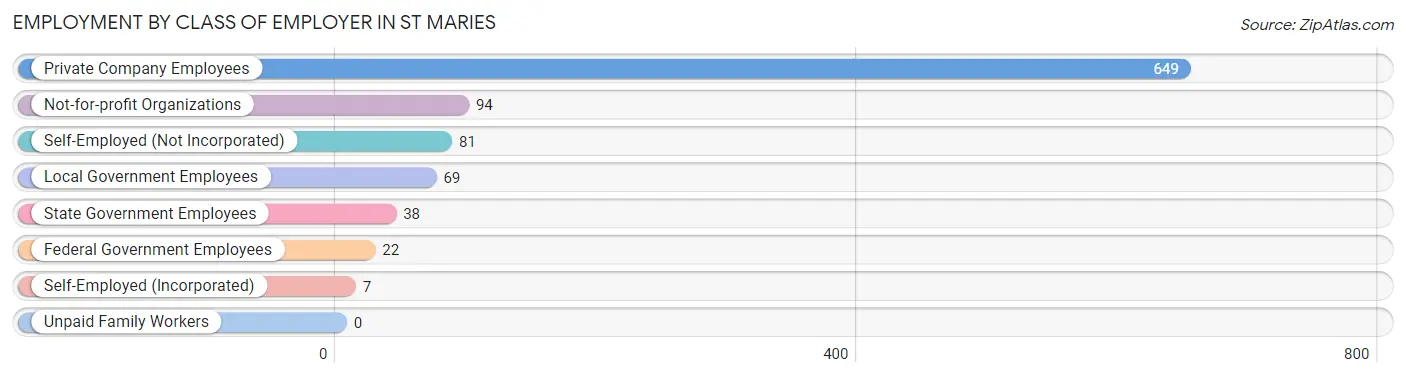
| Employer Class | # Employees | % Employees |
| Private Company Employees | 649 | 67.6% |
| Self-Employed (Incorporated) | 7 | 0.7% |
| Self-Employed (Not Incorporated) | 81 | 8.4% |
| Not-for-profit Organizations | 94 | 9.8% |
| Local Government Employees | 69 | 7.2% |
| State Government Employees | 38 | 4.0% |
| Federal Government Employees | 22 | 2.3% |
| Unpaid Family Workers | 0 | 0.0% |
| Total | 960 | 100.0% |
Employment Status by Age in St Maries
According to the labor force statistics for St Maries, out of the total population over 16 years of age (1,918), 53.9% or 1,034 individuals are in the labor force, with 5.3% or 55 of them unemployed. The age group with the highest labor force participation rate is 35 to 44 years, with 76.6% or 209 individuals in the labor force. Within the labor force, the 65 to 74 years age range has the highest percentage of unemployed individuals, with 23.5% or 4 of them being unemployed.
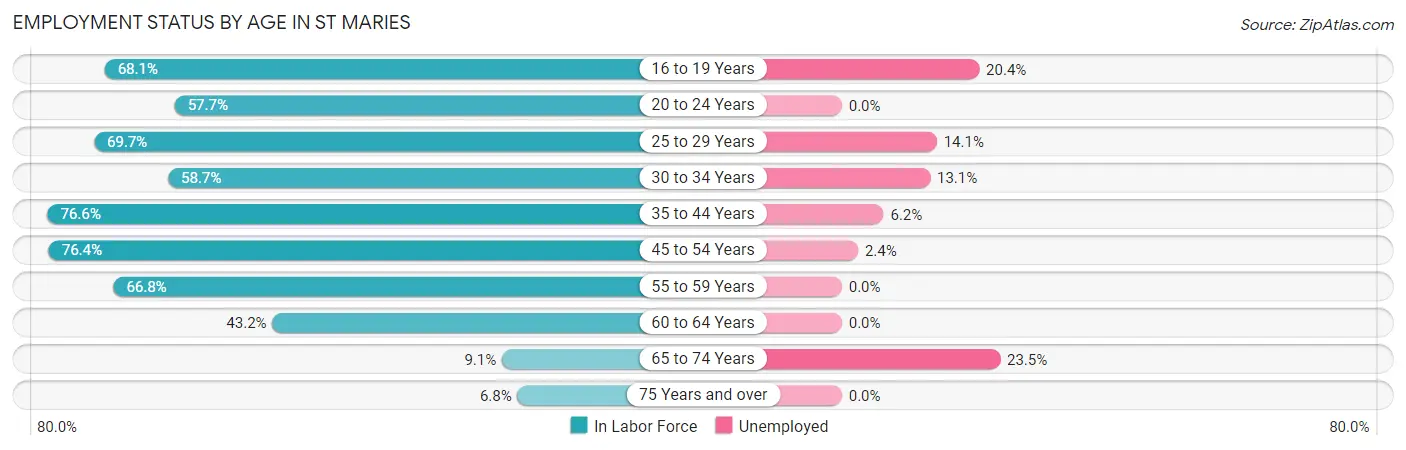
| Age Bracket | In Labor Force | Unemployed |
| 16 to 19 Years | 49 (68.1%) | 10 (20.4%) |
| 20 to 24 Years | 116 (57.7%) | 0 (0.0%) |
| 25 to 29 Years | 99 (69.7%) | 14 (14.1%) |
| 30 to 34 Years | 61 (58.7%) | 8 (13.1%) |
| 35 to 44 Years | 209 (76.6%) | 13 (6.2%) |
| 45 to 54 Years | 249 (76.4%) | 6 (2.4%) |
| 55 to 59 Years | 155 (66.8%) | 0 (0.0%) |
| 60 to 64 Years | 63 (43.2%) | 0 (0.0%) |
| 65 to 74 Years | 17 (9.1%) | 4 (23.5%) |
| 75 Years and over | 16 (6.8%) | 0 (0.0%) |
| Total | 1,034 (53.9%) | 55 (5.3%) |
Employment Status by Educational Attainment in St Maries
According to labor force statistics for St Maries, 68.4% of individuals (837) out of the total population between 25 and 64 years of age (1,223) are in the labor force, with 4.9% or 41 of them being unemployed. The group with the highest labor force participation rate are those with the educational attainment of bachelor's degree or higher, with 88.7% or 204 individuals in the labor force. Within the labor force, individuals with less than high school education have the highest percentage of unemployment, with 18.2% or 8 of them being unemployed.
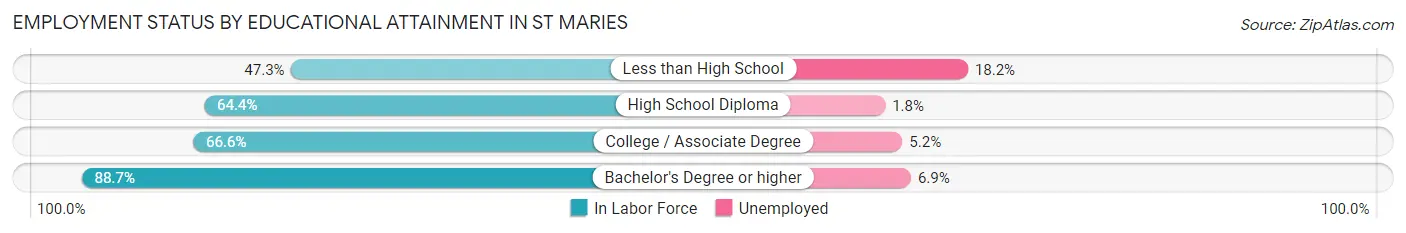
| Educational Attainment | In Labor Force | Unemployed |
| Less than High School | 44 (47.3%) | 17 (18.2%) |
| High School Diploma | 337 (64.4%) | 9 (1.8%) |
| College / Associate Degree | 251 (66.6%) | 20 (5.2%) |
| Bachelor's Degree or higher | 204 (88.7%) | 16 (6.9%) |
| Total | 837 (68.4%) | 60 (4.9%) |
Employment Occupations by Sex in St Maries
Management, Business, Science and Arts Occupations
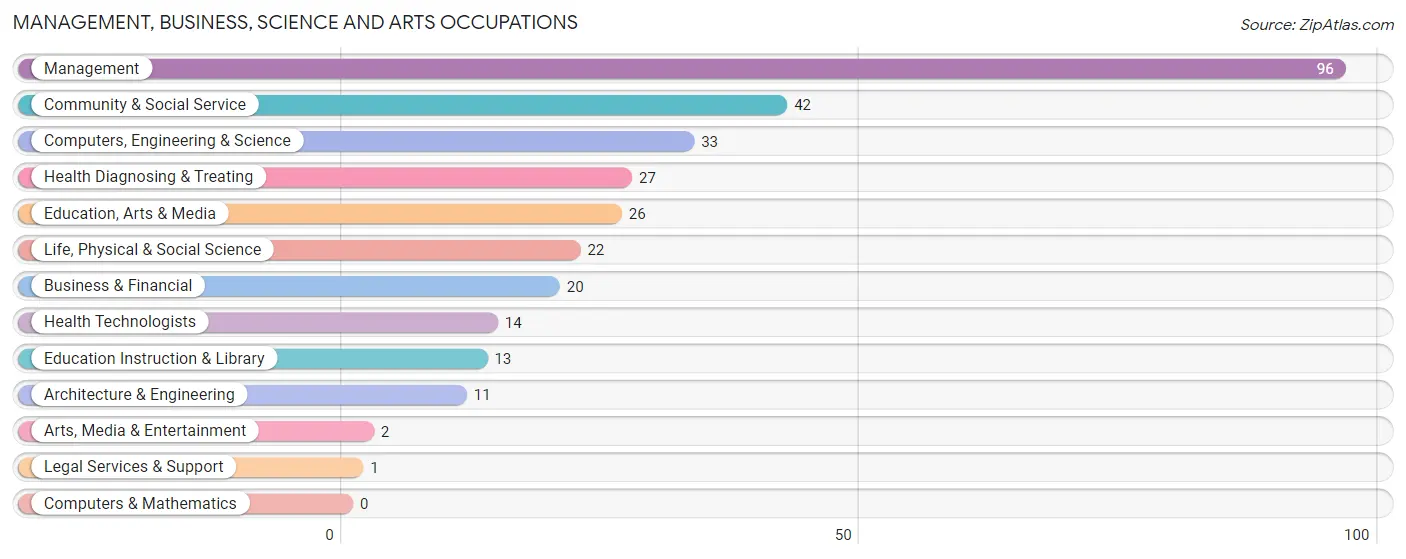
The most common Management, Business, Science and Arts occupations in St Maries are Management (96 | 9.8%), Community & Social Service (42 | 4.3%), Computers, Engineering & Science (33 | 3.4%), Health Diagnosing & Treating (27 | 2.8%), and Education, Arts & Media (26 | 2.7%).
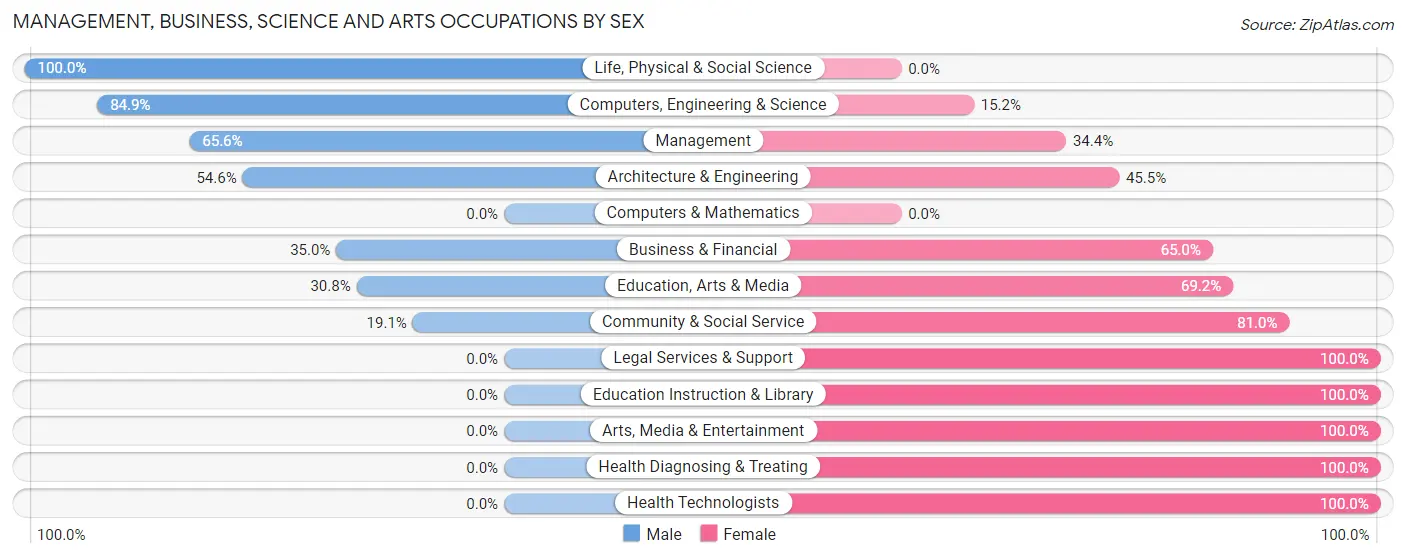
Management, Business, Science and Arts Occupations by Sex
Within the Management, Business, Science and Arts occupations in St Maries, the most male-oriented occupations are Life, Physical & Social Science (100.0%), Computers, Engineering & Science (84.9%), and Management (65.6%), while the most female-oriented occupations are Legal Services & Support (100.0%), Education Instruction & Library (100.0%), and Arts, Media & Entertainment (100.0%).
| Occupation | Male | Female |
| Management | 63 (65.6%) | 33 (34.4%) |
| Business & Financial | 7 (35.0%) | 13 (65.0%) |
| Computers, Engineering & Science | 28 (84.9%) | 5 (15.1%) |
| Computers & Mathematics | 0 (0.0%) | 0 (0.0%) |
| Architecture & Engineering | 6 (54.5%) | 5 (45.5%) |
| Life, Physical & Social Science | 22 (100.0%) | 0 (0.0%) |
| Community & Social Service | 8 (19.1%) | 34 (80.9%) |
| Education, Arts & Media | 8 (30.8%) | 18 (69.2%) |
| Legal Services & Support | 0 (0.0%) | 1 (100.0%) |
| Education Instruction & Library | 0 (0.0%) | 13 (100.0%) |
| Arts, Media & Entertainment | 0 (0.0%) | 2 (100.0%) |
| Health Diagnosing & Treating | 0 (0.0%) | 27 (100.0%) |
| Health Technologists | 0 (0.0%) | 14 (100.0%) |
| Total (Category) | 106 (48.6%) | 112 (51.4%) |
| Total (Overall) | 578 (59.0%) | 401 (41.0%) |
Services Occupations
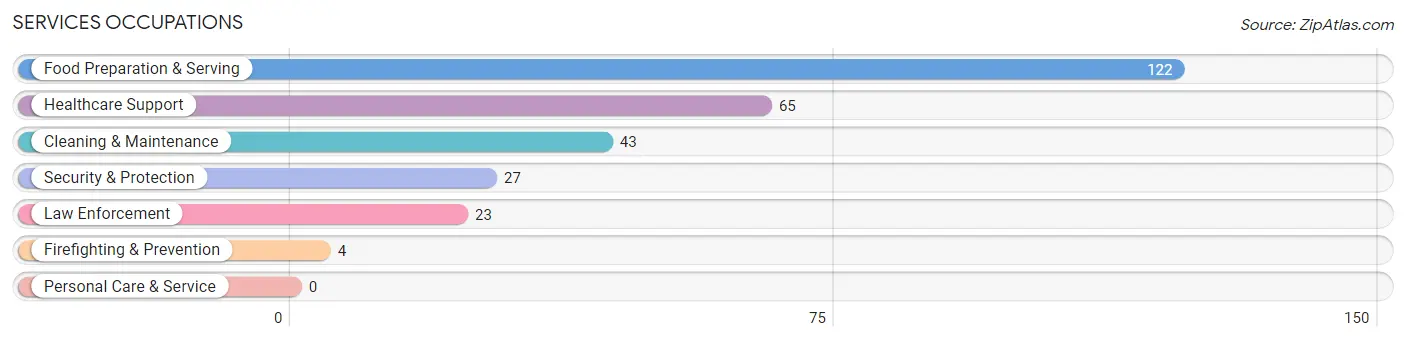
The most common Services occupations in St Maries are Food Preparation & Serving (122 | 12.5%), Healthcare Support (65 | 6.6%), Cleaning & Maintenance (43 | 4.4%), Security & Protection (27 | 2.8%), and Law Enforcement (23 | 2.4%).
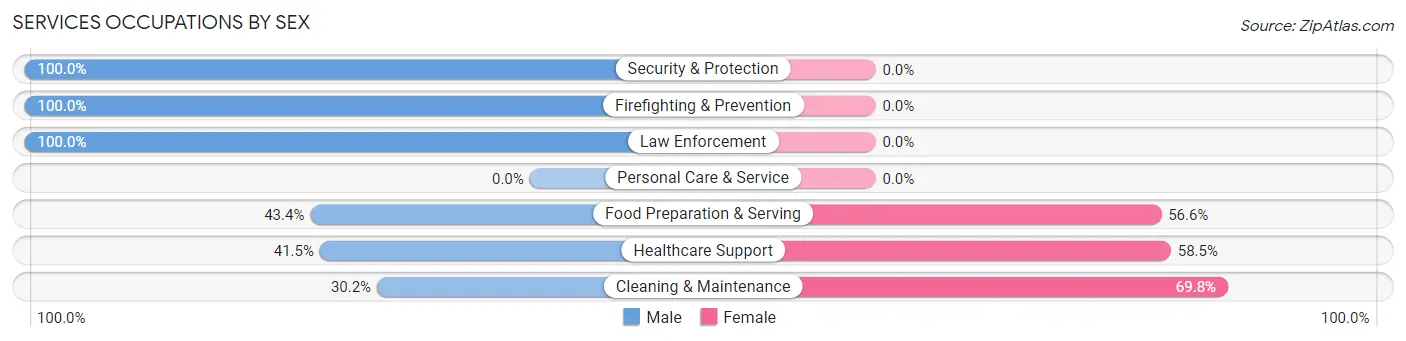
Services Occupations by Sex
Within the Services occupations in St Maries, the most male-oriented occupations are Security & Protection (100.0%), Firefighting & Prevention (100.0%), and Law Enforcement (100.0%), while the most female-oriented occupations are Cleaning & Maintenance (69.8%), Healthcare Support (58.5%), and Food Preparation & Serving (56.6%).
| Occupation | Male | Female |
| Healthcare Support | 27 (41.5%) | 38 (58.5%) |
| Security & Protection | 27 (100.0%) | 0 (0.0%) |
| Firefighting & Prevention | 4 (100.0%) | 0 (0.0%) |
| Law Enforcement | 23 (100.0%) | 0 (0.0%) |
| Food Preparation & Serving | 53 (43.4%) | 69 (56.6%) |
| Cleaning & Maintenance | 13 (30.2%) | 30 (69.8%) |
| Personal Care & Service | 0 (0.0%) | 0 (0.0%) |
| Total (Category) | 120 (46.7%) | 137 (53.3%) |
| Total (Overall) | 578 (59.0%) | 401 (41.0%) |
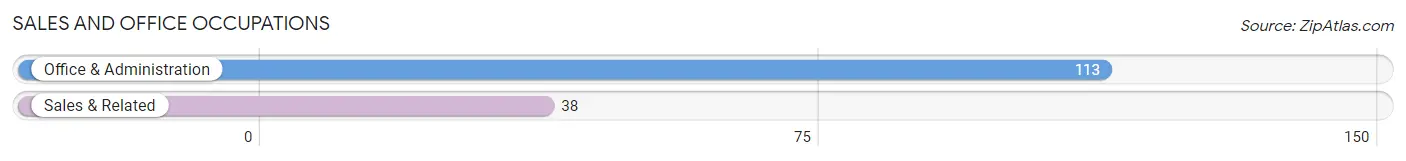
Sales and Office Occupations
The most common Sales and Office occupations in St Maries are Office & Administration (113 | 11.5%), and Sales & Related (38 | 3.9%).
Sales and Office Occupations by Sex
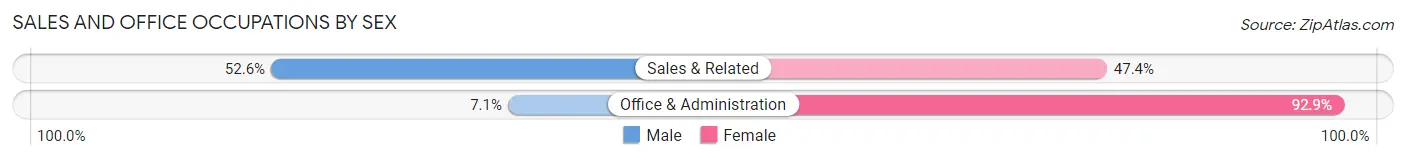
| Occupation | Male | Female |
| Sales & Related | 20 (52.6%) | 18 (47.4%) |
| Office & Administration | 8 (7.1%) | 105 (92.9%) |
| Total (Category) | 28 (18.5%) | 123 (81.5%) |
| Total (Overall) | 578 (59.0%) | 401 (41.0%) |
Natural Resources, Construction and Maintenance Occupations
The most common Natural Resources, Construction and Maintenance occupations in St Maries are Construction & Extraction (105 | 10.7%), Installation, Maintenance & Repair (64 | 6.5%), and Farming, Fishing & Forestry (29 | 3.0%).
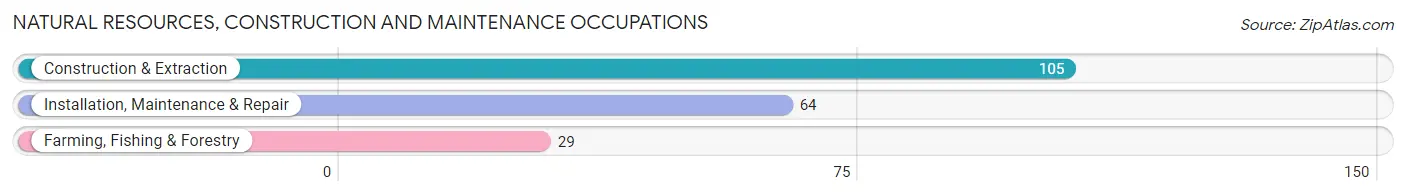
Natural Resources, Construction and Maintenance Occupations by Sex
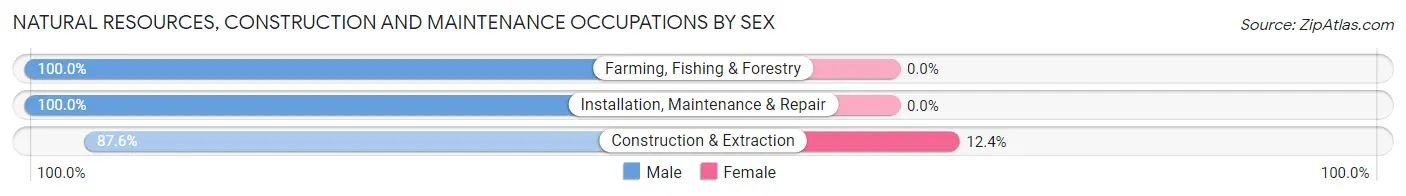
| Occupation | Male | Female |
| Farming, Fishing & Forestry | 29 (100.0%) | 0 (0.0%) |
| Construction & Extraction | 92 (87.6%) | 13 (12.4%) |
| Installation, Maintenance & Repair | 64 (100.0%) | 0 (0.0%) |
| Total (Category) | 185 (93.4%) | 13 (6.6%) |
| Total (Overall) | 578 (59.0%) | 401 (41.0%) |
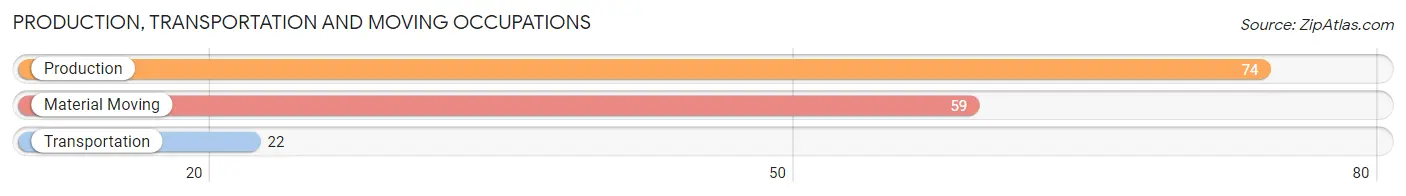
Production, Transportation and Moving Occupations
The most common Production, Transportation and Moving occupations in St Maries are Production (74 | 7.6%), Material Moving (59 | 6.0%), and Transportation (22 | 2.2%).
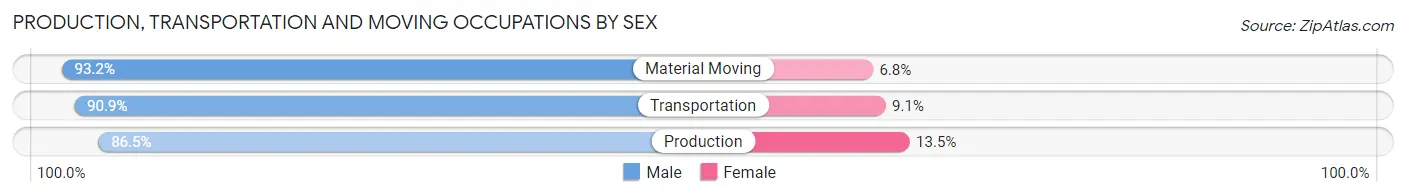
Production, Transportation and Moving Occupations by Sex
| Occupation | Male | Female |
| Production | 64 (86.5%) | 10 (13.5%) |
| Transportation | 20 (90.9%) | 2 (9.1%) |
| Material Moving | 55 (93.2%) | 4 (6.8%) |
| Total (Category) | 139 (89.7%) | 16 (10.3%) |
| Total (Overall) | 578 (59.0%) | 401 (41.0%) |
Employment Industries by Sex in St Maries
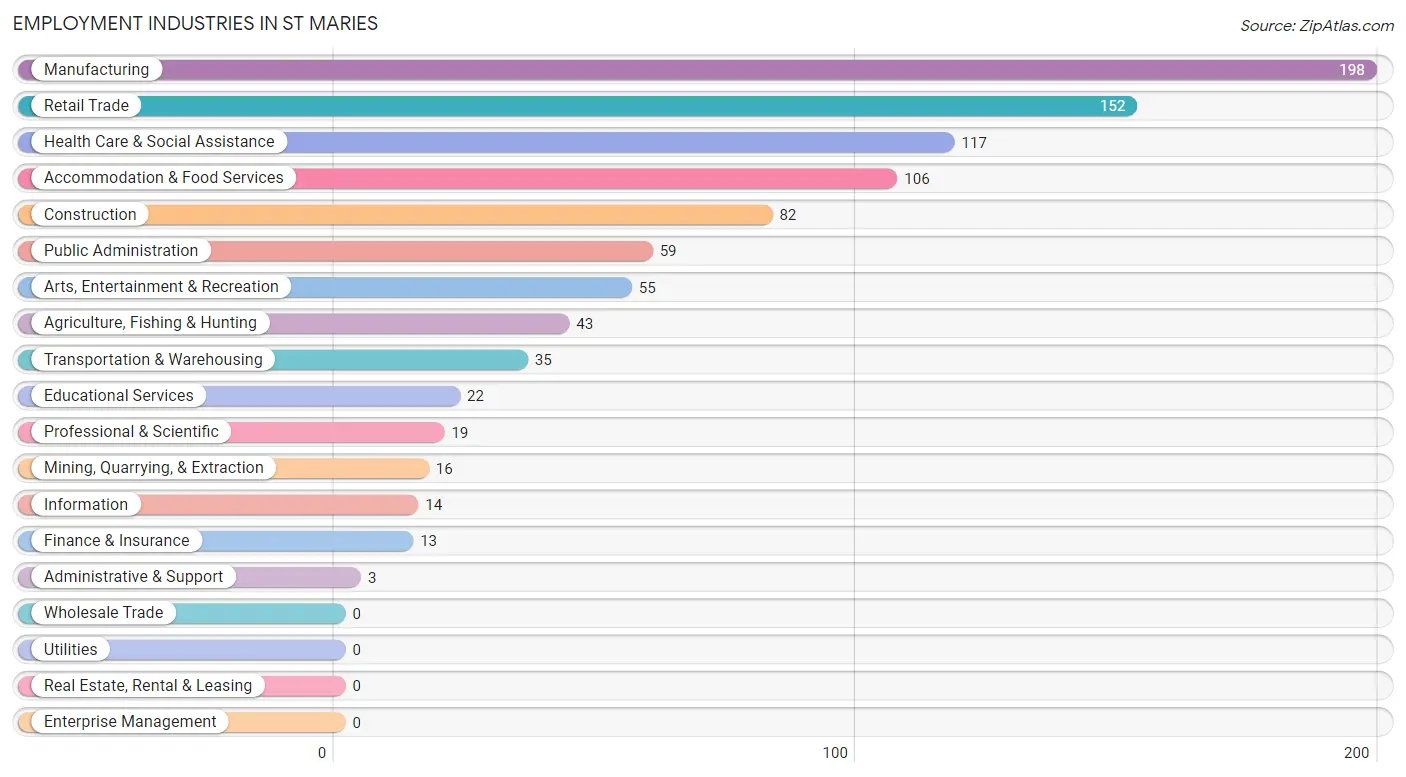
Employment Industries in St Maries
The major employment industries in St Maries include Manufacturing (198 | 20.2%), Retail Trade (152 | 15.5%), Health Care & Social Assistance (117 | 11.9%), Accommodation & Food Services (106 | 10.8%), and Construction (82 | 8.4%).
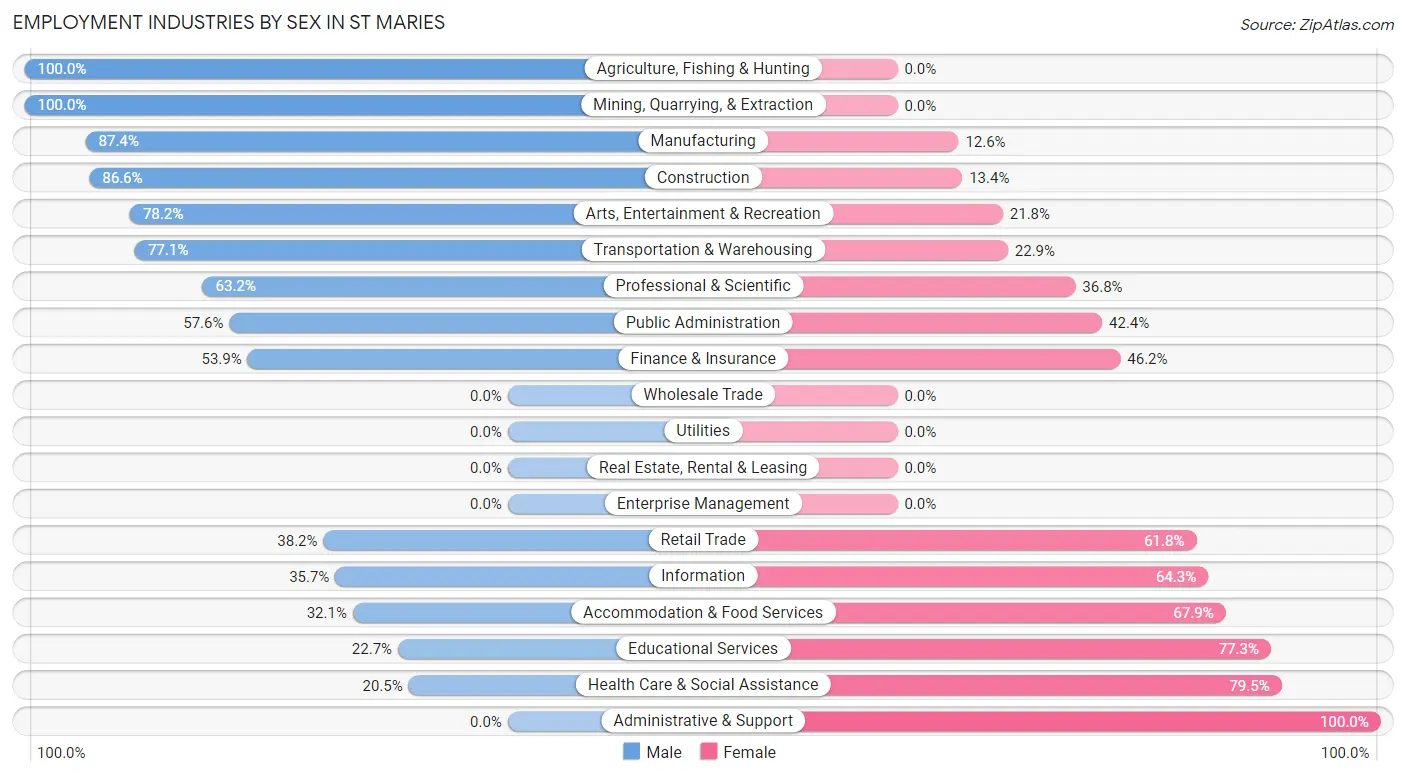
Employment Industries by Sex in St Maries
The St Maries industries that see more men than women are Agriculture, Fishing & Hunting (100.0%), Mining, Quarrying, & Extraction (100.0%), and Manufacturing (87.4%), whereas the industries that tend to have a higher number of women are Administrative & Support (100.0%), Health Care & Social Assistance (79.5%), and Educational Services (77.3%).
| Industry | Male | Female |
| Agriculture, Fishing & Hunting | 43 (100.0%) | 0 (0.0%) |
| Mining, Quarrying, & Extraction | 16 (100.0%) | 0 (0.0%) |
| Construction | 71 (86.6%) | 11 (13.4%) |
| Manufacturing | 173 (87.4%) | 25 (12.6%) |
| Wholesale Trade | 0 (0.0%) | 0 (0.0%) |
| Retail Trade | 58 (38.2%) | 94 (61.8%) |
| Transportation & Warehousing | 27 (77.1%) | 8 (22.9%) |
| Utilities | 0 (0.0%) | 0 (0.0%) |
| Information | 5 (35.7%) | 9 (64.3%) |
| Finance & Insurance | 7 (53.8%) | 6 (46.2%) |
| Real Estate, Rental & Leasing | 0 (0.0%) | 0 (0.0%) |
| Professional & Scientific | 12 (63.2%) | 7 (36.8%) |
| Enterprise Management | 0 (0.0%) | 0 (0.0%) |
| Administrative & Support | 0 (0.0%) | 3 (100.0%) |
| Educational Services | 5 (22.7%) | 17 (77.3%) |
| Health Care & Social Assistance | 24 (20.5%) | 93 (79.5%) |
| Arts, Entertainment & Recreation | 43 (78.2%) | 12 (21.8%) |
| Accommodation & Food Services | 34 (32.1%) | 72 (67.9%) |
| Public Administration | 34 (57.6%) | 25 (42.4%) |
| Total | 578 (59.0%) | 401 (41.0%) |
Education in St Maries
School Enrollment in St Maries
The most common levels of schooling among the 451 students in St Maries are middle school (163 | 36.1%), elementary school (139 | 30.8%), and high school (75 | 16.6%).
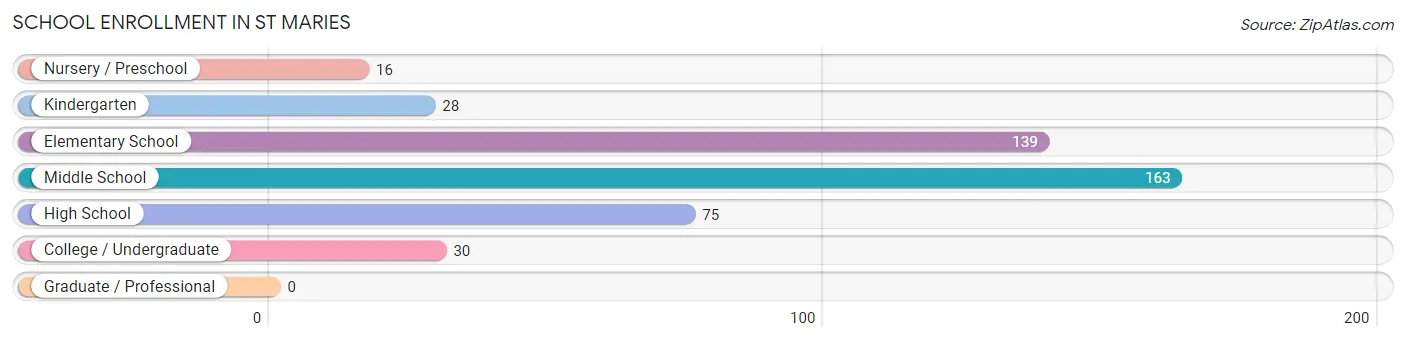
| School Level | # Students | % Students |
| Nursery / Preschool | 16 | 3.5% |
| Kindergarten | 28 | 6.2% |
| Elementary School | 139 | 30.8% |
| Middle School | 163 | 36.1% |
| High School | 75 | 16.6% |
| College / Undergraduate | 30 | 6.7% |
| Graduate / Professional | 0 | 0.0% |
| Total | 451 | 100.0% |
School Enrollment by Age by Funding Source in St Maries
Out of a total of 451 students who are enrolled in schools in St Maries, 118 (26.2%) attend a private institution, while the remaining 333 (73.8%) are enrolled in public schools. The age group of 10 to 14 year olds has the highest likelihood of being enrolled in private schools, with 63 (34.6% in the age bracket) enrolled. Conversely, the age group of 3 to 4 year olds has the lowest likelihood of being enrolled in a private school, with 13 (100.0% in the age bracket) attending a public institution.
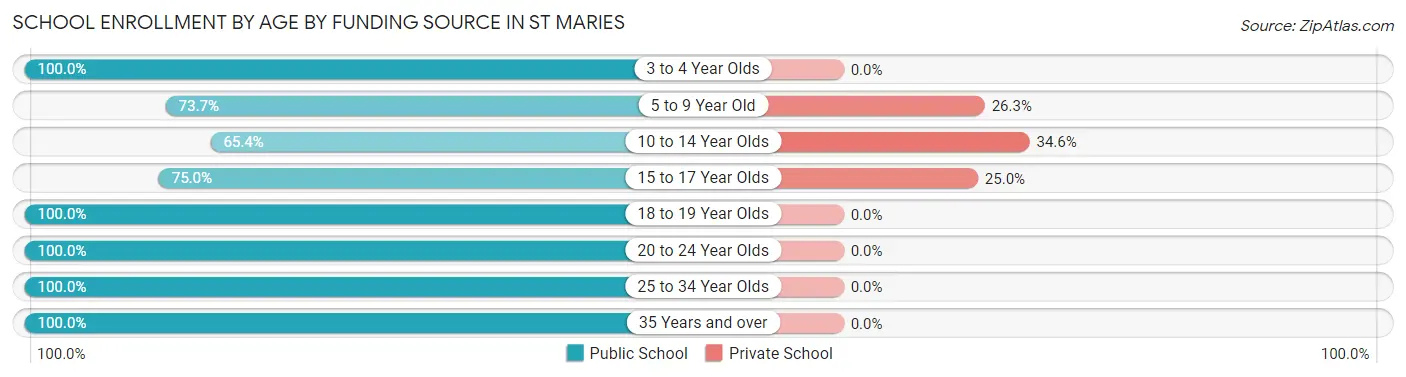
| Age Bracket | Public School | Private School |
| 3 to 4 Year Olds | 13 (100.0%) | 0 (0.0%) |
| 5 to 9 Year Old | 115 (73.7%) | 41 (26.3%) |
| 10 to 14 Year Olds | 119 (65.4%) | 63 (34.6%) |
| 15 to 17 Year Olds | 42 (75.0%) | 14 (25.0%) |
| 18 to 19 Year Olds | 7 (100.0%) | 0 (0.0%) |
| 20 to 24 Year Olds | 10 (100.0%) | 0 (0.0%) |
| 25 to 34 Year Olds | 4 (100.0%) | 0 (0.0%) |
| 35 Years and over | 23 (100.0%) | 0 (0.0%) |
| Total | 333 (73.8%) | 118 (26.2%) |
Educational Attainment by Field of Study in St Maries
Bio, nature & agricultural (95 | 33.5%), communications (35 | 12.3%), psychology (29 | 10.2%), business (24 | 8.5%), and arts & humanities (23 | 8.1%) are the most common fields of study among 284 individuals in St Maries who have obtained a bachelor's degree or higher.
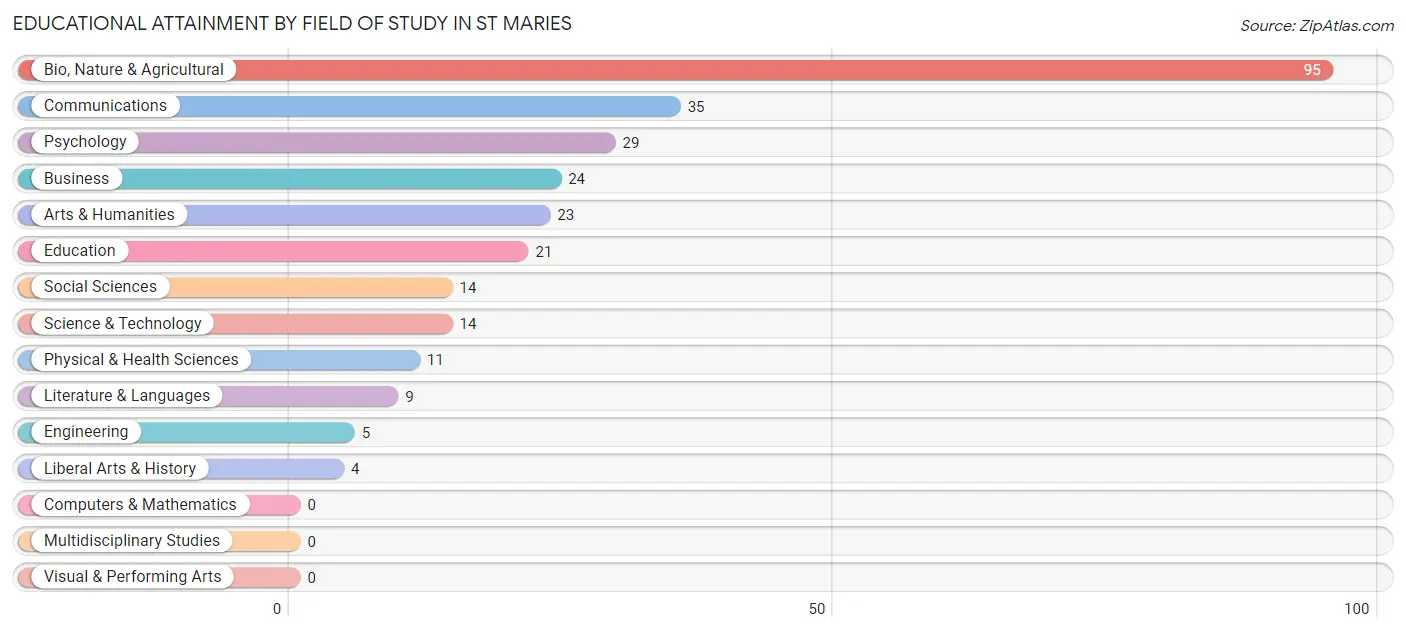
| Field of Study | # Graduates | % Graduates |
| Computers & Mathematics | 0 | 0.0% |
| Bio, Nature & Agricultural | 95 | 33.5% |
| Physical & Health Sciences | 11 | 3.9% |
| Psychology | 29 | 10.2% |
| Social Sciences | 14 | 4.9% |
| Engineering | 5 | 1.8% |
| Multidisciplinary Studies | 0 | 0.0% |
| Science & Technology | 14 | 4.9% |
| Business | 24 | 8.5% |
| Education | 21 | 7.4% |
| Literature & Languages | 9 | 3.2% |
| Liberal Arts & History | 4 | 1.4% |
| Visual & Performing Arts | 0 | 0.0% |
| Communications | 35 | 12.3% |
| Arts & Humanities | 23 | 8.1% |
| Total | 284 | 100.0% |
Transportation & Commute in St Maries
Vehicle Availability by Sex in St Maries
The most prevalent vehicle ownership categories in St Maries are males with 2 vehicles (303, accounting for 53.3%) and females with 2 vehicles (163, making up 77.3%).
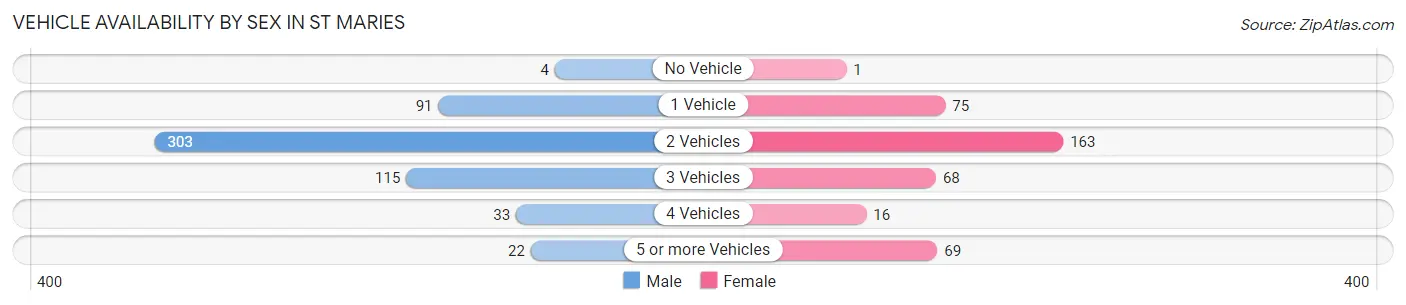
| Vehicles Available | Male | Female |
| No Vehicle | 4 (0.7%) | 1 (0.3%) |
| 1 Vehicle | 91 (16.0%) | 75 (19.1%) |
| 2 Vehicles | 303 (53.3%) | 163 (41.6%) |
| 3 Vehicles | 115 (20.3%) | 68 (17.3%) |
| 4 Vehicles | 33 (5.8%) | 16 (4.1%) |
| 5 or more Vehicles | 22 (3.9%) | 69 (17.6%) |
| Total | 568 (100.0%) | 392 (100.0%) |
Commute Time in St Maries
The most frequently occuring commute durations in St Maries are 5 to 9 minutes (368 commuters, 40.4%), less than 5 minutes (155 commuters, 17.0%), and 45 to 59 minutes (101 commuters, 11.1%).
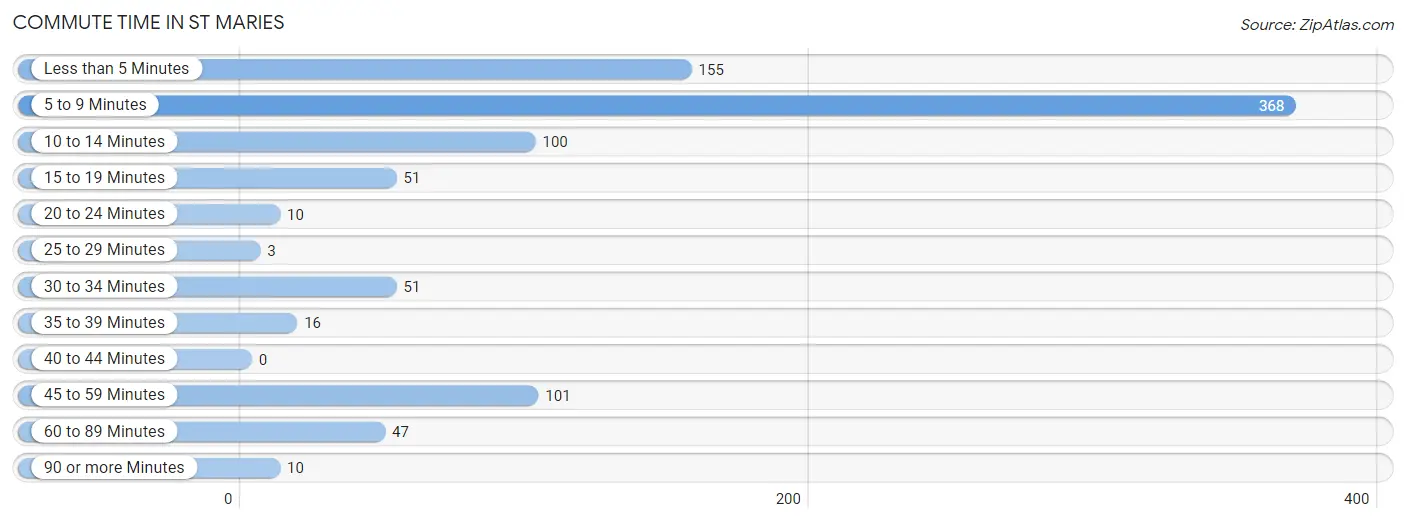
| Commute Time | # Commuters | % Commuters |
| Less than 5 Minutes | 155 | 17.0% |
| 5 to 9 Minutes | 368 | 40.4% |
| 10 to 14 Minutes | 100 | 11.0% |
| 15 to 19 Minutes | 51 | 5.6% |
| 20 to 24 Minutes | 10 | 1.1% |
| 25 to 29 Minutes | 3 | 0.3% |
| 30 to 34 Minutes | 51 | 5.6% |
| 35 to 39 Minutes | 16 | 1.8% |
| 40 to 44 Minutes | 0 | 0.0% |
| 45 to 59 Minutes | 101 | 11.1% |
| 60 to 89 Minutes | 47 | 5.1% |
| 90 or more Minutes | 10 | 1.1% |
Commute Time by Sex in St Maries
The most common commute times in St Maries are 5 to 9 minutes (160 commuters, 29.7%) for males and 5 to 9 minutes (208 commuters, 55.6%) for females.
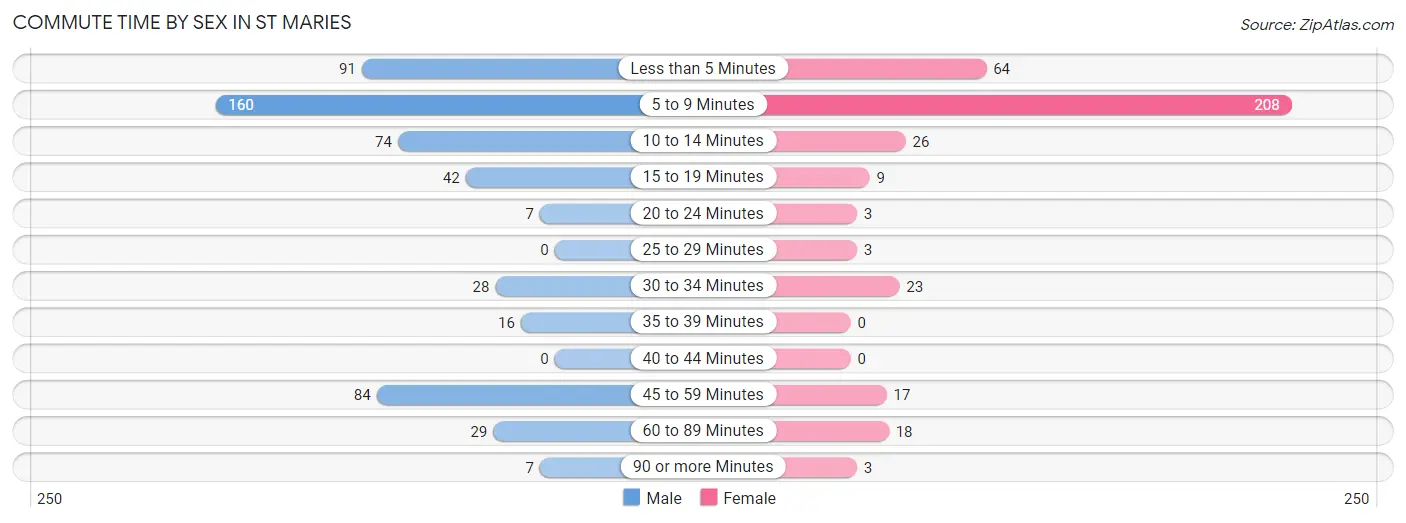
| Commute Time | Male | Female |
| Less than 5 Minutes | 91 (16.9%) | 64 (17.1%) |
| 5 to 9 Minutes | 160 (29.7%) | 208 (55.6%) |
| 10 to 14 Minutes | 74 (13.8%) | 26 (7.0%) |
| 15 to 19 Minutes | 42 (7.8%) | 9 (2.4%) |
| 20 to 24 Minutes | 7 (1.3%) | 3 (0.8%) |
| 25 to 29 Minutes | 0 (0.0%) | 3 (0.8%) |
| 30 to 34 Minutes | 28 (5.2%) | 23 (6.1%) |
| 35 to 39 Minutes | 16 (3.0%) | 0 (0.0%) |
| 40 to 44 Minutes | 0 (0.0%) | 0 (0.0%) |
| 45 to 59 Minutes | 84 (15.6%) | 17 (4.5%) |
| 60 to 89 Minutes | 29 (5.4%) | 18 (4.8%) |
| 90 or more Minutes | 7 (1.3%) | 3 (0.8%) |
Time of Departure to Work by Sex in St Maries
The most frequent times of departure to work in St Maries are 12:00 AM to 4:59 AM (147, 27.3%) for males and 7:00 AM to 7:29 AM (111, 29.7%) for females.
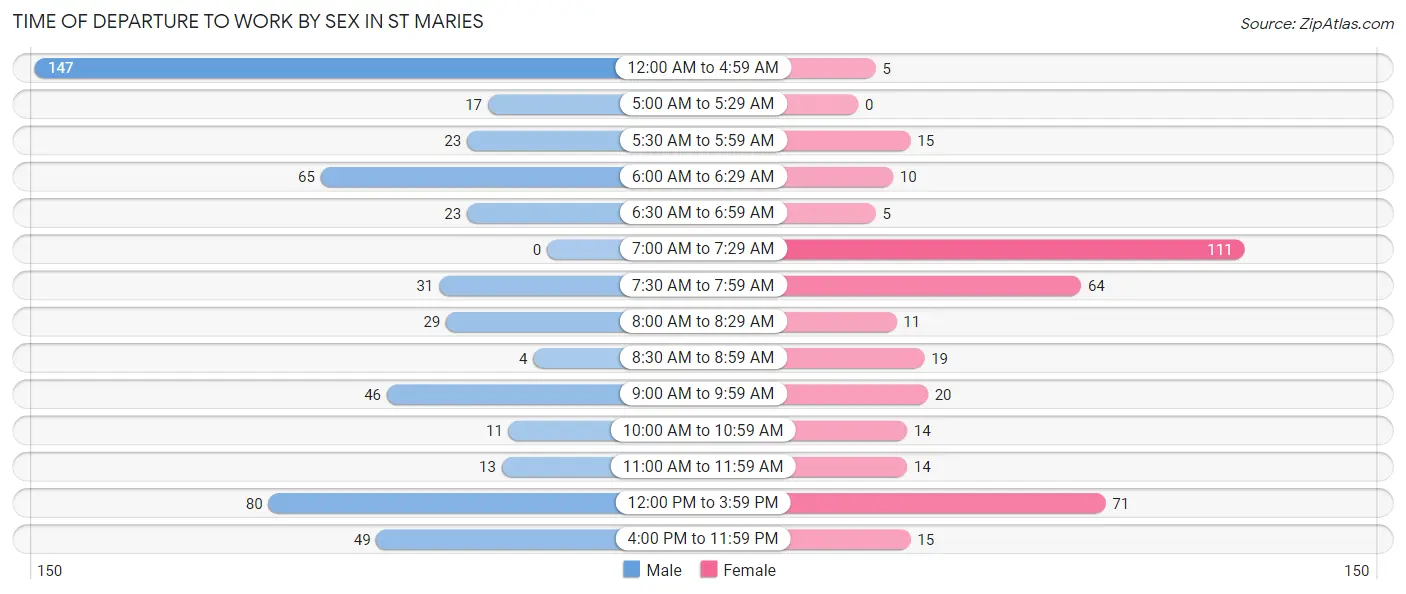
| Time of Departure | Male | Female |
| 12:00 AM to 4:59 AM | 147 (27.3%) | 5 (1.3%) |
| 5:00 AM to 5:29 AM | 17 (3.2%) | 0 (0.0%) |
| 5:30 AM to 5:59 AM | 23 (4.3%) | 15 (4.0%) |
| 6:00 AM to 6:29 AM | 65 (12.1%) | 10 (2.7%) |
| 6:30 AM to 6:59 AM | 23 (4.3%) | 5 (1.3%) |
| 7:00 AM to 7:29 AM | 0 (0.0%) | 111 (29.7%) |
| 7:30 AM to 7:59 AM | 31 (5.8%) | 64 (17.1%) |
| 8:00 AM to 8:29 AM | 29 (5.4%) | 11 (2.9%) |
| 8:30 AM to 8:59 AM | 4 (0.7%) | 19 (5.1%) |
| 9:00 AM to 9:59 AM | 46 (8.6%) | 20 (5.3%) |
| 10:00 AM to 10:59 AM | 11 (2.0%) | 14 (3.7%) |
| 11:00 AM to 11:59 AM | 13 (2.4%) | 14 (3.7%) |
| 12:00 PM to 3:59 PM | 80 (14.9%) | 71 (19.0%) |
| 4:00 PM to 11:59 PM | 49 (9.1%) | 15 (4.0%) |
| Total | 538 (100.0%) | 374 (100.0%) |
Housing Occupancy in St Maries
Occupancy by Ownership in St Maries
Of the total 948 dwellings in St Maries, owner-occupied units account for 575 (60.7%), while renter-occupied units make up 373 (39.4%).
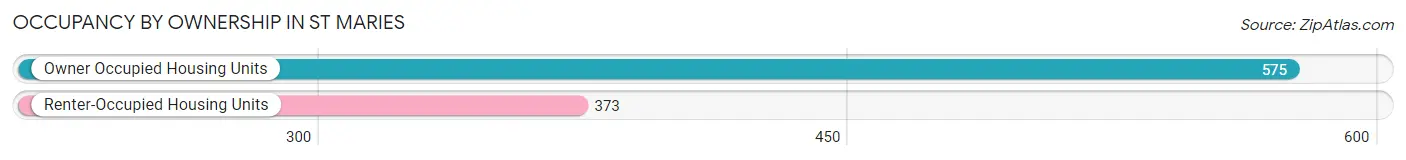
| Occupancy | # Housing Units | % Housing Units |
| Owner Occupied Housing Units | 575 | 60.7% |
| Renter-Occupied Housing Units | 373 | 39.4% |
| Total Occupied Housing Units | 948 | 100.0% |
Occupancy by Household Size in St Maries
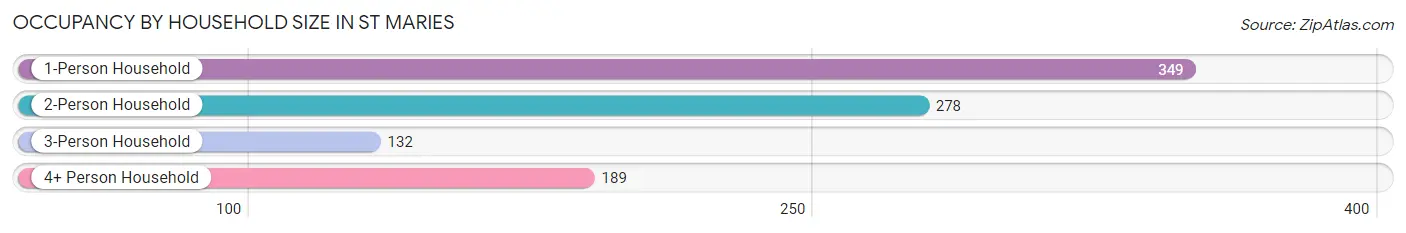
| Household Size | # Housing Units | % Housing Units |
| 1-Person Household | 349 | 36.8% |
| 2-Person Household | 278 | 29.3% |
| 3-Person Household | 132 | 13.9% |
| 4+ Person Household | 189 | 19.9% |
| Total Housing Units | 948 | 100.0% |
Occupancy by Ownership by Household Size in St Maries
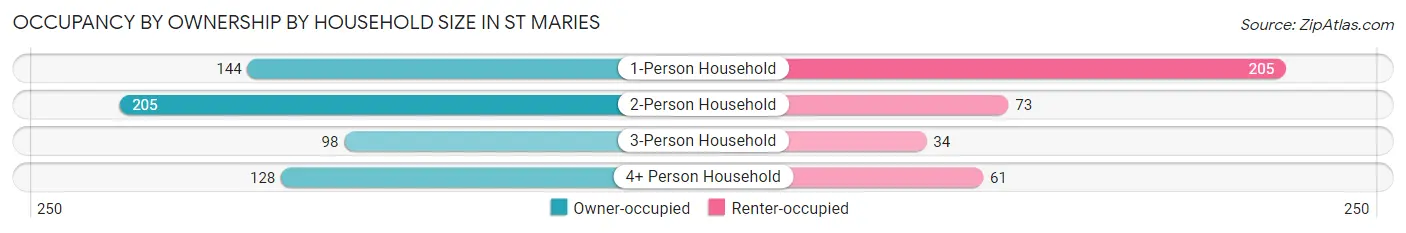
| Household Size | Owner-occupied | Renter-occupied |
| 1-Person Household | 144 (41.3%) | 205 (58.7%) |
| 2-Person Household | 205 (73.7%) | 73 (26.3%) |
| 3-Person Household | 98 (74.2%) | 34 (25.8%) |
| 4+ Person Household | 128 (67.7%) | 61 (32.3%) |
| Total Housing Units | 575 (60.7%) | 373 (39.4%) |
Occupancy by Educational Attainment in St Maries
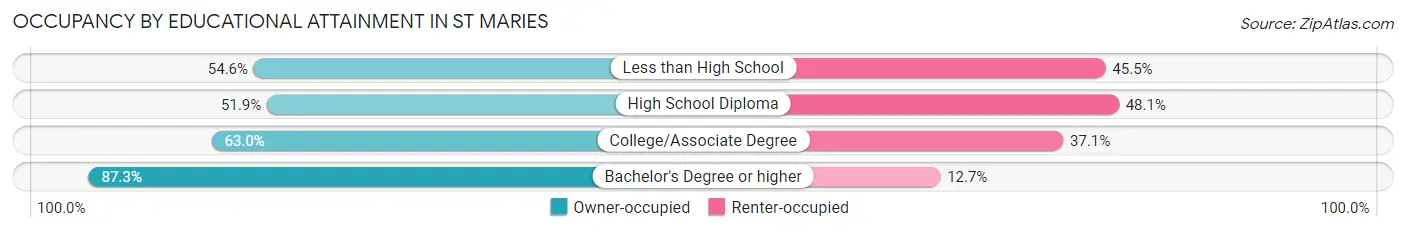
| Household Size | Owner-occupied | Renter-occupied |
| Less than High School | 36 (54.5%) | 30 (45.5%) |
| High School Diploma | 230 (51.9%) | 213 (48.1%) |
| College/Associate Degree | 192 (62.9%) | 113 (37.0%) |
| Bachelor's Degree or higher | 117 (87.3%) | 17 (12.7%) |
Occupancy by Age of Householder in St Maries
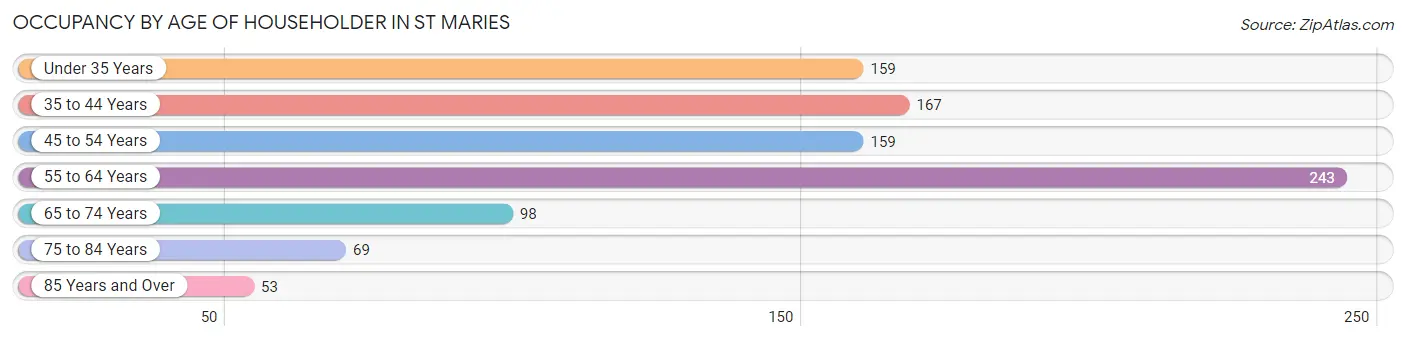
| Age Bracket | # Households | % Households |
| Under 35 Years | 159 | 16.8% |
| 35 to 44 Years | 167 | 17.6% |
| 45 to 54 Years | 159 | 16.8% |
| 55 to 64 Years | 243 | 25.6% |
| 65 to 74 Years | 98 | 10.3% |
| 75 to 84 Years | 69 | 7.3% |
| 85 Years and Over | 53 | 5.6% |
| Total | 948 | 100.0% |
Housing Finances in St Maries
Median Income by Occupancy in St Maries
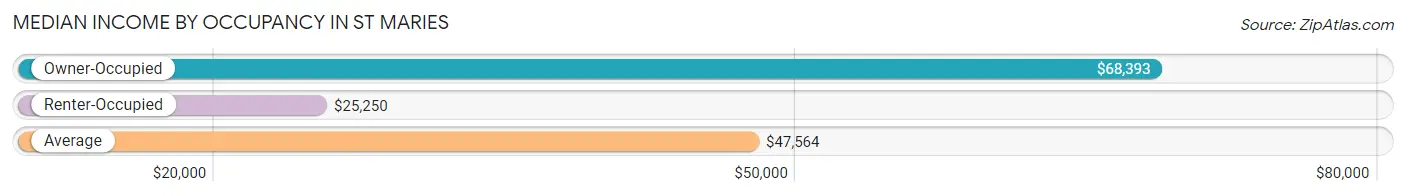
| Occupancy Type | # Households | Median Income |
| Owner-Occupied | 575 (60.7%) | $68,393 |
| Renter-Occupied | 373 (39.4%) | $25,250 |
| Average | 948 (100.0%) | $47,564 |
Occupancy by Householder Income Bracket in St Maries
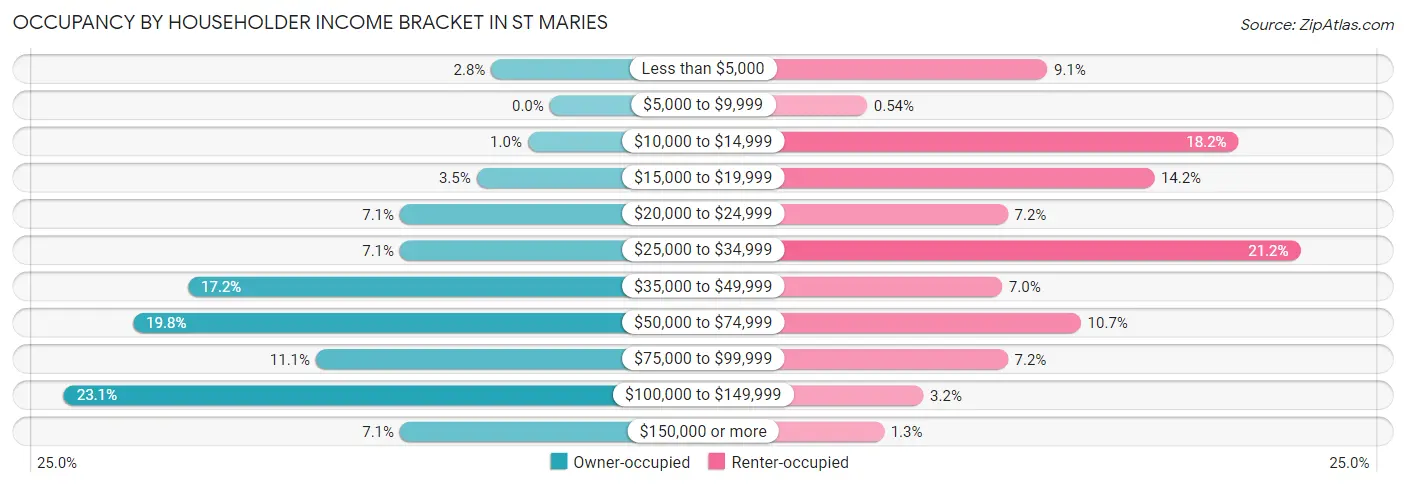
| Income Bracket | Owner-occupied | Renter-occupied |
| Less than $5,000 | 16 (2.8%) | 34 (9.1%) |
| $5,000 to $9,999 | 0 (0.0%) | 2 (0.5%) |
| $10,000 to $14,999 | 6 (1.0%) | 68 (18.2%) |
| $15,000 to $19,999 | 20 (3.5%) | 53 (14.2%) |
| $20,000 to $24,999 | 41 (7.1%) | 27 (7.2%) |
| $25,000 to $34,999 | 41 (7.1%) | 79 (21.2%) |
| $35,000 to $49,999 | 99 (17.2%) | 26 (7.0%) |
| $50,000 to $74,999 | 114 (19.8%) | 40 (10.7%) |
| $75,000 to $99,999 | 64 (11.1%) | 27 (7.2%) |
| $100,000 to $149,999 | 133 (23.1%) | 12 (3.2%) |
| $150,000 or more | 41 (7.1%) | 5 (1.3%) |
| Total | 575 (100.0%) | 373 (100.0%) |
Monthly Housing Cost Tiers in St Maries

| Monthly Cost | Owner-occupied | Renter-occupied |
| Less than $300 | 36 (6.3%) | 72 (19.3%) |
| $300 to $499 | 108 (18.8%) | 16 (4.3%) |
| $500 to $799 | 105 (18.3%) | 97 (26.0%) |
| $800 to $999 | 79 (13.7%) | 100 (26.8%) |
| $1,000 to $1,499 | 160 (27.8%) | 60 (16.1%) |
| $1,500 to $1,999 | 76 (13.2%) | 0 (0.0%) |
| $2,000 to $2,499 | 11 (1.9%) | 0 (0.0%) |
| $2,500 to $2,999 | 0 (0.0%) | 0 (0.0%) |
| $3,000 or more | 0 (0.0%) | 0 (0.0%) |
| Total | 575 (100.0%) | 373 (100.0%) |
Physical Housing Characteristics in St Maries
Housing Structures in St Maries
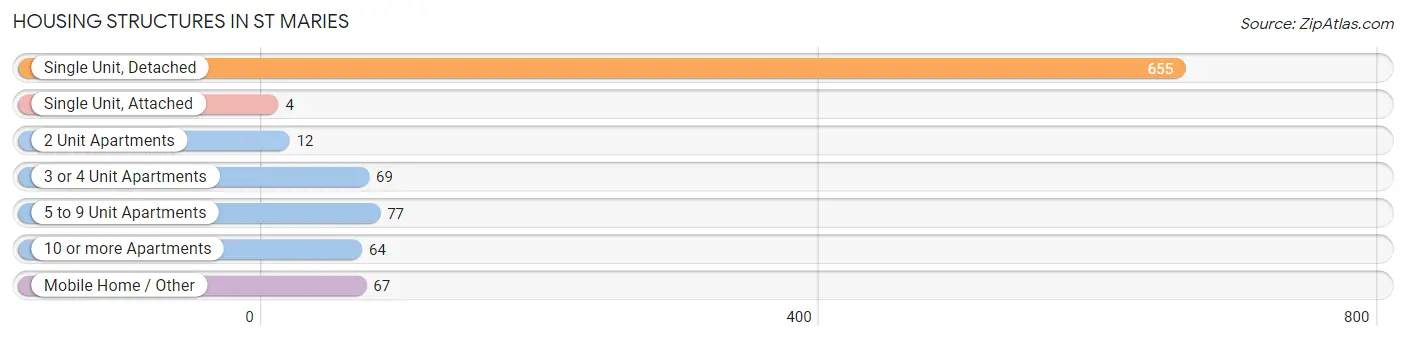
| Structure Type | # Housing Units | % Housing Units |
| Single Unit, Detached | 655 | 69.1% |
| Single Unit, Attached | 4 | 0.4% |
| 2 Unit Apartments | 12 | 1.3% |
| 3 or 4 Unit Apartments | 69 | 7.3% |
| 5 to 9 Unit Apartments | 77 | 8.1% |
| 10 or more Apartments | 64 | 6.8% |
| Mobile Home / Other | 67 | 7.1% |
| Total | 948 | 100.0% |
Housing Structures by Occupancy in St Maries
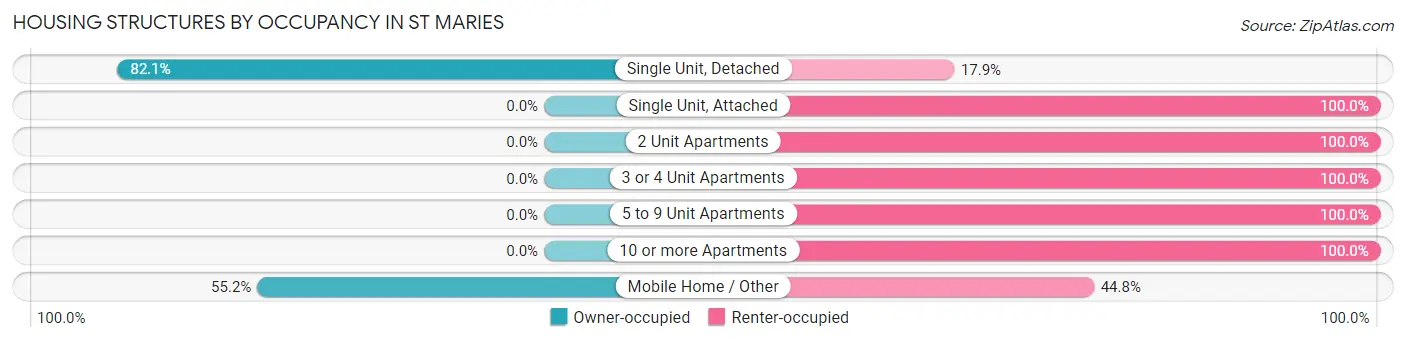
| Structure Type | Owner-occupied | Renter-occupied |
| Single Unit, Detached | 538 (82.1%) | 117 (17.9%) |
| Single Unit, Attached | 0 (0.0%) | 4 (100.0%) |
| 2 Unit Apartments | 0 (0.0%) | 12 (100.0%) |
| 3 or 4 Unit Apartments | 0 (0.0%) | 69 (100.0%) |
| 5 to 9 Unit Apartments | 0 (0.0%) | 77 (100.0%) |
| 10 or more Apartments | 0 (0.0%) | 64 (100.0%) |
| Mobile Home / Other | 37 (55.2%) | 30 (44.8%) |
| Total | 575 (60.7%) | 373 (39.4%) |
Housing Structures by Number of Rooms in St Maries
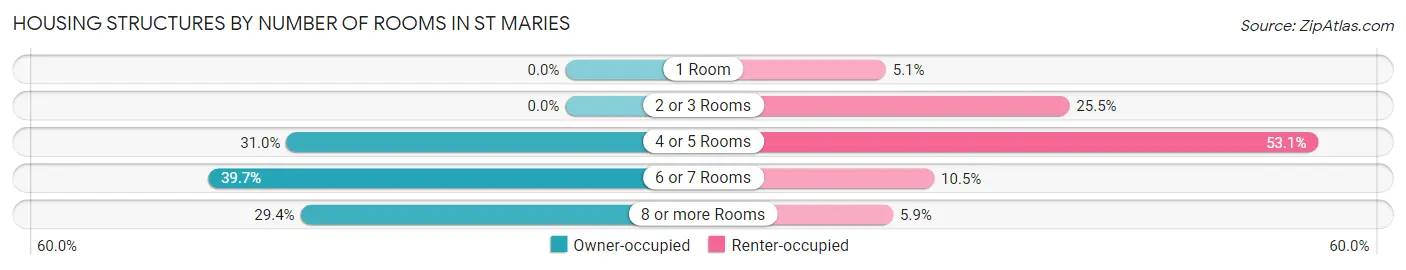
| Number of Rooms | Owner-occupied | Renter-occupied |
| 1 Room | 0 (0.0%) | 19 (5.1%) |
| 2 or 3 Rooms | 0 (0.0%) | 95 (25.5%) |
| 4 or 5 Rooms | 178 (31.0%) | 198 (53.1%) |
| 6 or 7 Rooms | 228 (39.7%) | 39 (10.5%) |
| 8 or more Rooms | 169 (29.4%) | 22 (5.9%) |
| Total | 575 (100.0%) | 373 (100.0%) |
Housing Structure by Heating Type in St Maries
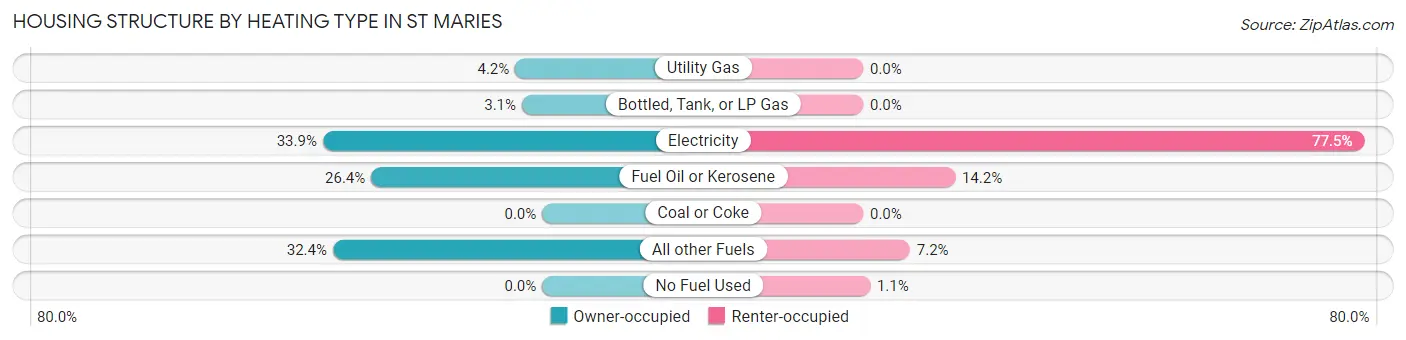
| Heating Type | Owner-occupied | Renter-occupied |
| Utility Gas | 24 (4.2%) | 0 (0.0%) |
| Bottled, Tank, or LP Gas | 18 (3.1%) | 0 (0.0%) |
| Electricity | 195 (33.9%) | 289 (77.5%) |
| Fuel Oil or Kerosene | 152 (26.4%) | 53 (14.2%) |
| Coal or Coke | 0 (0.0%) | 0 (0.0%) |
| All other Fuels | 186 (32.4%) | 27 (7.2%) |
| No Fuel Used | 0 (0.0%) | 4 (1.1%) |
| Total | 575 (100.0%) | 373 (100.0%) |
Household Vehicle Usage in St Maries
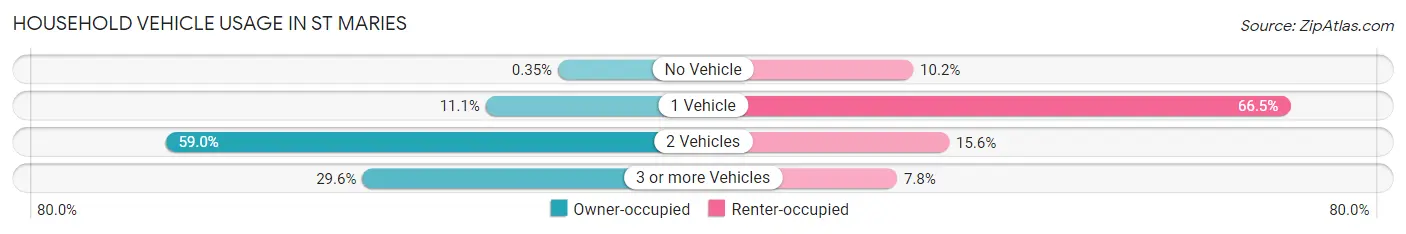
| Vehicles per Household | Owner-occupied | Renter-occupied |
| No Vehicle | 2 (0.4%) | 38 (10.2%) |
| 1 Vehicle | 64 (11.1%) | 248 (66.5%) |
| 2 Vehicles | 339 (59.0%) | 58 (15.5%) |
| 3 or more Vehicles | 170 (29.6%) | 29 (7.8%) |
| Total | 575 (100.0%) | 373 (100.0%) |
Real Estate & Mortgages in St Maries
Real Estate and Mortgage Overview in St Maries
| Characteristic | Without Mortgage | With Mortgage |
| Housing Units | 217 | 358 |
| Median Property Value | $177,600 | $193,400 |
| Median Household Income | $49,688 | $13 |
| Monthly Housing Costs | $424 | $0 |
| Real Estate Taxes | $1,520 | $8 |
Property Value by Mortgage Status in St Maries
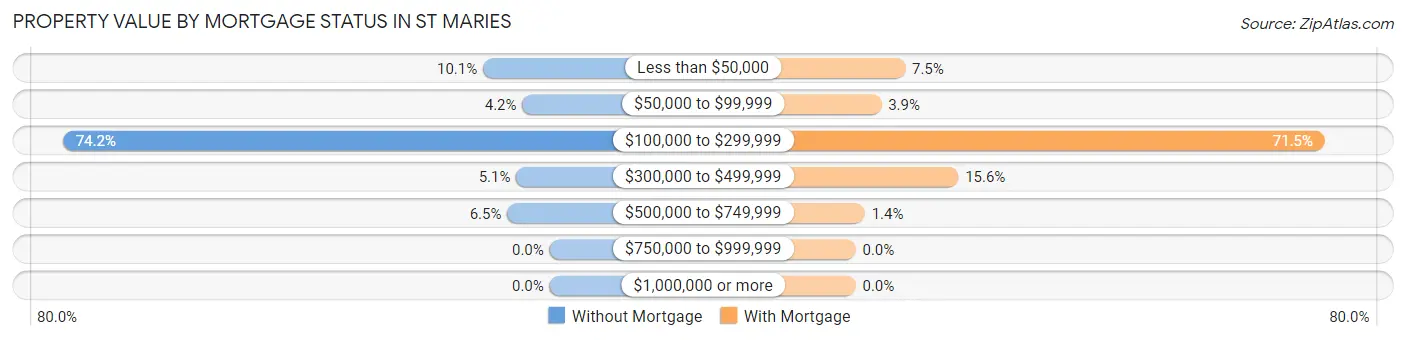
| Property Value | Without Mortgage | With Mortgage |
| Less than $50,000 | 22 (10.1%) | 27 (7.5%) |
| $50,000 to $99,999 | 9 (4.2%) | 14 (3.9%) |
| $100,000 to $299,999 | 161 (74.2%) | 256 (71.5%) |
| $300,000 to $499,999 | 11 (5.1%) | 56 (15.6%) |
| $500,000 to $749,999 | 14 (6.5%) | 5 (1.4%) |
| $750,000 to $999,999 | 0 (0.0%) | 0 (0.0%) |
| $1,000,000 or more | 0 (0.0%) | 0 (0.0%) |
| Total | 217 (100.0%) | 358 (100.0%) |
Household Income by Mortgage Status in St Maries
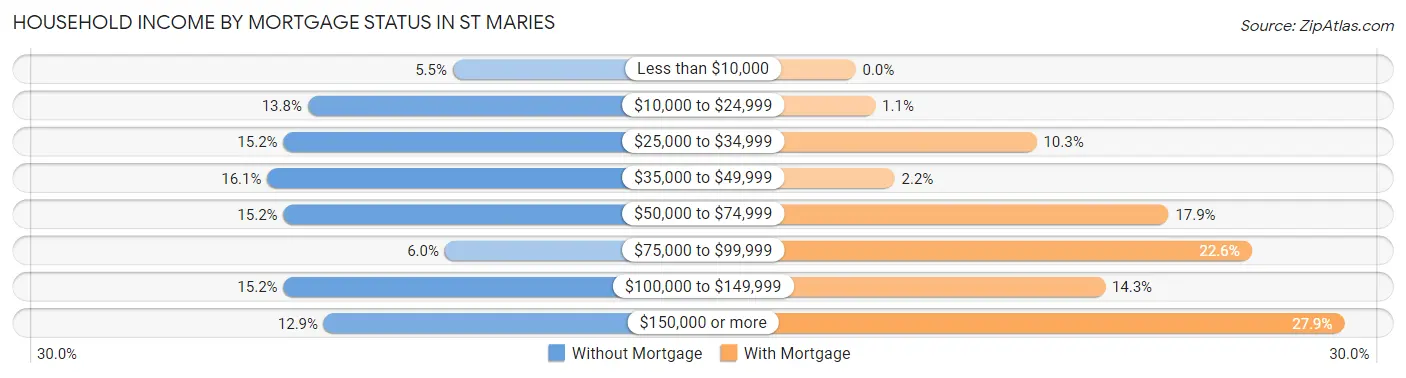
| Household Income | Without Mortgage | With Mortgage |
| Less than $10,000 | 12 (5.5%) | 0 (0.0%) |
| $10,000 to $24,999 | 30 (13.8%) | 4 (1.1%) |
| $25,000 to $34,999 | 33 (15.2%) | 37 (10.3%) |
| $35,000 to $49,999 | 35 (16.1%) | 8 (2.2%) |
| $50,000 to $74,999 | 33 (15.2%) | 64 (17.9%) |
| $75,000 to $99,999 | 13 (6.0%) | 81 (22.6%) |
| $100,000 to $149,999 | 33 (15.2%) | 51 (14.2%) |
| $150,000 or more | 28 (12.9%) | 100 (27.9%) |
| Total | 217 (100.0%) | 358 (100.0%) |
Property Value to Household Income Ratio in St Maries
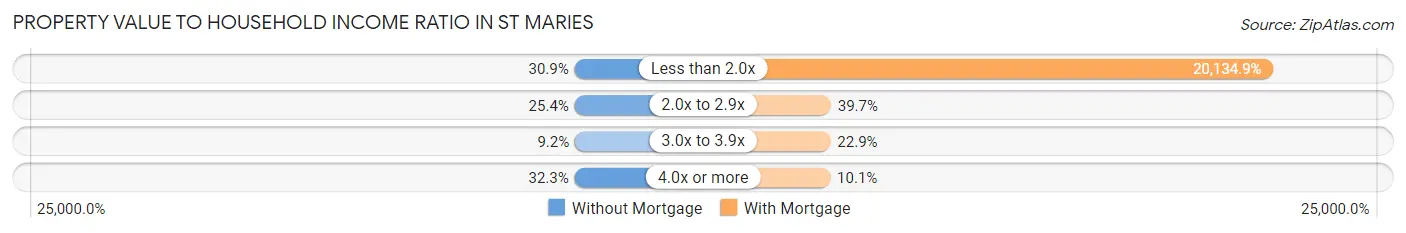
| Value-to-Income Ratio | Without Mortgage | With Mortgage |
| Less than 2.0x | 67 (30.9%) | 72,083 (20,134.9%) |
| 2.0x to 2.9x | 55 (25.4%) | 142 (39.7%) |
| 3.0x to 3.9x | 20 (9.2%) | 82 (22.9%) |
| 4.0x or more | 70 (32.3%) | 36 (10.1%) |
| Total | 217 (100.0%) | 358 (100.0%) |
Real Estate Taxes by Mortgage Status in St Maries
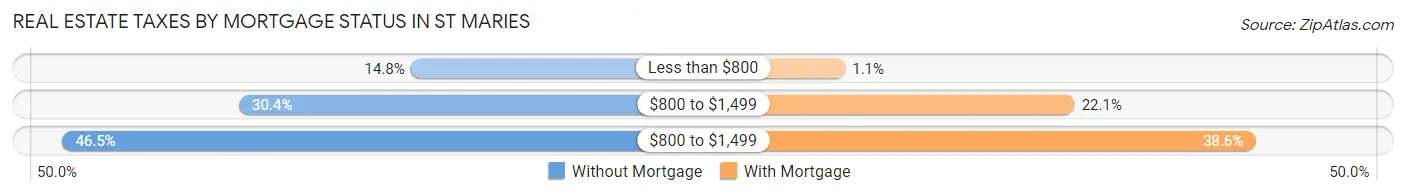
| Property Taxes | Without Mortgage | With Mortgage |
| Less than $800 | 32 (14.7%) | 4 (1.1%) |
| $800 to $1,499 | 66 (30.4%) | 79 (22.1%) |
| $800 to $1,499 | 101 (46.5%) | 138 (38.6%) |
| Total | 217 (100.0%) | 358 (100.0%) |
Health & Disability in St Maries
Health Insurance Coverage by Age in St Maries
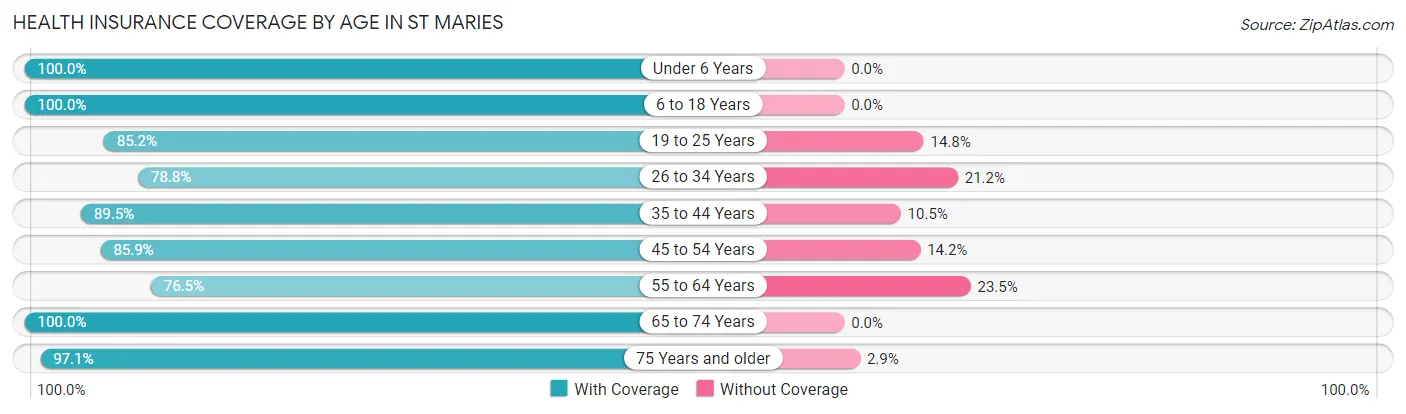
| Age Bracket | With Coverage | Without Coverage |
| Under 6 Years | 150 (100.0%) | 0 (0.0%) |
| 6 to 18 Years | 381 (100.0%) | 0 (0.0%) |
| 19 to 25 Years | 248 (85.2%) | 43 (14.8%) |
| 26 to 34 Years | 149 (78.8%) | 40 (21.2%) |
| 35 to 44 Years | 230 (89.5%) | 27 (10.5%) |
| 45 to 54 Years | 273 (85.9%) | 45 (14.1%) |
| 55 to 64 Years | 289 (76.5%) | 89 (23.5%) |
| 65 to 74 Years | 168 (100.0%) | 0 (0.0%) |
| 75 Years and older | 166 (97.1%) | 5 (2.9%) |
| Total | 2,054 (89.2%) | 249 (10.8%) |
Health Insurance Coverage by Citizenship Status in St Maries
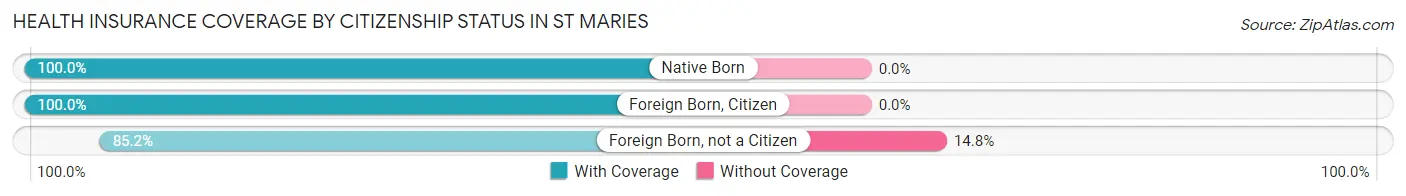
| Citizenship Status | With Coverage | Without Coverage |
| Native Born | 150 (100.0%) | 0 (0.0%) |
| Foreign Born, Citizen | 381 (100.0%) | 0 (0.0%) |
| Foreign Born, not a Citizen | 248 (85.2%) | 43 (14.8%) |
Health Insurance Coverage by Household Income in St Maries
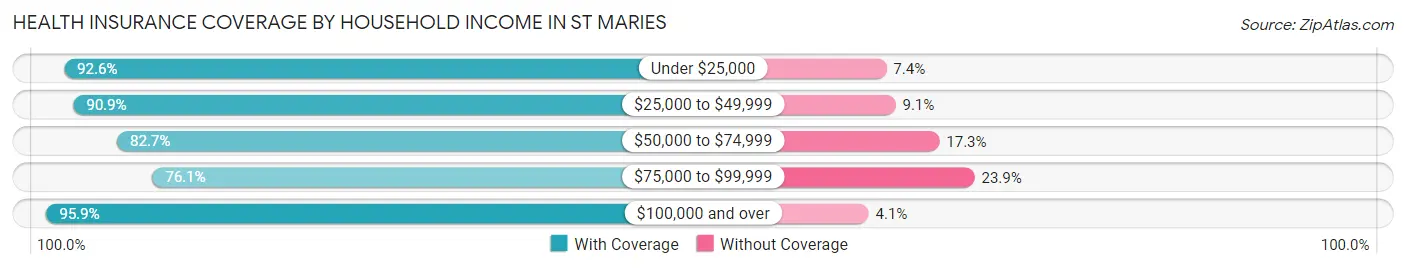
| Household Income | With Coverage | Without Coverage |
| Under $25,000 | 412 (92.6%) | 33 (7.4%) |
| $25,000 to $49,999 | 478 (90.9%) | 48 (9.1%) |
| $50,000 to $74,999 | 305 (82.7%) | 64 (17.3%) |
| $75,000 to $99,999 | 248 (76.1%) | 78 (23.9%) |
| $100,000 and over | 611 (95.9%) | 26 (4.1%) |
Public vs Private Health Insurance Coverage by Age in St Maries
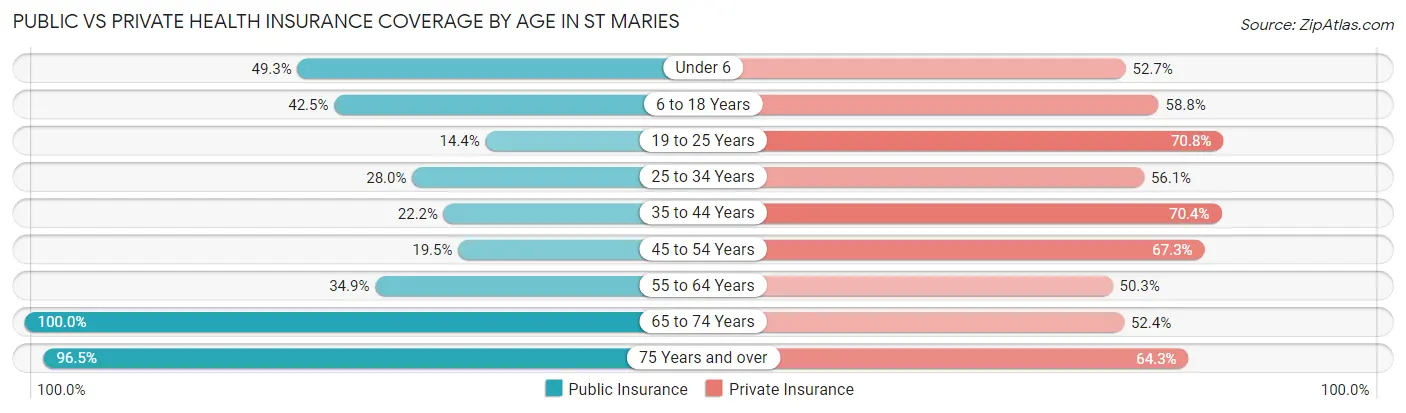
| Age Bracket | Public Insurance | Private Insurance |
| Under 6 | 74 (49.3%) | 79 (52.7%) |
| 6 to 18 Years | 162 (42.5%) | 224 (58.8%) |
| 19 to 25 Years | 42 (14.4%) | 206 (70.8%) |
| 25 to 34 Years | 53 (28.0%) | 106 (56.1%) |
| 35 to 44 Years | 57 (22.2%) | 181 (70.4%) |
| 45 to 54 Years | 62 (19.5%) | 214 (67.3%) |
| 55 to 64 Years | 132 (34.9%) | 190 (50.3%) |
| 65 to 74 Years | 168 (100.0%) | 88 (52.4%) |
| 75 Years and over | 165 (96.5%) | 110 (64.3%) |
| Total | 915 (39.7%) | 1,398 (60.7%) |
Disability Status by Sex by Age in St Maries
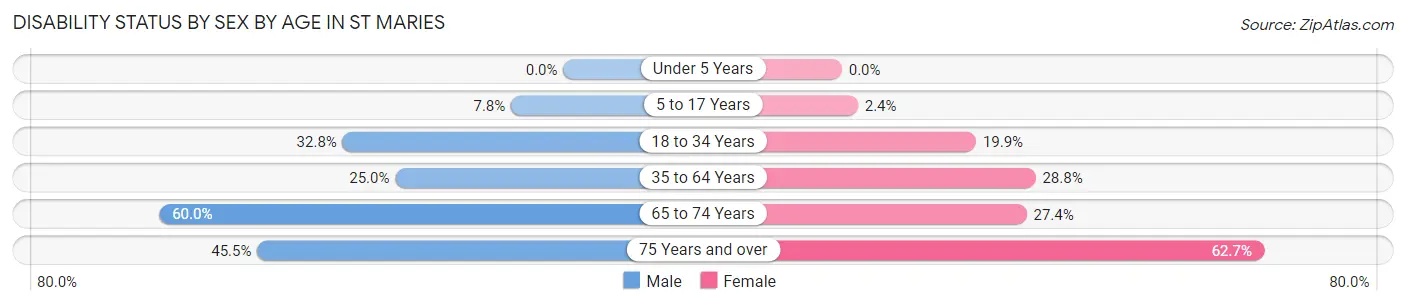
| Age Bracket | Male | Female |
| Under 5 Years | 0 (0.0%) | 0 (0.0%) |
| 5 to 17 Years | 18 (7.8%) | 4 (2.4%) |
| 18 to 34 Years | 77 (32.8%) | 49 (19.9%) |
| 35 to 64 Years | 125 (24.9%) | 130 (28.8%) |
| 65 to 74 Years | 33 (60.0%) | 31 (27.4%) |
| 75 Years and over | 40 (45.5%) | 52 (62.6%) |
Disability Class by Sex by Age in St Maries
Disability Class: Hearing Difficulty
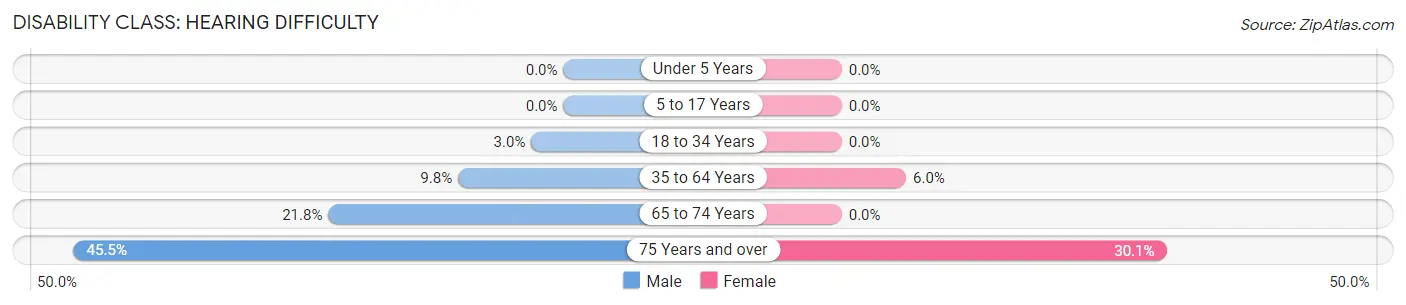
| Age Bracket | Male | Female |
| Under 5 Years | 0 (0.0%) | 0 (0.0%) |
| 5 to 17 Years | 0 (0.0%) | 0 (0.0%) |
| 18 to 34 Years | 7 (3.0%) | 0 (0.0%) |
| 35 to 64 Years | 49 (9.8%) | 27 (6.0%) |
| 65 to 74 Years | 12 (21.8%) | 0 (0.0%) |
| 75 Years and over | 40 (45.5%) | 25 (30.1%) |
Disability Class: Vision Difficulty
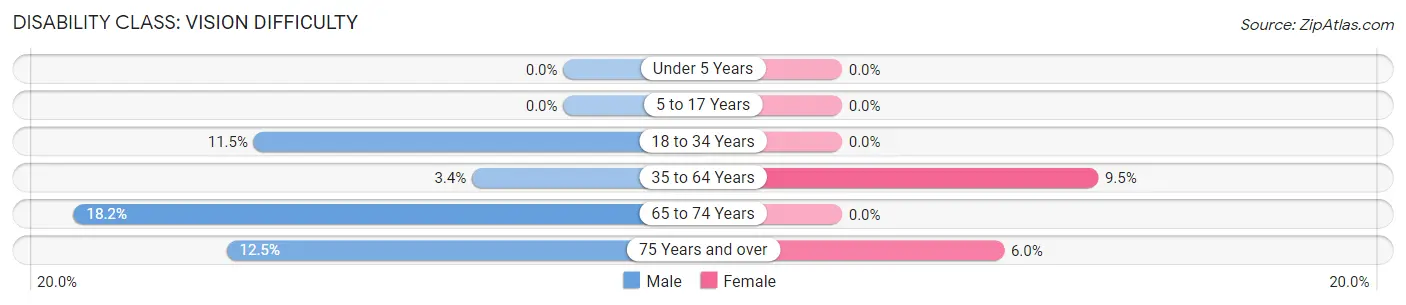
| Age Bracket | Male | Female |
| Under 5 Years | 0 (0.0%) | 0 (0.0%) |
| 5 to 17 Years | 0 (0.0%) | 0 (0.0%) |
| 18 to 34 Years | 27 (11.5%) | 0 (0.0%) |
| 35 to 64 Years | 17 (3.4%) | 43 (9.5%) |
| 65 to 74 Years | 10 (18.2%) | 0 (0.0%) |
| 75 Years and over | 11 (12.5%) | 5 (6.0%) |
Disability Class: Cognitive Difficulty
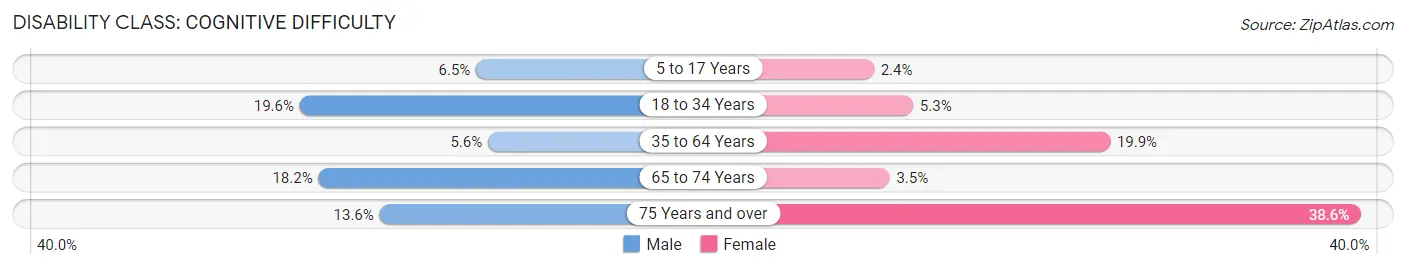
| Age Bracket | Male | Female |
| 5 to 17 Years | 15 (6.5%) | 4 (2.4%) |
| 18 to 34 Years | 46 (19.6%) | 13 (5.3%) |
| 35 to 64 Years | 28 (5.6%) | 90 (19.9%) |
| 65 to 74 Years | 10 (18.2%) | 4 (3.5%) |
| 75 Years and over | 12 (13.6%) | 32 (38.6%) |
Disability Class: Ambulatory Difficulty
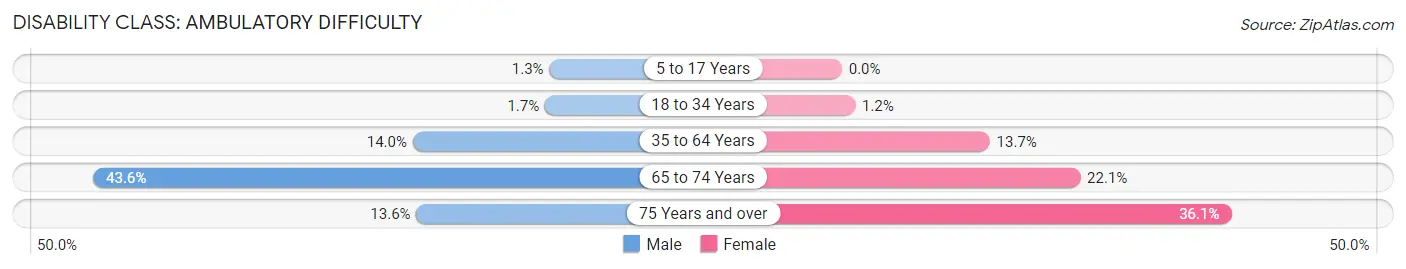
| Age Bracket | Male | Female |
| 5 to 17 Years | 3 (1.3%) | 0 (0.0%) |
| 18 to 34 Years | 4 (1.7%) | 3 (1.2%) |
| 35 to 64 Years | 70 (14.0%) | 62 (13.7%) |
| 65 to 74 Years | 24 (43.6%) | 25 (22.1%) |
| 75 Years and over | 12 (13.6%) | 30 (36.1%) |
Disability Class: Self-Care Difficulty
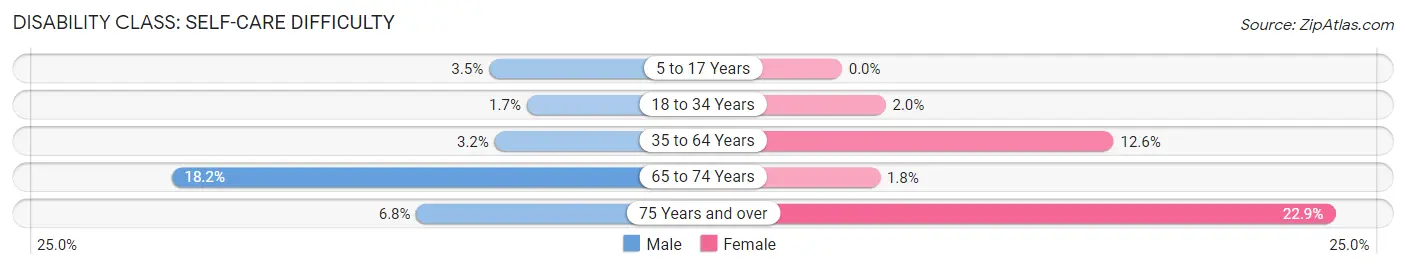
| Age Bracket | Male | Female |
| 5 to 17 Years | 8 (3.5%) | 0 (0.0%) |
| 18 to 34 Years | 4 (1.7%) | 5 (2.0%) |
| 35 to 64 Years | 16 (3.2%) | 57 (12.6%) |
| 65 to 74 Years | 10 (18.2%) | 2 (1.8%) |
| 75 Years and over | 6 (6.8%) | 19 (22.9%) |
Technology Access in St Maries
Computing Device Access in St Maries
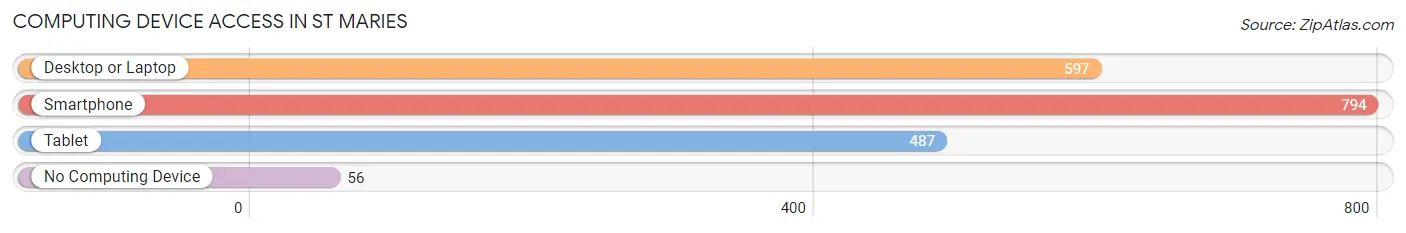
| Device Type | # Households | % Households |
| Desktop or Laptop | 597 | 63.0% |
| Smartphone | 794 | 83.8% |
| Tablet | 487 | 51.4% |
| No Computing Device | 56 | 5.9% |
| Total | 948 | 100.0% |
Internet Access in St Maries
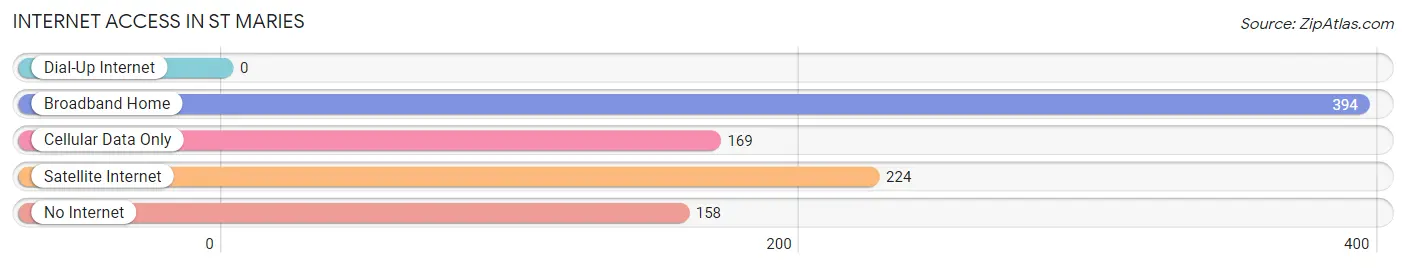
| Internet Type | # Households | % Households |
| Dial-Up Internet | 0 | 0.0% |
| Broadband Home | 394 | 41.6% |
| Cellular Data Only | 169 | 17.8% |
| Satellite Internet | 224 | 23.6% |
| No Internet | 158 | 16.7% |
| Total | 948 | 100.0% |
St Maries Summary
St. Maries, Idaho is a small city located in Benewah County in the northern part of the state. It is situated on the St. Joe River, which is a tributary of the Coeur d'Alene River. The city is located about 40 miles east of Coeur d'Alene and about 70 miles north of Spokane, Washington. The population of St. Maries was 2,521 at the 2010 census.
History
The area around St. Maries has been inhabited by Native Americans for thousands of years. The Coeur d'Alene Tribe has lived in the area since the late 1700s. The first European settlers arrived in the area in the late 1800s. The city was founded in 1887 and was named after the St. Maries River, which was named after the Catholic mission of St. Mary's.
The city was originally a logging town and was home to several sawmills. The logging industry was the main source of employment for the city until the mid-1900s. In the 1950s, the city began to diversify its economy and began to attract new businesses.
Geography
St. Maries is located in the northern part of Idaho, in Benewah County. The city is situated on the St. Joe River, which is a tributary of the Coeur d'Alene River. The city is located about 40 miles east of Coeur d'Alene and about 70 miles north of Spokane, Washington.
The city has a total area of 2.2 square miles, all of which is land. The city is located in a valley surrounded by mountains. The highest point in the city is 2,845 feet above sea level.
Economy
The economy of St. Maries is largely based on the timber industry. The city is home to several sawmills and lumber companies. The city also has a growing tourism industry, with several outdoor recreation opportunities in the area.
The city also has a growing manufacturing sector, with several companies producing products such as furniture, wood products, and metal products. The city also has a growing service sector, with several businesses providing services such as banking, insurance, and healthcare.
Demographics
As of the 2010 census, the population of St. Maries was 2,521. The racial makeup of the city was 95.2% White, 0.7% Native American, 0.3% Asian, 0.2% African American, 0.1% Pacific Islander, and 3.5% from other races. The median household income was $35,938 and the median family income was $41,944.
The city has a large number of retirees, with about 25% of the population over the age of 65. The city also has a large number of families, with about 33% of the population under the age of 18. The city has a low unemployment rate, with only about 4% of the population unemployed.
Common Questions
What is Per Capita Income in St Maries?
Per Capita income in St Maries is $27,283.
What is the Median Family Income in St Maries?
Median Family Income in St Maries is $70,667.
What is the Median Household income in St Maries?
Median Household Income in St Maries is $47,564.
What is Income or Wage Gap in St Maries?
Income or Wage Gap in St Maries is 47.8%.
Women in St Maries earn 52.2 cents for every dollar earned by a man.
What is Inequality or Gini Index in St Maries?
Inequality or Gini Index in St Maries is 0.46.
What is the Total Population of St Maries?
Total Population of St Maries is 2,410.
What is the Total Male Population of St Maries?
Total Male Population of St Maries is 1,196.
What is the Total Female Population of St Maries?
Total Female Population of St Maries is 1,214.
What is the Ratio of Males per 100 Females in St Maries?
There are 98.52 Males per 100 Females in St Maries.
What is the Ratio of Females per 100 Males in St Maries?
There are 101.51 Females per 100 Males in St Maries.
What is the Median Population Age in St Maries?
Median Population Age in St Maries is 40.0 Years.
What is the Average Family Size in St Maries
Average Family Size in St Maries is 3.2 People.
What is the Average Household Size in St Maries
Average Household Size in St Maries is 2.4 People.
How Large is the Labor Force in St Maries?
There are 1,034 People in the Labor Forcein in St Maries.
What is the Percentage of People in the Labor Force in St Maries?
53.9% of People are in the Labor Force in St Maries.
What is the Unemployment Rate in St Maries?
Unemployment Rate in St Maries is 5.3%.