Arbon Valley, ID Map & Demographics
Arbon Valley Map
Arbon Valley Overview
$19,653
PER CAPITA INCOME
$60,625
AVG FAMILY INCOME
$57,841
AVG HOUSEHOLD INCOME
0.44
INEQUALITY / GINI INDEX
784
TOTAL POPULATION
385
MALE POPULATION
399
FEMALE POPULATION
96.49
MALES / 100 FEMALES
103.64
FEMALES / 100 MALES
42.9
MEDIAN AGE
4.6
AVG FAMILY SIZE
3.3
AVG HOUSEHOLD SIZE
362
LABOR FORCE [ PEOPLE ]
59.5%
PERCENT IN LABOR FORCE
12.4%
UNEMPLOYMENT RATE
Income in Arbon Valley
Income Overview in Arbon Valley
Per Capita Income in Arbon Valley is $19,653, while median incomes of families and households are $60,625 and $57,841 respectively.
| Characteristic | Number | Measure |
| Per Capita Income | 784 | $19,653 |
| Median Family Income | 127 | $60,625 |
| Mean Family Income | 127 | $76,372 |
| Median Household Income | 237 | $57,841 |
| Mean Household Income | 237 | $62,094 |
| Income Deficit | 127 | $0 |
| Wage / Income Gap (%) | 784 | 0.00% |
| Wage / Income Gap ($) | 784 | 100.00¢ per $1 |
| Gini / Inequality Index | 784 | 0.44 |
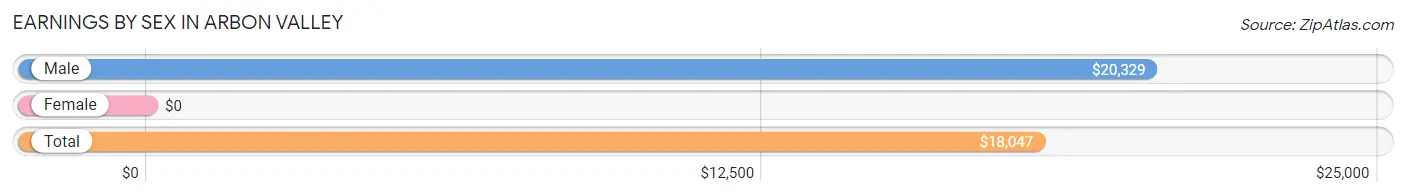
Earnings by Sex in Arbon Valley
| Sex | Number | Average Earnings |
| Male | 213 (55.9%) | $20,329 |
| Female | 168 (44.1%) | $0 |
| Total | 381 (100.0%) | $18,047 |
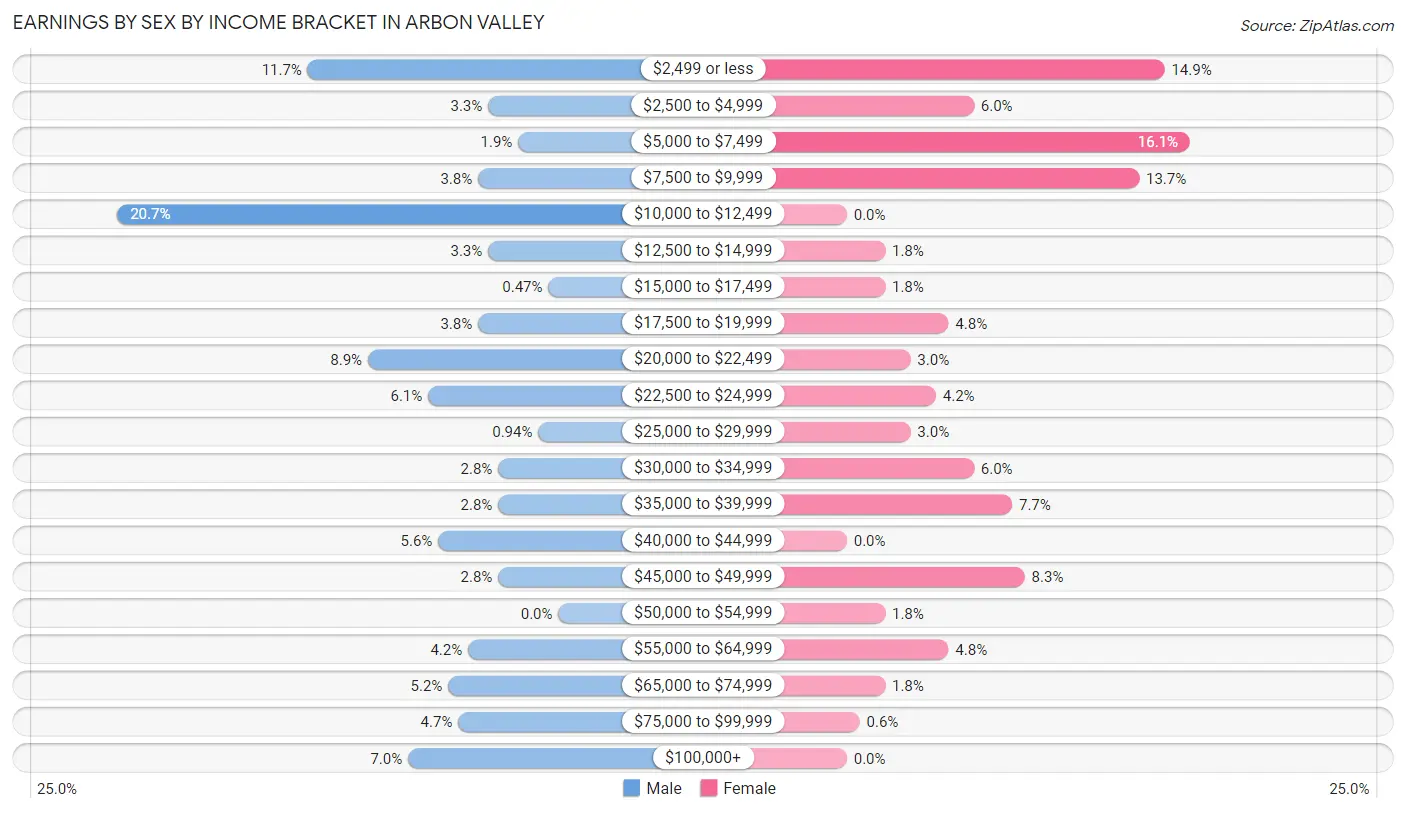
Earnings by Sex by Income Bracket in Arbon Valley
The most common earnings brackets in Arbon Valley are $10,000 to $12,499 for men (44 | 20.7%) and $5,000 to $7,499 for women (27 | 16.1%).
| Income | Male | Female |
| $2,499 or less | 25 (11.7%) | 25 (14.9%) |
| $2,500 to $4,999 | 7 (3.3%) | 10 (5.9%) |
| $5,000 to $7,499 | 4 (1.9%) | 27 (16.1%) |
| $7,500 to $9,999 | 8 (3.8%) | 23 (13.7%) |
| $10,000 to $12,499 | 44 (20.7%) | 0 (0.0%) |
| $12,500 to $14,999 | 7 (3.3%) | 3 (1.8%) |
| $15,000 to $17,499 | 1 (0.5%) | 3 (1.8%) |
| $17,500 to $19,999 | 8 (3.8%) | 8 (4.8%) |
| $20,000 to $22,499 | 19 (8.9%) | 5 (3.0%) |
| $22,500 to $24,999 | 13 (6.1%) | 7 (4.2%) |
| $25,000 to $29,999 | 2 (0.9%) | 5 (3.0%) |
| $30,000 to $34,999 | 6 (2.8%) | 10 (5.9%) |
| $35,000 to $39,999 | 6 (2.8%) | 13 (7.7%) |
| $40,000 to $44,999 | 12 (5.6%) | 0 (0.0%) |
| $45,000 to $49,999 | 6 (2.8%) | 14 (8.3%) |
| $50,000 to $54,999 | 0 (0.0%) | 3 (1.8%) |
| $55,000 to $64,999 | 9 (4.2%) | 8 (4.8%) |
| $65,000 to $74,999 | 11 (5.2%) | 3 (1.8%) |
| $75,000 to $99,999 | 10 (4.7%) | 1 (0.6%) |
| $100,000+ | 15 (7.0%) | 0 (0.0%) |
| Total | 213 (100.0%) | 168 (100.0%) |
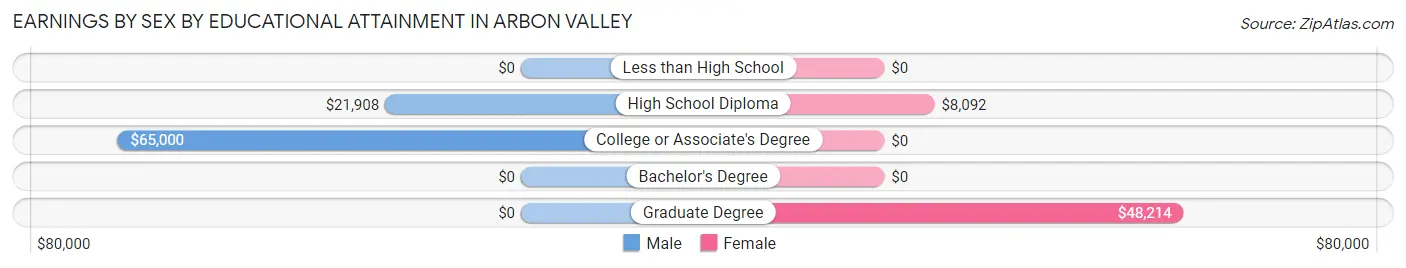
Earnings by Sex by Educational Attainment in Arbon Valley
Average earnings in Arbon Valley are $24,038 for men and $16,667 for women, a difference of 30.7%. Men with an educational attainment of college or associate's degree enjoy the highest average annual earnings of $65,000, while those with high school diploma education earn the least with $21,908. Women with an educational attainment of graduate degree earn the most with the average annual earnings of $48,214, while those with high school diploma education have the smallest earnings of $8,092.
| Educational Attainment | Male Income | Female Income |
| Less than High School | - | - |
| High School Diploma | $21,908 | $8,092 |
| College or Associate's Degree | $65,000 | $0 |
| Bachelor's Degree | - | - |
| Graduate Degree | - | - |
| Total | $24,038 | $16,667 |
Family Income in Arbon Valley
Family Income Brackets in Arbon Valley
According to the Arbon Valley family income data, there are 31 families falling into the $50,000 to $74,999 income range, which is the most common income bracket and makes up 24.4% of all families.
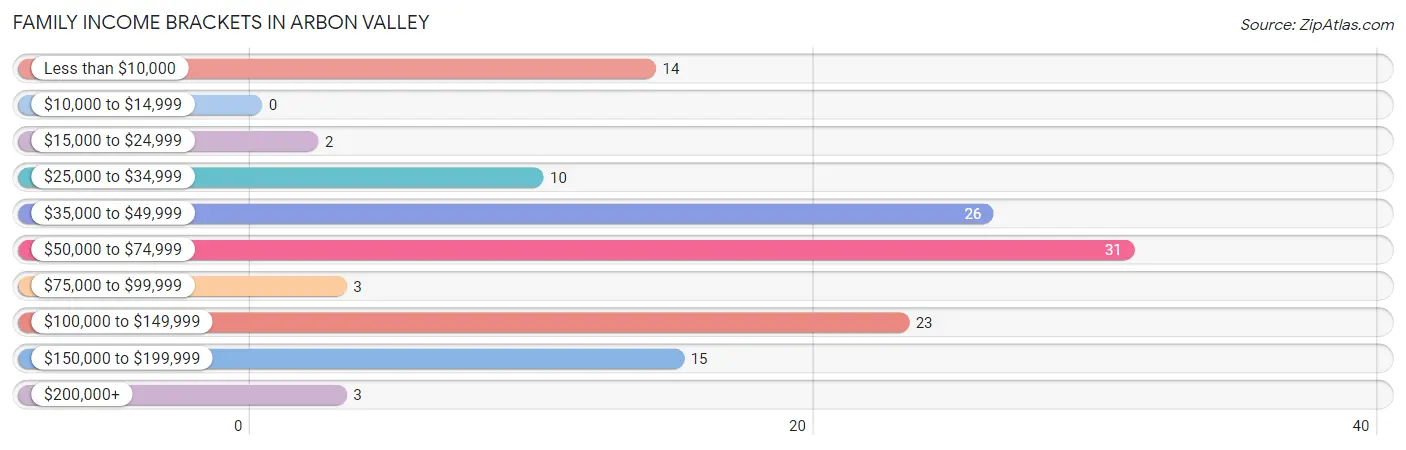
| Income Bracket | # Families | % Families |
| Less than $10,000 | 14 | 11.0% |
| $10,000 to $14,999 | 0 | 0.0% |
| $15,000 to $24,999 | 2 | 1.6% |
| $25,000 to $34,999 | 10 | 7.9% |
| $35,000 to $49,999 | 26 | 20.5% |
| $50,000 to $74,999 | 31 | 24.4% |
| $75,000 to $99,999 | 3 | 2.4% |
| $100,000 to $149,999 | 23 | 18.1% |
| $150,000 to $199,999 | 15 | 11.8% |
| $200,000+ | 3 | 2.4% |
Family Income by Famaliy Size in Arbon Valley
3-person families (10 | 7.9%) account for the highest median family income in Arbon Valley with $77,500 per family, while 3-person families (10 | 7.9%) have the highest median income of $25,833 per family member.
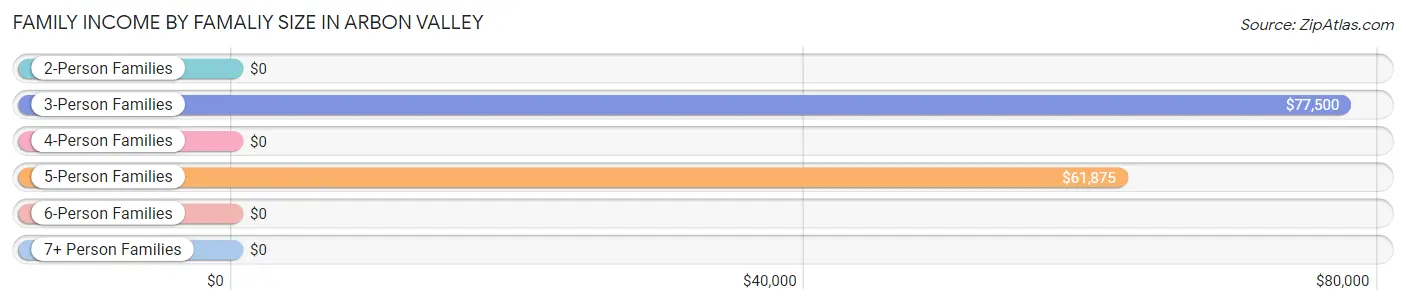
| Income Bracket | # Families | Median Income |
| 2-Person Families | 53 (41.7%) | $0 |
| 3-Person Families | 10 (7.9%) | $77,500 |
| 4-Person Families | 29 (22.8%) | $0 |
| 5-Person Families | 15 (11.8%) | $61,875 |
| 6-Person Families | 10 (7.9%) | $0 |
| 7+ Person Families | 10 (7.9%) | $0 |
| Total | 127 (100.0%) | $60,625 |
Family Income by Number of Earners in Arbon Valley
The median family income in Arbon Valley is $60,625, with families comprising 2 earners (34) having the highest median family income of $134,375, while families with no earners (33) have the lowest median family income of $37,639, accounting for 26.8% and 26.0% of families, respectively.
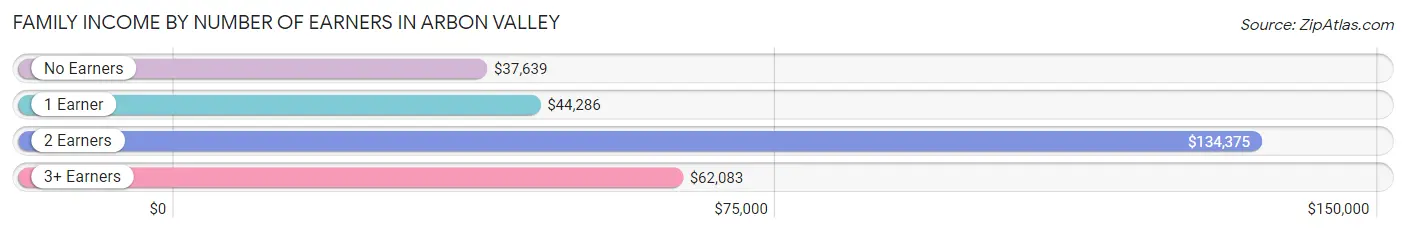
| Number of Earners | # Families | Median Income |
| No Earners | 33 (26.0%) | $37,639 |
| 1 Earner | 32 (25.2%) | $44,286 |
| 2 Earners | 34 (26.8%) | $134,375 |
| 3+ Earners | 28 (22.1%) | $62,083 |
| Total | 127 (100.0%) | $60,625 |
Household Income in Arbon Valley
Household Income Brackets in Arbon Valley
With 60 households falling in the category, the $50,000 to $74,999 income range is the most frequent in Arbon Valley, accounting for 25.3% of all households. In contrast, only 3 households (1.3%) fall into the $15,000 to $24,999 income bracket, making it the least populous group.
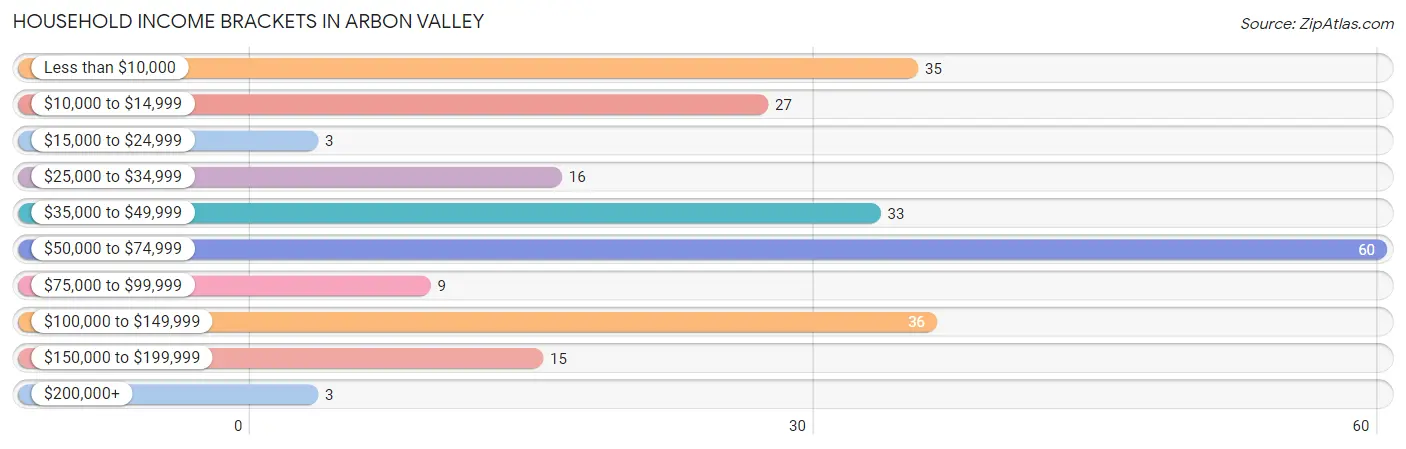
| Income Bracket | # Households | % Households |
| Less than $10,000 | 35 | 14.8% |
| $10,000 to $14,999 | 27 | 11.4% |
| $15,000 to $24,999 | 3 | 1.3% |
| $25,000 to $34,999 | 16 | 6.8% |
| $35,000 to $49,999 | 33 | 13.9% |
| $50,000 to $74,999 | 60 | 25.3% |
| $75,000 to $99,999 | 9 | 3.8% |
| $100,000 to $149,999 | 36 | 15.2% |
| $150,000 to $199,999 | 15 | 6.3% |
| $200,000+ | 3 | 1.3% |
Household Income by Householder Age in Arbon Valley
The median household income in Arbon Valley is $57,841, with the highest median household income of $68,167 found in the 25 to 44 years age bracket for the primary householder. A total of 52 households (21.9%) fall into this category. Meanwhile, the 15 to 24 years age bracket for the primary householder has the lowest median household income of $0, with 18 households (7.6%) in this group.
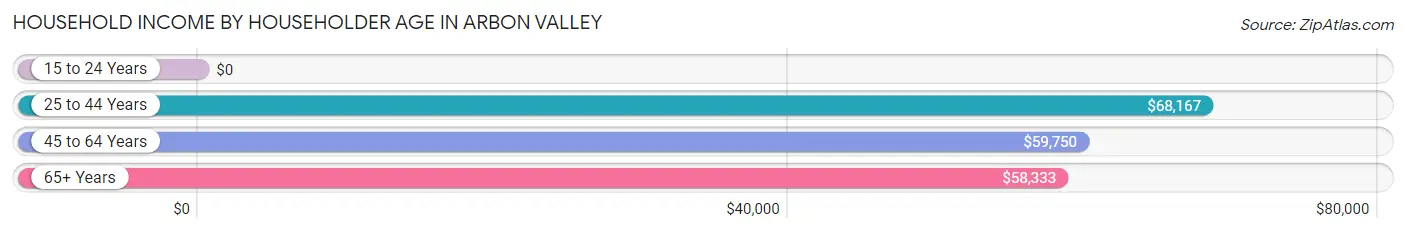
| Income Bracket | # Households | Median Income |
| 15 to 24 Years | 18 (7.6%) | $0 |
| 25 to 44 Years | 52 (21.9%) | $68,167 |
| 45 to 64 Years | 93 (39.2%) | $59,750 |
| 65+ Years | 74 (31.2%) | $58,333 |
| Total | 237 (100.0%) | $57,841 |
Poverty in Arbon Valley
Income Below Poverty by Sex and Age in Arbon Valley
With 24.4% poverty level for males and 23.1% for females among the residents of Arbon Valley, 15 year old males and 55 to 64 year old females are the most vulnerable to poverty, with 24 males (85.7%) and 36 females (47.4%) in their respective age groups living below the poverty level.
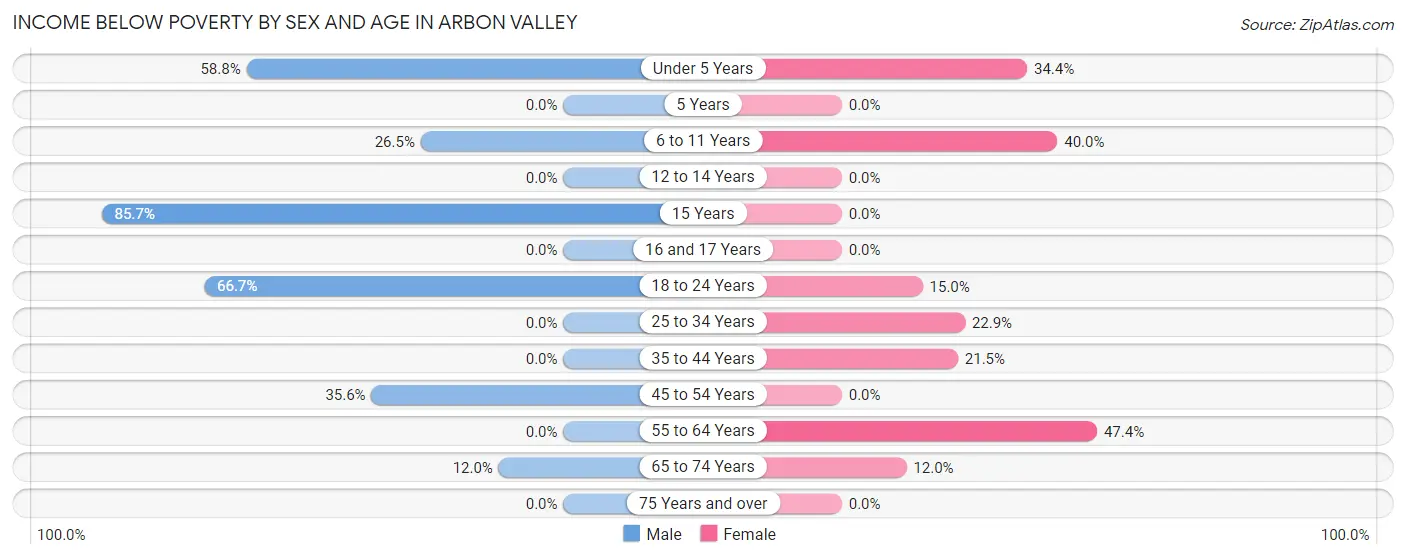
| Age Bracket | Male | Female |
| Under 5 Years | 10 (58.8%) | 11 (34.4%) |
| 5 Years | 0 (0.0%) | 0 (0.0%) |
| 6 to 11 Years | 9 (26.5%) | 14 (40.0%) |
| 12 to 14 Years | 0 (0.0%) | 0 (0.0%) |
| 15 Years | 24 (85.7%) | 0 (0.0%) |
| 16 and 17 Years | 0 (0.0%) | 0 (0.0%) |
| 18 to 24 Years | 22 (66.7%) | 3 (15.0%) |
| 25 to 34 Years | 0 (0.0%) | 8 (22.9%) |
| 35 to 44 Years | 0 (0.0%) | 14 (21.5%) |
| 45 to 54 Years | 26 (35.6%) | 0 (0.0%) |
| 55 to 64 Years | 0 (0.0%) | 36 (47.4%) |
| 65 to 74 Years | 3 (12.0%) | 6 (12.0%) |
| 75 Years and over | 0 (0.0%) | 0 (0.0%) |
| Total | 94 (24.4%) | 92 (23.1%) |
Income Above Poverty by Sex and Age in Arbon Valley
According to the poverty statistics in Arbon Valley, males aged 12 to 14 years and females aged 12 to 14 years are the age groups that are most secure financially, with 100.0% of males and 100.0% of females in these age groups living above the poverty line.
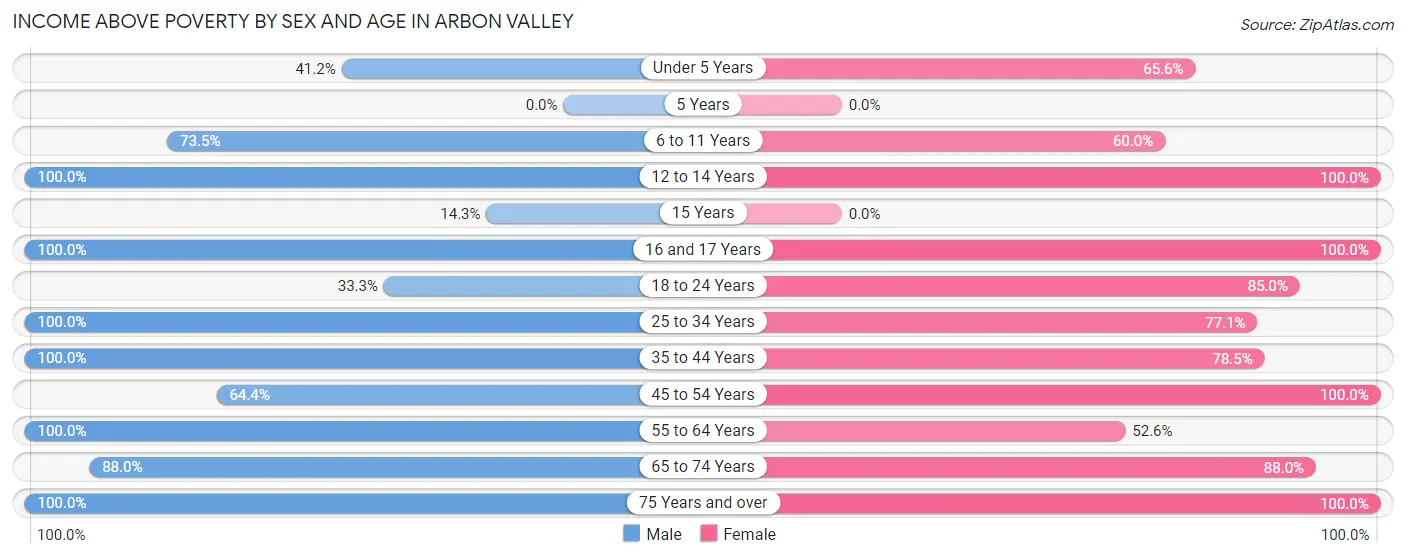
| Age Bracket | Male | Female |
| Under 5 Years | 7 (41.2%) | 21 (65.6%) |
| 5 Years | 0 (0.0%) | 0 (0.0%) |
| 6 to 11 Years | 25 (73.5%) | 21 (60.0%) |
| 12 to 14 Years | 14 (100.0%) | 16 (100.0%) |
| 15 Years | 4 (14.3%) | 0 (0.0%) |
| 16 and 17 Years | 35 (100.0%) | 5 (100.0%) |
| 18 to 24 Years | 11 (33.3%) | 17 (85.0%) |
| 25 to 34 Years | 6 (100.0%) | 27 (77.1%) |
| 35 to 44 Years | 45 (100.0%) | 51 (78.5%) |
| 45 to 54 Years | 47 (64.4%) | 30 (100.0%) |
| 55 to 64 Years | 60 (100.0%) | 40 (52.6%) |
| 65 to 74 Years | 22 (88.0%) | 44 (88.0%) |
| 75 Years and over | 15 (100.0%) | 35 (100.0%) |
| Total | 291 (75.6%) | 307 (76.9%) |
Income Below Poverty Among Married-Couple Families in Arbon Valley
The poverty statistics for married-couple families in Arbon Valley show that 5.6% or 6 of the total 108 families live below the poverty line. Families with no children have the highest poverty rate of 10.3%, comprising of 6 families. On the other hand, families with 1 or 2 children have the lowest poverty rate of 0.0%, which includes 0 families.
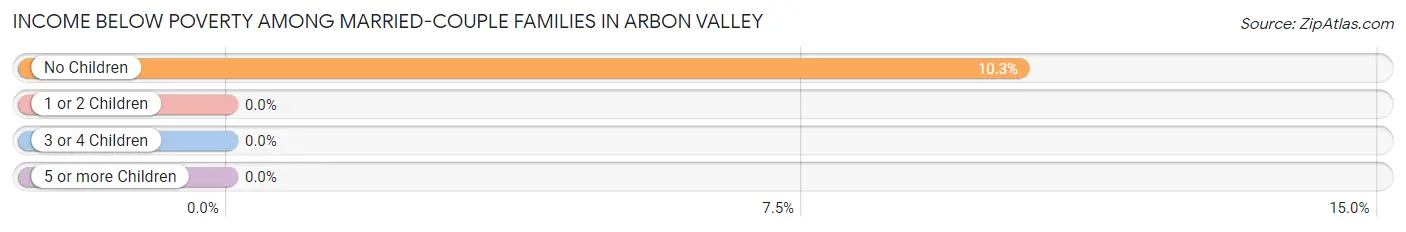
| Children | Above Poverty | Below Poverty |
| No Children | 52 (89.7%) | 6 (10.3%) |
| 1 or 2 Children | 44 (100.0%) | 0 (0.0%) |
| 3 or 4 Children | 6 (100.0%) | 0 (0.0%) |
| 5 or more Children | 0 (0.0%) | 0 (0.0%) |
| Total | 102 (94.4%) | 6 (5.6%) |
Income Below Poverty Among Single-Parent Households in Arbon Valley
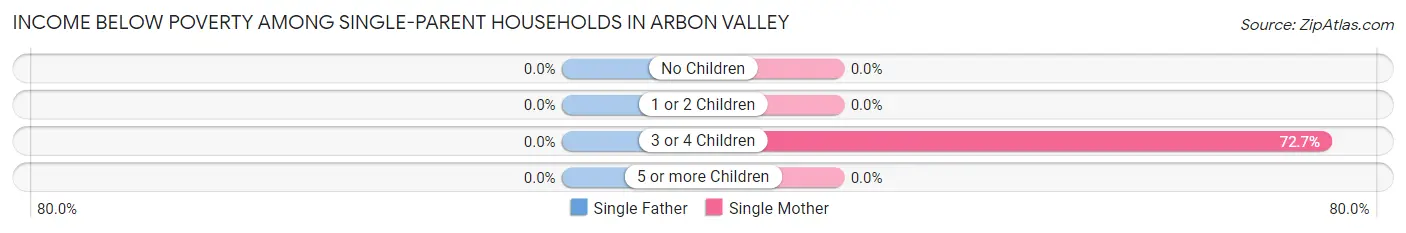
| Children | Single Father | Single Mother |
| No Children | 0 (0.0%) | 0 (0.0%) |
| 1 or 2 Children | 0 (0.0%) | 0 (0.0%) |
| 3 or 4 Children | 0 (0.0%) | 8 (72.7%) |
| 5 or more Children | 0 (0.0%) | 0 (0.0%) |
| Total | 0 (0.0%) | 8 (53.3%) |
Income Below Poverty Among Married-Couple vs Single-Parent Households in Arbon Valley
The poverty data for Arbon Valley shows that 6 of the married-couple family households (5.6%) and 8 of the single-parent households (42.1%) are living below the poverty level. Within the married-couple family households, those with no children have the highest poverty rate, with 6 households (10.3%) falling below the poverty line. Among the single-parent households, those with 3 or 4 children have the highest poverty rate, with 8 household (72.7%) living below poverty.
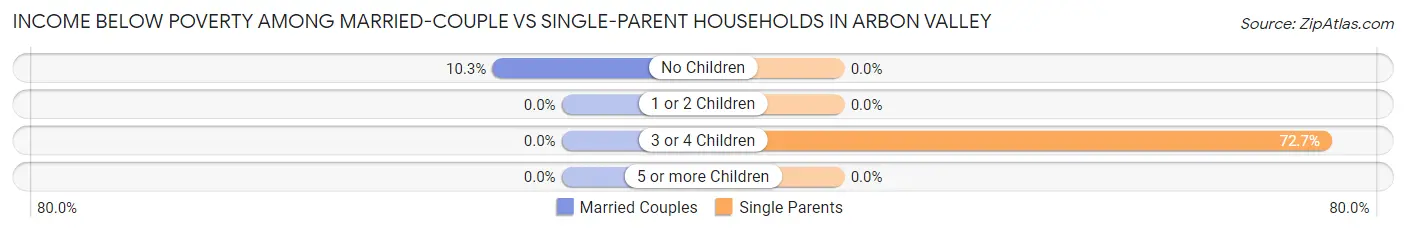
| Children | Married-Couple Families | Single-Parent Households |
| No Children | 6 (10.3%) | 0 (0.0%) |
| 1 or 2 Children | 0 (0.0%) | 0 (0.0%) |
| 3 or 4 Children | 0 (0.0%) | 8 (72.7%) |
| 5 or more Children | 0 (0.0%) | 0 (0.0%) |
| Total | 6 (5.6%) | 8 (42.1%) |
Race in Arbon Valley
The most populous races in Arbon Valley are White / Caucasian (570 | 72.7%), Hispanic or Latino (170 | 21.7%), and Native / Alaskan (104 | 13.3%).
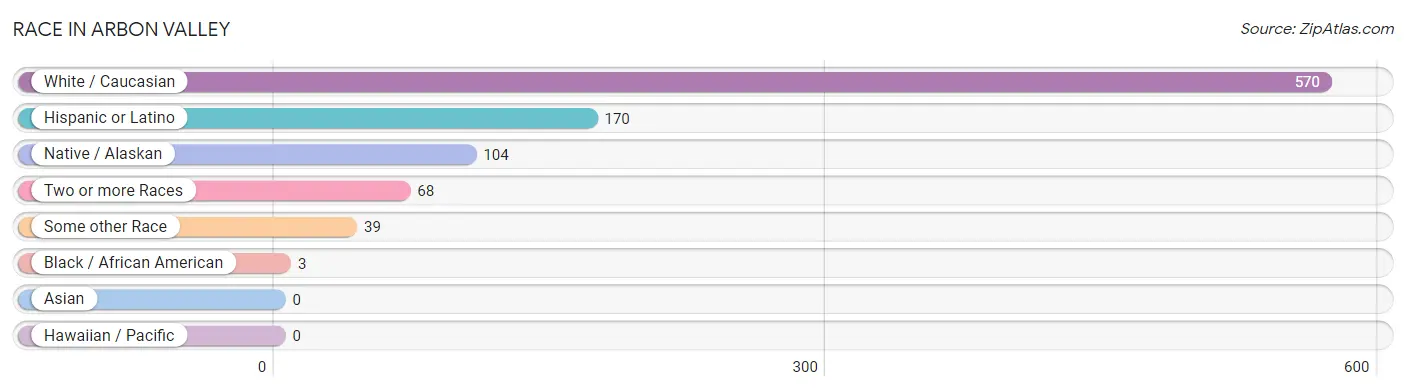
| Race | # Population | % Population |
| Asian | 0 | 0.0% |
| Black / African American | 3 | 0.4% |
| Hawaiian / Pacific | 0 | 0.0% |
| Hispanic or Latino | 170 | 21.7% |
| Native / Alaskan | 104 | 13.3% |
| White / Caucasian | 570 | 72.7% |
| Two or more Races | 68 | 8.7% |
| Some other Race | 39 | 5.0% |
| Total | 784 | 100.0% |
Ancestry in Arbon Valley
The most populous ancestries reported in Arbon Valley are Mexican (161 | 20.5%), Irish (111 | 14.2%), English (85 | 10.8%), American (60 | 7.6%), and German (55 | 7.0%), together accounting for 60.2% of all Arbon Valley residents.
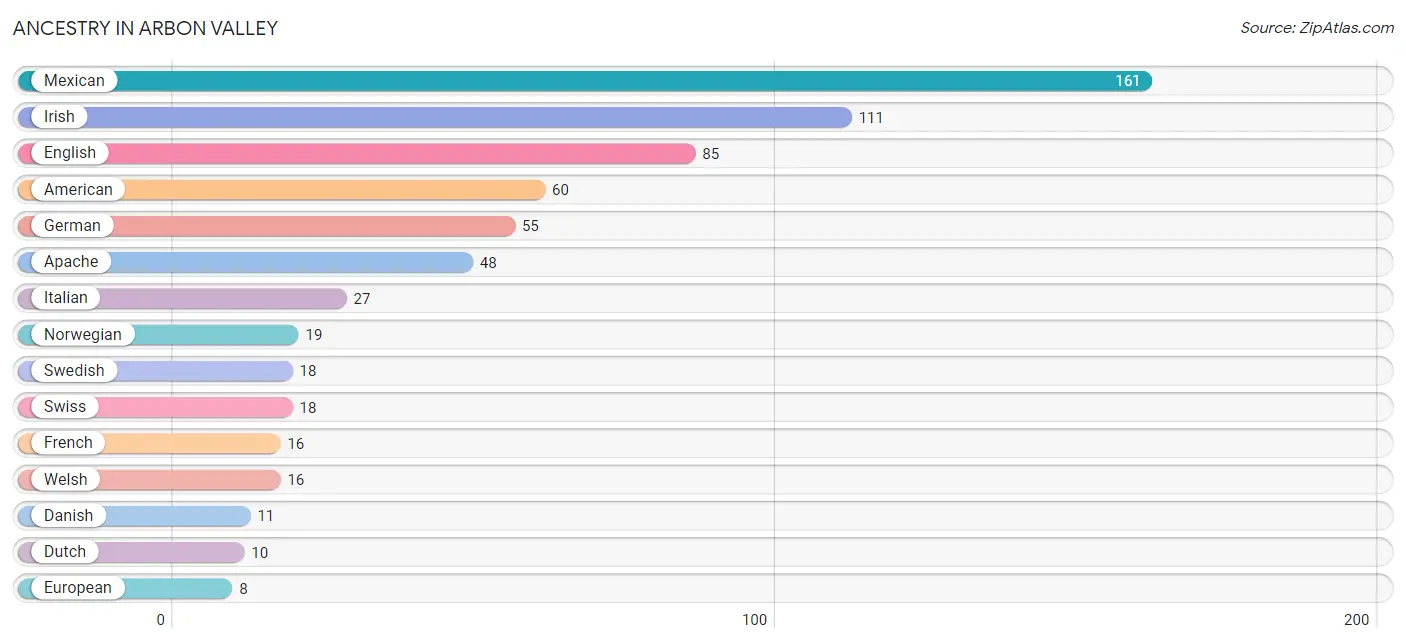
| Ancestry | # Population | % Population |
| African | 2 | 0.3% |
| American | 60 | 7.6% |
| Apache | 48 | 6.1% |
| Bhutanese | 7 | 0.9% |
| Blackfeet | 3 | 0.4% |
| British | 3 | 0.4% |
| Danish | 11 | 1.4% |
| Dutch | 10 | 1.3% |
| English | 85 | 10.8% |
| European | 8 | 1.0% |
| French | 16 | 2.0% |
| German | 55 | 7.0% |
| Irish | 111 | 14.2% |
| Italian | 27 | 3.4% |
| Mexican | 161 | 20.5% |
| Norwegian | 19 | 2.4% |
| Puerto Rican | 3 | 0.4% |
| Scandinavian | 7 | 0.9% |
| Scottish | 6 | 0.8% |
| Subsaharan African | 2 | 0.3% |
| Swedish | 18 | 2.3% |
| Swiss | 18 | 2.3% |
| Welsh | 16 | 2.0% | View All 23 Rows |
Immigrants in Arbon Valley
The most numerous immigrant groups reported in Arbon Valley came from Central America (33 | 4.2%), Latin America (33 | 4.2%), Mexico (33 | 4.2%), Africa (2 | 0.3%), and Congo (2 | 0.3%), together accounting for 13.1% of all Arbon Valley residents.
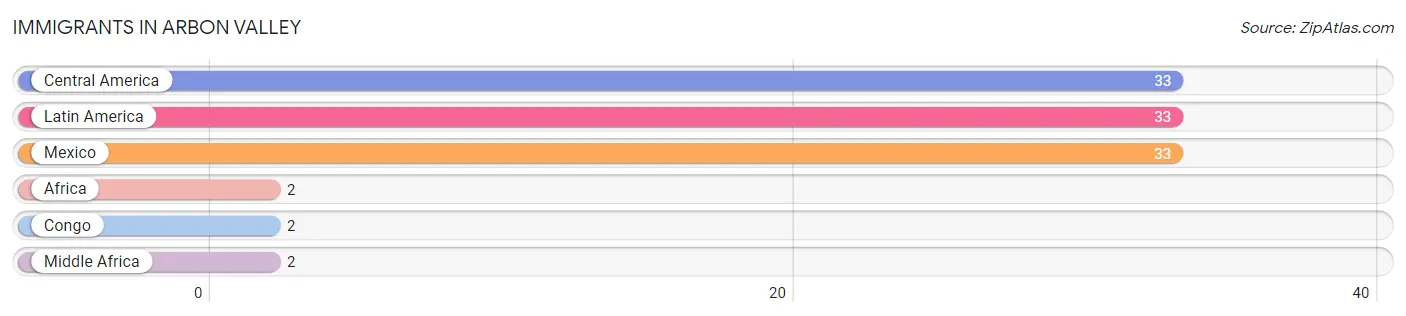
| Immigration Origin | # Population | % Population |
| Africa | 2 | 0.3% |
| Central America | 33 | 4.2% |
| Congo | 2 | 0.3% |
| Latin America | 33 | 4.2% |
| Mexico | 33 | 4.2% |
| Middle Africa | 2 | 0.3% | View All 6 Rows |
Sex and Age in Arbon Valley
Sex and Age in Arbon Valley
The most populous age groups in Arbon Valley are 15 to 19 Years (75 | 19.5%) for men and 40 to 44 Years (48 | 12.0%) for women.
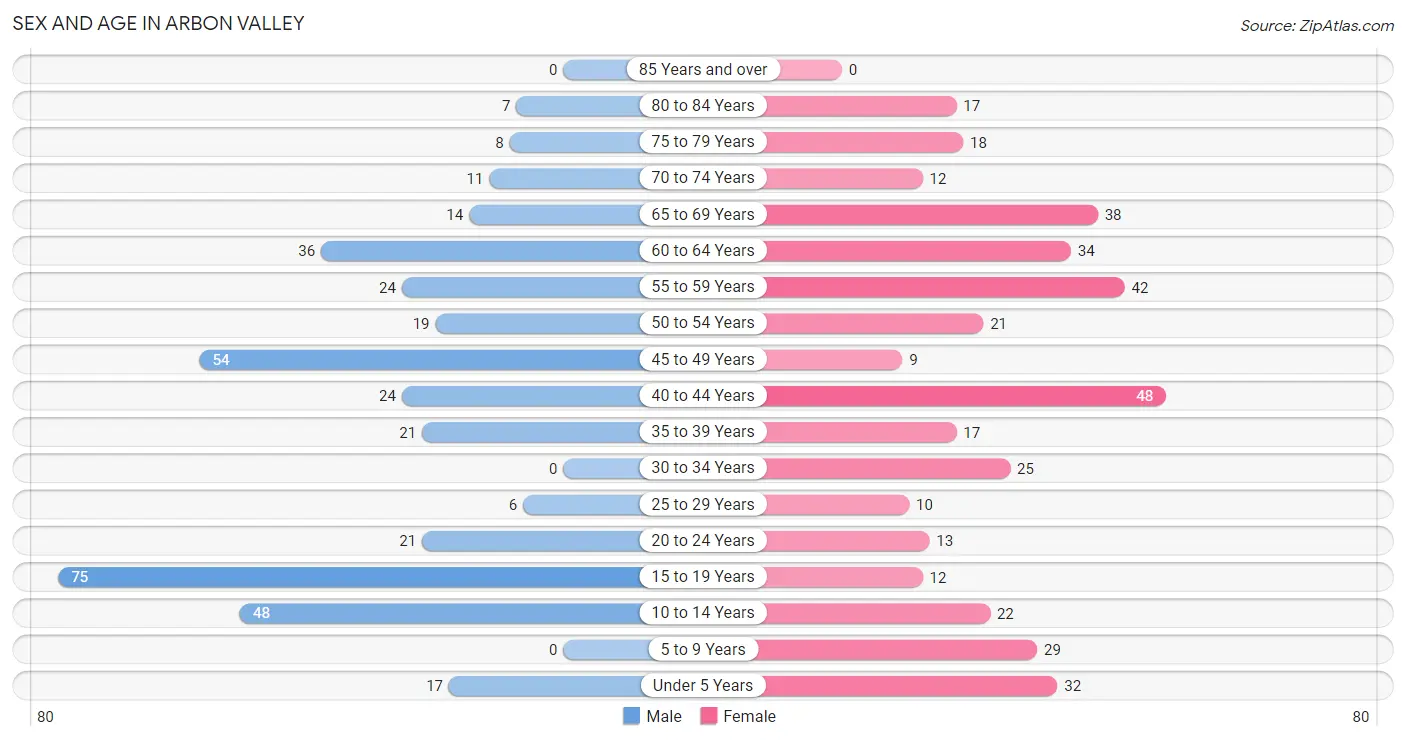
| Age Bracket | Male | Female |
| Under 5 Years | 17 (4.4%) | 32 (8.0%) |
| 5 to 9 Years | 0 (0.0%) | 29 (7.3%) |
| 10 to 14 Years | 48 (12.5%) | 22 (5.5%) |
| 15 to 19 Years | 75 (19.5%) | 12 (3.0%) |
| 20 to 24 Years | 21 (5.4%) | 13 (3.3%) |
| 25 to 29 Years | 6 (1.6%) | 10 (2.5%) |
| 30 to 34 Years | 0 (0.0%) | 25 (6.3%) |
| 35 to 39 Years | 21 (5.4%) | 17 (4.3%) |
| 40 to 44 Years | 24 (6.2%) | 48 (12.0%) |
| 45 to 49 Years | 54 (14.0%) | 9 (2.3%) |
| 50 to 54 Years | 19 (4.9%) | 21 (5.3%) |
| 55 to 59 Years | 24 (6.2%) | 42 (10.5%) |
| 60 to 64 Years | 36 (9.3%) | 34 (8.5%) |
| 65 to 69 Years | 14 (3.6%) | 38 (9.5%) |
| 70 to 74 Years | 11 (2.9%) | 12 (3.0%) |
| 75 to 79 Years | 8 (2.1%) | 18 (4.5%) |
| 80 to 84 Years | 7 (1.8%) | 17 (4.3%) |
| 85 Years and over | 0 (0.0%) | 0 (0.0%) |
| Total | 385 (100.0%) | 399 (100.0%) |
Families and Households in Arbon Valley
Median Family Size in Arbon Valley
The median family size in Arbon Valley is 4.61 persons per family, with single female/mother families (15 | 11.8%) accounting for the largest median family size of 7.33 persons per family. On the other hand, single male/father families (4 | 3.2%) represent the smallest median family size with 1.75 persons per family.
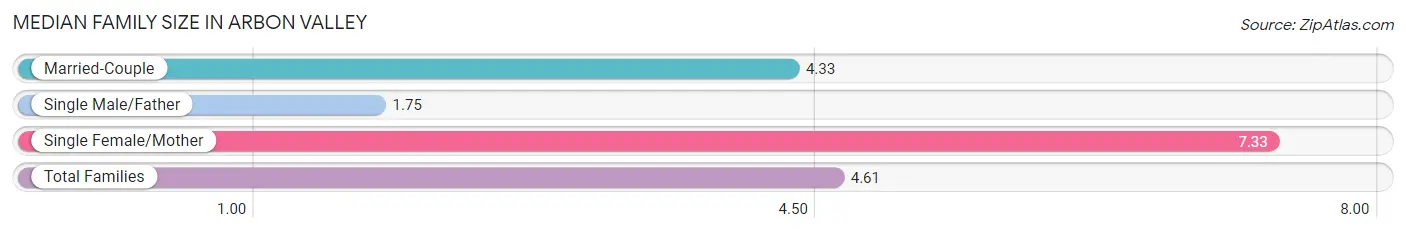
| Family Type | # Families | Family Size |
| Married-Couple | 108 (85.0%) | 4.33 |
| Single Male/Father | 4 (3.2%) | 1.75 |
| Single Female/Mother | 15 (11.8%) | 7.33 |
| Total Families | 127 (100.0%) | 4.61 |
Median Household Size in Arbon Valley
The median household size in Arbon Valley is 3.26 persons per household, with single female/mother households (15 | 6.3%) accounting for the largest median household size of 7.33 persons per household. non-family households (110 | 46.4%) represent the smallest median household size with 1.25 persons per household.
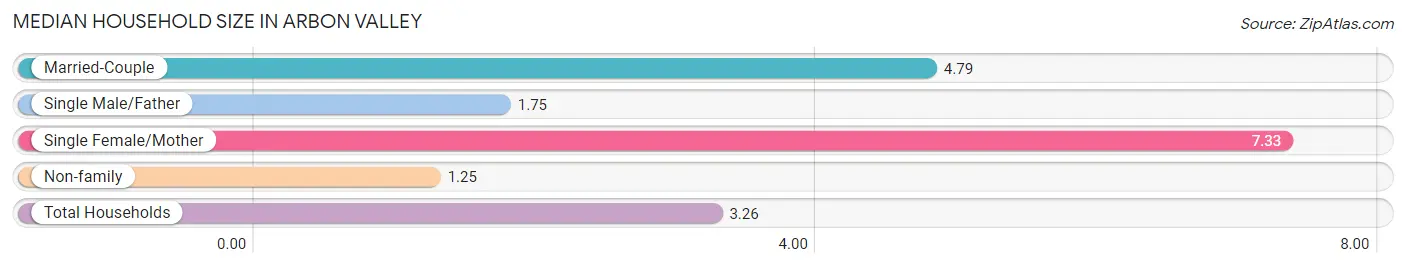
| Household Type | # Households | Household Size |
| Married-Couple | 108 (45.6%) | 4.79 |
| Single Male/Father | 4 (1.7%) | 1.75 |
| Single Female/Mother | 15 (6.3%) | 7.33 |
| Non-family | 110 (46.4%) | 1.25 |
| Total Households | 237 (100.0%) | 3.26 |
Household Size by Marriage Status in Arbon Valley
Out of a total of 237 households in Arbon Valley, 127 (53.6%) are family households, while 110 (46.4%) are nonfamily households. The most numerous type of family households are 2-person households, comprising 51, and the most common type of nonfamily households are 1-person households, comprising 77.
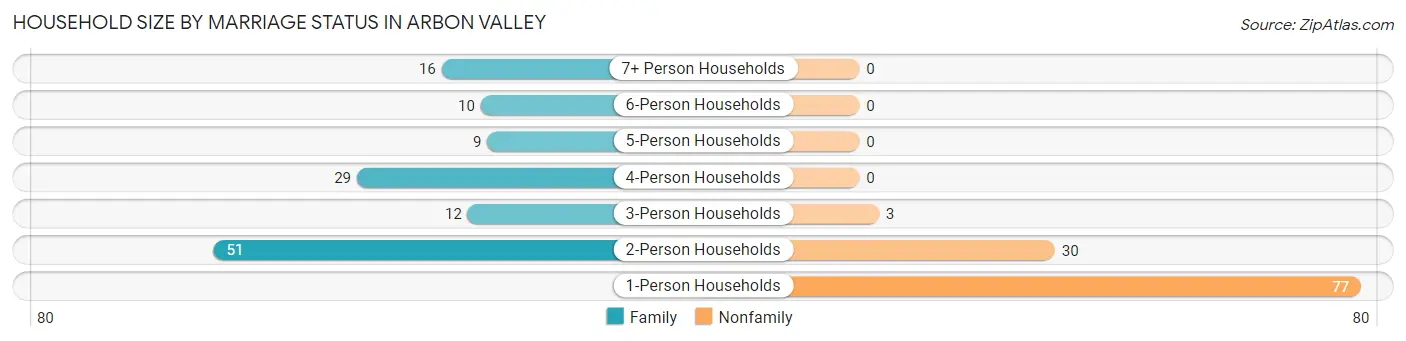
| Household Size | Family Households | Nonfamily Households |
| 1-Person Households | - | 77 (32.5%) |
| 2-Person Households | 51 (21.5%) | 30 (12.7%) |
| 3-Person Households | 12 (5.1%) | 3 (1.3%) |
| 4-Person Households | 29 (12.2%) | 0 (0.0%) |
| 5-Person Households | 9 (3.8%) | 0 (0.0%) |
| 6-Person Households | 10 (4.2%) | 0 (0.0%) |
| 7+ Person Households | 16 (6.8%) | 0 (0.0%) |
| Total | 127 (53.6%) | 110 (46.4%) |
Female Fertility in Arbon Valley
Fertility by Age in Arbon Valley
Average fertility rate in Arbon Valley is 99.0 births per 1,000 women. Women in the age bracket of 35 to 50 years have the highest fertility rate with 123.0 births per 1,000 women. Women in the age bracket of 35 to 50 years acount for 71.4% of all women with births.
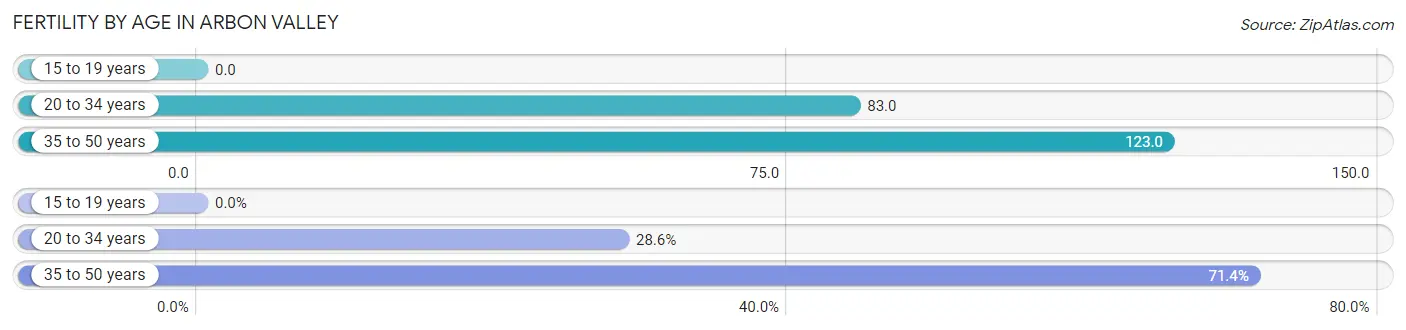
| Age Bracket | Women with Births | Births / 1,000 Women |
| 15 to 19 years | 0 (0.0%) | 0.0 |
| 20 to 34 years | 4 (28.6%) | 83.0 |
| 35 to 50 years | 10 (71.4%) | 123.0 |
| Total | 14 (100.0%) | 99.0 |
Fertility by Age by Marriage Status in Arbon Valley
28.6% of women with births (14) in Arbon Valley are married. The highest percentage of unmarried women with births falls into 35 to 50 years age bracket with 100.0% of them unmarried at the time of birth, while the lowest percentage of unmarried women with births belong to 20 to 34 years age bracket with 0.0% of them unmarried.
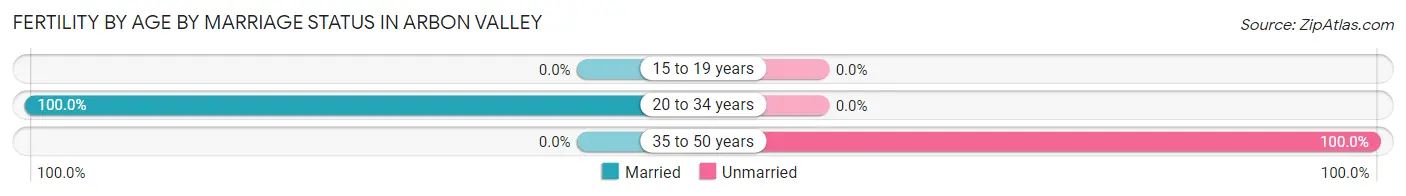
| Age Bracket | Married | Unmarried |
| 15 to 19 years | 0 (0.0%) | 0 (0.0%) |
| 20 to 34 years | 4 (100.0%) | 0 (0.0%) |
| 35 to 50 years | 0 (0.0%) | 10 (100.0%) |
| Total | 4 (28.6%) | 10 (71.4%) |
Fertility by Education in Arbon Valley
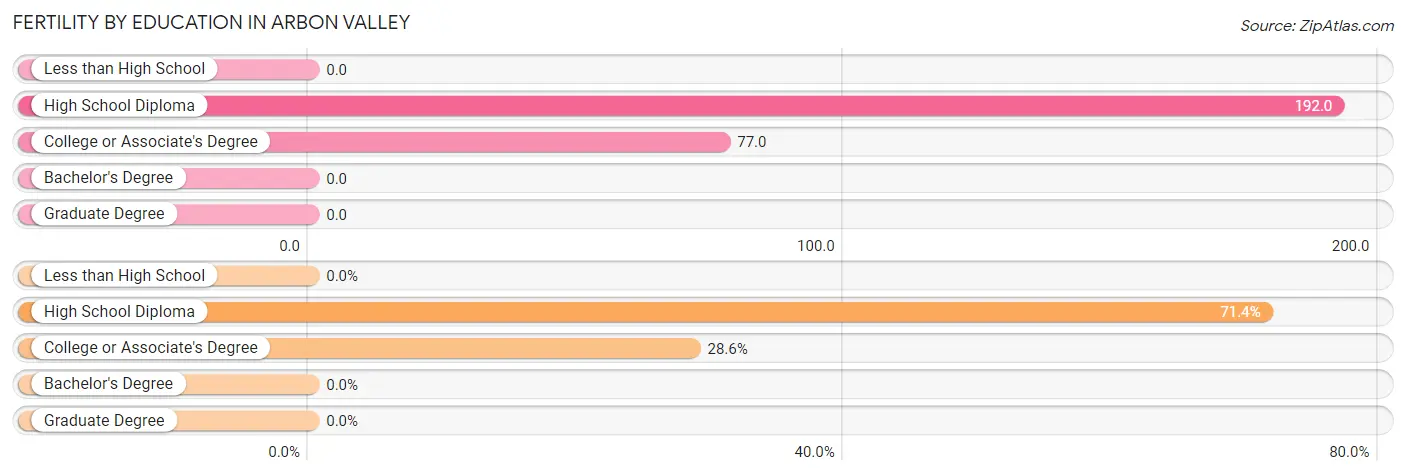
| Educational Attainment | Women with Births | Births / 1,000 Women |
| Less than High School | 0 (0.0%) | 0.0 |
| High School Diploma | 10 (71.4%) | 192.0 |
| College or Associate's Degree | 4 (28.6%) | 77.0 |
| Bachelor's Degree | 0 (0.0%) | 0.0 |
| Graduate Degree | 0 (0.0%) | 0.0 |
| Total | 14 (100.0%) | 99.0 |
Fertility by Education by Marriage Status in Arbon Valley
71.4% of women with births in Arbon Valley are unmarried. Women with the educational attainment of college or associate's degree are most likely to be married with 100.0% of them married at childbirth, while women with the educational attainment of high school diploma are least likely to be married with 100.0% of them unmarried at childbirth.
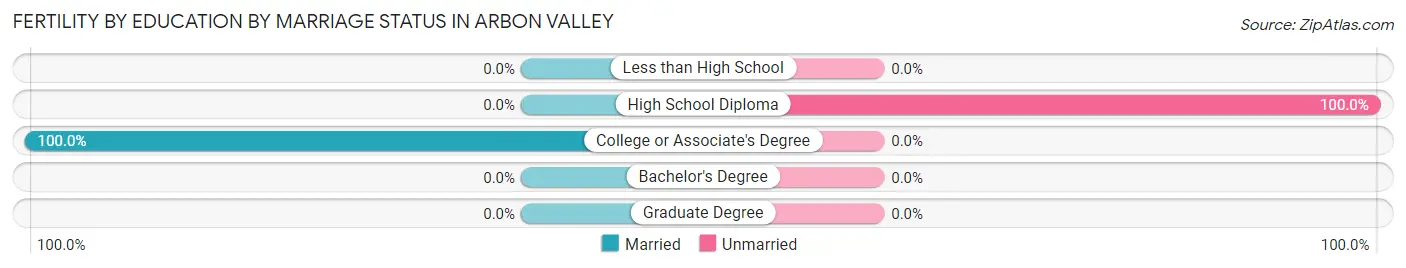
| Educational Attainment | Married | Unmarried |
| Less than High School | 0 (0.0%) | 0 (0.0%) |
| High School Diploma | 0 (0.0%) | 10 (100.0%) |
| College or Associate's Degree | 4 (100.0%) | 0 (0.0%) |
| Bachelor's Degree | 0 (0.0%) | 0 (0.0%) |
| Graduate Degree | 0 (0.0%) | 0 (0.0%) |
| Total | 4 (28.6%) | 10 (71.4%) |
Employment Characteristics in Arbon Valley
Employment by Class of Employer in Arbon Valley
Among the 317 employed individuals in Arbon Valley, private company employees (218 | 68.8%), local government employees (34 | 10.7%), and not-for-profit organizations (21 | 6.6%) make up the most common classes of employment.
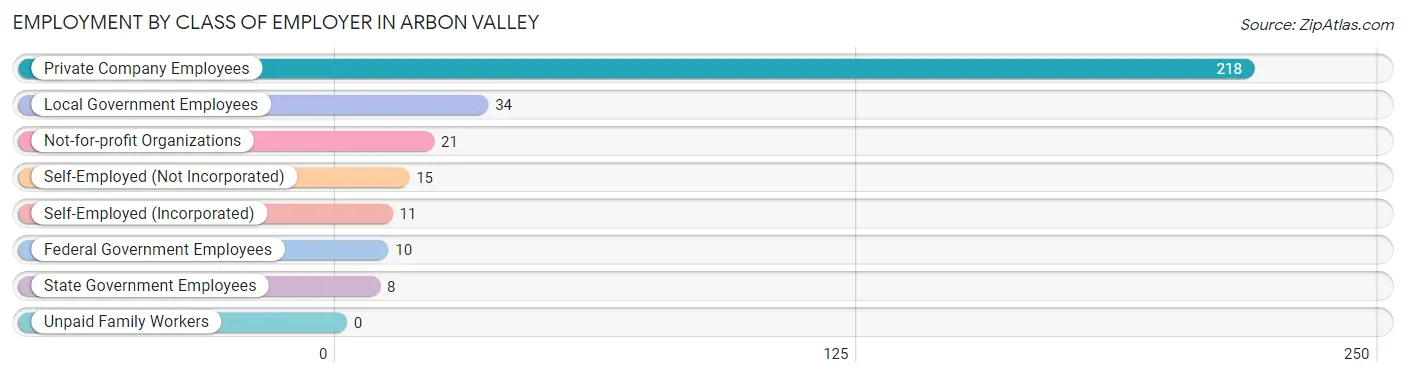
| Employer Class | # Employees | % Employees |
| Private Company Employees | 218 | 68.8% |
| Self-Employed (Incorporated) | 11 | 3.5% |
| Self-Employed (Not Incorporated) | 15 | 4.7% |
| Not-for-profit Organizations | 21 | 6.6% |
| Local Government Employees | 34 | 10.7% |
| State Government Employees | 8 | 2.5% |
| Federal Government Employees | 10 | 3.2% |
| Unpaid Family Workers | 0 | 0.0% |
| Total | 317 | 100.0% |
Employment Status by Age in Arbon Valley
According to the labor force statistics for Arbon Valley, out of the total population over 16 years of age (608), 59.5% or 362 individuals are in the labor force, with 12.4% or 45 of them unemployed. The age group with the highest labor force participation rate is 25 to 29 years, with 100.0% or 16 individuals in the labor force. Within the labor force, the 25 to 29 years age range has the highest percentage of unemployed individuals, with 75.0% or 12 of them being unemployed.
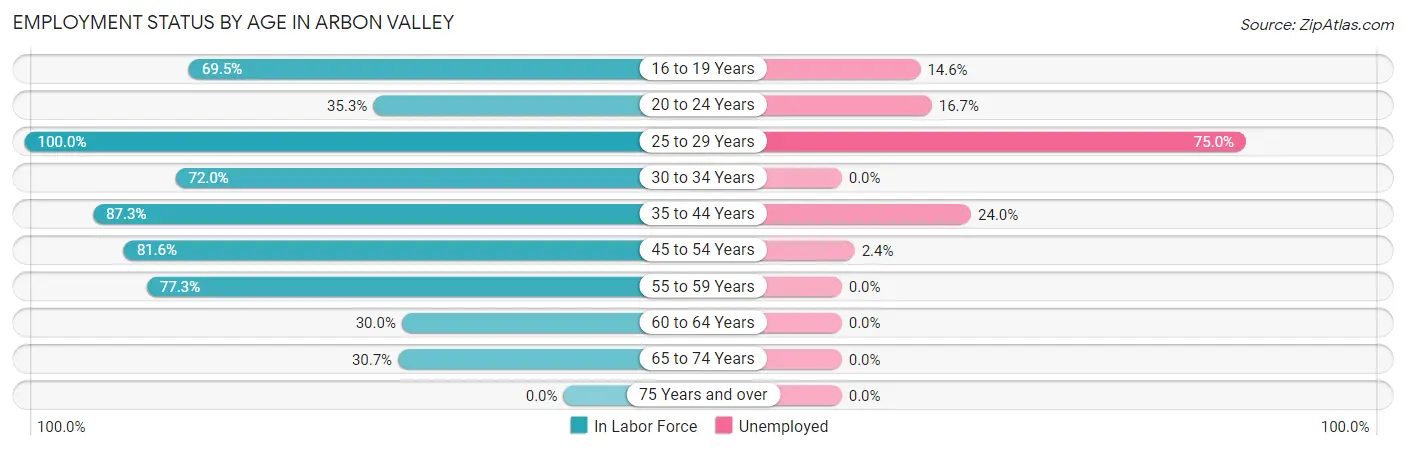
| Age Bracket | In Labor Force | Unemployed |
| 16 to 19 Years | 41 (69.5%) | 6 (14.6%) |
| 20 to 24 Years | 12 (35.3%) | 2 (16.7%) |
| 25 to 29 Years | 16 (100.0%) | 12 (75.0%) |
| 30 to 34 Years | 18 (72.0%) | 0 (0.0%) |
| 35 to 44 Years | 96 (87.3%) | 23 (24.0%) |
| 45 to 54 Years | 84 (81.6%) | 2 (2.4%) |
| 55 to 59 Years | 51 (77.3%) | 0 (0.0%) |
| 60 to 64 Years | 21 (30.0%) | 0 (0.0%) |
| 65 to 74 Years | 23 (30.7%) | 0 (0.0%) |
| 75 Years and over | 0 (0.0%) | 0 (0.0%) |
| Total | 362 (59.5%) | 45 (12.4%) |
Employment Status by Educational Attainment in Arbon Valley
According to labor force statistics for Arbon Valley, 73.3% of individuals (286) out of the total population between 25 and 64 years of age (390) are in the labor force, with 12.9% or 37 of them being unemployed. The group with the highest labor force participation rate are those with the educational attainment of high school diploma, with 80.1% or 161 individuals in the labor force. Within the labor force, individuals with bachelor's degree or higher education have the highest percentage of unemployment, with 22.2% or 6 of them being unemployed.
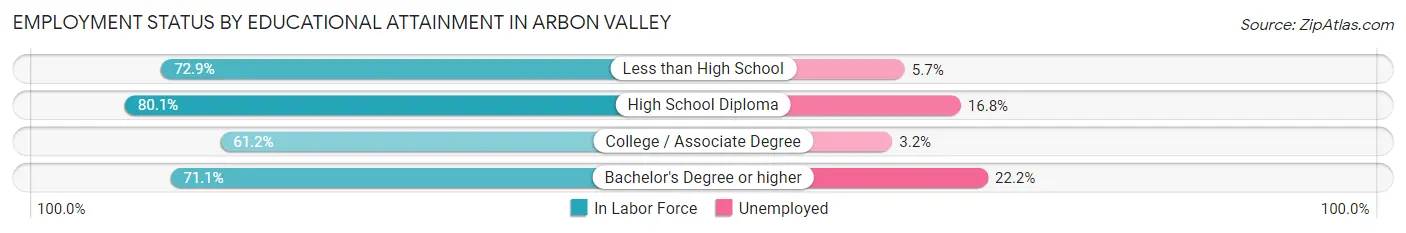
| Educational Attainment | In Labor Force | Unemployed |
| Less than High School | 35 (72.9%) | 3 (5.7%) |
| High School Diploma | 161 (80.1%) | 34 (16.8%) |
| College / Associate Degree | 63 (61.2%) | 3 (3.2%) |
| Bachelor's Degree or higher | 27 (71.1%) | 8 (22.2%) |
| Total | 286 (73.3%) | 50 (12.9%) |
Employment Occupations by Sex in Arbon Valley
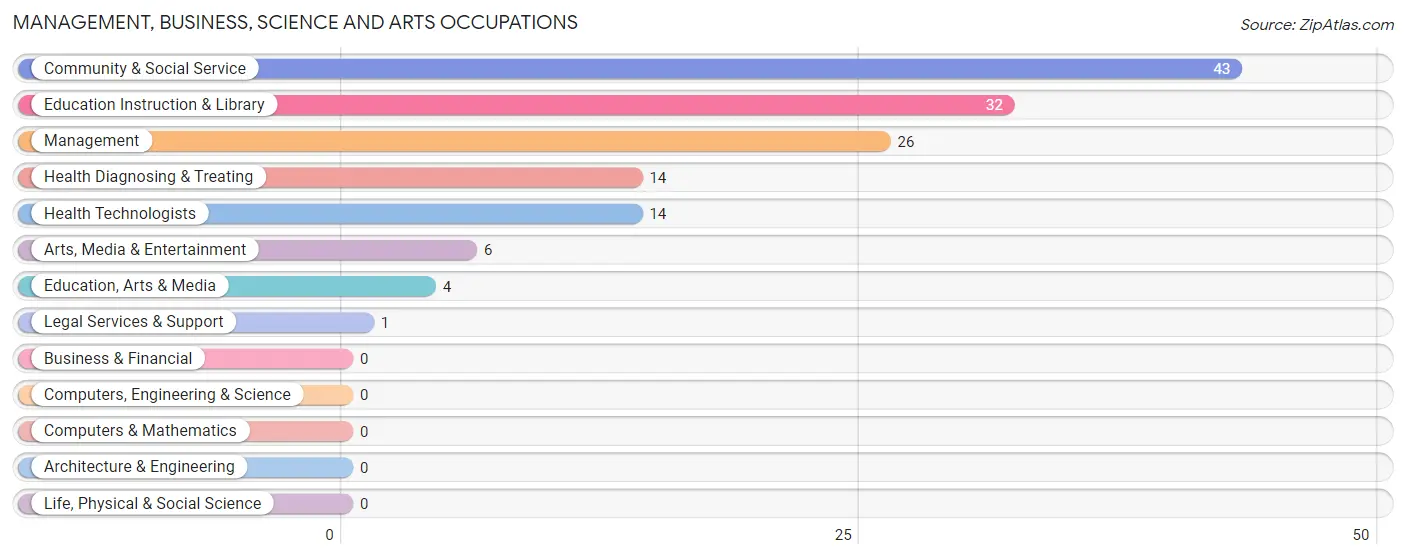
Management, Business, Science and Arts Occupations
The most common Management, Business, Science and Arts occupations in Arbon Valley are Community & Social Service (43 | 13.6%), Education Instruction & Library (32 | 10.1%), Management (26 | 8.2%), Health Diagnosing & Treating (14 | 4.4%), and Health Technologists (14 | 4.4%).
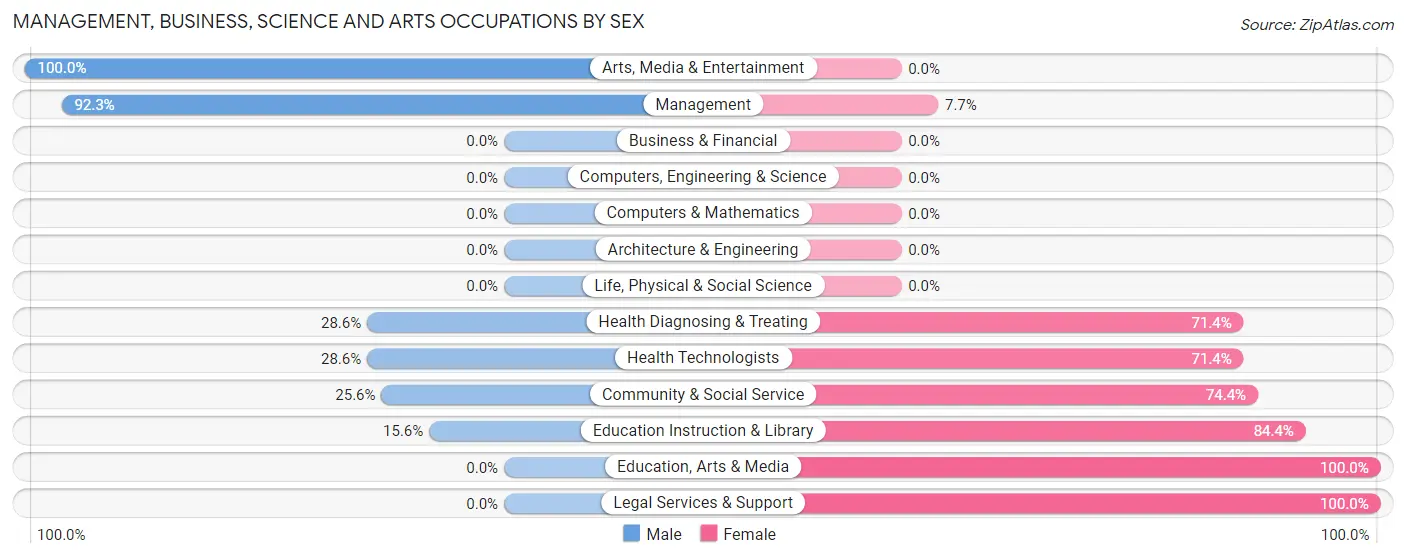
Management, Business, Science and Arts Occupations by Sex
Within the Management, Business, Science and Arts occupations in Arbon Valley, the most male-oriented occupations are Arts, Media & Entertainment (100.0%), Management (92.3%), and Health Diagnosing & Treating (28.6%), while the most female-oriented occupations are Education, Arts & Media (100.0%), Legal Services & Support (100.0%), and Education Instruction & Library (84.4%).
| Occupation | Male | Female |
| Management | 24 (92.3%) | 2 (7.7%) |
| Business & Financial | 0 (0.0%) | 0 (0.0%) |
| Computers, Engineering & Science | 0 (0.0%) | 0 (0.0%) |
| Computers & Mathematics | 0 (0.0%) | 0 (0.0%) |
| Architecture & Engineering | 0 (0.0%) | 0 (0.0%) |
| Life, Physical & Social Science | 0 (0.0%) | 0 (0.0%) |
| Community & Social Service | 11 (25.6%) | 32 (74.4%) |
| Education, Arts & Media | 0 (0.0%) | 4 (100.0%) |
| Legal Services & Support | 0 (0.0%) | 1 (100.0%) |
| Education Instruction & Library | 5 (15.6%) | 27 (84.4%) |
| Arts, Media & Entertainment | 6 (100.0%) | 0 (0.0%) |
| Health Diagnosing & Treating | 4 (28.6%) | 10 (71.4%) |
| Health Technologists | 4 (28.6%) | 10 (71.4%) |
| Total (Category) | 39 (47.0%) | 44 (53.0%) |
| Total (Overall) | 187 (59.0%) | 130 (41.0%) |
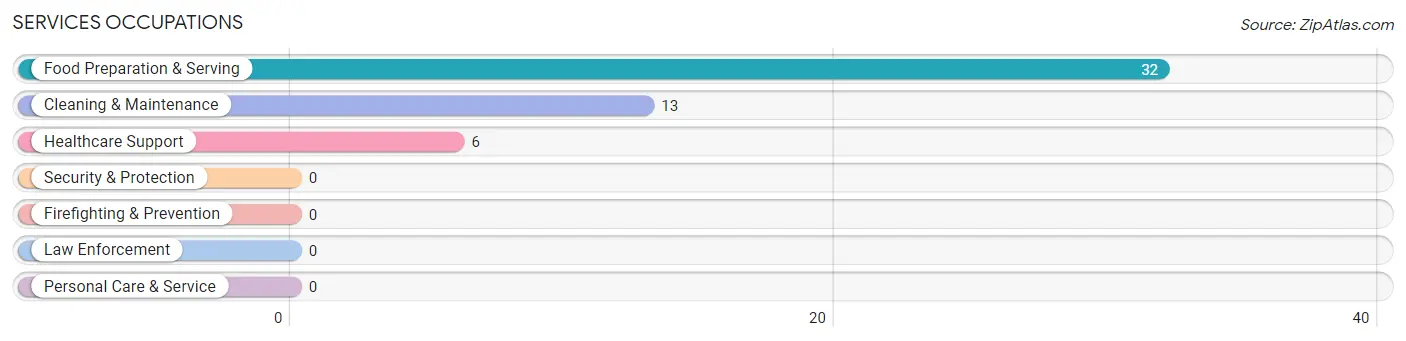
Services Occupations
The most common Services occupations in Arbon Valley are Food Preparation & Serving (32 | 10.1%), Cleaning & Maintenance (13 | 4.1%), and Healthcare Support (6 | 1.9%).
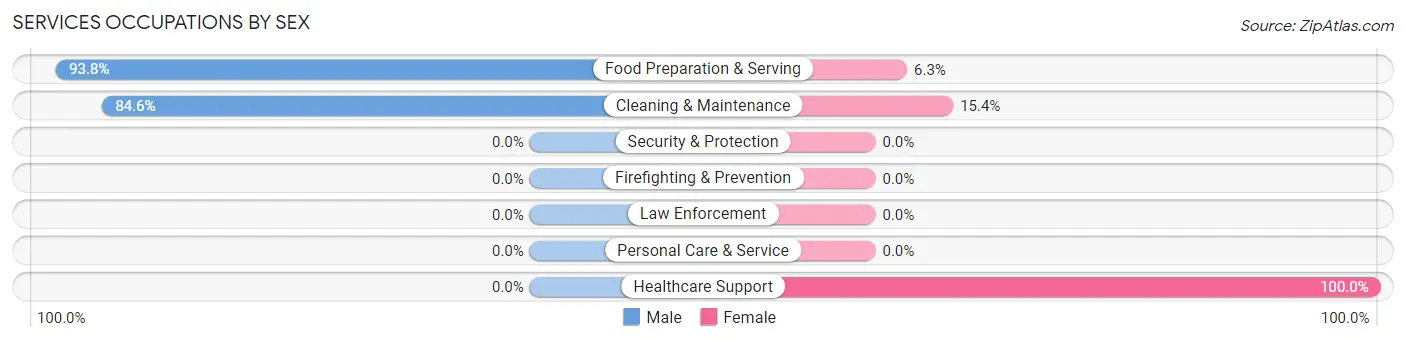
Services Occupations by Sex
Within the Services occupations in Arbon Valley, the most male-oriented occupations are Food Preparation & Serving (93.8%), and Cleaning & Maintenance (84.6%), while the most female-oriented occupations are Healthcare Support (100.0%), Cleaning & Maintenance (15.4%), and Food Preparation & Serving (6.2%).
| Occupation | Male | Female |
| Healthcare Support | 0 (0.0%) | 6 (100.0%) |
| Security & Protection | 0 (0.0%) | 0 (0.0%) |
| Firefighting & Prevention | 0 (0.0%) | 0 (0.0%) |
| Law Enforcement | 0 (0.0%) | 0 (0.0%) |
| Food Preparation & Serving | 30 (93.8%) | 2 (6.2%) |
| Cleaning & Maintenance | 11 (84.6%) | 2 (15.4%) |
| Personal Care & Service | 0 (0.0%) | 0 (0.0%) |
| Total (Category) | 41 (80.4%) | 10 (19.6%) |
| Total (Overall) | 187 (59.0%) | 130 (41.0%) |
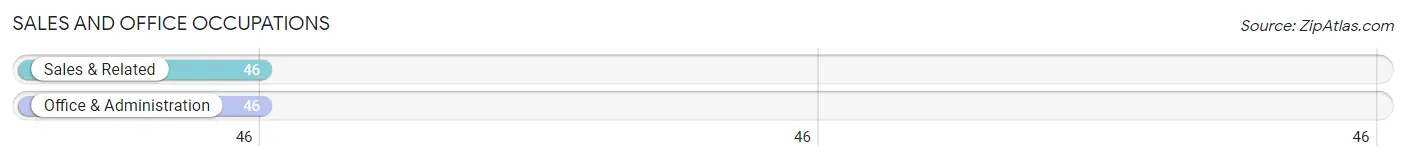
Sales and Office Occupations
The most common Sales and Office occupations in Arbon Valley are Sales & Related (46 | 14.5%), and Office & Administration (46 | 14.5%).
Sales and Office Occupations by Sex
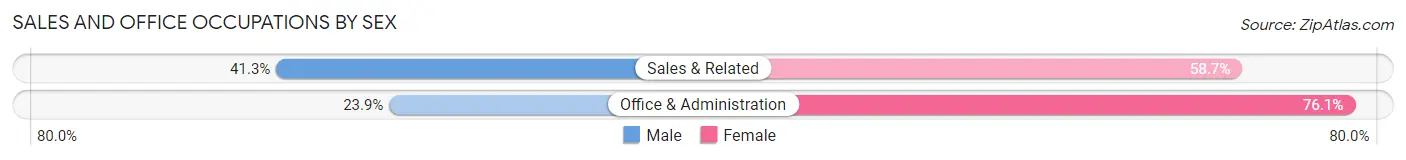
| Occupation | Male | Female |
| Sales & Related | 19 (41.3%) | 27 (58.7%) |
| Office & Administration | 11 (23.9%) | 35 (76.1%) |
| Total (Category) | 30 (32.6%) | 62 (67.4%) |
| Total (Overall) | 187 (59.0%) | 130 (41.0%) |
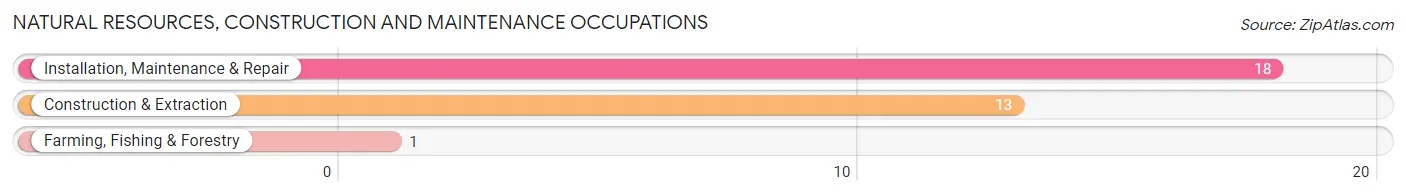
Natural Resources, Construction and Maintenance Occupations
The most common Natural Resources, Construction and Maintenance occupations in Arbon Valley are Installation, Maintenance & Repair (18 | 5.7%), Construction & Extraction (13 | 4.1%), and Farming, Fishing & Forestry (1 | 0.3%).
Natural Resources, Construction and Maintenance Occupations by Sex
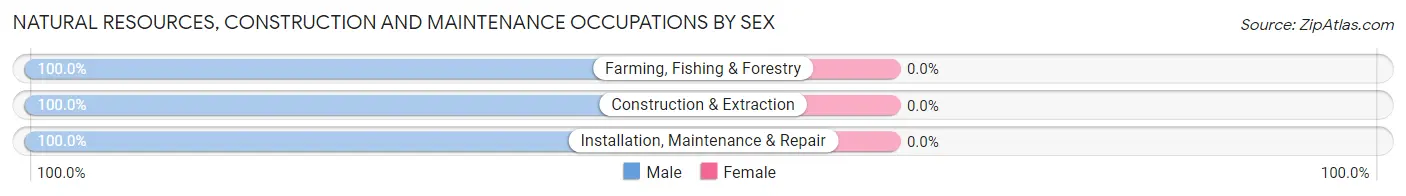
| Occupation | Male | Female |
| Farming, Fishing & Forestry | 1 (100.0%) | 0 (0.0%) |
| Construction & Extraction | 13 (100.0%) | 0 (0.0%) |
| Installation, Maintenance & Repair | 18 (100.0%) | 0 (0.0%) |
| Total (Category) | 32 (100.0%) | 0 (0.0%) |
| Total (Overall) | 187 (59.0%) | 130 (41.0%) |
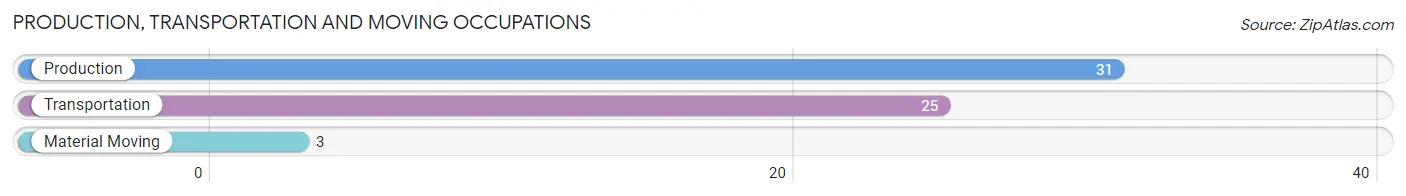
Production, Transportation and Moving Occupations
The most common Production, Transportation and Moving occupations in Arbon Valley are Production (31 | 9.8%), Transportation (25 | 7.9%), and Material Moving (3 | 0.9%).
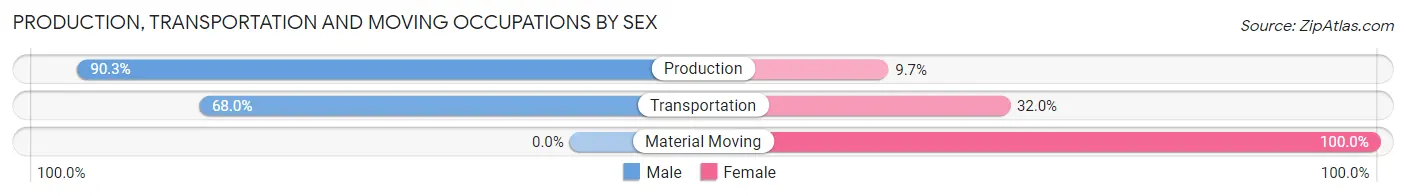
Production, Transportation and Moving Occupations by Sex
| Occupation | Male | Female |
| Production | 28 (90.3%) | 3 (9.7%) |
| Transportation | 17 (68.0%) | 8 (32.0%) |
| Material Moving | 0 (0.0%) | 3 (100.0%) |
| Total (Category) | 45 (76.3%) | 14 (23.7%) |
| Total (Overall) | 187 (59.0%) | 130 (41.0%) |
Employment Industries by Sex in Arbon Valley
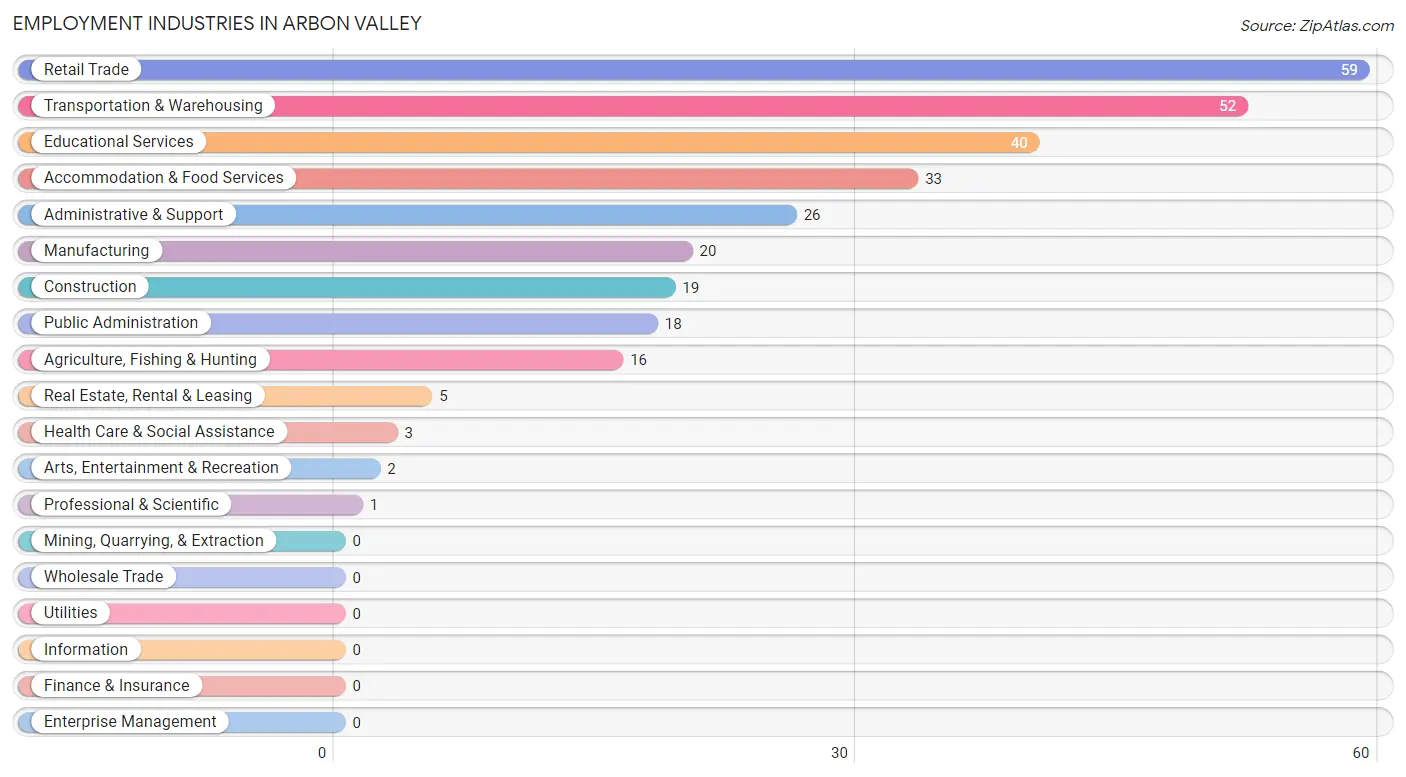
Employment Industries in Arbon Valley
The major employment industries in Arbon Valley include Retail Trade (59 | 18.6%), Transportation & Warehousing (52 | 16.4%), Educational Services (40 | 12.6%), Accommodation & Food Services (33 | 10.4%), and Administrative & Support (26 | 8.2%).
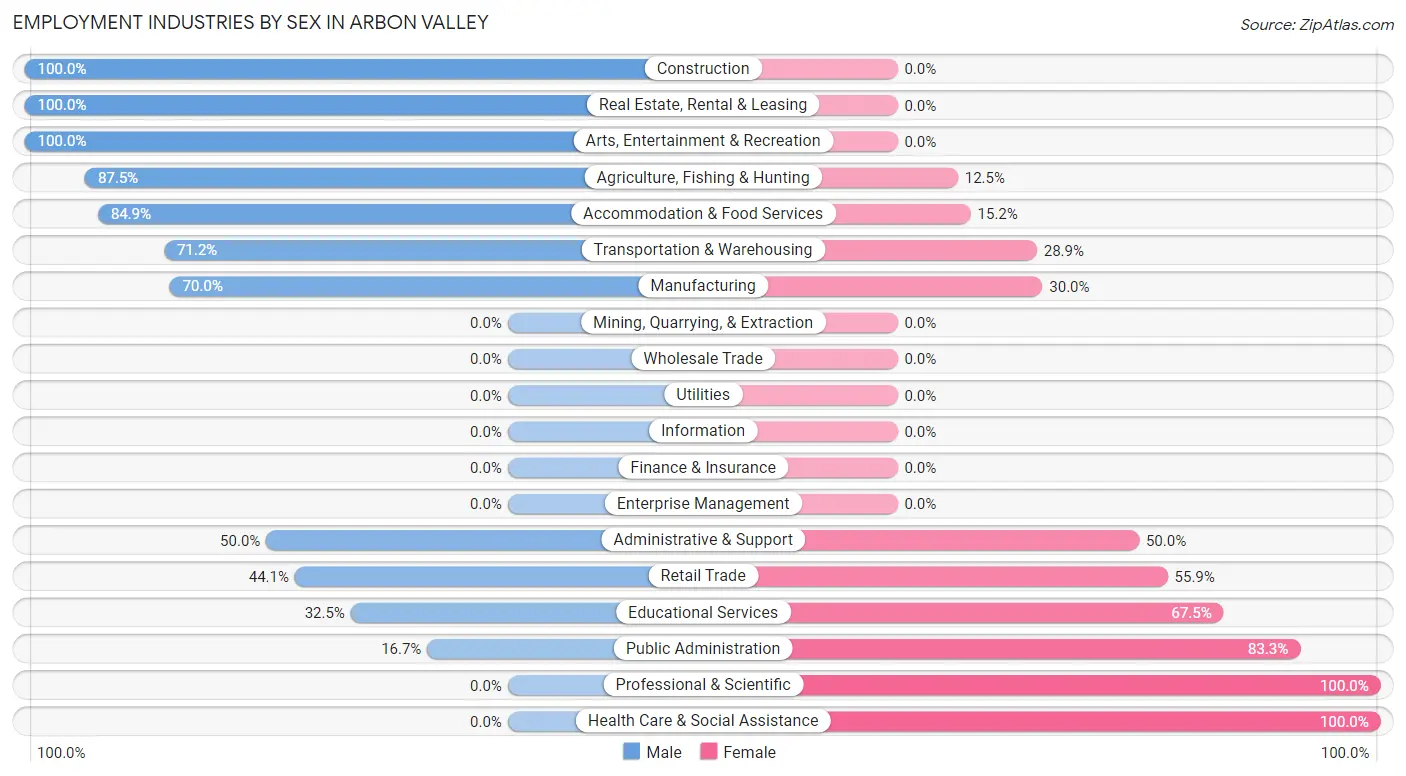
Employment Industries by Sex in Arbon Valley
The Arbon Valley industries that see more men than women are Construction (100.0%), Real Estate, Rental & Leasing (100.0%), and Arts, Entertainment & Recreation (100.0%), whereas the industries that tend to have a higher number of women are Professional & Scientific (100.0%), Health Care & Social Assistance (100.0%), and Public Administration (83.3%).
| Industry | Male | Female |
| Agriculture, Fishing & Hunting | 14 (87.5%) | 2 (12.5%) |
| Mining, Quarrying, & Extraction | 0 (0.0%) | 0 (0.0%) |
| Construction | 19 (100.0%) | 0 (0.0%) |
| Manufacturing | 14 (70.0%) | 6 (30.0%) |
| Wholesale Trade | 0 (0.0%) | 0 (0.0%) |
| Retail Trade | 26 (44.1%) | 33 (55.9%) |
| Transportation & Warehousing | 37 (71.2%) | 15 (28.8%) |
| Utilities | 0 (0.0%) | 0 (0.0%) |
| Information | 0 (0.0%) | 0 (0.0%) |
| Finance & Insurance | 0 (0.0%) | 0 (0.0%) |
| Real Estate, Rental & Leasing | 5 (100.0%) | 0 (0.0%) |
| Professional & Scientific | 0 (0.0%) | 1 (100.0%) |
| Enterprise Management | 0 (0.0%) | 0 (0.0%) |
| Administrative & Support | 13 (50.0%) | 13 (50.0%) |
| Educational Services | 13 (32.5%) | 27 (67.5%) |
| Health Care & Social Assistance | 0 (0.0%) | 3 (100.0%) |
| Arts, Entertainment & Recreation | 2 (100.0%) | 0 (0.0%) |
| Accommodation & Food Services | 28 (84.9%) | 5 (15.1%) |
| Public Administration | 3 (16.7%) | 15 (83.3%) |
| Total | 187 (59.0%) | 130 (41.0%) |
Education in Arbon Valley
School Enrollment in Arbon Valley
The most common levels of schooling among the 145 students in Arbon Valley are middle school (55 | 37.9%), high school (53 | 36.5%), and elementary school (29 | 20.0%).
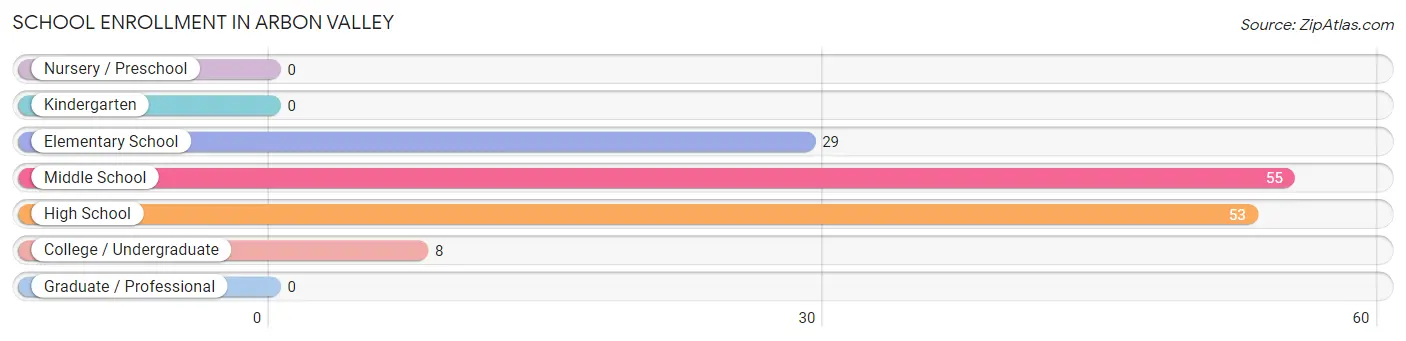
| School Level | # Students | % Students |
| Nursery / Preschool | 0 | 0.0% |
| Kindergarten | 0 | 0.0% |
| Elementary School | 29 | 20.0% |
| Middle School | 55 | 37.9% |
| High School | 53 | 36.5% |
| College / Undergraduate | 8 | 5.5% |
| Graduate / Professional | 0 | 0.0% |
| Total | 145 | 100.0% |
School Enrollment by Age by Funding Source in Arbon Valley
Out of a total of 145 students who are enrolled in schools in Arbon Valley, 8 (5.5%) attend a private institution, while the remaining 137 (94.5%) are enrolled in public schools. The age group of 18 to 19 year olds has the highest likelihood of being enrolled in private schools, with 8 (61.5% in the age bracket) enrolled. Conversely, the age group of 5 to 9 year old has the lowest likelihood of being enrolled in a private school, with 29 (100.0% in the age bracket) attending a public institution.
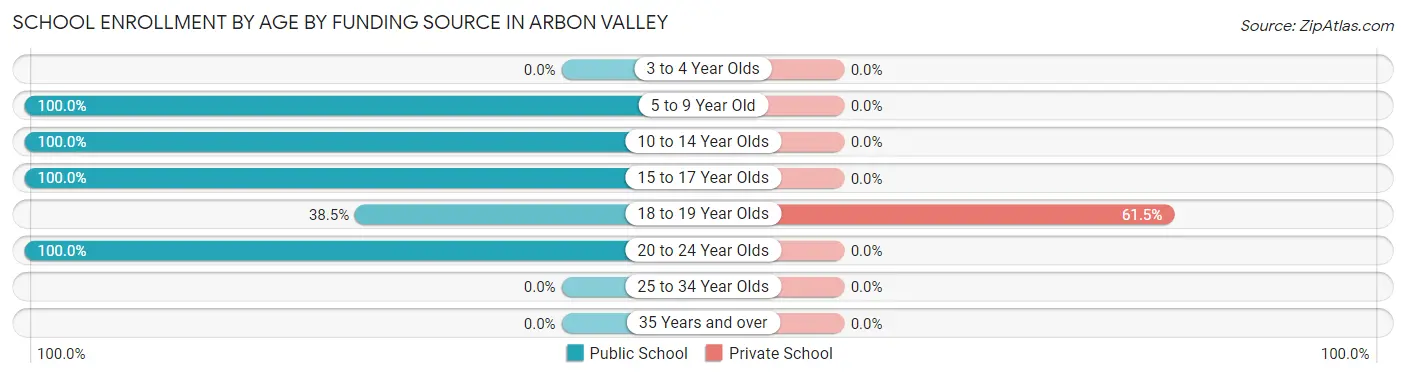
| Age Bracket | Public School | Private School |
| 3 to 4 Year Olds | 0 (0.0%) | 0 (0.0%) |
| 5 to 9 Year Old | 29 (100.0%) | 0 (0.0%) |
| 10 to 14 Year Olds | 55 (100.0%) | 0 (0.0%) |
| 15 to 17 Year Olds | 44 (100.0%) | 0 (0.0%) |
| 18 to 19 Year Olds | 5 (38.5%) | 8 (61.5%) |
| 20 to 24 Year Olds | 4 (100.0%) | 0 (0.0%) |
| 25 to 34 Year Olds | 0 (0.0%) | 0 (0.0%) |
| 35 Years and over | 0 (0.0%) | 0 (0.0%) |
| Total | 137 (94.5%) | 8 (5.5%) |
Educational Attainment by Field of Study in Arbon Valley
Science & technology (20 | 40.0%), education (18 | 36.0%), business (5 | 10.0%), arts & humanities (4 | 8.0%), and engineering (2 | 4.0%) are the most common fields of study among 50 individuals in Arbon Valley who have obtained a bachelor's degree or higher.
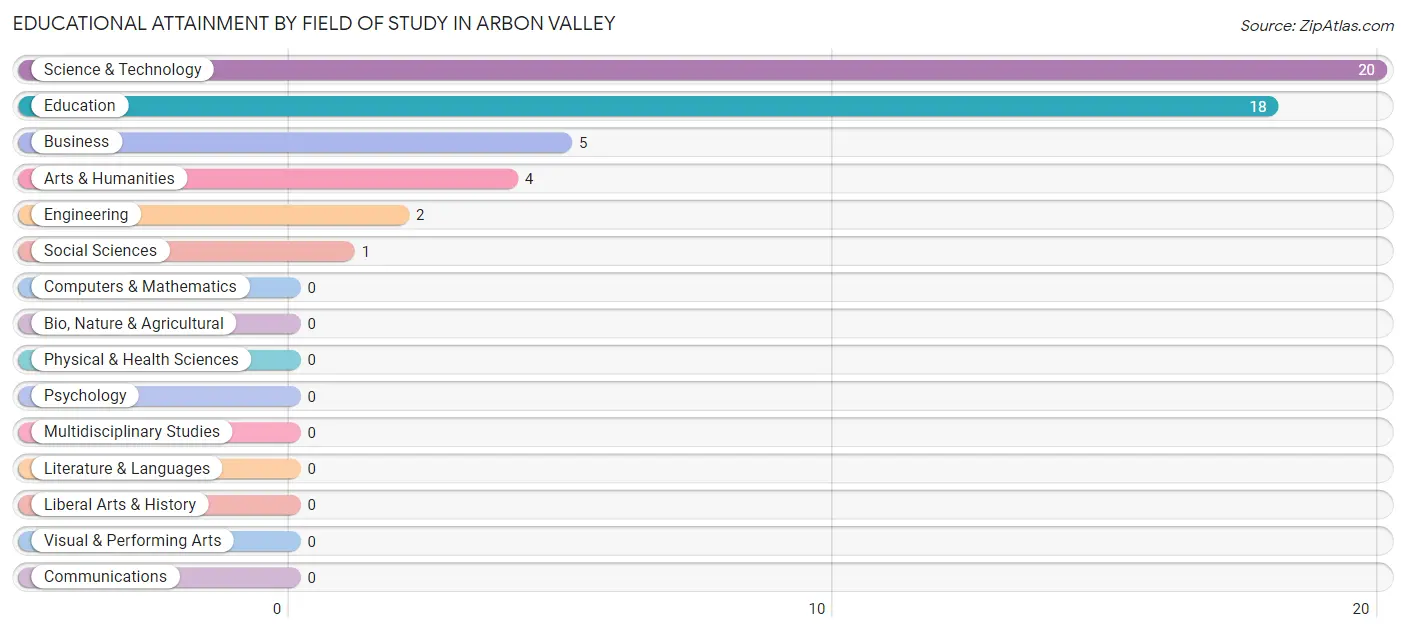
| Field of Study | # Graduates | % Graduates |
| Computers & Mathematics | 0 | 0.0% |
| Bio, Nature & Agricultural | 0 | 0.0% |
| Physical & Health Sciences | 0 | 0.0% |
| Psychology | 0 | 0.0% |
| Social Sciences | 1 | 2.0% |
| Engineering | 2 | 4.0% |
| Multidisciplinary Studies | 0 | 0.0% |
| Science & Technology | 20 | 40.0% |
| Business | 5 | 10.0% |
| Education | 18 | 36.0% |
| Literature & Languages | 0 | 0.0% |
| Liberal Arts & History | 0 | 0.0% |
| Visual & Performing Arts | 0 | 0.0% |
| Communications | 0 | 0.0% |
| Arts & Humanities | 4 | 8.0% |
| Total | 50 | 100.0% |
Transportation & Commute in Arbon Valley
Vehicle Availability by Sex in Arbon Valley
The most prevalent vehicle ownership categories in Arbon Valley are males with 3 vehicles (73, accounting for 39.0%) and females with 3 vehicles (40, making up 58.9%).
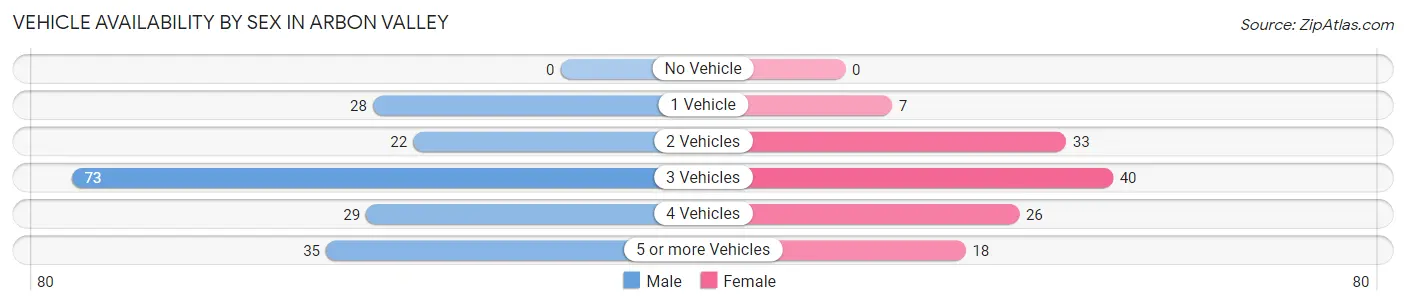
| Vehicles Available | Male | Female |
| No Vehicle | 0 (0.0%) | 0 (0.0%) |
| 1 Vehicle | 28 (15.0%) | 7 (5.7%) |
| 2 Vehicles | 22 (11.8%) | 33 (26.6%) |
| 3 Vehicles | 73 (39.0%) | 40 (32.3%) |
| 4 Vehicles | 29 (15.5%) | 26 (21.0%) |
| 5 or more Vehicles | 35 (18.7%) | 18 (14.5%) |
| Total | 187 (100.0%) | 124 (100.0%) |
Commute Time in Arbon Valley
The most frequently occuring commute durations in Arbon Valley are 20 to 24 minutes (86 commuters, 30.1%), 10 to 14 minutes (57 commuters, 19.9%), and 15 to 19 minutes (39 commuters, 13.6%).
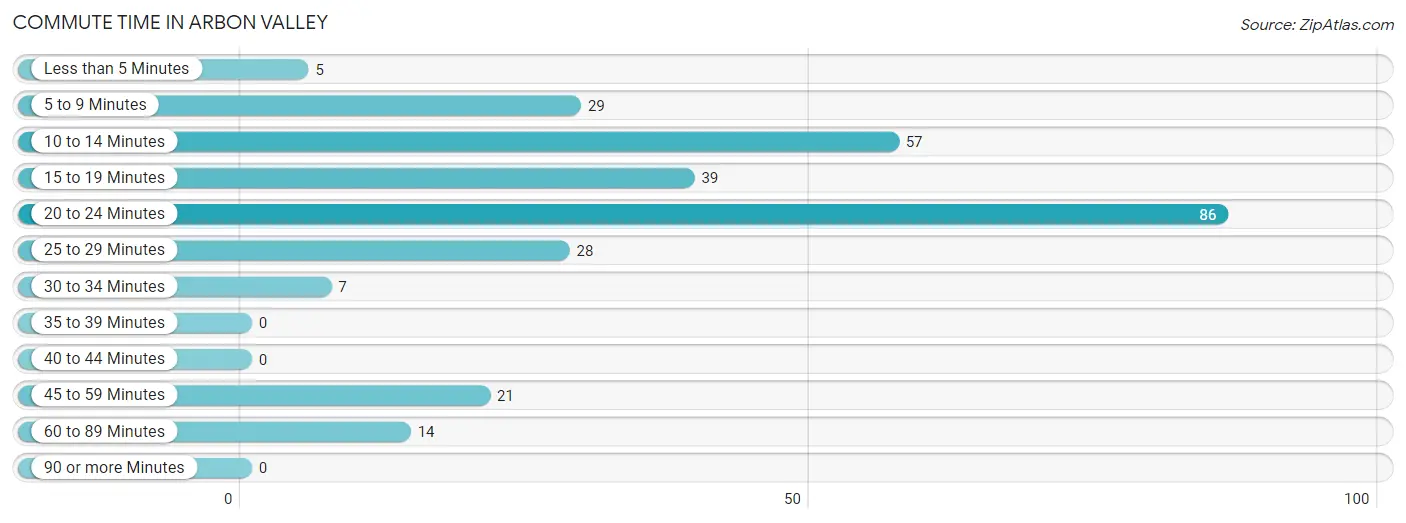
| Commute Time | # Commuters | % Commuters |
| Less than 5 Minutes | 5 | 1.8% |
| 5 to 9 Minutes | 29 | 10.1% |
| 10 to 14 Minutes | 57 | 19.9% |
| 15 to 19 Minutes | 39 | 13.6% |
| 20 to 24 Minutes | 86 | 30.1% |
| 25 to 29 Minutes | 28 | 9.8% |
| 30 to 34 Minutes | 7 | 2.5% |
| 35 to 39 Minutes | 0 | 0.0% |
| 40 to 44 Minutes | 0 | 0.0% |
| 45 to 59 Minutes | 21 | 7.3% |
| 60 to 89 Minutes | 14 | 4.9% |
| 90 or more Minutes | 0 | 0.0% |
Commute Time by Sex in Arbon Valley
The most common commute times in Arbon Valley are 10 to 14 minutes (50 commuters, 29.8%) for males and 20 to 24 minutes (45 commuters, 38.1%) for females.
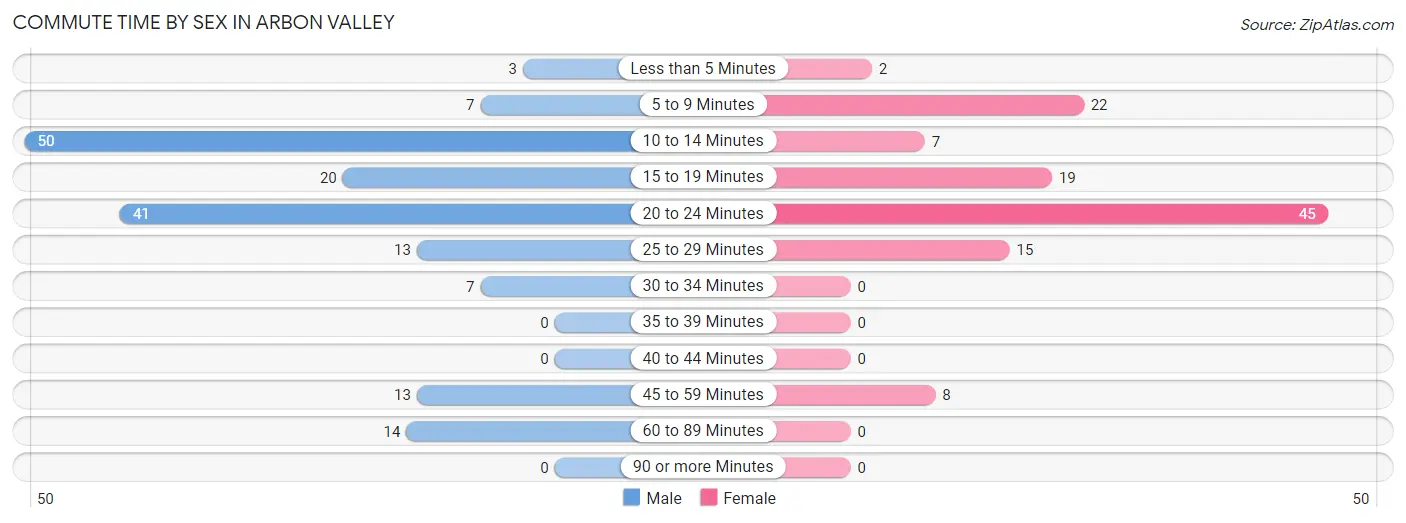
| Commute Time | Male | Female |
| Less than 5 Minutes | 3 (1.8%) | 2 (1.7%) |
| 5 to 9 Minutes | 7 (4.2%) | 22 (18.6%) |
| 10 to 14 Minutes | 50 (29.8%) | 7 (5.9%) |
| 15 to 19 Minutes | 20 (11.9%) | 19 (16.1%) |
| 20 to 24 Minutes | 41 (24.4%) | 45 (38.1%) |
| 25 to 29 Minutes | 13 (7.7%) | 15 (12.7%) |
| 30 to 34 Minutes | 7 (4.2%) | 0 (0.0%) |
| 35 to 39 Minutes | 0 (0.0%) | 0 (0.0%) |
| 40 to 44 Minutes | 0 (0.0%) | 0 (0.0%) |
| 45 to 59 Minutes | 13 (7.7%) | 8 (6.8%) |
| 60 to 89 Minutes | 14 (8.3%) | 0 (0.0%) |
| 90 or more Minutes | 0 (0.0%) | 0 (0.0%) |
Time of Departure to Work by Sex in Arbon Valley
The most frequent times of departure to work in Arbon Valley are 7:00 AM to 7:29 AM (48, 28.6%) for males and 8:00 AM to 8:29 AM (51, 43.2%) for females.
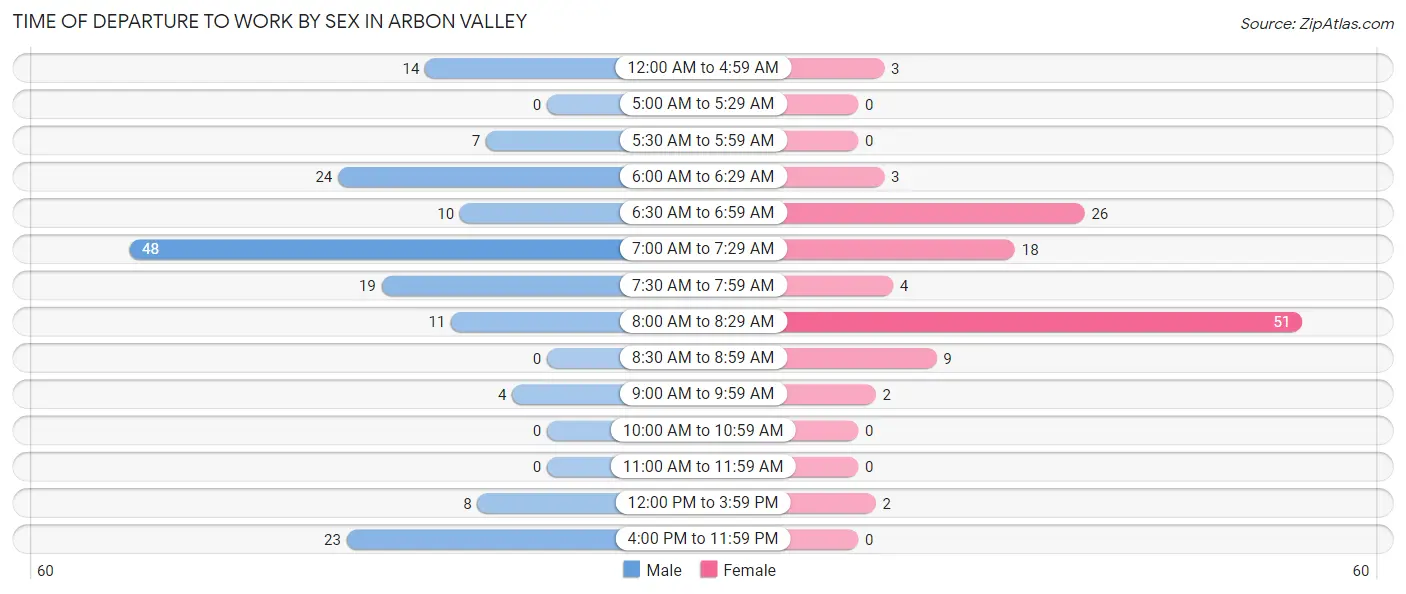
| Time of Departure | Male | Female |
| 12:00 AM to 4:59 AM | 14 (8.3%) | 3 (2.5%) |
| 5:00 AM to 5:29 AM | 0 (0.0%) | 0 (0.0%) |
| 5:30 AM to 5:59 AM | 7 (4.2%) | 0 (0.0%) |
| 6:00 AM to 6:29 AM | 24 (14.3%) | 3 (2.5%) |
| 6:30 AM to 6:59 AM | 10 (5.9%) | 26 (22.0%) |
| 7:00 AM to 7:29 AM | 48 (28.6%) | 18 (15.2%) |
| 7:30 AM to 7:59 AM | 19 (11.3%) | 4 (3.4%) |
| 8:00 AM to 8:29 AM | 11 (6.6%) | 51 (43.2%) |
| 8:30 AM to 8:59 AM | 0 (0.0%) | 9 (7.6%) |
| 9:00 AM to 9:59 AM | 4 (2.4%) | 2 (1.7%) |
| 10:00 AM to 10:59 AM | 0 (0.0%) | 0 (0.0%) |
| 11:00 AM to 11:59 AM | 0 (0.0%) | 0 (0.0%) |
| 12:00 PM to 3:59 PM | 8 (4.8%) | 2 (1.7%) |
| 4:00 PM to 11:59 PM | 23 (13.7%) | 0 (0.0%) |
| Total | 168 (100.0%) | 118 (100.0%) |
Housing Occupancy in Arbon Valley
Occupancy by Ownership in Arbon Valley
Of the total 237 dwellings in Arbon Valley, owner-occupied units account for 229 (96.6%), while renter-occupied units make up 8 (3.4%).
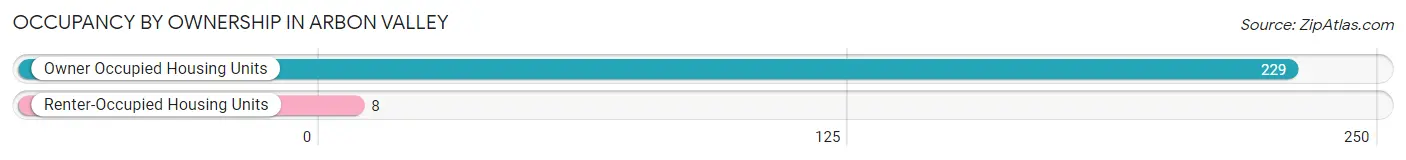
| Occupancy | # Housing Units | % Housing Units |
| Owner Occupied Housing Units | 229 | 96.6% |
| Renter-Occupied Housing Units | 8 | 3.4% |
| Total Occupied Housing Units | 237 | 100.0% |
Occupancy by Household Size in Arbon Valley
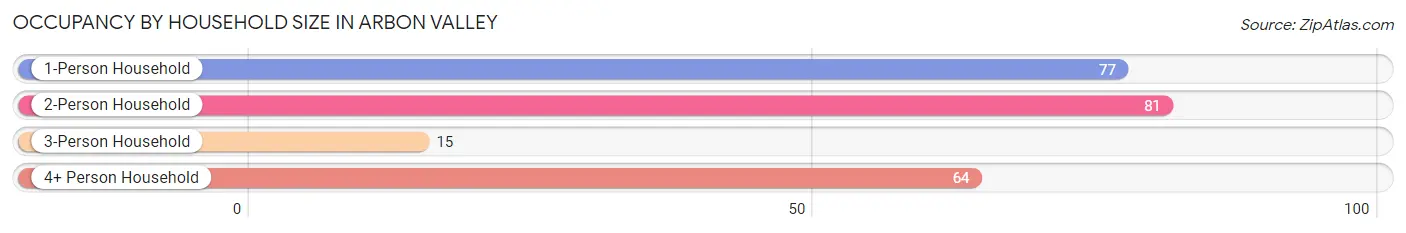
| Household Size | # Housing Units | % Housing Units |
| 1-Person Household | 77 | 32.5% |
| 2-Person Household | 81 | 34.2% |
| 3-Person Household | 15 | 6.3% |
| 4+ Person Household | 64 | 27.0% |
| Total Housing Units | 237 | 100.0% |
Occupancy by Ownership by Household Size in Arbon Valley
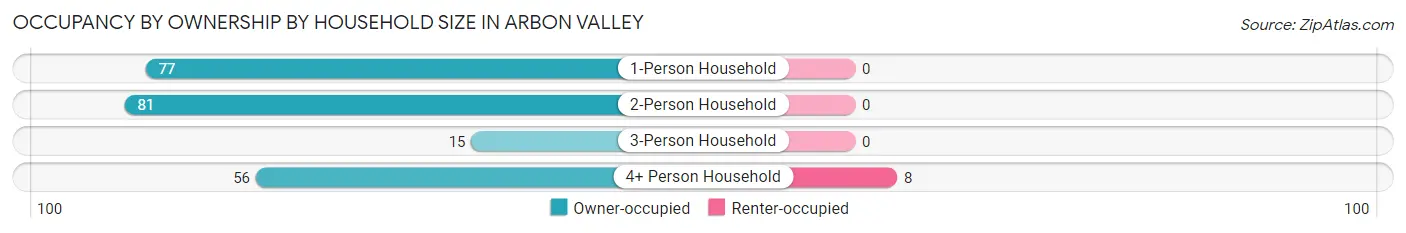
| Household Size | Owner-occupied | Renter-occupied |
| 1-Person Household | 77 (100.0%) | 0 (0.0%) |
| 2-Person Household | 81 (100.0%) | 0 (0.0%) |
| 3-Person Household | 15 (100.0%) | 0 (0.0%) |
| 4+ Person Household | 56 (87.5%) | 8 (12.5%) |
| Total Housing Units | 229 (96.6%) | 8 (3.4%) |
Occupancy by Educational Attainment in Arbon Valley
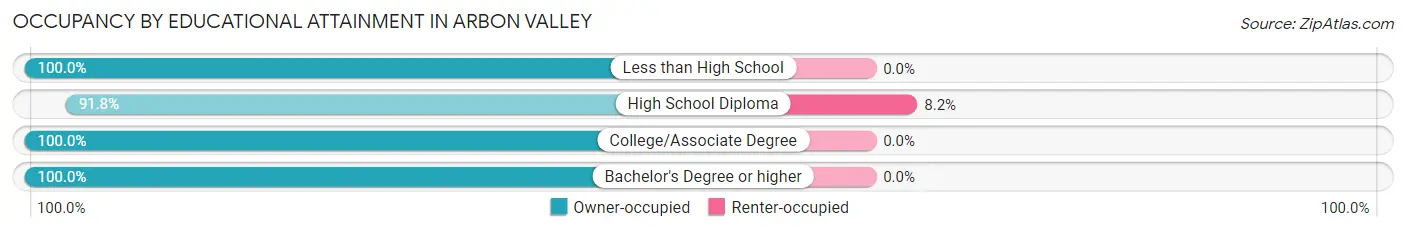
| Household Size | Owner-occupied | Renter-occupied |
| Less than High School | 41 (100.0%) | 0 (0.0%) |
| High School Diploma | 90 (91.8%) | 8 (8.2%) |
| College/Associate Degree | 74 (100.0%) | 0 (0.0%) |
| Bachelor's Degree or higher | 24 (100.0%) | 0 (0.0%) |
Occupancy by Age of Householder in Arbon Valley
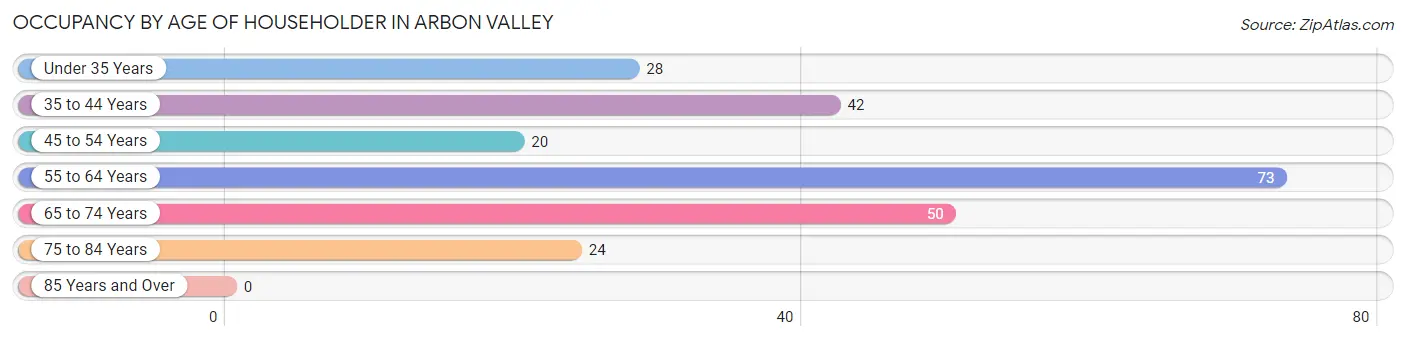
| Age Bracket | # Households | % Households |
| Under 35 Years | 28 | 11.8% |
| 35 to 44 Years | 42 | 17.7% |
| 45 to 54 Years | 20 | 8.4% |
| 55 to 64 Years | 73 | 30.8% |
| 65 to 74 Years | 50 | 21.1% |
| 75 to 84 Years | 24 | 10.1% |
| 85 Years and Over | 0 | 0.0% |
| Total | 237 | 100.0% |
Housing Finances in Arbon Valley
Median Income by Occupancy in Arbon Valley
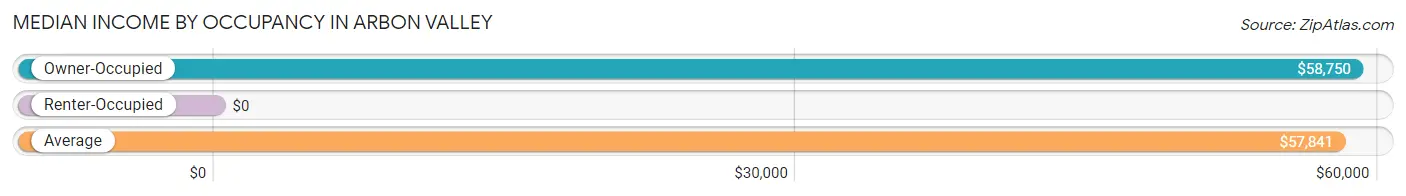
| Occupancy Type | # Households | Median Income |
| Owner-Occupied | 229 (96.6%) | $58,750 |
| Renter-Occupied | 8 (3.4%) | $0 |
| Average | 237 (100.0%) | $57,841 |
Occupancy by Householder Income Bracket in Arbon Valley
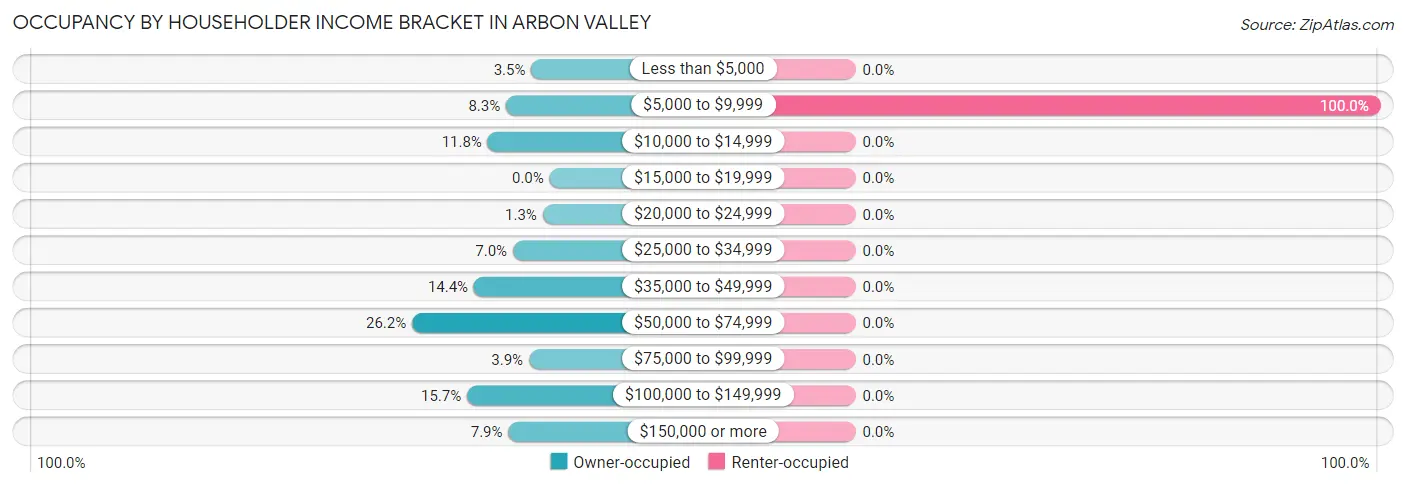
| Income Bracket | Owner-occupied | Renter-occupied |
| Less than $5,000 | 8 (3.5%) | 0 (0.0%) |
| $5,000 to $9,999 | 19 (8.3%) | 8 (100.0%) |
| $10,000 to $14,999 | 27 (11.8%) | 0 (0.0%) |
| $15,000 to $19,999 | 0 (0.0%) | 0 (0.0%) |
| $20,000 to $24,999 | 3 (1.3%) | 0 (0.0%) |
| $25,000 to $34,999 | 16 (7.0%) | 0 (0.0%) |
| $35,000 to $49,999 | 33 (14.4%) | 0 (0.0%) |
| $50,000 to $74,999 | 60 (26.2%) | 0 (0.0%) |
| $75,000 to $99,999 | 9 (3.9%) | 0 (0.0%) |
| $100,000 to $149,999 | 36 (15.7%) | 0 (0.0%) |
| $150,000 or more | 18 (7.9%) | 0 (0.0%) |
| Total | 229 (100.0%) | 8 (100.0%) |
Monthly Housing Cost Tiers in Arbon Valley
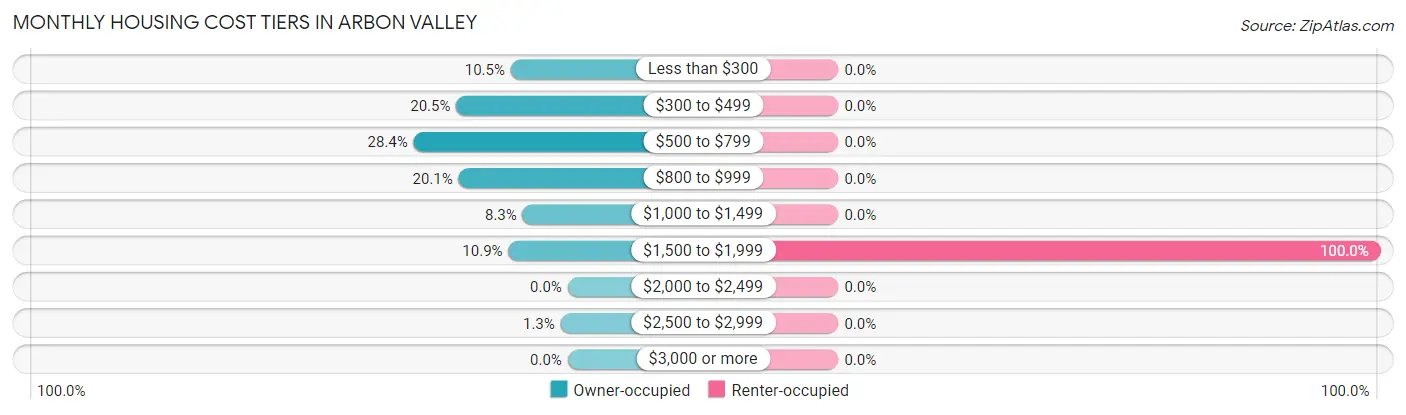
| Monthly Cost | Owner-occupied | Renter-occupied |
| Less than $300 | 24 (10.5%) | 0 (0.0%) |
| $300 to $499 | 47 (20.5%) | 0 (0.0%) |
| $500 to $799 | 65 (28.4%) | 0 (0.0%) |
| $800 to $999 | 46 (20.1%) | 0 (0.0%) |
| $1,000 to $1,499 | 19 (8.3%) | 0 (0.0%) |
| $1,500 to $1,999 | 25 (10.9%) | 8 (100.0%) |
| $2,000 to $2,499 | 0 (0.0%) | 0 (0.0%) |
| $2,500 to $2,999 | 3 (1.3%) | 0 (0.0%) |
| $3,000 or more | 0 (0.0%) | 0 (0.0%) |
| Total | 229 (100.0%) | 8 (100.0%) |
Physical Housing Characteristics in Arbon Valley
Housing Structures in Arbon Valley
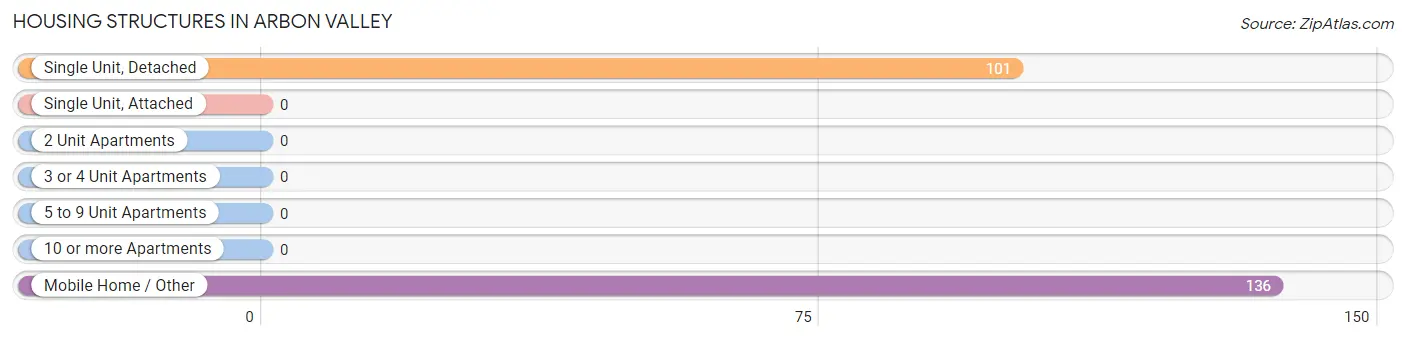
| Structure Type | # Housing Units | % Housing Units |
| Single Unit, Detached | 101 | 42.6% |
| Single Unit, Attached | 0 | 0.0% |
| 2 Unit Apartments | 0 | 0.0% |
| 3 or 4 Unit Apartments | 0 | 0.0% |
| 5 to 9 Unit Apartments | 0 | 0.0% |
| 10 or more Apartments | 0 | 0.0% |
| Mobile Home / Other | 136 | 57.4% |
| Total | 237 | 100.0% |
Housing Structures by Occupancy in Arbon Valley
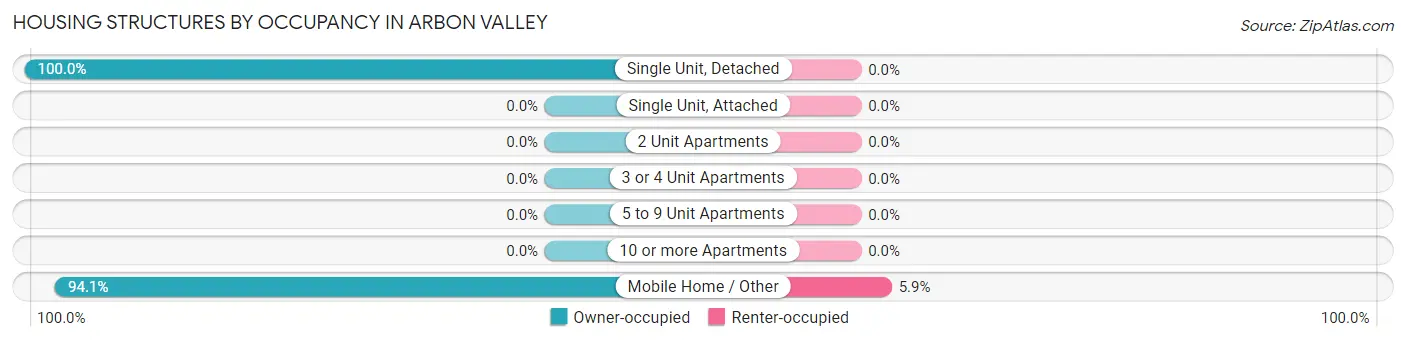
| Structure Type | Owner-occupied | Renter-occupied |
| Single Unit, Detached | 101 (100.0%) | 0 (0.0%) |
| Single Unit, Attached | 0 (0.0%) | 0 (0.0%) |
| 2 Unit Apartments | 0 (0.0%) | 0 (0.0%) |
| 3 or 4 Unit Apartments | 0 (0.0%) | 0 (0.0%) |
| 5 to 9 Unit Apartments | 0 (0.0%) | 0 (0.0%) |
| 10 or more Apartments | 0 (0.0%) | 0 (0.0%) |
| Mobile Home / Other | 128 (94.1%) | 8 (5.9%) |
| Total | 229 (96.6%) | 8 (3.4%) |
Housing Structures by Number of Rooms in Arbon Valley
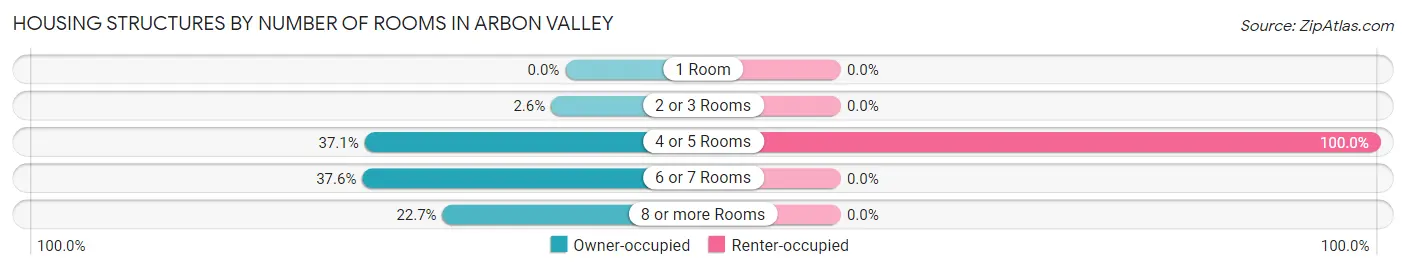
| Number of Rooms | Owner-occupied | Renter-occupied |
| 1 Room | 0 (0.0%) | 0 (0.0%) |
| 2 or 3 Rooms | 6 (2.6%) | 0 (0.0%) |
| 4 or 5 Rooms | 85 (37.1%) | 8 (100.0%) |
| 6 or 7 Rooms | 86 (37.6%) | 0 (0.0%) |
| 8 or more Rooms | 52 (22.7%) | 0 (0.0%) |
| Total | 229 (100.0%) | 8 (100.0%) |
Housing Structure by Heating Type in Arbon Valley
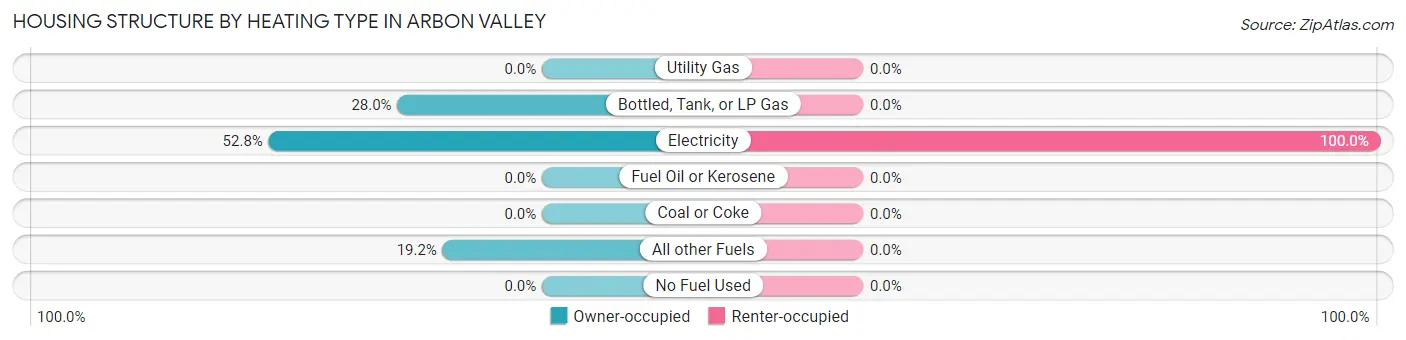
| Heating Type | Owner-occupied | Renter-occupied |
| Utility Gas | 0 (0.0%) | 0 (0.0%) |
| Bottled, Tank, or LP Gas | 64 (28.0%) | 0 (0.0%) |
| Electricity | 121 (52.8%) | 8 (100.0%) |
| Fuel Oil or Kerosene | 0 (0.0%) | 0 (0.0%) |
| Coal or Coke | 0 (0.0%) | 0 (0.0%) |
| All other Fuels | 44 (19.2%) | 0 (0.0%) |
| No Fuel Used | 0 (0.0%) | 0 (0.0%) |
| Total | 229 (100.0%) | 8 (100.0%) |
Household Vehicle Usage in Arbon Valley
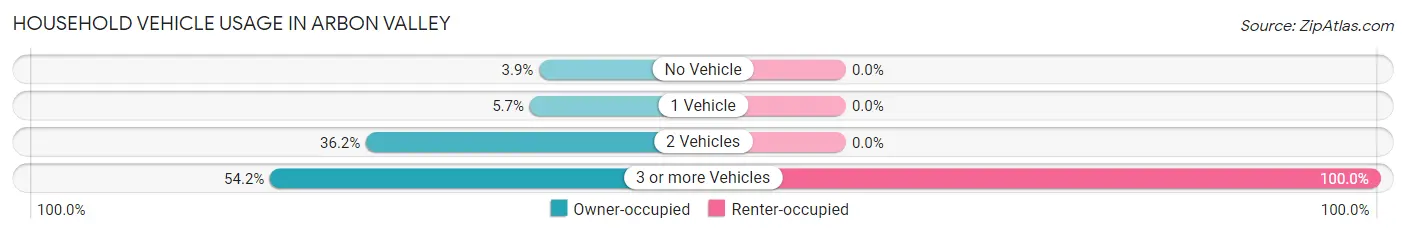
| Vehicles per Household | Owner-occupied | Renter-occupied |
| No Vehicle | 9 (3.9%) | 0 (0.0%) |
| 1 Vehicle | 13 (5.7%) | 0 (0.0%) |
| 2 Vehicles | 83 (36.2%) | 0 (0.0%) |
| 3 or more Vehicles | 124 (54.1%) | 8 (100.0%) |
| Total | 229 (100.0%) | 8 (100.0%) |
Real Estate & Mortgages in Arbon Valley
Real Estate and Mortgage Overview in Arbon Valley
| Characteristic | Without Mortgage | With Mortgage |
| Housing Units | 121 | 108 |
| Median Property Value | $132,100 | $172,200 |
| Median Household Income | $62,292 | $7 |
| Monthly Housing Costs | $463 | $0 |
| Real Estate Taxes | $846 | $6 |
Property Value by Mortgage Status in Arbon Valley
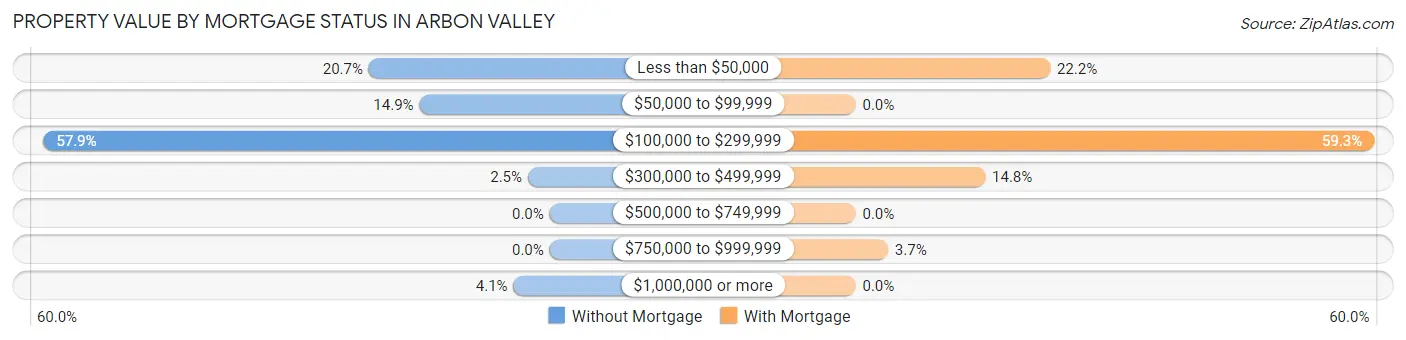
| Property Value | Without Mortgage | With Mortgage |
| Less than $50,000 | 25 (20.7%) | 24 (22.2%) |
| $50,000 to $99,999 | 18 (14.9%) | 0 (0.0%) |
| $100,000 to $299,999 | 70 (57.9%) | 64 (59.3%) |
| $300,000 to $499,999 | 3 (2.5%) | 16 (14.8%) |
| $500,000 to $749,999 | 0 (0.0%) | 0 (0.0%) |
| $750,000 to $999,999 | 0 (0.0%) | 4 (3.7%) |
| $1,000,000 or more | 5 (4.1%) | 0 (0.0%) |
| Total | 121 (100.0%) | 108 (100.0%) |
Household Income by Mortgage Status in Arbon Valley
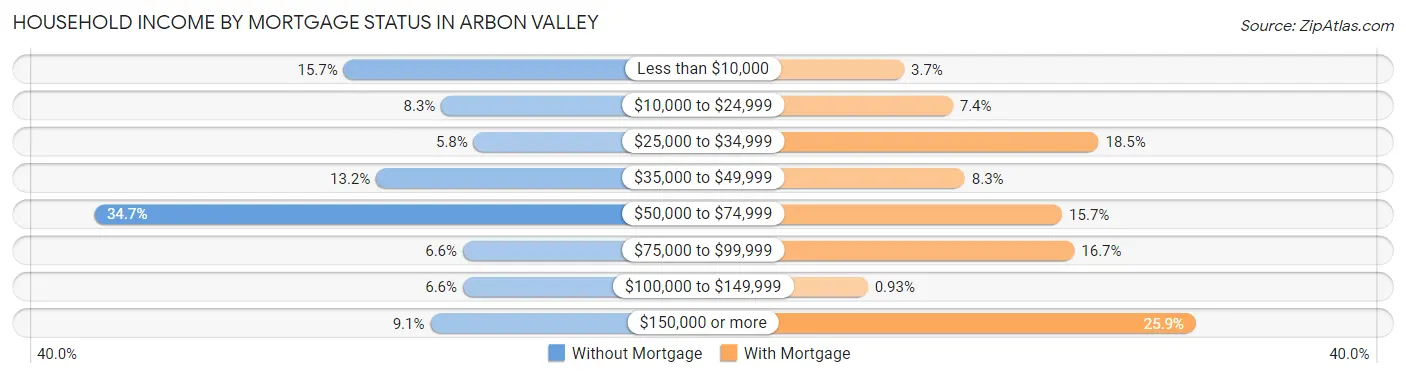
| Household Income | Without Mortgage | With Mortgage |
| Less than $10,000 | 19 (15.7%) | 4 (3.7%) |
| $10,000 to $24,999 | 10 (8.3%) | 8 (7.4%) |
| $25,000 to $34,999 | 7 (5.8%) | 20 (18.5%) |
| $35,000 to $49,999 | 16 (13.2%) | 9 (8.3%) |
| $50,000 to $74,999 | 42 (34.7%) | 17 (15.7%) |
| $75,000 to $99,999 | 8 (6.6%) | 18 (16.7%) |
| $100,000 to $149,999 | 8 (6.6%) | 1 (0.9%) |
| $150,000 or more | 11 (9.1%) | 28 (25.9%) |
| Total | 121 (100.0%) | 108 (100.0%) |
Property Value to Household Income Ratio in Arbon Valley
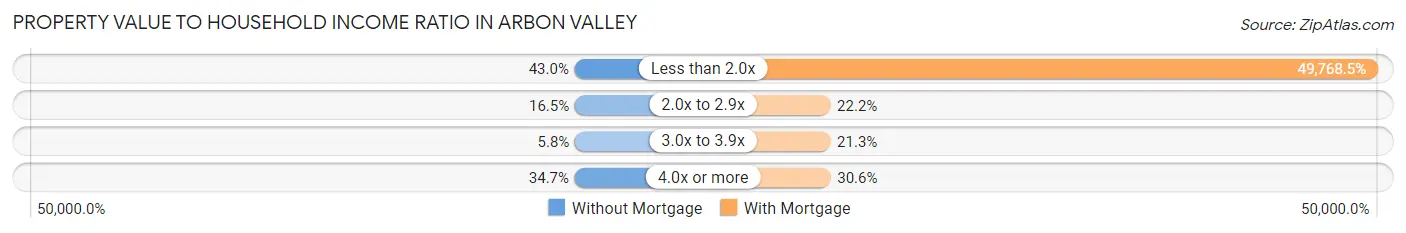
| Value-to-Income Ratio | Without Mortgage | With Mortgage |
| Less than 2.0x | 52 (43.0%) | 53,750 (49,768.5%) |
| 2.0x to 2.9x | 20 (16.5%) | 24 (22.2%) |
| 3.0x to 3.9x | 7 (5.8%) | 23 (21.3%) |
| 4.0x or more | 42 (34.7%) | 33 (30.6%) |
| Total | 121 (100.0%) | 108 (100.0%) |
Real Estate Taxes by Mortgage Status in Arbon Valley
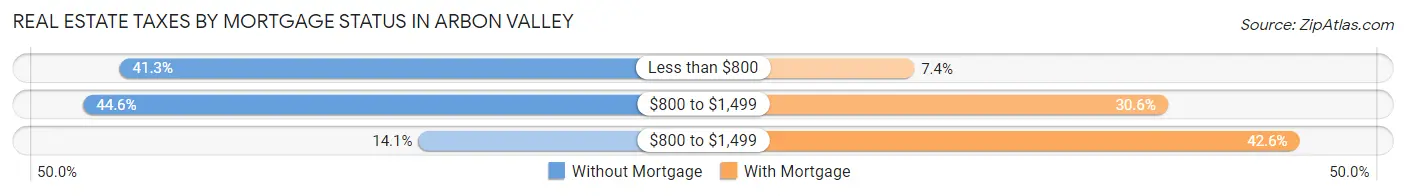
| Property Taxes | Without Mortgage | With Mortgage |
| Less than $800 | 50 (41.3%) | 8 (7.4%) |
| $800 to $1,499 | 54 (44.6%) | 33 (30.6%) |
| $800 to $1,499 | 17 (14.1%) | 46 (42.6%) |
| Total | 121 (100.0%) | 108 (100.0%) |
Health & Disability in Arbon Valley
Health Insurance Coverage by Age in Arbon Valley
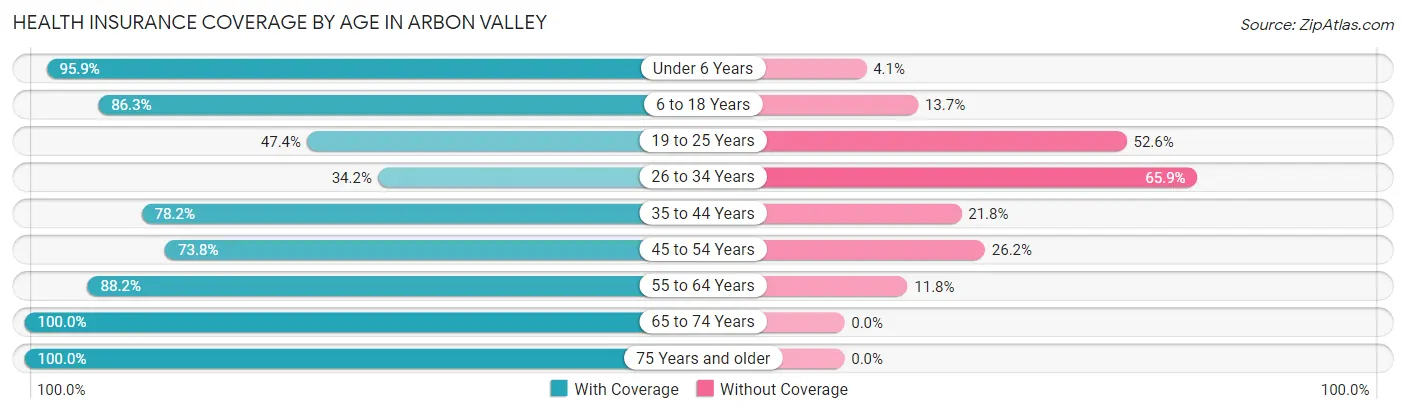
| Age Bracket | With Coverage | Without Coverage |
| Under 6 Years | 47 (95.9%) | 2 (4.1%) |
| 6 to 18 Years | 157 (86.3%) | 25 (13.7%) |
| 19 to 25 Years | 18 (47.4%) | 20 (52.6%) |
| 26 to 34 Years | 14 (34.2%) | 27 (65.8%) |
| 35 to 44 Years | 86 (78.2%) | 24 (21.8%) |
| 45 to 54 Years | 76 (73.8%) | 27 (26.2%) |
| 55 to 64 Years | 120 (88.2%) | 16 (11.8%) |
| 65 to 74 Years | 75 (100.0%) | 0 (0.0%) |
| 75 Years and older | 50 (100.0%) | 0 (0.0%) |
| Total | 643 (82.0%) | 141 (18.0%) |
Health Insurance Coverage by Citizenship Status in Arbon Valley
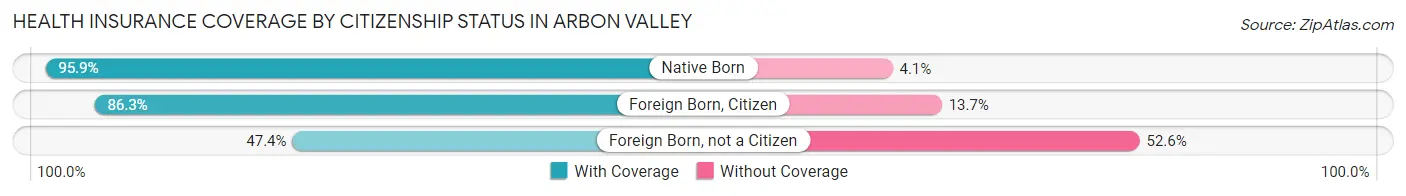
| Citizenship Status | With Coverage | Without Coverage |
| Native Born | 47 (95.9%) | 2 (4.1%) |
| Foreign Born, Citizen | 157 (86.3%) | 25 (13.7%) |
| Foreign Born, not a Citizen | 18 (47.4%) | 20 (52.6%) |
Health Insurance Coverage by Household Income in Arbon Valley
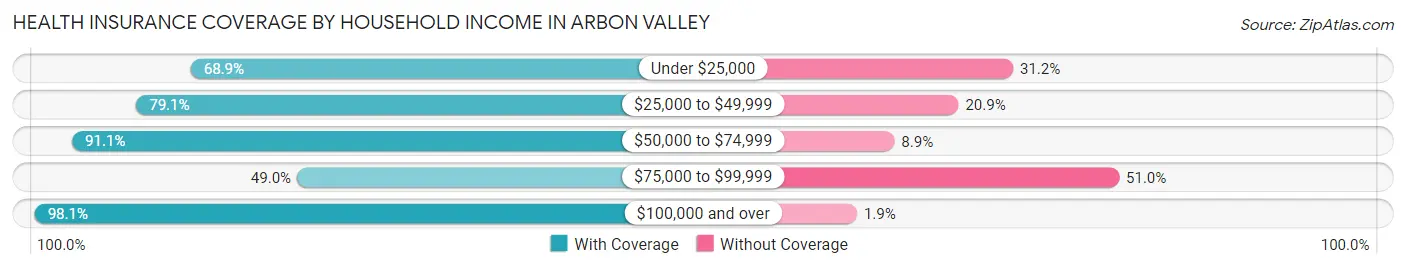
| Household Income | With Coverage | Without Coverage |
| Under $25,000 | 84 (68.9%) | 38 (31.1%) |
| $25,000 to $49,999 | 102 (79.1%) | 27 (20.9%) |
| $50,000 to $74,999 | 194 (91.1%) | 19 (8.9%) |
| $75,000 to $99,999 | 48 (49.0%) | 50 (51.0%) |
| $100,000 and over | 206 (98.1%) | 4 (1.9%) |
Public vs Private Health Insurance Coverage by Age in Arbon Valley
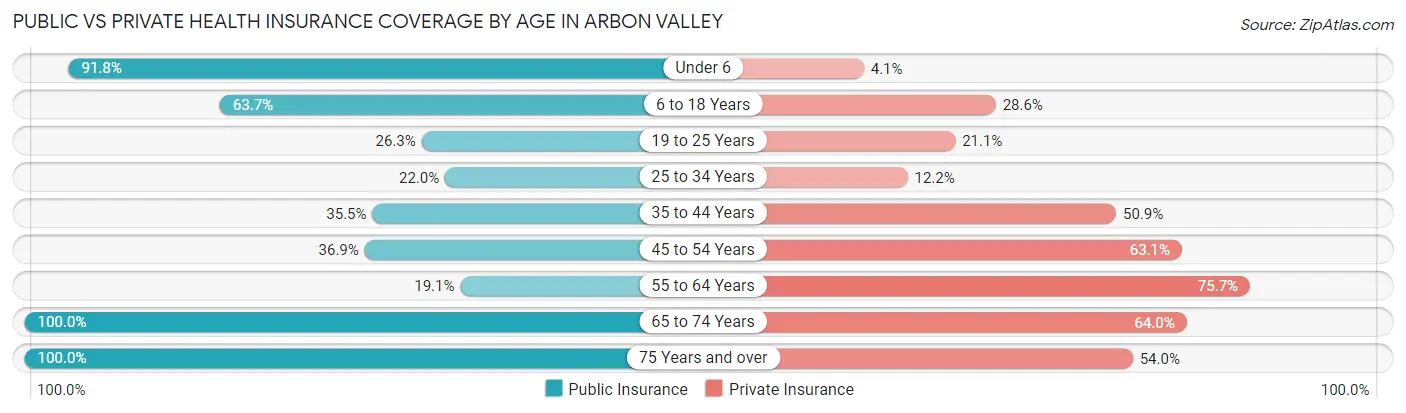
| Age Bracket | Public Insurance | Private Insurance |
| Under 6 | 45 (91.8%) | 2 (4.1%) |
| 6 to 18 Years | 116 (63.7%) | 52 (28.6%) |
| 19 to 25 Years | 10 (26.3%) | 8 (21.0%) |
| 25 to 34 Years | 9 (22.0%) | 5 (12.2%) |
| 35 to 44 Years | 39 (35.4%) | 56 (50.9%) |
| 45 to 54 Years | 38 (36.9%) | 65 (63.1%) |
| 55 to 64 Years | 26 (19.1%) | 103 (75.7%) |
| 65 to 74 Years | 75 (100.0%) | 48 (64.0%) |
| 75 Years and over | 50 (100.0%) | 27 (54.0%) |
| Total | 408 (52.0%) | 366 (46.7%) |
Disability Status by Sex by Age in Arbon Valley
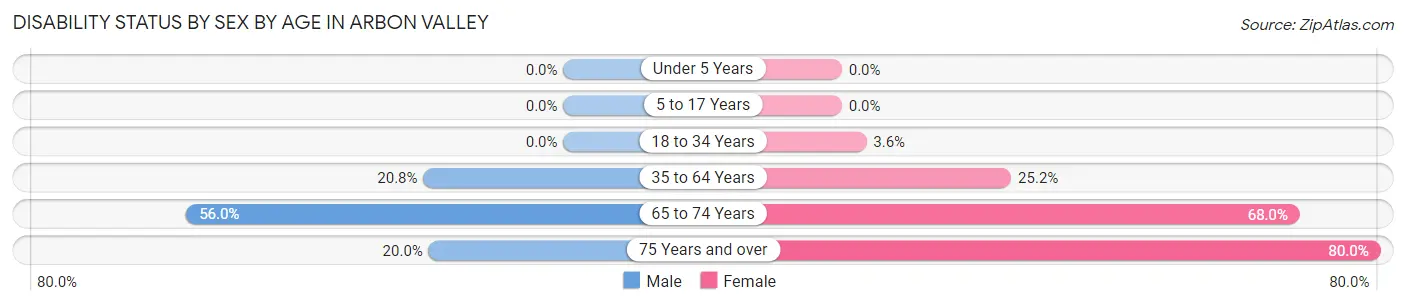
| Age Bracket | Male | Female |
| Under 5 Years | 0 (0.0%) | 0 (0.0%) |
| 5 to 17 Years | 0 (0.0%) | 0 (0.0%) |
| 18 to 34 Years | 0 (0.0%) | 2 (3.6%) |
| 35 to 64 Years | 37 (20.8%) | 43 (25.2%) |
| 65 to 74 Years | 14 (56.0%) | 34 (68.0%) |
| 75 Years and over | 3 (20.0%) | 28 (80.0%) |
Disability Class by Sex by Age in Arbon Valley
Disability Class: Hearing Difficulty
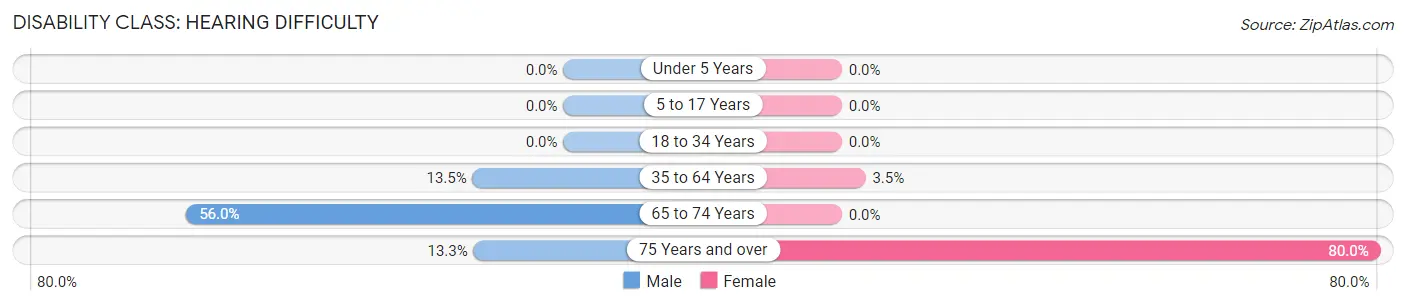
| Age Bracket | Male | Female |
| Under 5 Years | 0 (0.0%) | 0 (0.0%) |
| 5 to 17 Years | 0 (0.0%) | 0 (0.0%) |
| 18 to 34 Years | 0 (0.0%) | 0 (0.0%) |
| 35 to 64 Years | 24 (13.5%) | 6 (3.5%) |
| 65 to 74 Years | 14 (56.0%) | 0 (0.0%) |
| 75 Years and over | 2 (13.3%) | 28 (80.0%) |
Disability Class: Vision Difficulty
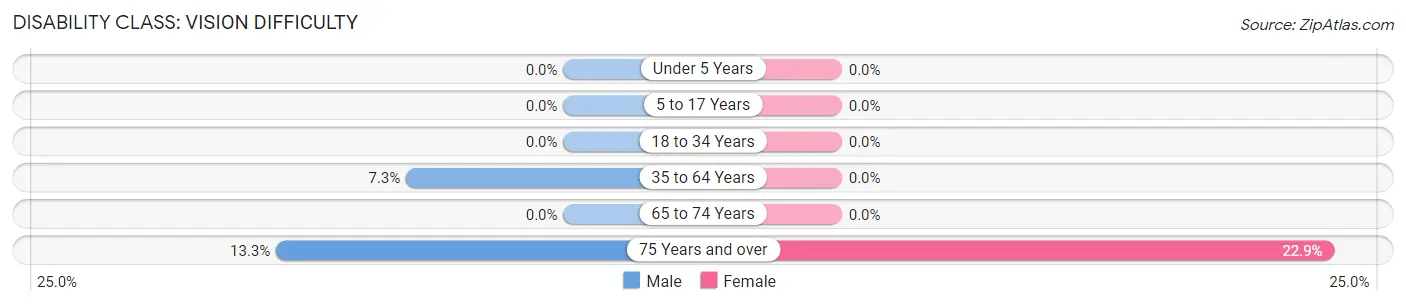
| Age Bracket | Male | Female |
| Under 5 Years | 0 (0.0%) | 0 (0.0%) |
| 5 to 17 Years | 0 (0.0%) | 0 (0.0%) |
| 18 to 34 Years | 0 (0.0%) | 0 (0.0%) |
| 35 to 64 Years | 13 (7.3%) | 0 (0.0%) |
| 65 to 74 Years | 0 (0.0%) | 0 (0.0%) |
| 75 Years and over | 2 (13.3%) | 8 (22.9%) |
Disability Class: Cognitive Difficulty
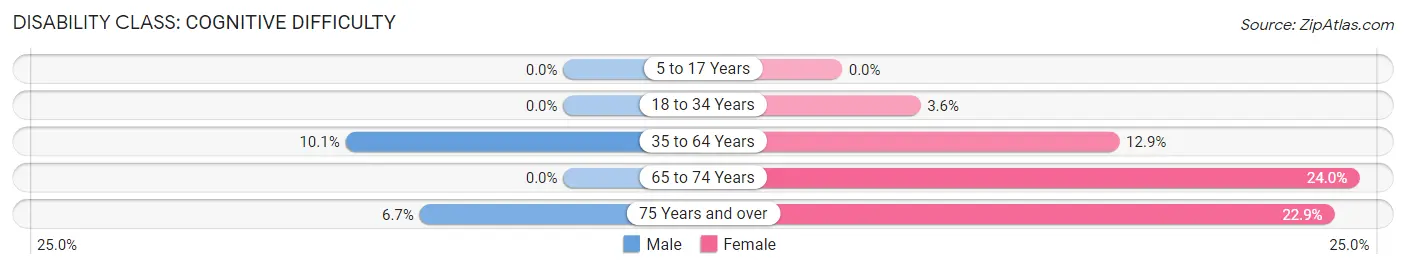
| Age Bracket | Male | Female |
| 5 to 17 Years | 0 (0.0%) | 0 (0.0%) |
| 18 to 34 Years | 0 (0.0%) | 2 (3.6%) |
| 35 to 64 Years | 18 (10.1%) | 22 (12.9%) |
| 65 to 74 Years | 0 (0.0%) | 12 (24.0%) |
| 75 Years and over | 1 (6.7%) | 8 (22.9%) |
Disability Class: Ambulatory Difficulty
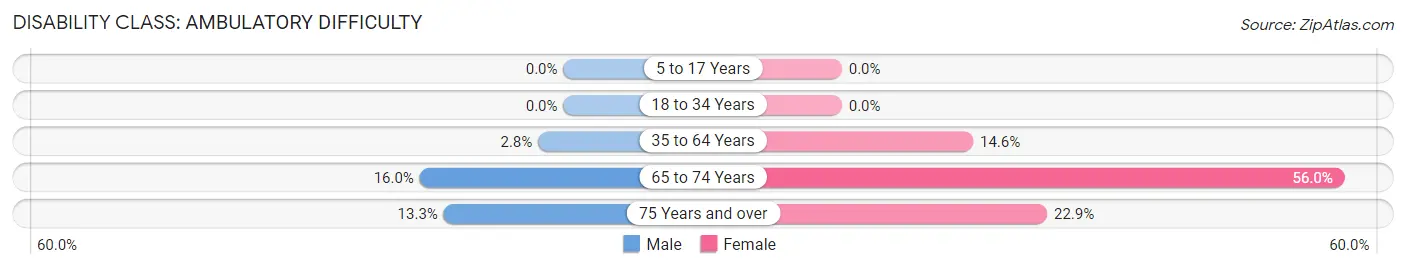
| Age Bracket | Male | Female |
| 5 to 17 Years | 0 (0.0%) | 0 (0.0%) |
| 18 to 34 Years | 0 (0.0%) | 0 (0.0%) |
| 35 to 64 Years | 5 (2.8%) | 25 (14.6%) |
| 65 to 74 Years | 4 (16.0%) | 28 (56.0%) |
| 75 Years and over | 2 (13.3%) | 8 (22.9%) |
Disability Class: Self-Care Difficulty
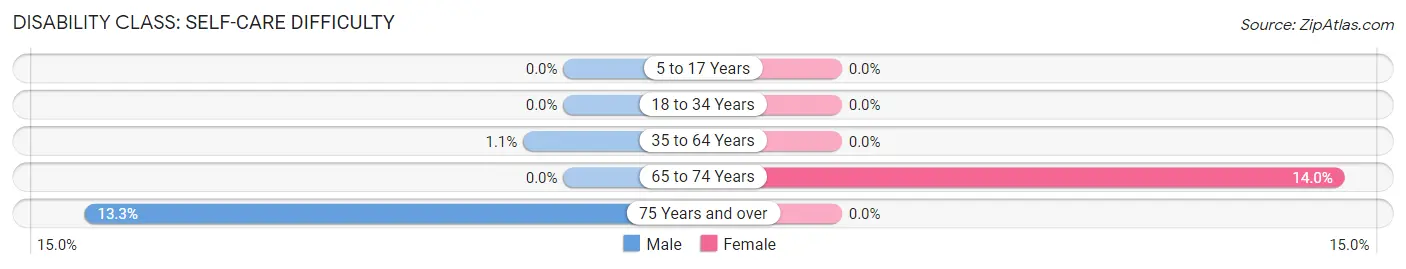
| Age Bracket | Male | Female |
| 5 to 17 Years | 0 (0.0%) | 0 (0.0%) |
| 18 to 34 Years | 0 (0.0%) | 0 (0.0%) |
| 35 to 64 Years | 2 (1.1%) | 0 (0.0%) |
| 65 to 74 Years | 0 (0.0%) | 7 (14.0%) |
| 75 Years and over | 2 (13.3%) | 0 (0.0%) |
Technology Access in Arbon Valley
Computing Device Access in Arbon Valley
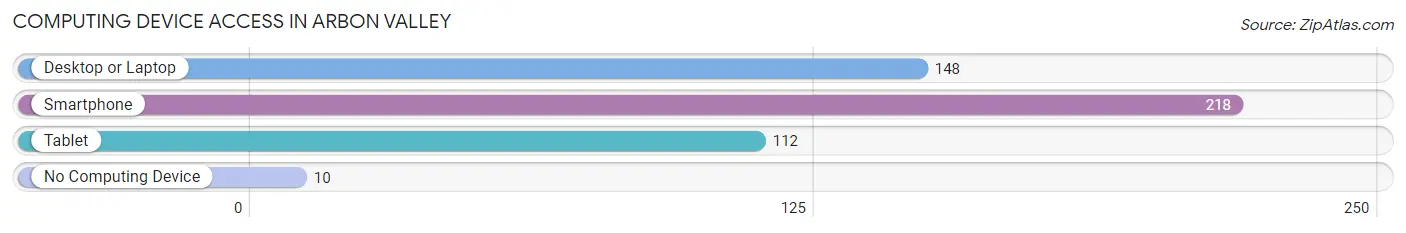
| Device Type | # Households | % Households |
| Desktop or Laptop | 148 | 62.5% |
| Smartphone | 218 | 92.0% |
| Tablet | 112 | 47.3% |
| No Computing Device | 10 | 4.2% |
| Total | 237 | 100.0% |
Internet Access in Arbon Valley
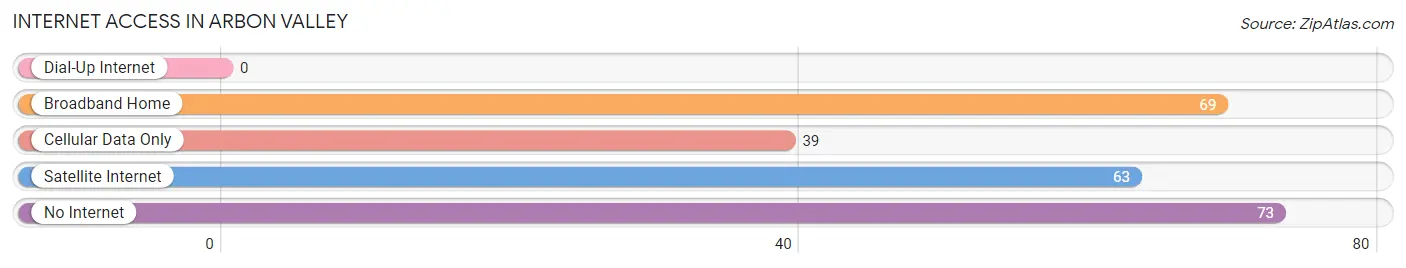
| Internet Type | # Households | % Households |
| Dial-Up Internet | 0 | 0.0% |
| Broadband Home | 69 | 29.1% |
| Cellular Data Only | 39 | 16.5% |
| Satellite Internet | 63 | 26.6% |
| No Internet | 73 | 30.8% |
| Total | 237 | 100.0% |
Arbon Valley Summary
Arbon Valley is a small unincorporated community located in the southeastern corner of Idaho, in the United States. It is situated in the Snake River Plain, a large area of flat land that stretches across the state. The valley is surrounded by the Owyhee Mountains to the east, the Bruneau Mountains to the south, and the Snake River to the west. The valley is home to a population of approximately 500 people, and is the only incorporated community in the county.
History
Arbon Valley was first settled in the late 1800s by homesteaders who were attracted to the area by its fertile soil and abundant water. The first settlers were mostly farmers and ranchers, and the area quickly became known for its agricultural production. The town was officially incorporated in 1909, and the first post office was established in 1910.
The town grew steadily throughout the early 20th century, and by the 1950s it had become a thriving agricultural center. The town was home to several businesses, including a general store, a bank, a hotel, and a movie theater.
Geography
Arbon Valley is located in the southeastern corner of Idaho, in the Snake River Plain. The valley is surrounded by the Owyhee Mountains to the east, the Bruneau Mountains to the south, and the Snake River to the west. The valley is approximately 10 miles long and 5 miles wide, and is situated at an elevation of 4,000 feet.
The climate in Arbon Valley is semi-arid, with hot summers and cold winters. The average annual temperature is around 50 degrees Fahrenheit, and the average annual precipitation is around 10 inches.
Economy
The economy of Arbon Valley is largely based on agriculture. The area is known for its production of potatoes, wheat, barley, and alfalfa. The town is also home to several small businesses, including a general store, a bank, a hotel, and a movie theater.
Demographics
As of the 2010 census, the population of Arbon Valley was 498. The racial makeup of the town was 95.2% White, 0.2% African American, 0.4% Native American, 0.2% Asian, 0.2% Pacific Islander, 0.4% from other races, and 3.6% from two or more races. Hispanic or Latino of any race were 2.2% of the population.
The median household income in Arbon Valley was $37,500, and the median family income was $41,250. The per capita income was $17,500. About 11.2% of families and 13.2% of the population were below the poverty line, including 16.2% of those under age 18 and 8.2% of those age 65 or over.
Common Questions
What is Per Capita Income in Arbon Valley?
Per Capita income in Arbon Valley is $19,653.
What is the Median Family Income in Arbon Valley?
Median Family Income in Arbon Valley is $60,625.
What is the Median Household income in Arbon Valley?
Median Household Income in Arbon Valley is $57,841.
What is Inequality or Gini Index in Arbon Valley?
Inequality or Gini Index in Arbon Valley is 0.44.
What is the Total Population of Arbon Valley?
Total Population of Arbon Valley is 784.
What is the Total Male Population of Arbon Valley?
Total Male Population of Arbon Valley is 385.
What is the Total Female Population of Arbon Valley?
Total Female Population of Arbon Valley is 399.
What is the Ratio of Males per 100 Females in Arbon Valley?
There are 96.49 Males per 100 Females in Arbon Valley.
What is the Ratio of Females per 100 Males in Arbon Valley?
There are 103.64 Females per 100 Males in Arbon Valley.
What is the Median Population Age in Arbon Valley?
Median Population Age in Arbon Valley is 42.9 Years.
What is the Average Family Size in Arbon Valley
Average Family Size in Arbon Valley is 4.6 People.
What is the Average Household Size in Arbon Valley
Average Household Size in Arbon Valley is 3.3 People.
How Large is the Labor Force in Arbon Valley?
There are 362 People in the Labor Forcein in Arbon Valley.
What is the Percentage of People in the Labor Force in Arbon Valley?
59.5% of People are in the Labor Force in Arbon Valley.
What is the Unemployment Rate in Arbon Valley?
Unemployment Rate in Arbon Valley is 12.4%.