Ucon, ID Map & Demographics
Ucon Map
Ucon Overview
$31,374
PER CAPITA INCOME
$101,875
AVG FAMILY INCOME
$81,771
AVG HOUSEHOLD INCOME
36.6%
WAGE / INCOME GAP [ % ]
63.4¢/ $1
WAGE / INCOME GAP [ $ ]
0.35
INEQUALITY / GINI INDEX
1,631
TOTAL POPULATION
882
MALE POPULATION
749
FEMALE POPULATION
117.76
MALES / 100 FEMALES
84.92
FEMALES / 100 MALES
34.8
MEDIAN AGE
3.6
AVG FAMILY SIZE
3.2
AVG HOUSEHOLD SIZE
866
LABOR FORCE [ PEOPLE ]
72.2%
PERCENT IN LABOR FORCE
5.1%
UNEMPLOYMENT RATE
Ucon Zip Codes
Ucon Area Codes
Income in Ucon
Income Overview in Ucon
Per Capita Income in Ucon is $31,374, while median incomes of families and households are $101,875 and $81,771 respectively.
| Characteristic | Number | Measure |
| Per Capita Income | 1,631 | $31,374 |
| Median Family Income | 403 | $101,875 |
| Mean Family Income | 403 | $108,438 |
| Median Household Income | 503 | $81,771 |
| Mean Household Income | 503 | $97,038 |
| Income Deficit | 403 | $0 |
| Wage / Income Gap (%) | 1,631 | 36.58% |
| Wage / Income Gap ($) | 1,631 | 63.42¢ per $1 |
| Gini / Inequality Index | 1,631 | 0.35 |
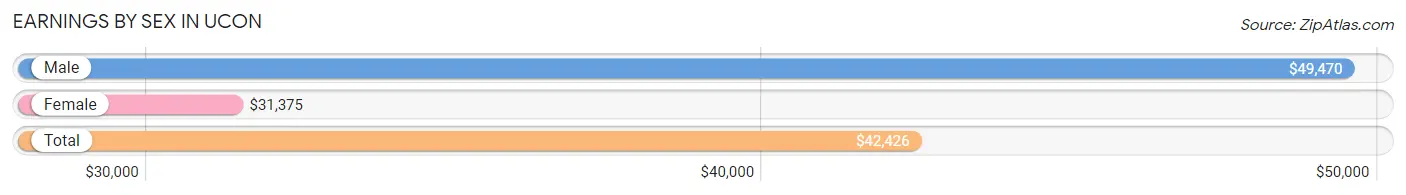
Earnings by Sex in Ucon
Average Earnings in Ucon are $42,426, $49,470 for men and $31,375 for women, a difference of 36.6%.
| Sex | Number | Average Earnings |
| Male | 480 (54.5%) | $49,470 |
| Female | 401 (45.5%) | $31,375 |
| Total | 881 (100.0%) | $42,426 |
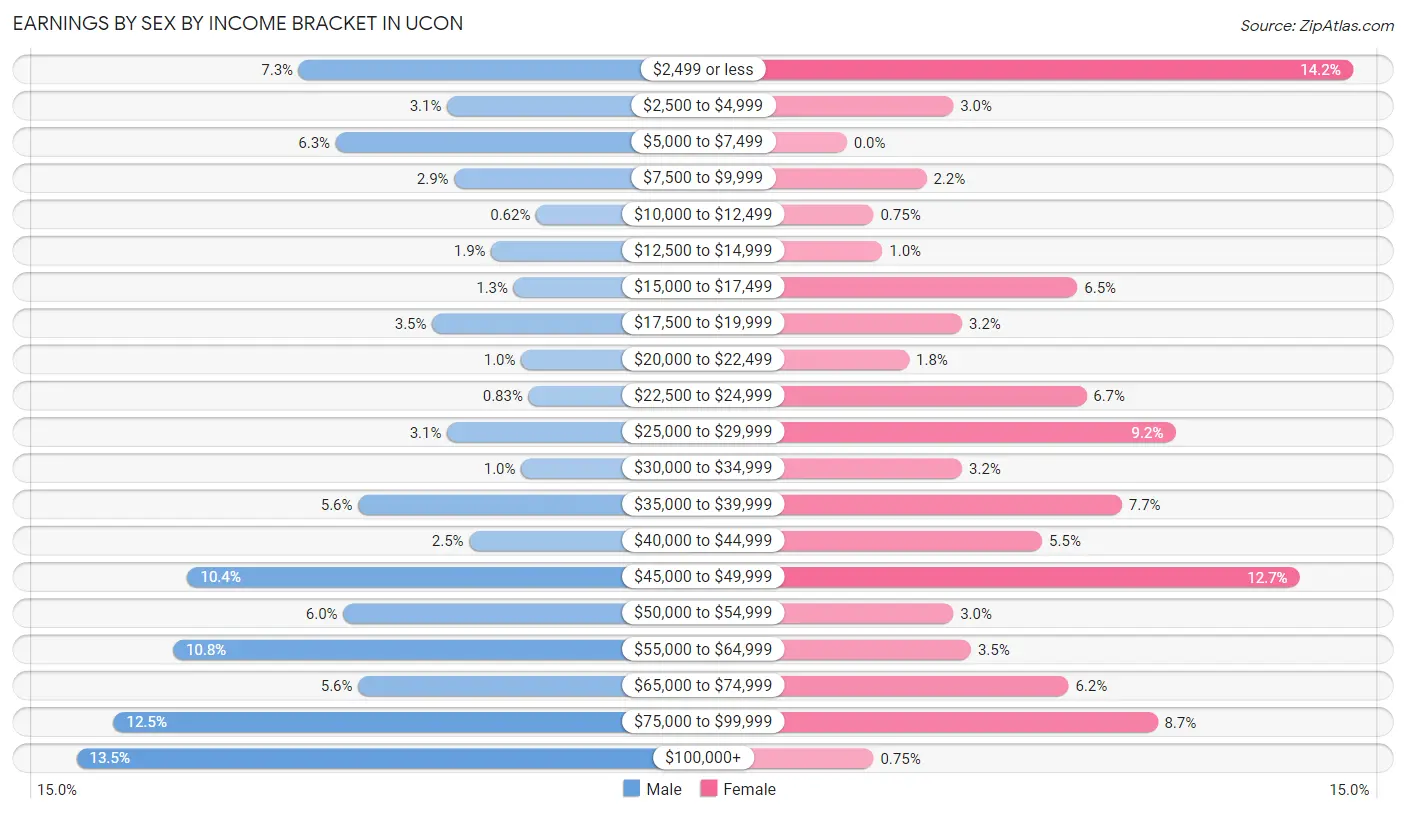
Earnings by Sex by Income Bracket in Ucon
The most common earnings brackets in Ucon are $100,000+ for men (65 | 13.5%) and $2,499 or less for women (57 | 14.2%).
| Income | Male | Female |
| $2,499 or less | 35 (7.3%) | 57 (14.2%) |
| $2,500 to $4,999 | 15 (3.1%) | 12 (3.0%) |
| $5,000 to $7,499 | 30 (6.2%) | 0 (0.0%) |
| $7,500 to $9,999 | 14 (2.9%) | 9 (2.2%) |
| $10,000 to $12,499 | 3 (0.6%) | 3 (0.7%) |
| $12,500 to $14,999 | 9 (1.9%) | 4 (1.0%) |
| $15,000 to $17,499 | 6 (1.3%) | 26 (6.5%) |
| $17,500 to $19,999 | 17 (3.5%) | 13 (3.2%) |
| $20,000 to $22,499 | 5 (1.0%) | 7 (1.8%) |
| $22,500 to $24,999 | 4 (0.8%) | 27 (6.7%) |
| $25,000 to $29,999 | 15 (3.1%) | 37 (9.2%) |
| $30,000 to $34,999 | 5 (1.0%) | 13 (3.2%) |
| $35,000 to $39,999 | 27 (5.6%) | 31 (7.7%) |
| $40,000 to $44,999 | 12 (2.5%) | 22 (5.5%) |
| $45,000 to $49,999 | 50 (10.4%) | 51 (12.7%) |
| $50,000 to $54,999 | 29 (6.0%) | 12 (3.0%) |
| $55,000 to $64,999 | 52 (10.8%) | 14 (3.5%) |
| $65,000 to $74,999 | 27 (5.6%) | 25 (6.2%) |
| $75,000 to $99,999 | 60 (12.5%) | 35 (8.7%) |
| $100,000+ | 65 (13.5%) | 3 (0.7%) |
| Total | 480 (100.0%) | 401 (100.0%) |
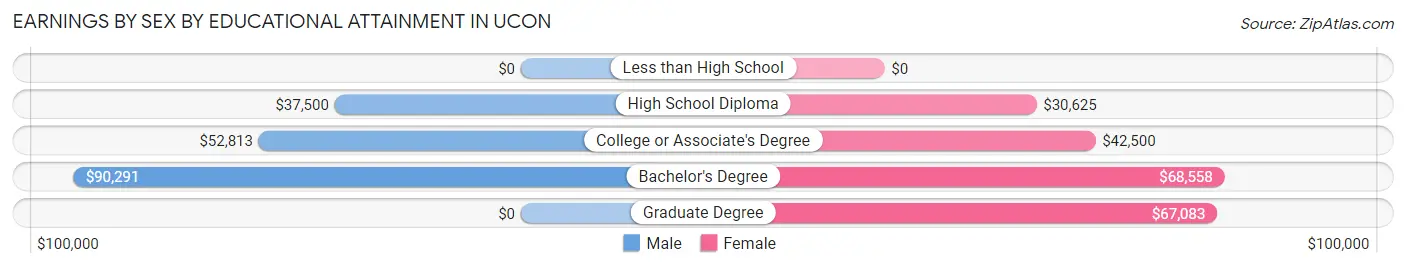
Earnings by Sex by Educational Attainment in Ucon
Average earnings in Ucon are $55,694 for men and $39,250 for women, a difference of 29.5%. Men with an educational attainment of bachelor's degree enjoy the highest average annual earnings of $90,291, while those with high school diploma education earn the least with $37,500. Women with an educational attainment of bachelor's degree earn the most with the average annual earnings of $68,558, while those with high school diploma education have the smallest earnings of $30,625.
| Educational Attainment | Male Income | Female Income |
| Less than High School | - | - |
| High School Diploma | $37,500 | $30,625 |
| College or Associate's Degree | $52,813 | $42,500 |
| Bachelor's Degree | $90,291 | $68,558 |
| Graduate Degree | - | - |
| Total | $55,694 | $39,250 |
Family Income in Ucon
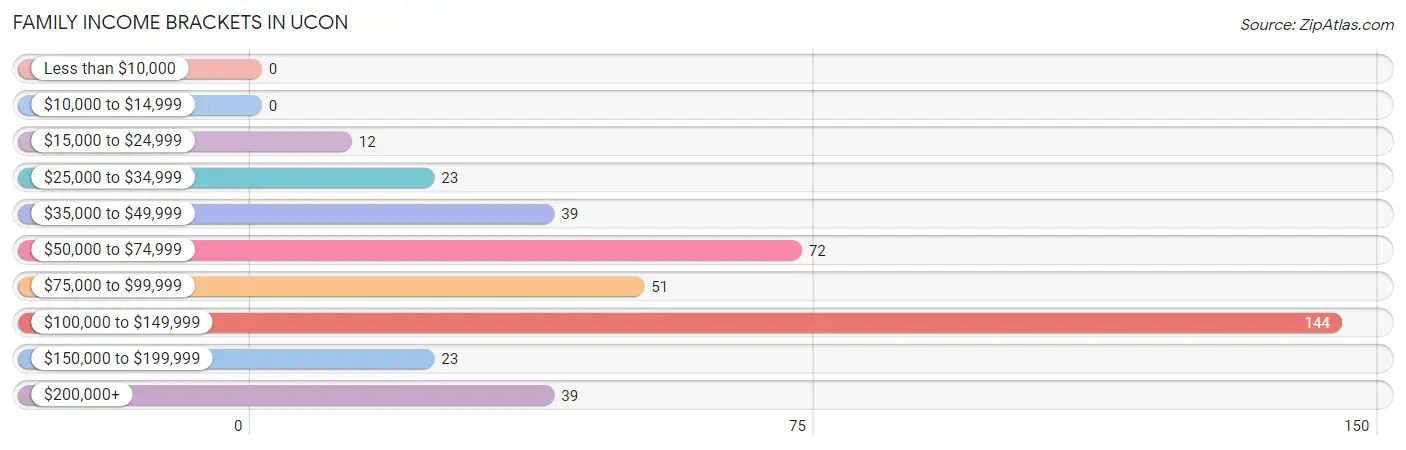
Family Income Brackets in Ucon
According to the Ucon family income data, there are 144 families falling into the $100,000 to $149,999 income range, which is the most common income bracket and makes up 35.7% of all families.
| Income Bracket | # Families | % Families |
| Less than $10,000 | 0 | 0.0% |
| $10,000 to $14,999 | 0 | 0.0% |
| $15,000 to $24,999 | 12 | 3.0% |
| $25,000 to $34,999 | 23 | 5.7% |
| $35,000 to $49,999 | 39 | 9.7% |
| $50,000 to $74,999 | 72 | 17.9% |
| $75,000 to $99,999 | 51 | 12.7% |
| $100,000 to $149,999 | 144 | 35.7% |
| $150,000 to $199,999 | 23 | 5.7% |
| $200,000+ | 39 | 9.7% |
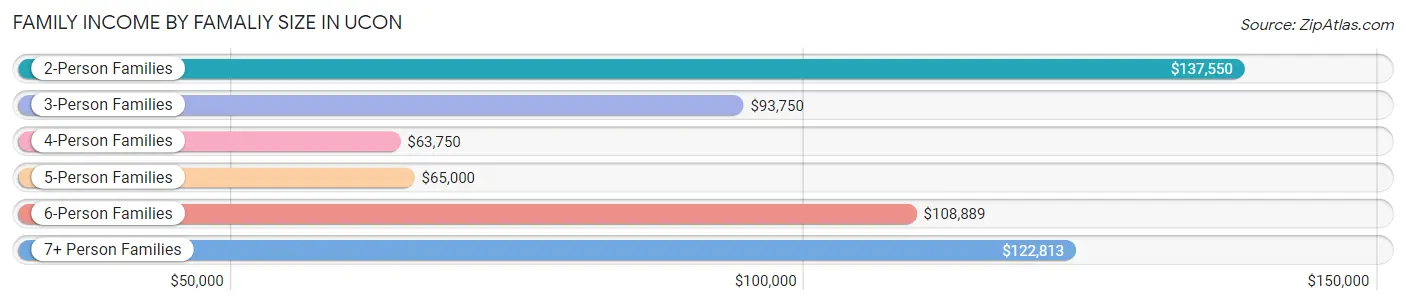
Family Income by Famaliy Size in Ucon
2-person families (154 | 38.2%) account for the highest median family income in Ucon with $137,550 per family, while 2-person families (154 | 38.2%) have the highest median income of $68,775 per family member.
| Income Bracket | # Families | Median Income |
| 2-Person Families | 154 (38.2%) | $137,550 |
| 3-Person Families | 100 (24.8%) | $93,750 |
| 4-Person Families | 53 (13.2%) | $63,750 |
| 5-Person Families | 52 (12.9%) | $65,000 |
| 6-Person Families | 30 (7.4%) | $108,889 |
| 7+ Person Families | 14 (3.5%) | $122,813 |
| Total | 403 (100.0%) | $101,875 |
Family Income by Number of Earners in Ucon
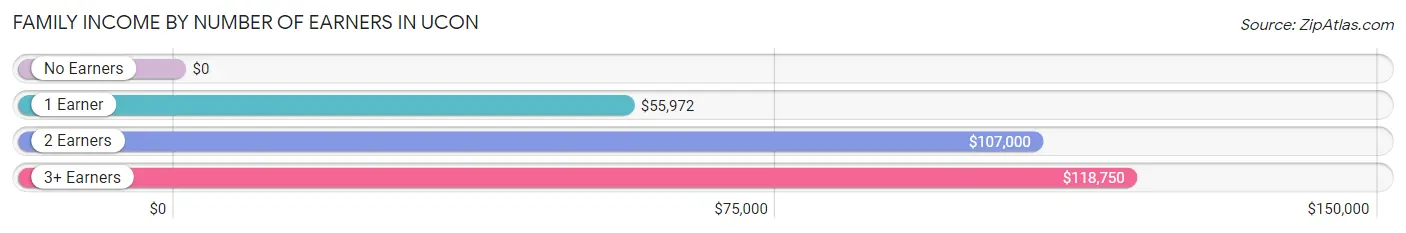
| Number of Earners | # Families | Median Income |
| No Earners | 36 (8.9%) | $0 |
| 1 Earner | 99 (24.6%) | $55,972 |
| 2 Earners | 194 (48.1%) | $107,000 |
| 3+ Earners | 74 (18.4%) | $118,750 |
| Total | 403 (100.0%) | $101,875 |
Household Income in Ucon
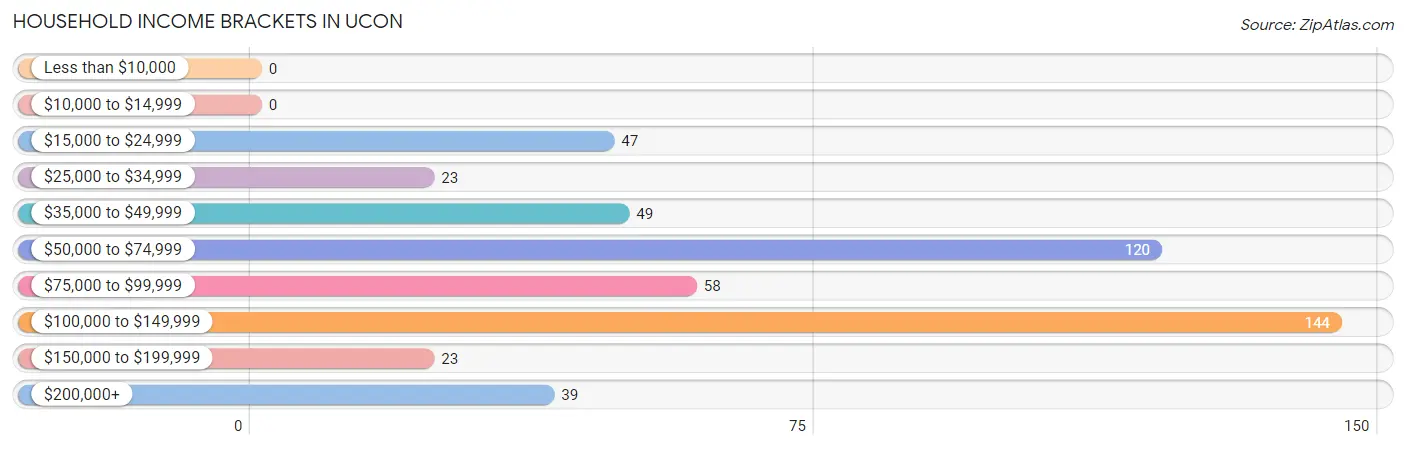
Household Income Brackets in Ucon
With 144 households falling in the category, the $100,000 to $149,999 income range is the most frequent in Ucon, accounting for 28.6% of all households.
| Income Bracket | # Households | % Households |
| Less than $10,000 | 0 | 0.0% |
| $10,000 to $14,999 | 0 | 0.0% |
| $15,000 to $24,999 | 47 | 9.3% |
| $25,000 to $34,999 | 23 | 4.6% |
| $35,000 to $49,999 | 49 | 9.7% |
| $50,000 to $74,999 | 120 | 23.9% |
| $75,000 to $99,999 | 58 | 11.5% |
| $100,000 to $149,999 | 144 | 28.6% |
| $150,000 to $199,999 | 23 | 4.6% |
| $200,000+ | 39 | 7.8% |
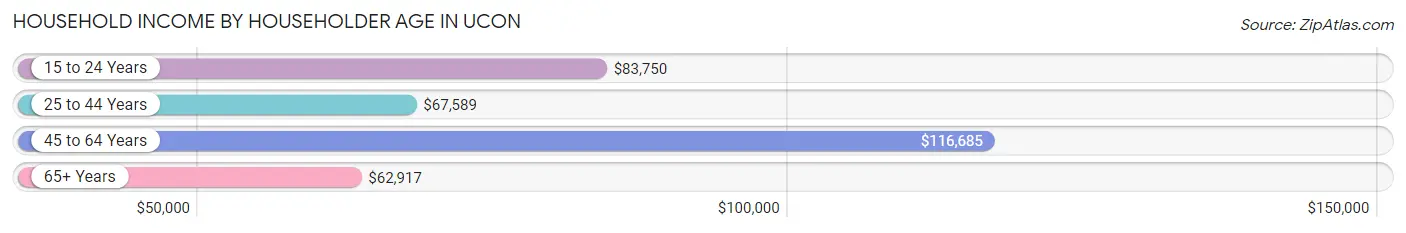
Household Income by Householder Age in Ucon
The median household income in Ucon is $81,771, with the highest median household income of $116,685 found in the 45 to 64 years age bracket for the primary householder. A total of 135 households (26.8%) fall into this category. Meanwhile, the 65+ years age bracket for the primary householder has the lowest median household income of $62,917, with 115 households (22.9%) in this group.
| Income Bracket | # Households | Median Income |
| 15 to 24 Years | 20 (4.0%) | $83,750 |
| 25 to 44 Years | 233 (46.3%) | $67,589 |
| 45 to 64 Years | 135 (26.8%) | $116,685 |
| 65+ Years | 115 (22.9%) | $62,917 |
| Total | 503 (100.0%) | $81,771 |
Poverty in Ucon
Income Below Poverty by Sex and Age in Ucon
With 5.2% poverty level for males and 9.5% for females among the residents of Ucon, 12 to 14 year old males and 5 year old females are the most vulnerable to poverty, with 16 males (19.1%) and 13 females (61.9%) in their respective age groups living below the poverty level.
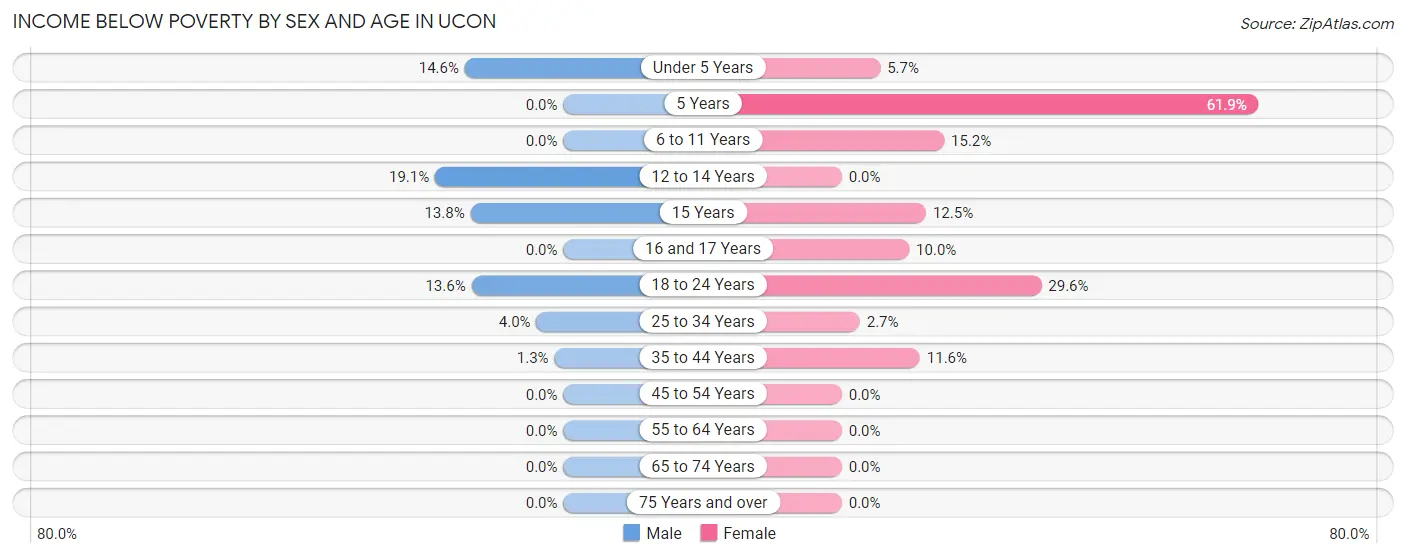
| Age Bracket | Male | Female |
| Under 5 Years | 6 (14.6%) | 2 (5.7%) |
| 5 Years | 0 (0.0%) | 13 (61.9%) |
| 6 to 11 Years | 0 (0.0%) | 12 (15.2%) |
| 12 to 14 Years | 16 (19.1%) | 0 (0.0%) |
| 15 Years | 4 (13.8%) | 2 (12.5%) |
| 16 and 17 Years | 0 (0.0%) | 5 (10.0%) |
| 18 to 24 Years | 15 (13.6%) | 16 (29.6%) |
| 25 to 34 Years | 3 (4.0%) | 2 (2.7%) |
| 35 to 44 Years | 2 (1.3%) | 19 (11.6%) |
| 45 to 54 Years | 0 (0.0%) | 0 (0.0%) |
| 55 to 64 Years | 0 (0.0%) | 0 (0.0%) |
| 65 to 74 Years | 0 (0.0%) | 0 (0.0%) |
| 75 Years and over | 0 (0.0%) | 0 (0.0%) |
| Total | 46 (5.2%) | 71 (9.5%) |
Income Above Poverty by Sex and Age in Ucon
According to the poverty statistics in Ucon, males aged 5 years and females aged 12 to 14 years are the age groups that are most secure financially, with 100.0% of males and 100.0% of females in these age groups living above the poverty line.
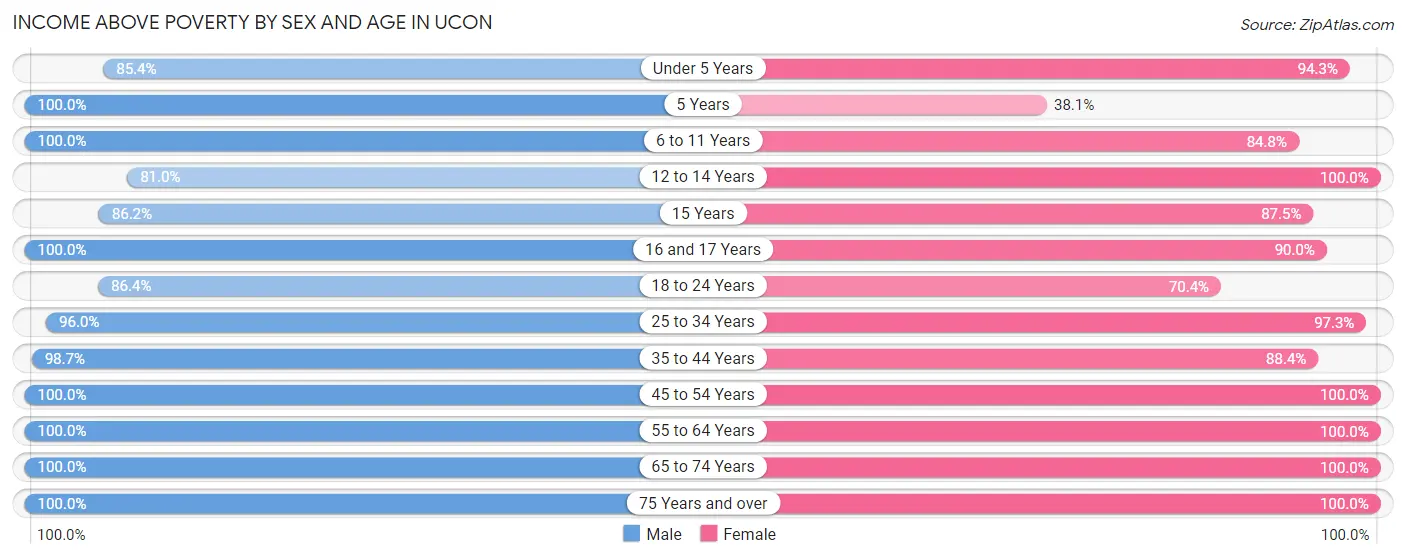
| Age Bracket | Male | Female |
| Under 5 Years | 35 (85.4%) | 33 (94.3%) |
| 5 Years | 19 (100.0%) | 8 (38.1%) |
| 6 to 11 Years | 85 (100.0%) | 67 (84.8%) |
| 12 to 14 Years | 68 (80.9%) | 17 (100.0%) |
| 15 Years | 25 (86.2%) | 14 (87.5%) |
| 16 and 17 Years | 24 (100.0%) | 45 (90.0%) |
| 18 to 24 Years | 95 (86.4%) | 38 (70.4%) |
| 25 to 34 Years | 72 (96.0%) | 73 (97.3%) |
| 35 to 44 Years | 150 (98.7%) | 145 (88.4%) |
| 45 to 54 Years | 107 (100.0%) | 84 (100.0%) |
| 55 to 64 Years | 47 (100.0%) | 61 (100.0%) |
| 65 to 74 Years | 70 (100.0%) | 55 (100.0%) |
| 75 Years and over | 39 (100.0%) | 33 (100.0%) |
| Total | 836 (94.8%) | 673 (90.5%) |
Income Below Poverty Among Married-Couple Families in Ucon
The poverty statistics for married-couple families in Ucon show that 1.4% or 5 of the total 368 families live below the poverty line. Families with 5 or more children have the highest poverty rate of 40.0%, comprising of 2 families. On the other hand, families with no children have the lowest poverty rate of 0.0%, which includes 0 families.
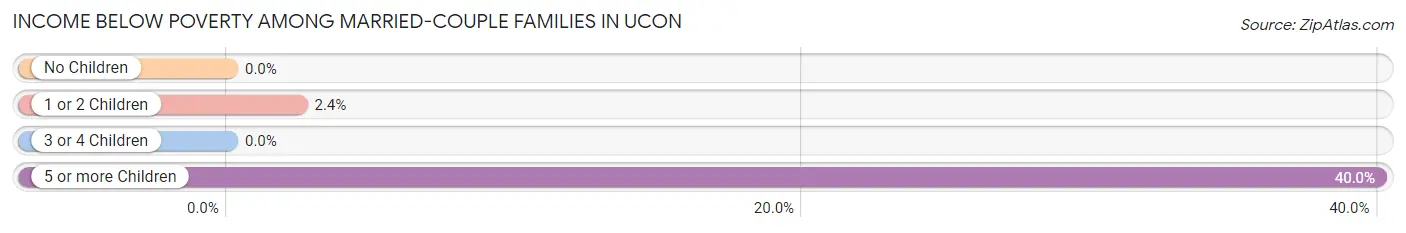
| Children | Above Poverty | Below Poverty |
| No Children | 187 (100.0%) | 0 (0.0%) |
| 1 or 2 Children | 121 (97.6%) | 3 (2.4%) |
| 3 or 4 Children | 52 (100.0%) | 0 (0.0%) |
| 5 or more Children | 3 (60.0%) | 2 (40.0%) |
| Total | 363 (98.6%) | 5 (1.4%) |
Income Below Poverty Among Single-Parent Households in Ucon
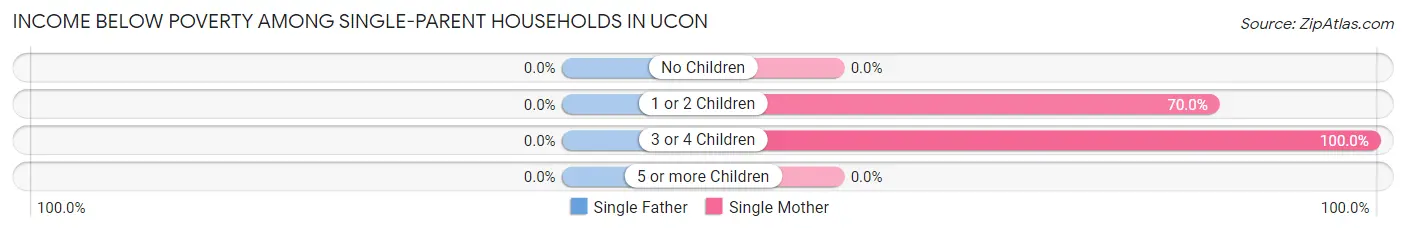
| Children | Single Father | Single Mother |
| No Children | 0 (0.0%) | 0 (0.0%) |
| 1 or 2 Children | 0 (0.0%) | 14 (70.0%) |
| 3 or 4 Children | 0 (0.0%) | 3 (100.0%) |
| 5 or more Children | 0 (0.0%) | 0 (0.0%) |
| Total | 0 (0.0%) | 17 (65.4%) |
Income Below Poverty Among Married-Couple vs Single-Parent Households in Ucon
The poverty data for Ucon shows that 5 of the married-couple family households (1.4%) and 17 of the single-parent households (48.6%) are living below the poverty level. Within the married-couple family households, those with 5 or more children have the highest poverty rate, with 2 households (40.0%) falling below the poverty line. Among the single-parent households, those with 3 or 4 children have the highest poverty rate, with 3 household (100.0%) living below poverty.
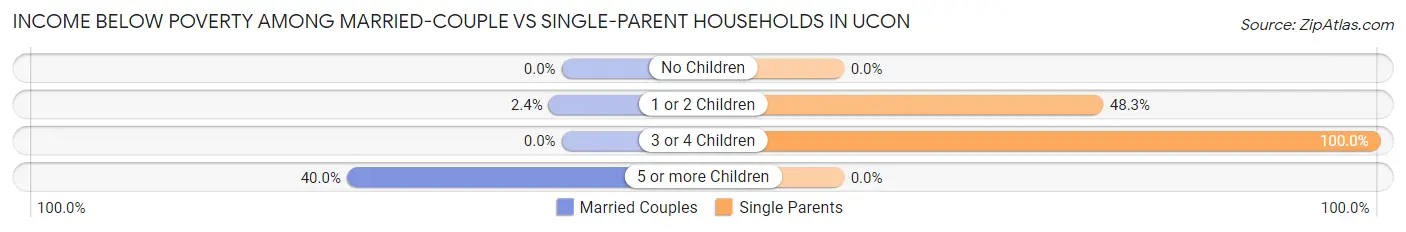
| Children | Married-Couple Families | Single-Parent Households |
| No Children | 0 (0.0%) | 0 (0.0%) |
| 1 or 2 Children | 3 (2.4%) | 14 (48.3%) |
| 3 or 4 Children | 0 (0.0%) | 3 (100.0%) |
| 5 or more Children | 2 (40.0%) | 0 (0.0%) |
| Total | 5 (1.4%) | 17 (48.6%) |
Race in Ucon
The most populous races in Ucon are White / Caucasian (1,535 | 94.1%), Two or more Races (81 | 5.0%), and Hispanic or Latino (69 | 4.2%).
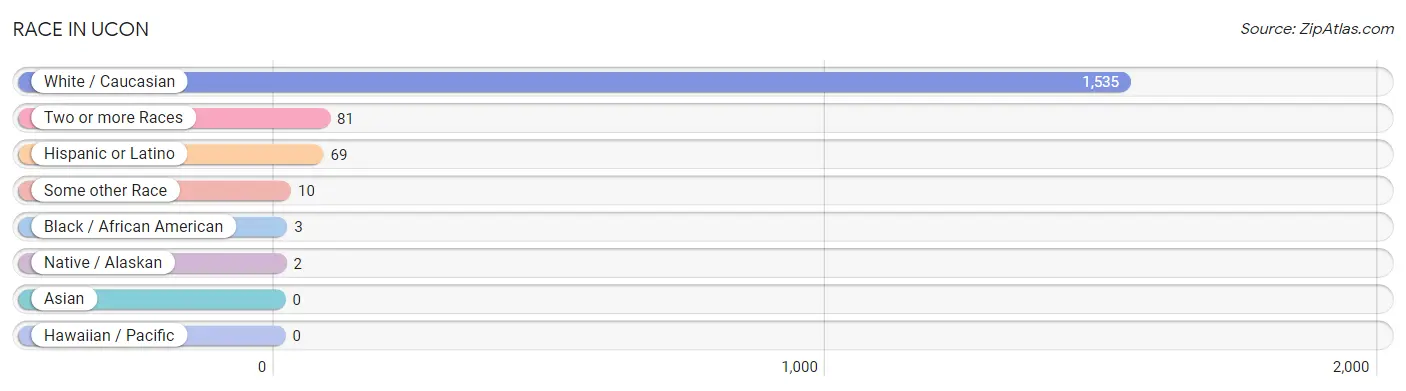
| Race | # Population | % Population |
| Asian | 0 | 0.0% |
| Black / African American | 3 | 0.2% |
| Hawaiian / Pacific | 0 | 0.0% |
| Hispanic or Latino | 69 | 4.2% |
| Native / Alaskan | 2 | 0.1% |
| White / Caucasian | 1,535 | 94.1% |
| Two or more Races | 81 | 5.0% |
| Some other Race | 10 | 0.6% |
| Total | 1,631 | 100.0% |
Ancestry in Ucon
The most populous ancestries reported in Ucon are English (468 | 28.7%), German (351 | 21.5%), Irish (326 | 20.0%), Scottish (147 | 9.0%), and American (111 | 6.8%), together accounting for 86.0% of all Ucon residents.
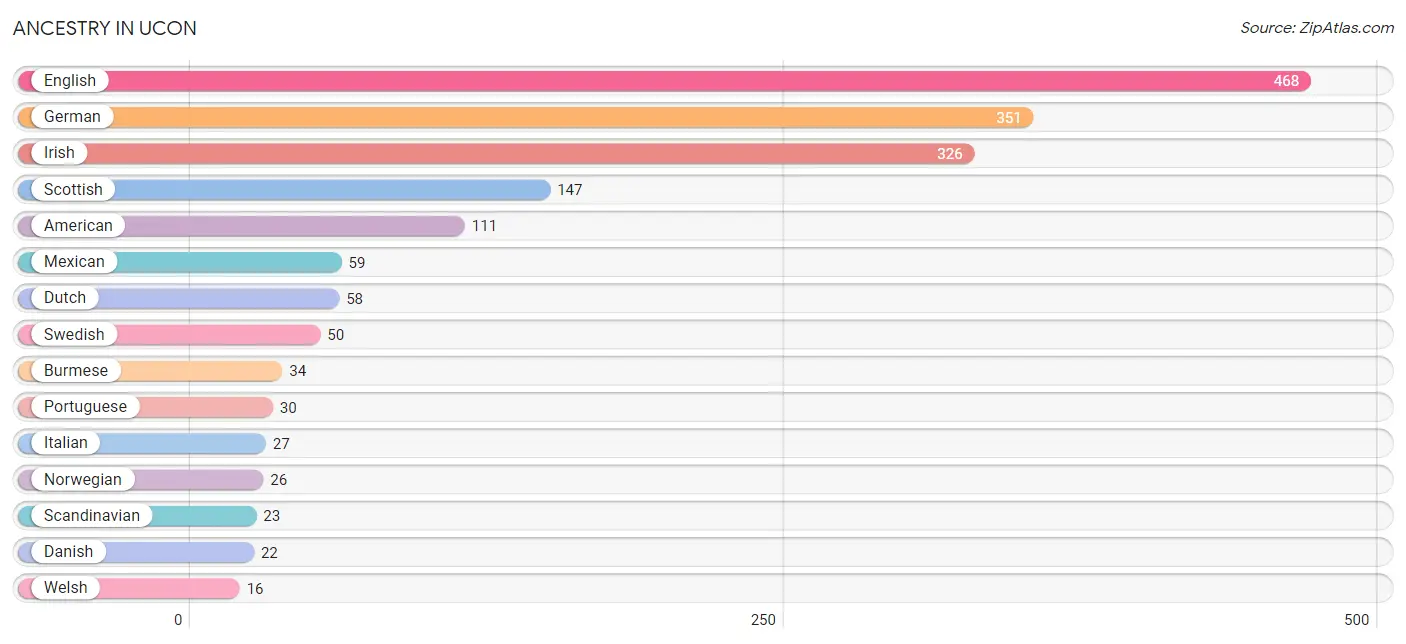
| Ancestry | # Population | % Population |
| American | 111 | 6.8% |
| Blackfeet | 2 | 0.1% |
| Brazilian | 11 | 0.7% |
| British | 5 | 0.3% |
| Burmese | 34 | 2.1% |
| Czech | 5 | 0.3% |
| Danish | 22 | 1.3% |
| Dutch | 58 | 3.6% |
| English | 468 | 28.7% |
| European | 15 | 0.9% |
| French | 11 | 0.7% |
| French Canadian | 3 | 0.2% |
| German | 351 | 21.5% |
| Irish | 326 | 20.0% |
| Italian | 27 | 1.7% |
| Mexican | 59 | 3.6% |
| Norwegian | 26 | 1.6% |
| Portuguese | 30 | 1.8% |
| Puerto Rican | 10 | 0.6% |
| Romanian | 8 | 0.5% |
| Russian | 2 | 0.1% |
| Scandinavian | 23 | 1.4% |
| Scotch-Irish | 4 | 0.3% |
| Scottish | 147 | 9.0% |
| Swedish | 50 | 3.1% |
| Welsh | 16 | 1.0% | View All 26 Rows |
Immigrants in Ucon
The most numerous immigrant groups reported in Ucon came from Latin America (21 | 1.3%), South America (14 | 0.9%), Brazil (11 | 0.7%), Eastern Europe (8 | 0.5%), and Europe (8 | 0.5%), together accounting for 3.8% of all Ucon residents.
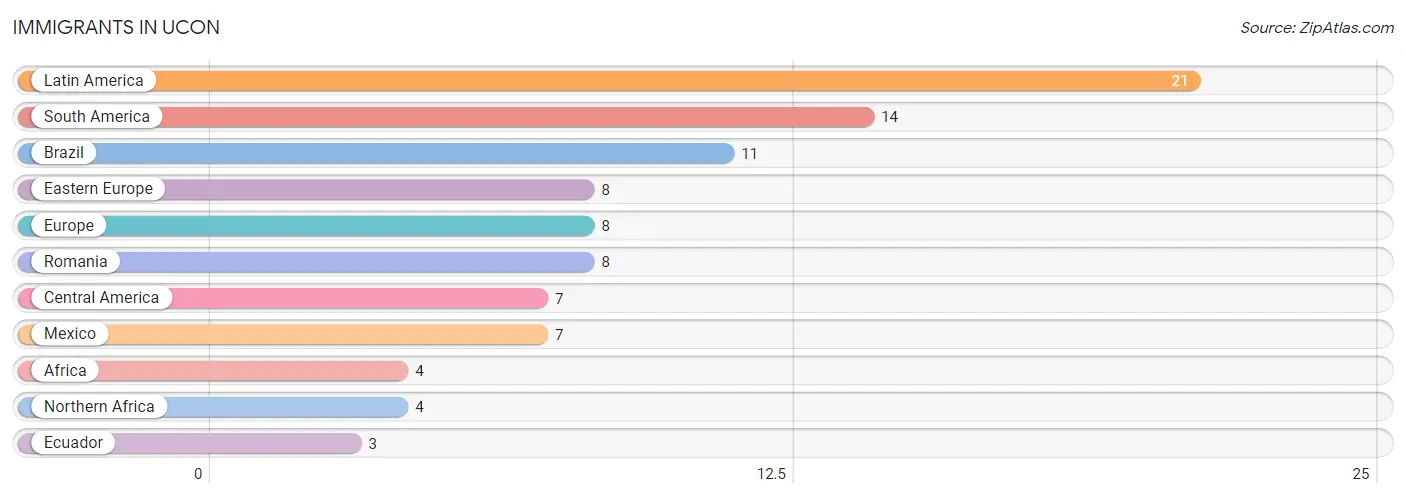
| Immigration Origin | # Population | % Population |
| Africa | 4 | 0.3% |
| Brazil | 11 | 0.7% |
| Central America | 7 | 0.4% |
| Eastern Europe | 8 | 0.5% |
| Ecuador | 3 | 0.2% |
| Europe | 8 | 0.5% |
| Latin America | 21 | 1.3% |
| Mexico | 7 | 0.4% |
| Northern Africa | 4 | 0.3% |
| Romania | 8 | 0.5% |
| South America | 14 | 0.9% | View All 11 Rows |
Sex and Age in Ucon
Sex and Age in Ucon
The most populous age groups in Ucon are 10 to 14 Years (105 | 11.9%) for men and 15 to 19 Years (89 | 11.9%) for women.
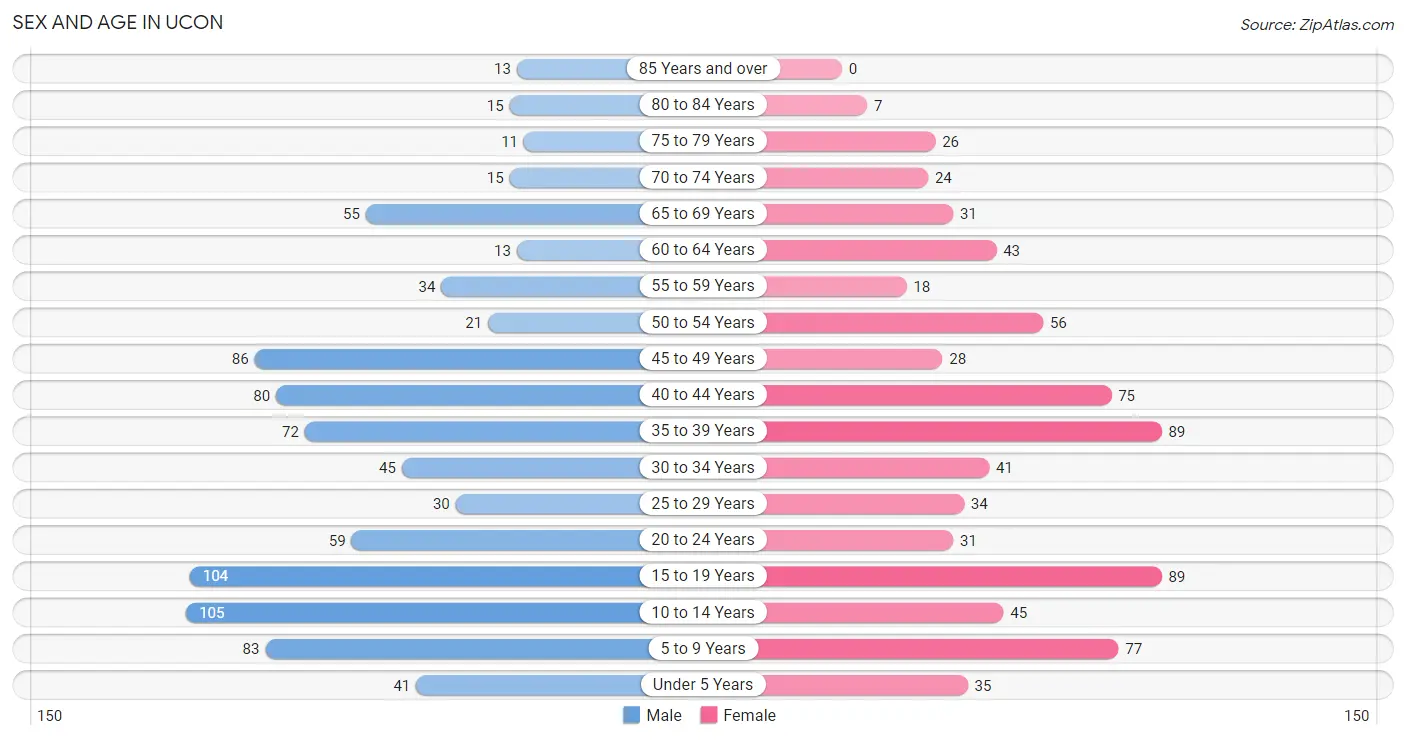
| Age Bracket | Male | Female |
| Under 5 Years | 41 (4.6%) | 35 (4.7%) |
| 5 to 9 Years | 83 (9.4%) | 77 (10.3%) |
| 10 to 14 Years | 105 (11.9%) | 45 (6.0%) |
| 15 to 19 Years | 104 (11.8%) | 89 (11.9%) |
| 20 to 24 Years | 59 (6.7%) | 31 (4.1%) |
| 25 to 29 Years | 30 (3.4%) | 34 (4.5%) |
| 30 to 34 Years | 45 (5.1%) | 41 (5.5%) |
| 35 to 39 Years | 72 (8.2%) | 89 (11.9%) |
| 40 to 44 Years | 80 (9.1%) | 75 (10.0%) |
| 45 to 49 Years | 86 (9.8%) | 28 (3.7%) |
| 50 to 54 Years | 21 (2.4%) | 56 (7.5%) |
| 55 to 59 Years | 34 (3.8%) | 18 (2.4%) |
| 60 to 64 Years | 13 (1.5%) | 43 (5.7%) |
| 65 to 69 Years | 55 (6.2%) | 31 (4.1%) |
| 70 to 74 Years | 15 (1.7%) | 24 (3.2%) |
| 75 to 79 Years | 11 (1.3%) | 26 (3.5%) |
| 80 to 84 Years | 15 (1.7%) | 7 (0.9%) |
| 85 Years and over | 13 (1.5%) | 0 (0.0%) |
| Total | 882 (100.0%) | 749 (100.0%) |
Families and Households in Ucon
Median Family Size in Ucon
The median family size in Ucon is 3.65 persons per family, with single female/mother families (26 | 6.5%) accounting for the largest median family size of 4.31 persons per family. On the other hand, single male/father families (9 | 2.2%) represent the smallest median family size with 3.11 persons per family.
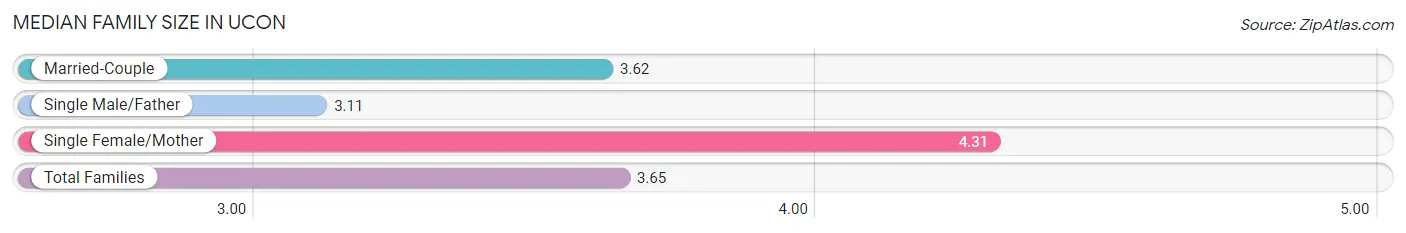
| Family Type | # Families | Family Size |
| Married-Couple | 368 (91.3%) | 3.62 |
| Single Male/Father | 9 (2.2%) | 3.11 |
| Single Female/Mother | 26 (6.5%) | 4.31 |
| Total Families | 403 (100.0%) | 3.65 |
Median Household Size in Ucon
The median household size in Ucon is 3.24 persons per household, with single female/mother households (26 | 5.2%) accounting for the largest median household size of 4.46 persons per household. non-family households (100 | 19.9%) represent the smallest median household size with 1.45 persons per household.
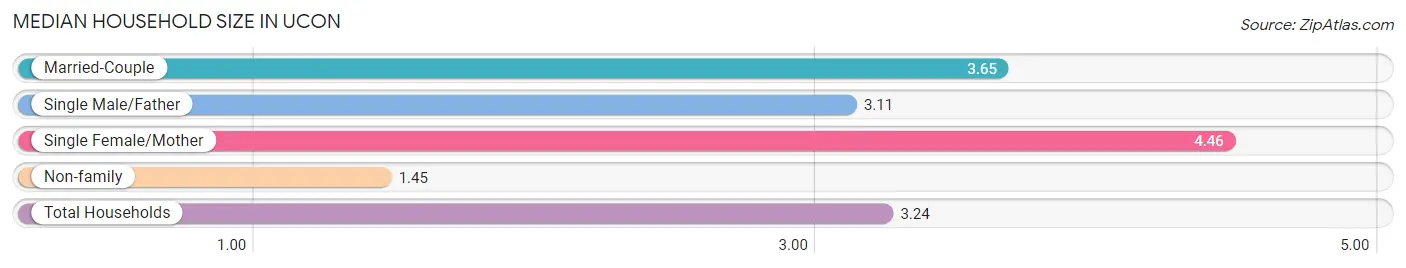
| Household Type | # Households | Household Size |
| Married-Couple | 368 (73.2%) | 3.65 |
| Single Male/Father | 9 (1.8%) | 3.11 |
| Single Female/Mother | 26 (5.2%) | 4.46 |
| Non-family | 100 (19.9%) | 1.45 |
| Total Households | 503 (100.0%) | 3.24 |
Household Size by Marriage Status in Ucon
Out of a total of 503 households in Ucon, 403 (80.1%) are family households, while 100 (19.9%) are nonfamily households. The most numerous type of family households are 2-person households, comprising 154, and the most common type of nonfamily households are 1-person households, comprising 72.
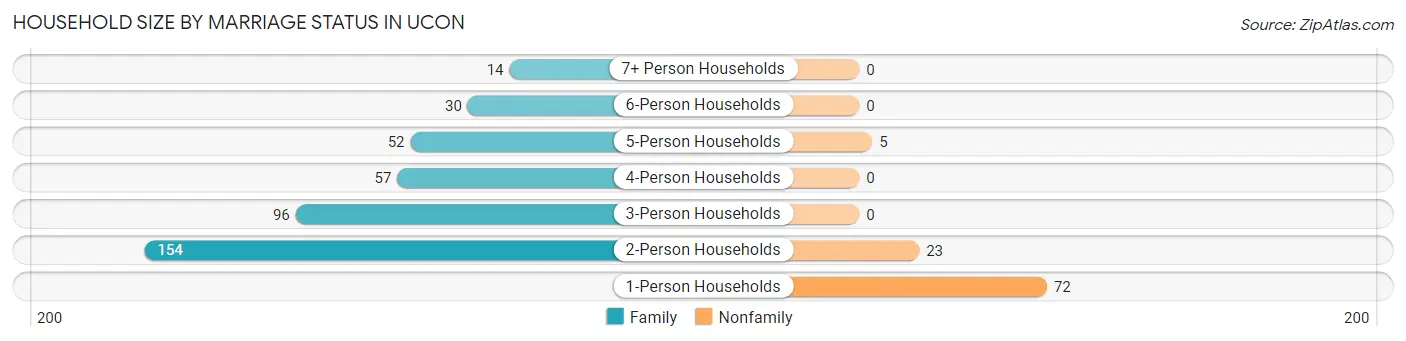
| Household Size | Family Households | Nonfamily Households |
| 1-Person Households | - | 72 (14.3%) |
| 2-Person Households | 154 (30.6%) | 23 (4.6%) |
| 3-Person Households | 96 (19.1%) | 0 (0.0%) |
| 4-Person Households | 57 (11.3%) | 0 (0.0%) |
| 5-Person Households | 52 (10.3%) | 5 (1.0%) |
| 6-Person Households | 30 (6.0%) | 0 (0.0%) |
| 7+ Person Households | 14 (2.8%) | 0 (0.0%) |
| Total | 403 (80.1%) | 100 (19.9%) |
Female Fertility in Ucon
Fertility by Age in Ucon
Average fertility rate in Ucon is 62.0 births per 1,000 women. Women in the age bracket of 20 to 34 years have the highest fertility rate with 132.0 births per 1,000 women. Women in the age bracket of 20 to 34 years acount for 58.3% of all women with births.
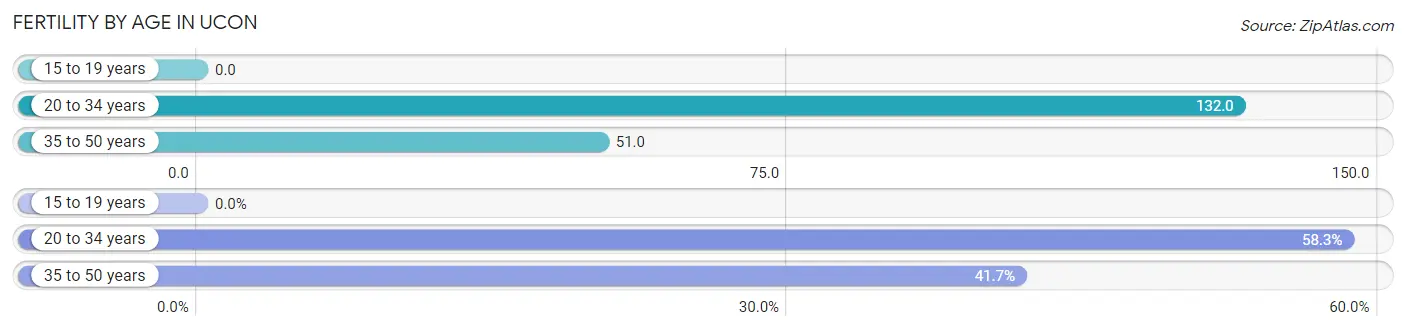
| Age Bracket | Women with Births | Births / 1,000 Women |
| 15 to 19 years | 0 (0.0%) | 0.0 |
| 20 to 34 years | 14 (58.3%) | 132.0 |
| 35 to 50 years | 10 (41.7%) | 51.0 |
| Total | 24 (100.0%) | 62.0 |
Fertility by Age by Marriage Status in Ucon
83.3% of women with births (24) in Ucon are married. The highest percentage of unmarried women with births falls into 35 to 50 years age bracket with 40.0% of them unmarried at the time of birth, while the lowest percentage of unmarried women with births belong to 20 to 34 years age bracket with 0.0% of them unmarried.
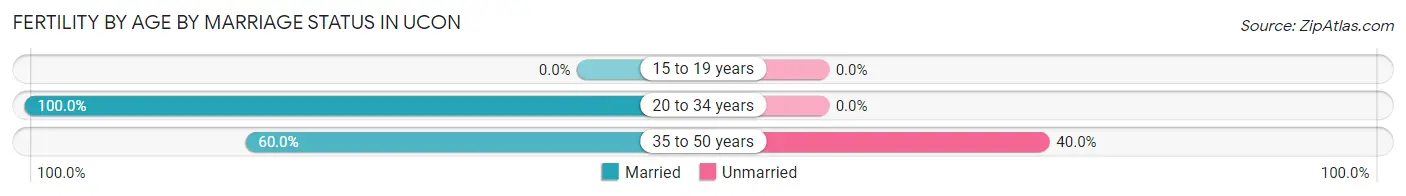
| Age Bracket | Married | Unmarried |
| 15 to 19 years | 0 (0.0%) | 0 (0.0%) |
| 20 to 34 years | 14 (100.0%) | 0 (0.0%) |
| 35 to 50 years | 6 (60.0%) | 4 (40.0%) |
| Total | 20 (83.3%) | 4 (16.7%) |
Fertility by Education in Ucon
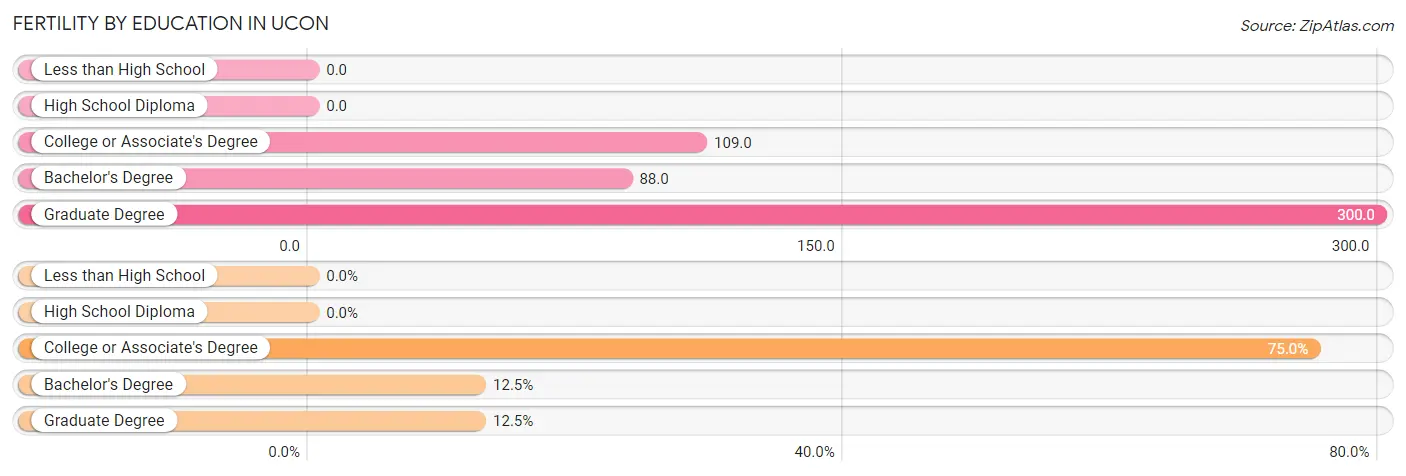
| Educational Attainment | Women with Births | Births / 1,000 Women |
| Less than High School | 0 (0.0%) | 0.0 |
| High School Diploma | 0 (0.0%) | 0.0 |
| College or Associate's Degree | 18 (75.0%) | 109.0 |
| Bachelor's Degree | 3 (12.5%) | 88.0 |
| Graduate Degree | 3 (12.5%) | 300.0 |
| Total | 24 (100.0%) | 62.0 |
Fertility by Education by Marriage Status in Ucon
16.7% of women with births in Ucon are unmarried. Women with the educational attainment of bachelor's degree are most likely to be married with 100.0% of them married at childbirth, while women with the educational attainment of college or associate's degree are least likely to be married with 22.2% of them unmarried at childbirth.
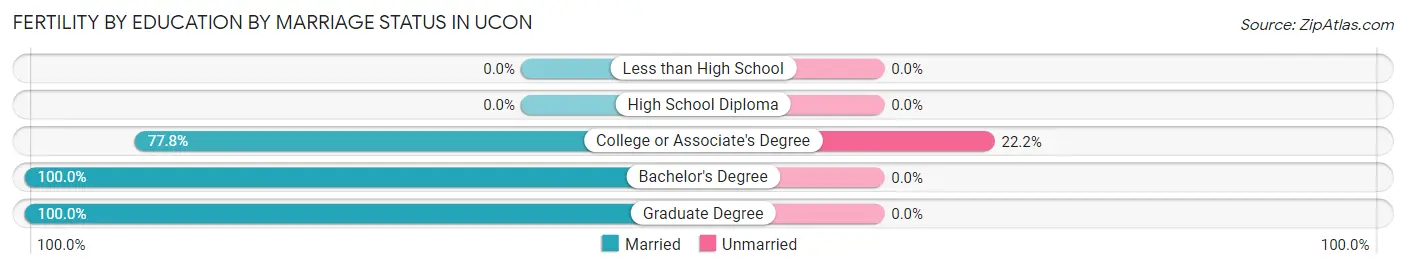
| Educational Attainment | Married | Unmarried |
| Less than High School | 0 (0.0%) | 0 (0.0%) |
| High School Diploma | 0 (0.0%) | 0 (0.0%) |
| College or Associate's Degree | 14 (77.8%) | 4 (22.2%) |
| Bachelor's Degree | 3 (100.0%) | 0 (0.0%) |
| Graduate Degree | 3 (100.0%) | 0 (0.0%) |
| Total | 20 (83.3%) | 4 (16.7%) |
Employment Characteristics in Ucon
Employment by Class of Employer in Ucon
Among the 813 employed individuals in Ucon, private company employees (577 | 71.0%), local government employees (92 | 11.3%), and not-for-profit organizations (58 | 7.1%) make up the most common classes of employment.
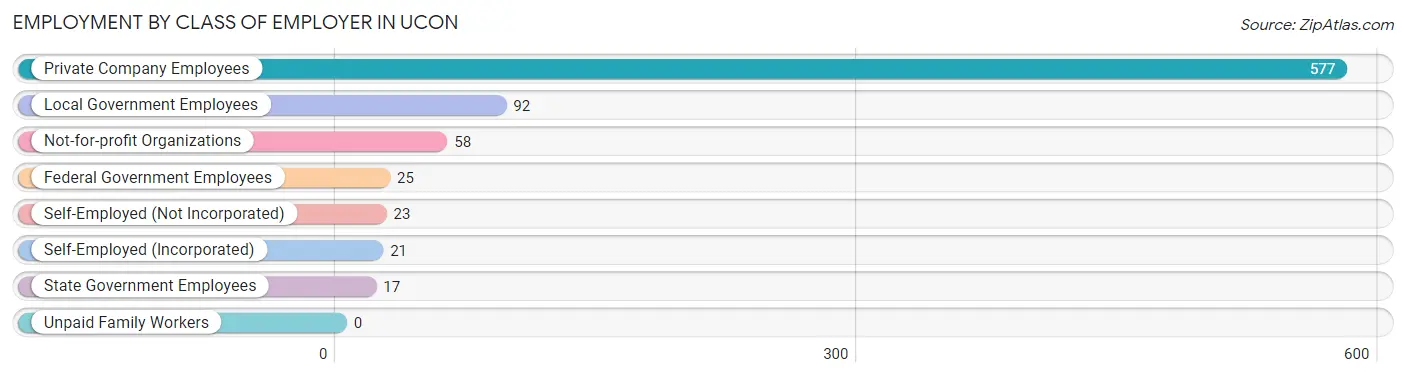
| Employer Class | # Employees | % Employees |
| Private Company Employees | 577 | 71.0% |
| Self-Employed (Incorporated) | 21 | 2.6% |
| Self-Employed (Not Incorporated) | 23 | 2.8% |
| Not-for-profit Organizations | 58 | 7.1% |
| Local Government Employees | 92 | 11.3% |
| State Government Employees | 17 | 2.1% |
| Federal Government Employees | 25 | 3.1% |
| Unpaid Family Workers | 0 | 0.0% |
| Total | 813 | 100.0% |
Employment Status by Age in Ucon
According to the labor force statistics for Ucon, out of the total population over 16 years of age (1,200), 72.2% or 866 individuals are in the labor force, with 5.1% or 44 of them unemployed. The age group with the highest labor force participation rate is 55 to 59 years, with 96.2% or 50 individuals in the labor force. Within the labor force, the 16 to 19 years age range has the highest percentage of unemployed individuals, with 33.0% or 38 of them being unemployed.
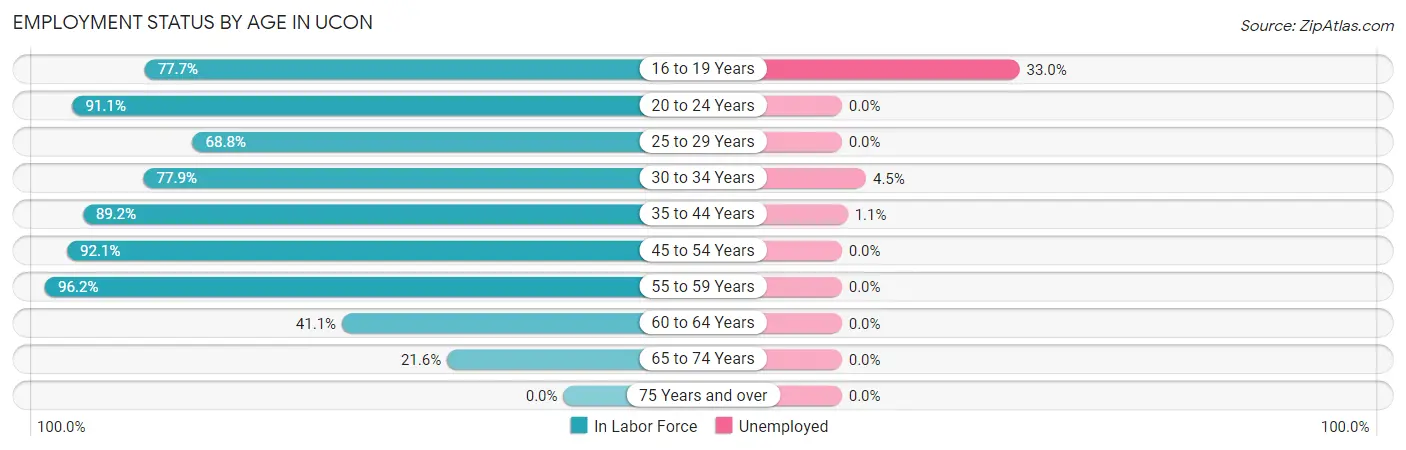
| Age Bracket | In Labor Force | Unemployed |
| 16 to 19 Years | 115 (77.7%) | 38 (33.0%) |
| 20 to 24 Years | 82 (91.1%) | 0 (0.0%) |
| 25 to 29 Years | 44 (68.8%) | 0 (0.0%) |
| 30 to 34 Years | 67 (77.9%) | 3 (4.5%) |
| 35 to 44 Years | 282 (89.2%) | 3 (1.1%) |
| 45 to 54 Years | 176 (92.1%) | 0 (0.0%) |
| 55 to 59 Years | 50 (96.2%) | 0 (0.0%) |
| 60 to 64 Years | 23 (41.1%) | 0 (0.0%) |
| 65 to 74 Years | 27 (21.6%) | 0 (0.0%) |
| 75 Years and over | 0 (0.0%) | 0 (0.0%) |
| Total | 866 (72.2%) | 44 (5.1%) |
Employment Status by Educational Attainment in Ucon
According to labor force statistics for Ucon, 83.9% of individuals (642) out of the total population between 25 and 64 years of age (765) are in the labor force, with 0.9% or 6 of them being unemployed. The group with the highest labor force participation rate are those with the educational attainment of less than high school, with 90.5% or 19 individuals in the labor force. Within the labor force, individuals with bachelor's degree or higher education have the highest percentage of unemployment, with 1.7% or 3 of them being unemployed.
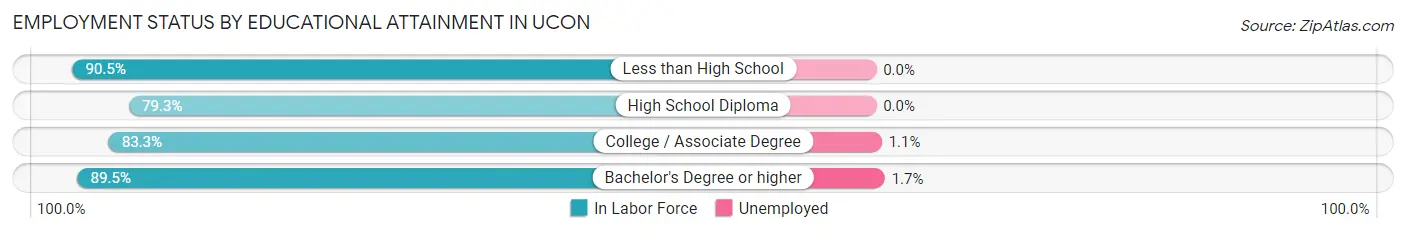
| Educational Attainment | In Labor Force | Unemployed |
| Less than High School | 19 (90.5%) | 0 (0.0%) |
| High School Diploma | 180 (79.3%) | 0 (0.0%) |
| College / Associate Degree | 264 (83.3%) | 3 (1.1%) |
| Bachelor's Degree or higher | 179 (89.5%) | 3 (1.7%) |
| Total | 642 (83.9%) | 7 (0.9%) |
Employment Occupations by Sex in Ucon
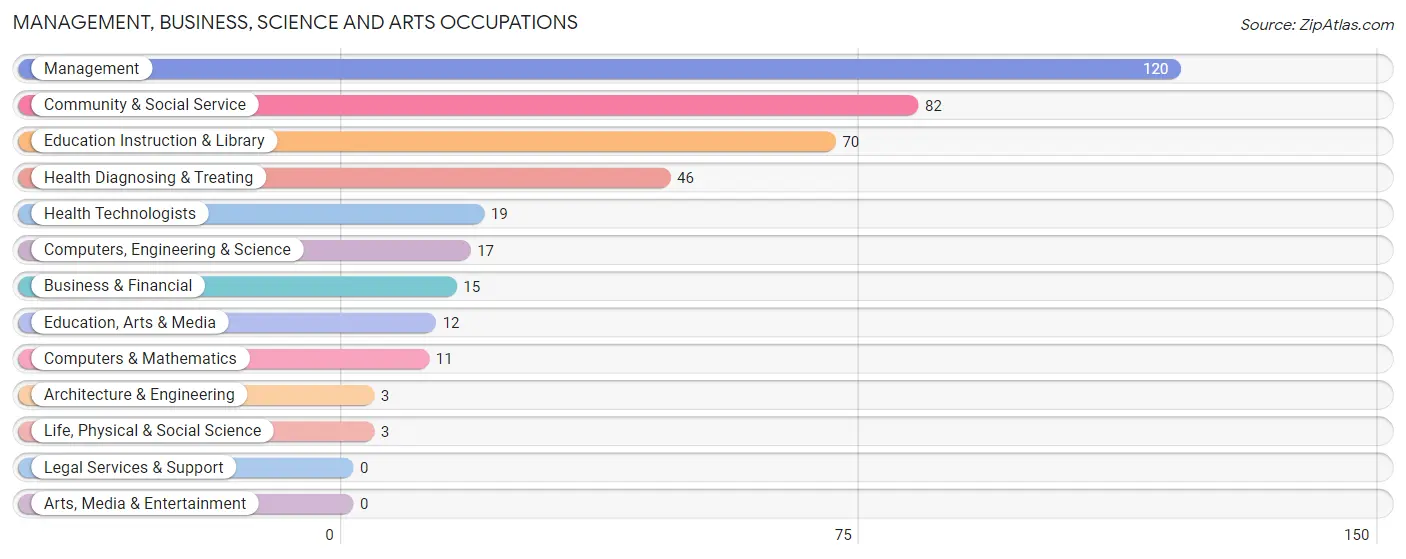
Management, Business, Science and Arts Occupations
The most common Management, Business, Science and Arts occupations in Ucon are Management (120 | 14.6%), Community & Social Service (82 | 10.0%), Education Instruction & Library (70 | 8.5%), Health Diagnosing & Treating (46 | 5.6%), and Health Technologists (19 | 2.3%).
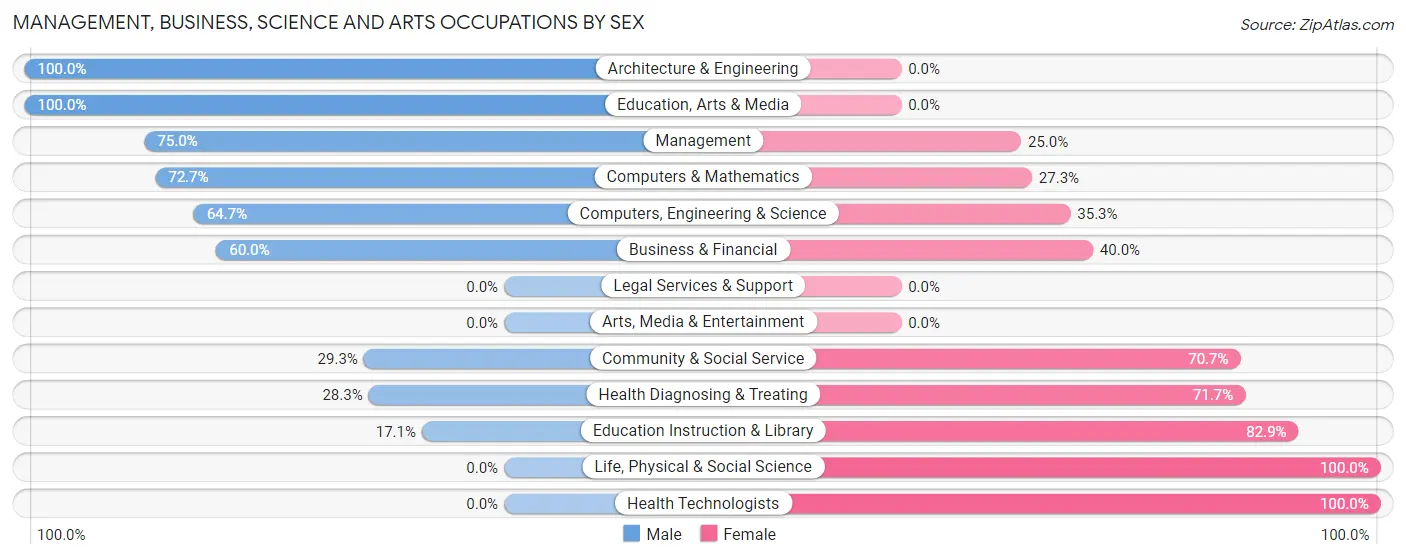
Management, Business, Science and Arts Occupations by Sex
Within the Management, Business, Science and Arts occupations in Ucon, the most male-oriented occupations are Architecture & Engineering (100.0%), Education, Arts & Media (100.0%), and Management (75.0%), while the most female-oriented occupations are Life, Physical & Social Science (100.0%), Health Technologists (100.0%), and Education Instruction & Library (82.9%).
| Occupation | Male | Female |
| Management | 90 (75.0%) | 30 (25.0%) |
| Business & Financial | 9 (60.0%) | 6 (40.0%) |
| Computers, Engineering & Science | 11 (64.7%) | 6 (35.3%) |
| Computers & Mathematics | 8 (72.7%) | 3 (27.3%) |
| Architecture & Engineering | 3 (100.0%) | 0 (0.0%) |
| Life, Physical & Social Science | 0 (0.0%) | 3 (100.0%) |
| Community & Social Service | 24 (29.3%) | 58 (70.7%) |
| Education, Arts & Media | 12 (100.0%) | 0 (0.0%) |
| Legal Services & Support | 0 (0.0%) | 0 (0.0%) |
| Education Instruction & Library | 12 (17.1%) | 58 (82.9%) |
| Arts, Media & Entertainment | 0 (0.0%) | 0 (0.0%) |
| Health Diagnosing & Treating | 13 (28.3%) | 33 (71.7%) |
| Health Technologists | 0 (0.0%) | 19 (100.0%) |
| Total (Category) | 147 (52.5%) | 133 (47.5%) |
| Total (Overall) | 456 (55.5%) | 366 (44.5%) |
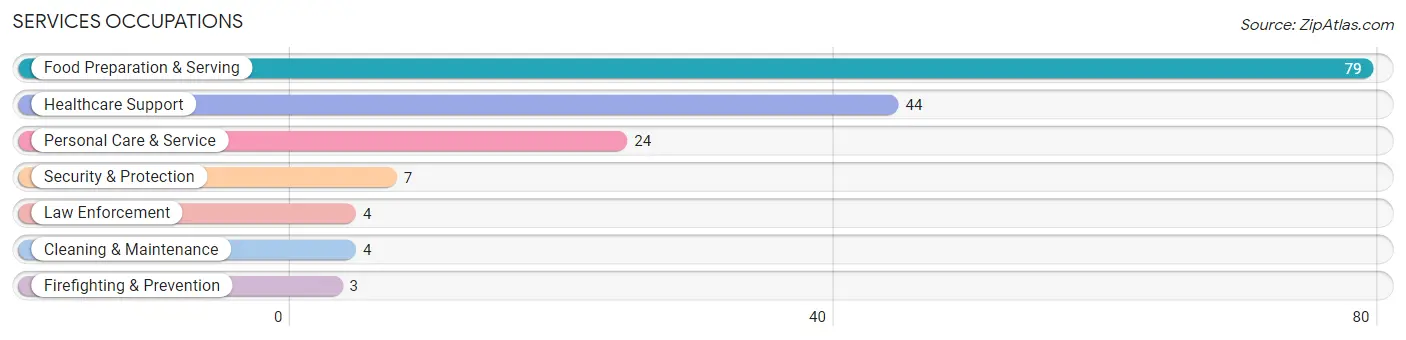
Services Occupations
The most common Services occupations in Ucon are Food Preparation & Serving (79 | 9.6%), Healthcare Support (44 | 5.3%), Personal Care & Service (24 | 2.9%), Security & Protection (7 | 0.9%), and Law Enforcement (4 | 0.5%).
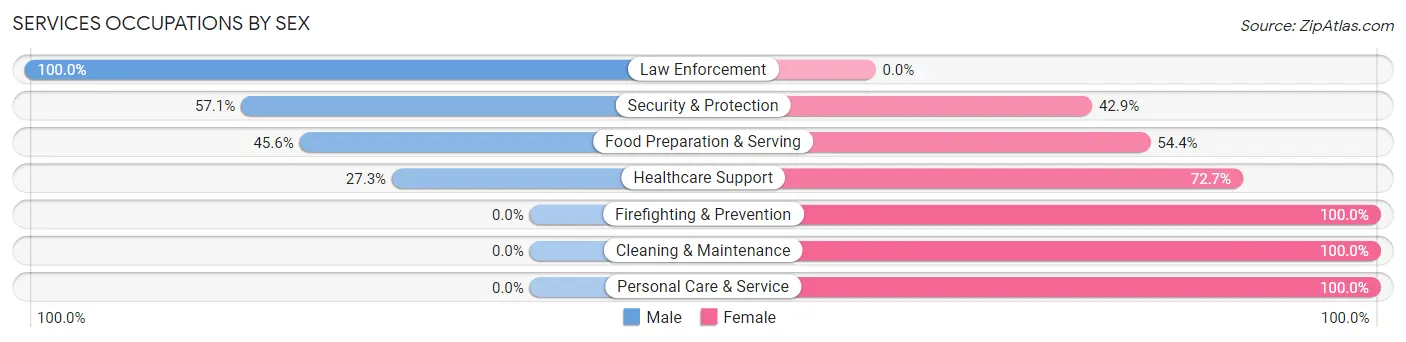
Services Occupations by Sex
Within the Services occupations in Ucon, the most male-oriented occupations are Law Enforcement (100.0%), Security & Protection (57.1%), and Food Preparation & Serving (45.6%), while the most female-oriented occupations are Firefighting & Prevention (100.0%), Cleaning & Maintenance (100.0%), and Personal Care & Service (100.0%).
| Occupation | Male | Female |
| Healthcare Support | 12 (27.3%) | 32 (72.7%) |
| Security & Protection | 4 (57.1%) | 3 (42.9%) |
| Firefighting & Prevention | 0 (0.0%) | 3 (100.0%) |
| Law Enforcement | 4 (100.0%) | 0 (0.0%) |
| Food Preparation & Serving | 36 (45.6%) | 43 (54.4%) |
| Cleaning & Maintenance | 0 (0.0%) | 4 (100.0%) |
| Personal Care & Service | 0 (0.0%) | 24 (100.0%) |
| Total (Category) | 52 (32.9%) | 106 (67.1%) |
| Total (Overall) | 456 (55.5%) | 366 (44.5%) |
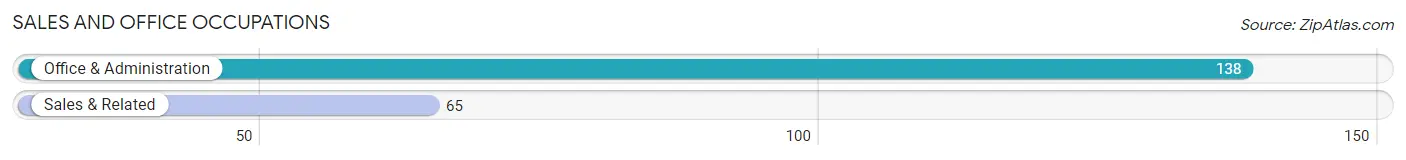
Sales and Office Occupations
The most common Sales and Office occupations in Ucon are Office & Administration (138 | 16.8%), and Sales & Related (65 | 7.9%).
Sales and Office Occupations by Sex
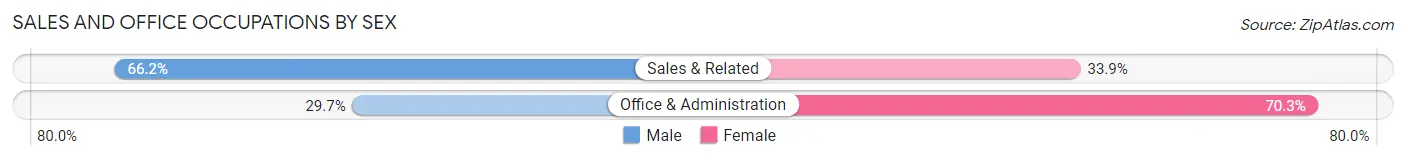
| Occupation | Male | Female |
| Sales & Related | 43 (66.1%) | 22 (33.9%) |
| Office & Administration | 41 (29.7%) | 97 (70.3%) |
| Total (Category) | 84 (41.4%) | 119 (58.6%) |
| Total (Overall) | 456 (55.5%) | 366 (44.5%) |
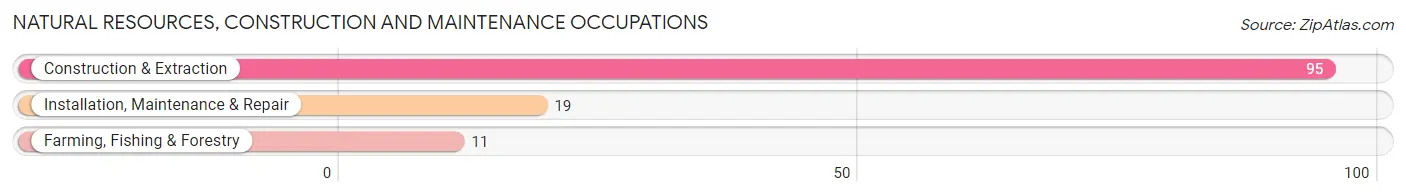
Natural Resources, Construction and Maintenance Occupations
The most common Natural Resources, Construction and Maintenance occupations in Ucon are Construction & Extraction (95 | 11.6%), Installation, Maintenance & Repair (19 | 2.3%), and Farming, Fishing & Forestry (11 | 1.3%).
Natural Resources, Construction and Maintenance Occupations by Sex
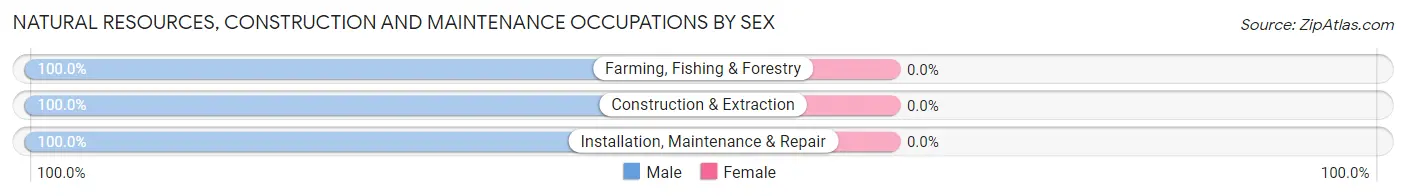
| Occupation | Male | Female |
| Farming, Fishing & Forestry | 11 (100.0%) | 0 (0.0%) |
| Construction & Extraction | 95 (100.0%) | 0 (0.0%) |
| Installation, Maintenance & Repair | 19 (100.0%) | 0 (0.0%) |
| Total (Category) | 125 (100.0%) | 0 (0.0%) |
| Total (Overall) | 456 (55.5%) | 366 (44.5%) |
Production, Transportation and Moving Occupations
The most common Production, Transportation and Moving occupations in Ucon are Production (39 | 4.7%), and Material Moving (17 | 2.1%).
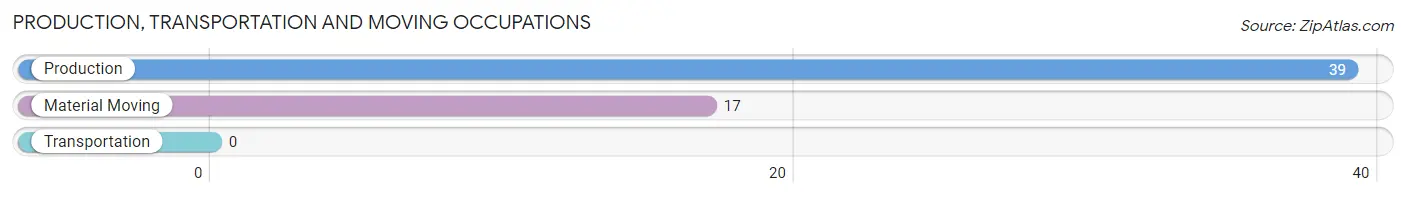
Production, Transportation and Moving Occupations by Sex
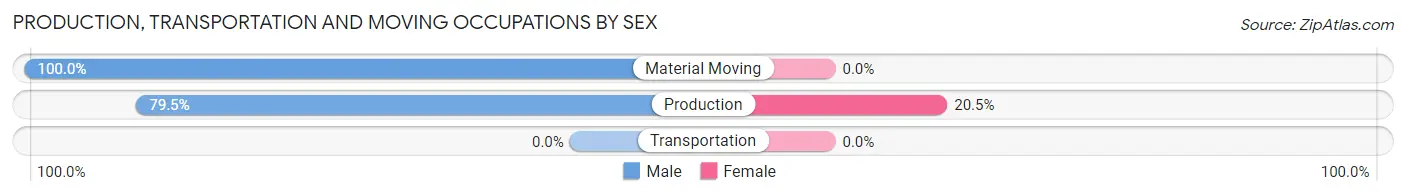
| Occupation | Male | Female |
| Production | 31 (79.5%) | 8 (20.5%) |
| Transportation | 0 (0.0%) | 0 (0.0%) |
| Material Moving | 17 (100.0%) | 0 (0.0%) |
| Total (Category) | 48 (85.7%) | 8 (14.3%) |
| Total (Overall) | 456 (55.5%) | 366 (44.5%) |
Employment Industries by Sex in Ucon
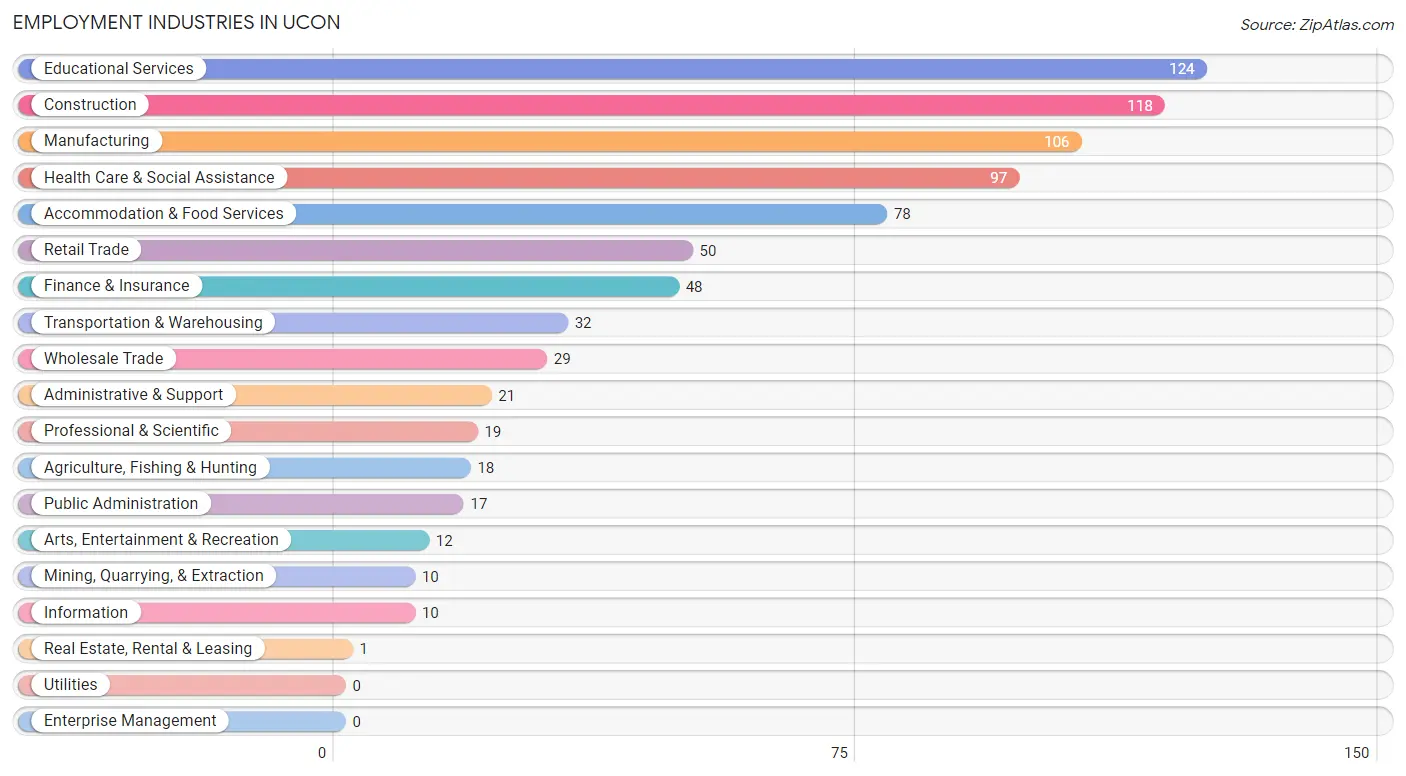
Employment Industries in Ucon
The major employment industries in Ucon include Educational Services (124 | 15.1%), Construction (118 | 14.4%), Manufacturing (106 | 12.9%), Health Care & Social Assistance (97 | 11.8%), and Accommodation & Food Services (78 | 9.5%).
Employment Industries by Sex in Ucon
The Ucon industries that see more men than women are Real Estate, Rental & Leasing (100.0%), Agriculture, Fishing & Hunting (83.3%), and Manufacturing (81.1%), whereas the industries that tend to have a higher number of women are Mining, Quarrying, & Extraction (100.0%), Finance & Insurance (100.0%), and Arts, Entertainment & Recreation (100.0%).
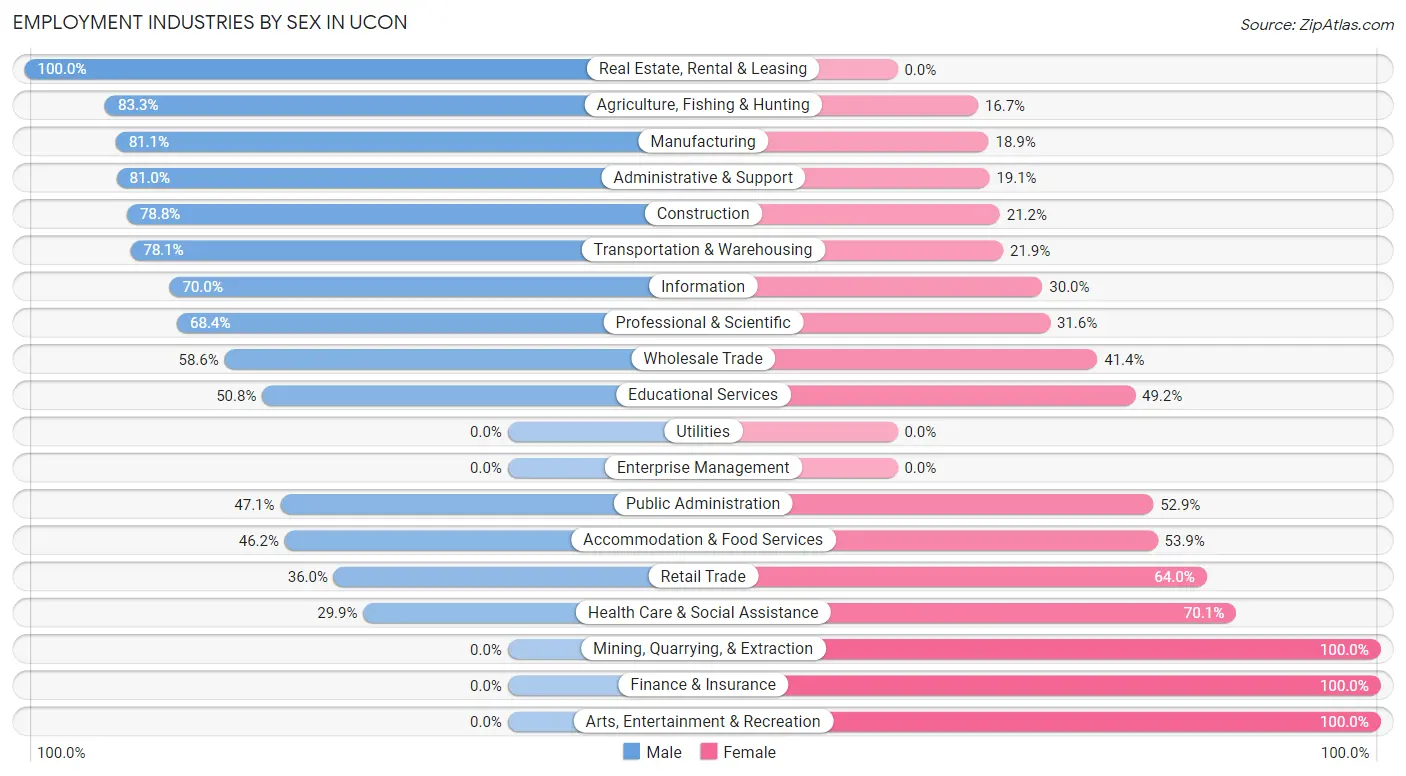
| Industry | Male | Female |
| Agriculture, Fishing & Hunting | 15 (83.3%) | 3 (16.7%) |
| Mining, Quarrying, & Extraction | 0 (0.0%) | 10 (100.0%) |
| Construction | 93 (78.8%) | 25 (21.2%) |
| Manufacturing | 86 (81.1%) | 20 (18.9%) |
| Wholesale Trade | 17 (58.6%) | 12 (41.4%) |
| Retail Trade | 18 (36.0%) | 32 (64.0%) |
| Transportation & Warehousing | 25 (78.1%) | 7 (21.9%) |
| Utilities | 0 (0.0%) | 0 (0.0%) |
| Information | 7 (70.0%) | 3 (30.0%) |
| Finance & Insurance | 0 (0.0%) | 48 (100.0%) |
| Real Estate, Rental & Leasing | 1 (100.0%) | 0 (0.0%) |
| Professional & Scientific | 13 (68.4%) | 6 (31.6%) |
| Enterprise Management | 0 (0.0%) | 0 (0.0%) |
| Administrative & Support | 17 (80.9%) | 4 (19.1%) |
| Educational Services | 63 (50.8%) | 61 (49.2%) |
| Health Care & Social Assistance | 29 (29.9%) | 68 (70.1%) |
| Arts, Entertainment & Recreation | 0 (0.0%) | 12 (100.0%) |
| Accommodation & Food Services | 36 (46.2%) | 42 (53.8%) |
| Public Administration | 8 (47.1%) | 9 (52.9%) |
| Total | 456 (55.5%) | 366 (44.5%) |
Education in Ucon
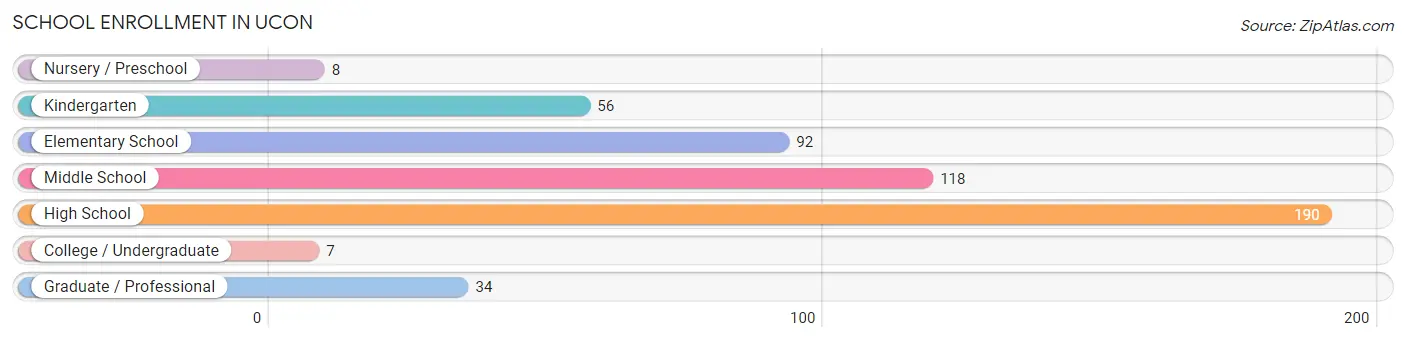
School Enrollment in Ucon
The most common levels of schooling among the 505 students in Ucon are high school (190 | 37.6%), middle school (118 | 23.4%), and elementary school (92 | 18.2%).
| School Level | # Students | % Students |
| Nursery / Preschool | 8 | 1.6% |
| Kindergarten | 56 | 11.1% |
| Elementary School | 92 | 18.2% |
| Middle School | 118 | 23.4% |
| High School | 190 | 37.6% |
| College / Undergraduate | 7 | 1.4% |
| Graduate / Professional | 34 | 6.7% |
| Total | 505 | 100.0% |
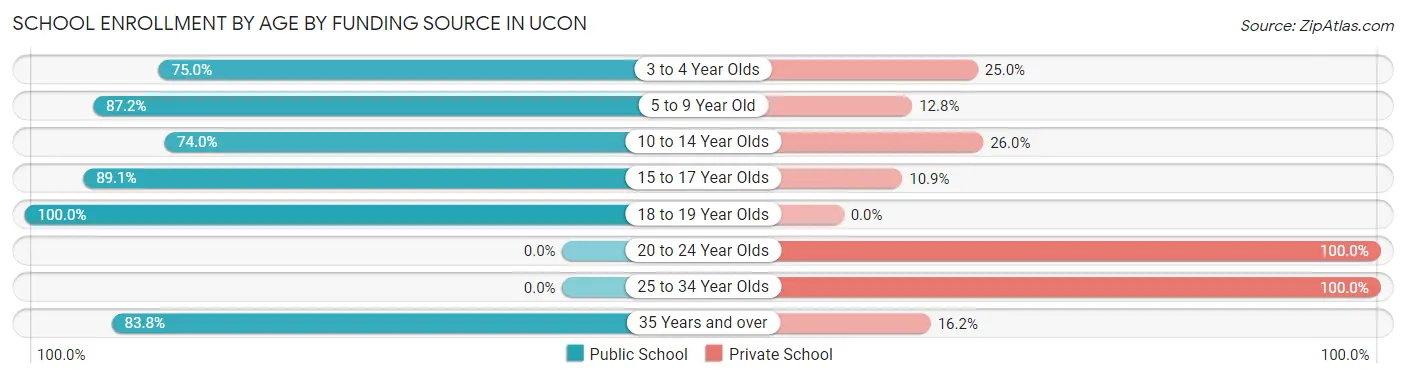
School Enrollment by Age by Funding Source in Ucon
Out of a total of 505 students who are enrolled in schools in Ucon, 82 (16.2%) attend a private institution, while the remaining 423 (83.8%) are enrolled in public schools. The age group of 20 to 24 year olds has the highest likelihood of being enrolled in private schools, with 3 (100.0% in the age bracket) enrolled. Conversely, the age group of 18 to 19 year olds has the lowest likelihood of being enrolled in a private school, with 46 (100.0% in the age bracket) attending a public institution.
| Age Bracket | Public School | Private School |
| 3 to 4 Year Olds | 6 (75.0%) | 2 (25.0%) |
| 5 to 9 Year Old | 123 (87.2%) | 18 (12.8%) |
| 10 to 14 Year Olds | 111 (74.0%) | 39 (26.0%) |
| 15 to 17 Year Olds | 106 (89.1%) | 13 (10.9%) |
| 18 to 19 Year Olds | 46 (100.0%) | 0 (0.0%) |
| 20 to 24 Year Olds | 0 (0.0%) | 3 (100.0%) |
| 25 to 34 Year Olds | 0 (0.0%) | 1 (100.0%) |
| 35 Years and over | 31 (83.8%) | 6 (16.2%) |
| Total | 423 (83.8%) | 82 (16.2%) |
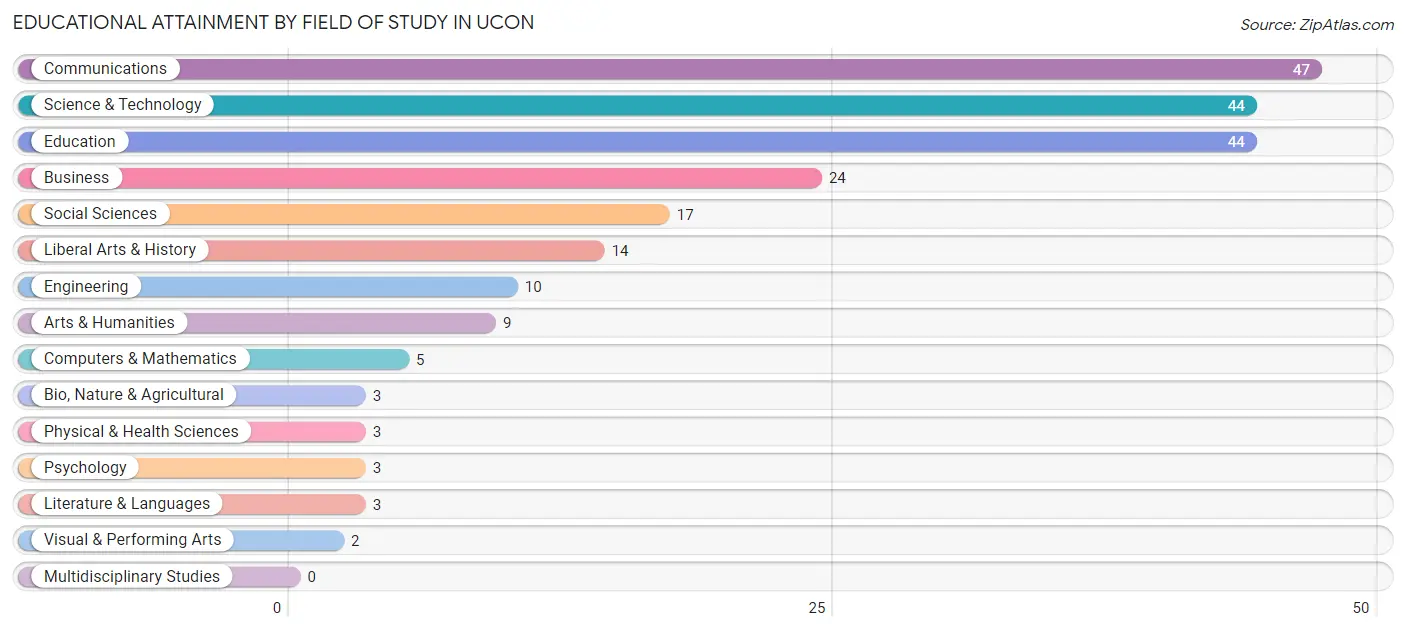
Educational Attainment by Field of Study in Ucon
Communications (47 | 20.6%), science & technology (44 | 19.3%), education (44 | 19.3%), business (24 | 10.5%), and social sciences (17 | 7.5%) are the most common fields of study among 228 individuals in Ucon who have obtained a bachelor's degree or higher.
| Field of Study | # Graduates | % Graduates |
| Computers & Mathematics | 5 | 2.2% |
| Bio, Nature & Agricultural | 3 | 1.3% |
| Physical & Health Sciences | 3 | 1.3% |
| Psychology | 3 | 1.3% |
| Social Sciences | 17 | 7.5% |
| Engineering | 10 | 4.4% |
| Multidisciplinary Studies | 0 | 0.0% |
| Science & Technology | 44 | 19.3% |
| Business | 24 | 10.5% |
| Education | 44 | 19.3% |
| Literature & Languages | 3 | 1.3% |
| Liberal Arts & History | 14 | 6.1% |
| Visual & Performing Arts | 2 | 0.9% |
| Communications | 47 | 20.6% |
| Arts & Humanities | 9 | 4.0% |
| Total | 228 | 100.0% |
Transportation & Commute in Ucon
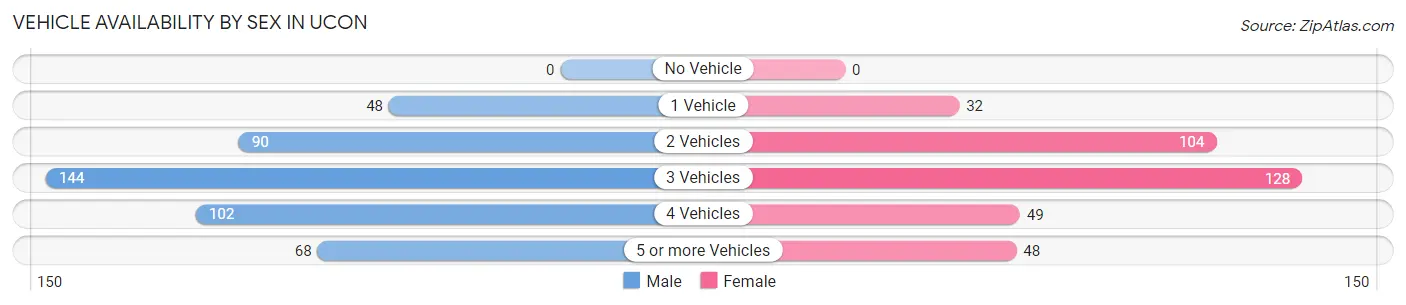
Vehicle Availability by Sex in Ucon
The most prevalent vehicle ownership categories in Ucon are males with 3 vehicles (144, accounting for 31.9%) and females with 3 vehicles (128, making up 39.9%).
| Vehicles Available | Male | Female |
| No Vehicle | 0 (0.0%) | 0 (0.0%) |
| 1 Vehicle | 48 (10.6%) | 32 (8.9%) |
| 2 Vehicles | 90 (19.9%) | 104 (28.8%) |
| 3 Vehicles | 144 (31.9%) | 128 (35.5%) |
| 4 Vehicles | 102 (22.6%) | 49 (13.6%) |
| 5 or more Vehicles | 68 (15.0%) | 48 (13.3%) |
| Total | 452 (100.0%) | 361 (100.0%) |
Commute Time in Ucon
The most frequently occuring commute durations in Ucon are 15 to 19 minutes (201 commuters, 30.6%), 20 to 24 minutes (150 commuters, 22.8%), and 10 to 14 minutes (77 commuters, 11.7%).
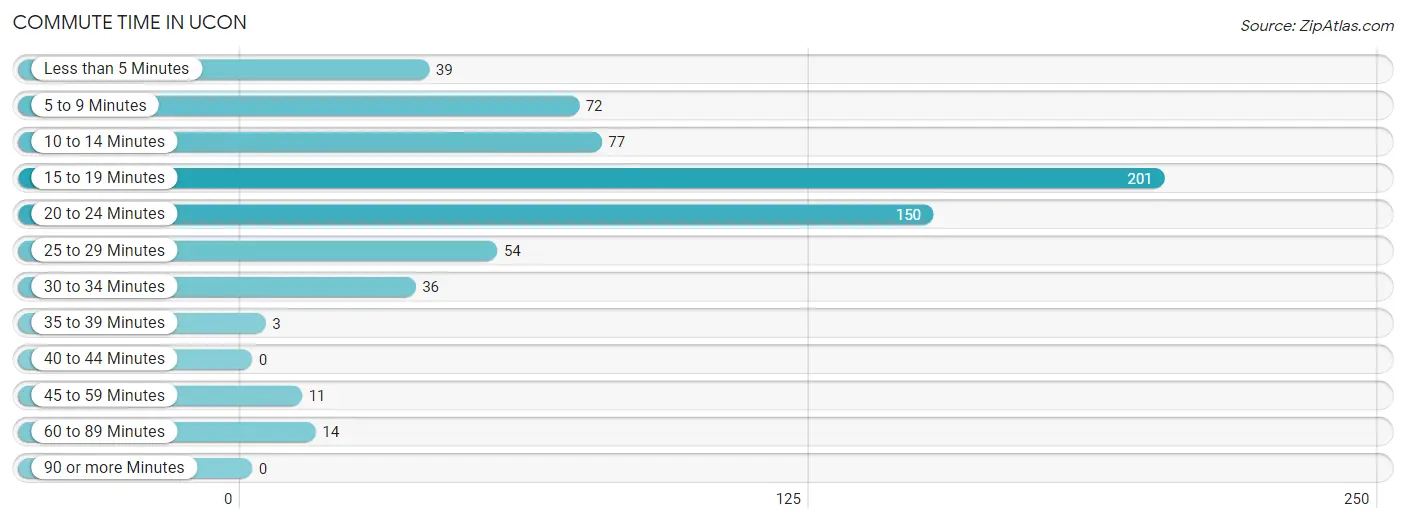
| Commute Time | # Commuters | % Commuters |
| Less than 5 Minutes | 39 | 5.9% |
| 5 to 9 Minutes | 72 | 11.0% |
| 10 to 14 Minutes | 77 | 11.7% |
| 15 to 19 Minutes | 201 | 30.6% |
| 20 to 24 Minutes | 150 | 22.8% |
| 25 to 29 Minutes | 54 | 8.2% |
| 30 to 34 Minutes | 36 | 5.5% |
| 35 to 39 Minutes | 3 | 0.5% |
| 40 to 44 Minutes | 0 | 0.0% |
| 45 to 59 Minutes | 11 | 1.7% |
| 60 to 89 Minutes | 14 | 2.1% |
| 90 or more Minutes | 0 | 0.0% |
Commute Time by Sex in Ucon
The most common commute times in Ucon are 15 to 19 minutes (130 commuters, 32.8%) for males and 20 to 24 minutes (90 commuters, 34.5%) for females.
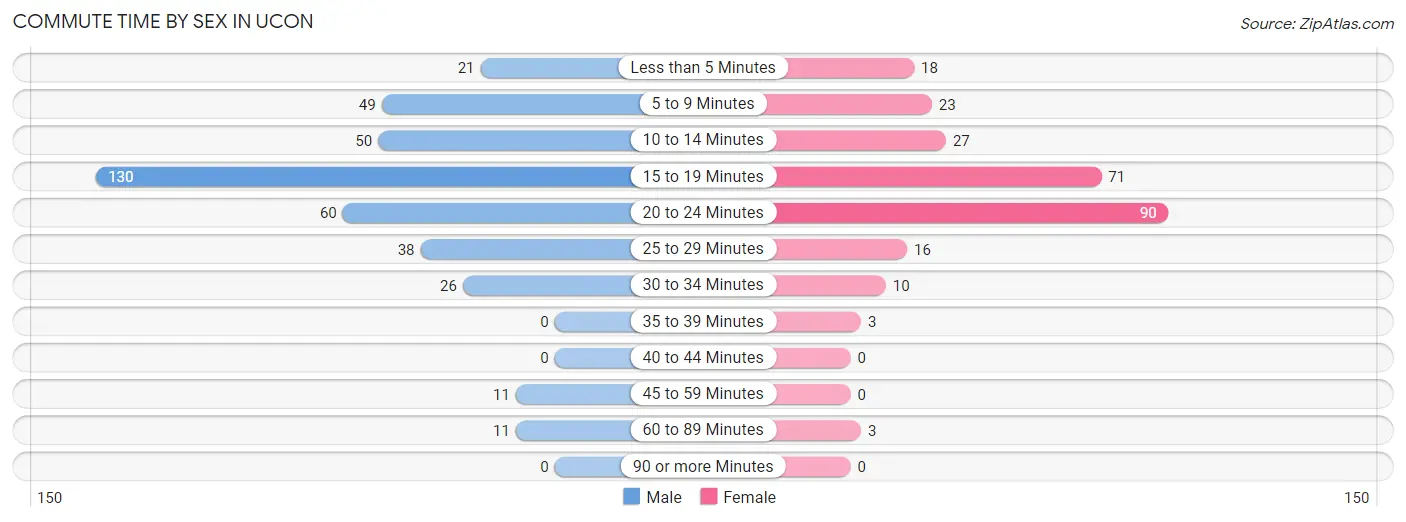
| Commute Time | Male | Female |
| Less than 5 Minutes | 21 (5.3%) | 18 (6.9%) |
| 5 to 9 Minutes | 49 (12.4%) | 23 (8.8%) |
| 10 to 14 Minutes | 50 (12.6%) | 27 (10.3%) |
| 15 to 19 Minutes | 130 (32.8%) | 71 (27.2%) |
| 20 to 24 Minutes | 60 (15.1%) | 90 (34.5%) |
| 25 to 29 Minutes | 38 (9.6%) | 16 (6.1%) |
| 30 to 34 Minutes | 26 (6.6%) | 10 (3.8%) |
| 35 to 39 Minutes | 0 (0.0%) | 3 (1.1%) |
| 40 to 44 Minutes | 0 (0.0%) | 0 (0.0%) |
| 45 to 59 Minutes | 11 (2.8%) | 0 (0.0%) |
| 60 to 89 Minutes | 11 (2.8%) | 3 (1.1%) |
| 90 or more Minutes | 0 (0.0%) | 0 (0.0%) |
Time of Departure to Work by Sex in Ucon
The most frequent times of departure to work in Ucon are 7:00 AM to 7:29 AM (95, 24.0%) for males and 8:00 AM to 8:29 AM (41, 15.7%) for females.
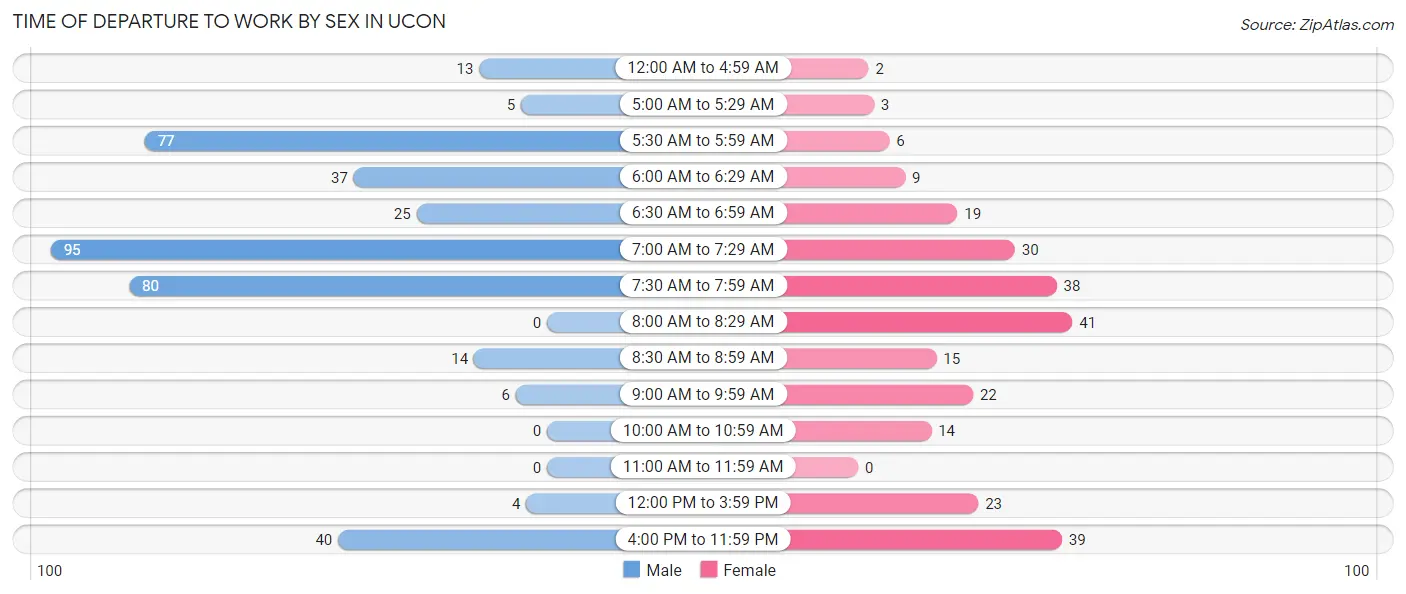
| Time of Departure | Male | Female |
| 12:00 AM to 4:59 AM | 13 (3.3%) | 2 (0.8%) |
| 5:00 AM to 5:29 AM | 5 (1.3%) | 3 (1.1%) |
| 5:30 AM to 5:59 AM | 77 (19.4%) | 6 (2.3%) |
| 6:00 AM to 6:29 AM | 37 (9.3%) | 9 (3.5%) |
| 6:30 AM to 6:59 AM | 25 (6.3%) | 19 (7.3%) |
| 7:00 AM to 7:29 AM | 95 (24.0%) | 30 (11.5%) |
| 7:30 AM to 7:59 AM | 80 (20.2%) | 38 (14.6%) |
| 8:00 AM to 8:29 AM | 0 (0.0%) | 41 (15.7%) |
| 8:30 AM to 8:59 AM | 14 (3.5%) | 15 (5.8%) |
| 9:00 AM to 9:59 AM | 6 (1.5%) | 22 (8.4%) |
| 10:00 AM to 10:59 AM | 0 (0.0%) | 14 (5.4%) |
| 11:00 AM to 11:59 AM | 0 (0.0%) | 0 (0.0%) |
| 12:00 PM to 3:59 PM | 4 (1.0%) | 23 (8.8%) |
| 4:00 PM to 11:59 PM | 40 (10.1%) | 39 (14.9%) |
| Total | 396 (100.0%) | 261 (100.0%) |
Housing Occupancy in Ucon
Occupancy by Ownership in Ucon
Of the total 503 dwellings in Ucon, owner-occupied units account for 449 (89.3%), while renter-occupied units make up 54 (10.7%).
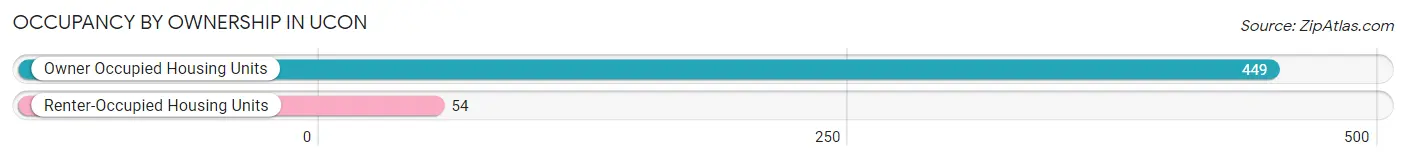
| Occupancy | # Housing Units | % Housing Units |
| Owner Occupied Housing Units | 449 | 89.3% |
| Renter-Occupied Housing Units | 54 | 10.7% |
| Total Occupied Housing Units | 503 | 100.0% |
Occupancy by Household Size in Ucon
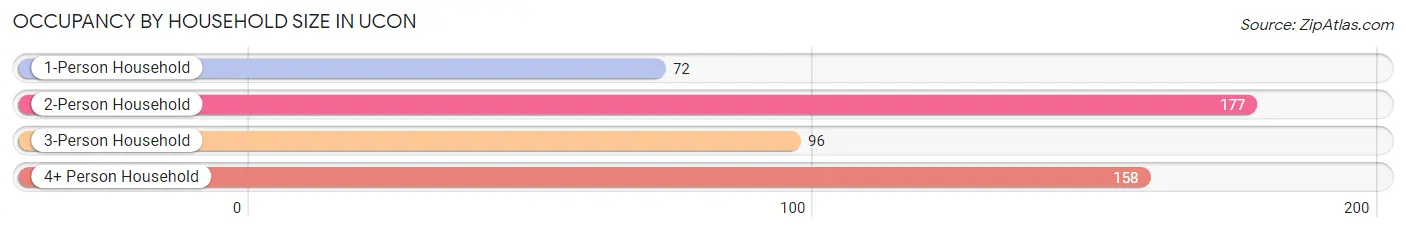
| Household Size | # Housing Units | % Housing Units |
| 1-Person Household | 72 | 14.3% |
| 2-Person Household | 177 | 35.2% |
| 3-Person Household | 96 | 19.1% |
| 4+ Person Household | 158 | 31.4% |
| Total Housing Units | 503 | 100.0% |
Occupancy by Ownership by Household Size in Ucon
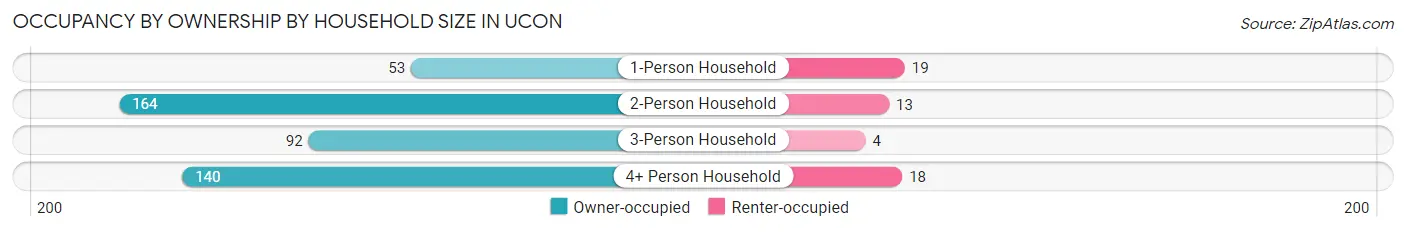
| Household Size | Owner-occupied | Renter-occupied |
| 1-Person Household | 53 (73.6%) | 19 (26.4%) |
| 2-Person Household | 164 (92.7%) | 13 (7.3%) |
| 3-Person Household | 92 (95.8%) | 4 (4.2%) |
| 4+ Person Household | 140 (88.6%) | 18 (11.4%) |
| Total Housing Units | 449 (89.3%) | 54 (10.7%) |
Occupancy by Educational Attainment in Ucon
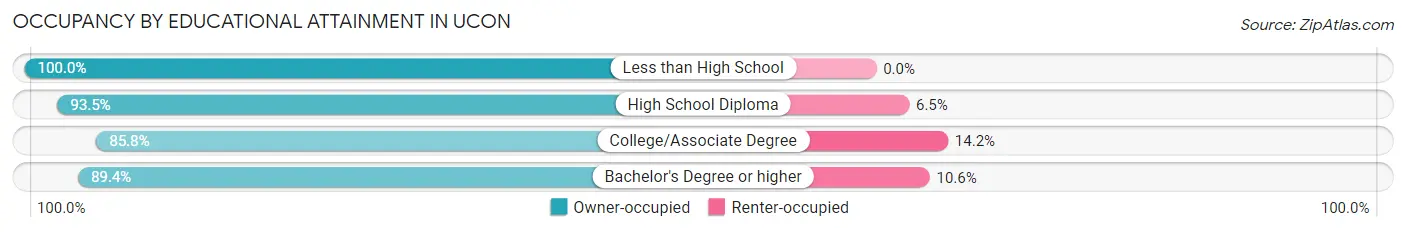
| Household Size | Owner-occupied | Renter-occupied |
| Less than High School | 5 (100.0%) | 0 (0.0%) |
| High School Diploma | 158 (93.5%) | 11 (6.5%) |
| College/Associate Degree | 193 (85.8%) | 32 (14.2%) |
| Bachelor's Degree or higher | 93 (89.4%) | 11 (10.6%) |
Occupancy by Age of Householder in Ucon
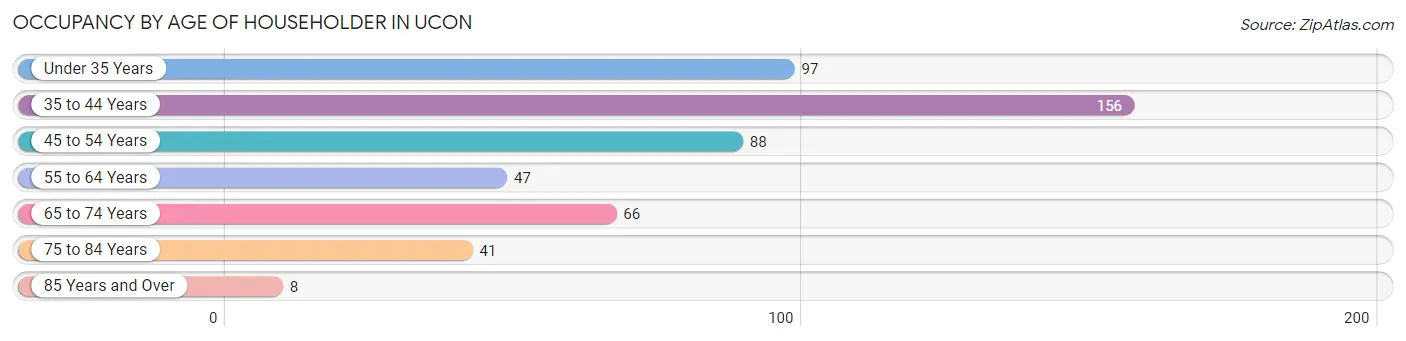
| Age Bracket | # Households | % Households |
| Under 35 Years | 97 | 19.3% |
| 35 to 44 Years | 156 | 31.0% |
| 45 to 54 Years | 88 | 17.5% |
| 55 to 64 Years | 47 | 9.3% |
| 65 to 74 Years | 66 | 13.1% |
| 75 to 84 Years | 41 | 8.2% |
| 85 Years and Over | 8 | 1.6% |
| Total | 503 | 100.0% |
Housing Finances in Ucon
Median Income by Occupancy in Ucon
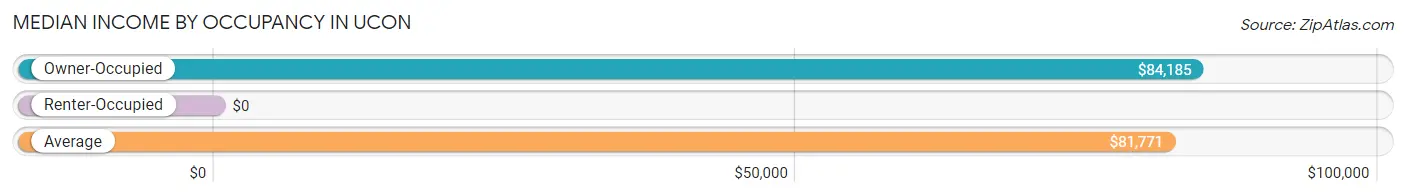
| Occupancy Type | # Households | Median Income |
| Owner-Occupied | 449 (89.3%) | $84,185 |
| Renter-Occupied | 54 (10.7%) | $0 |
| Average | 503 (100.0%) | $81,771 |
Occupancy by Householder Income Bracket in Ucon
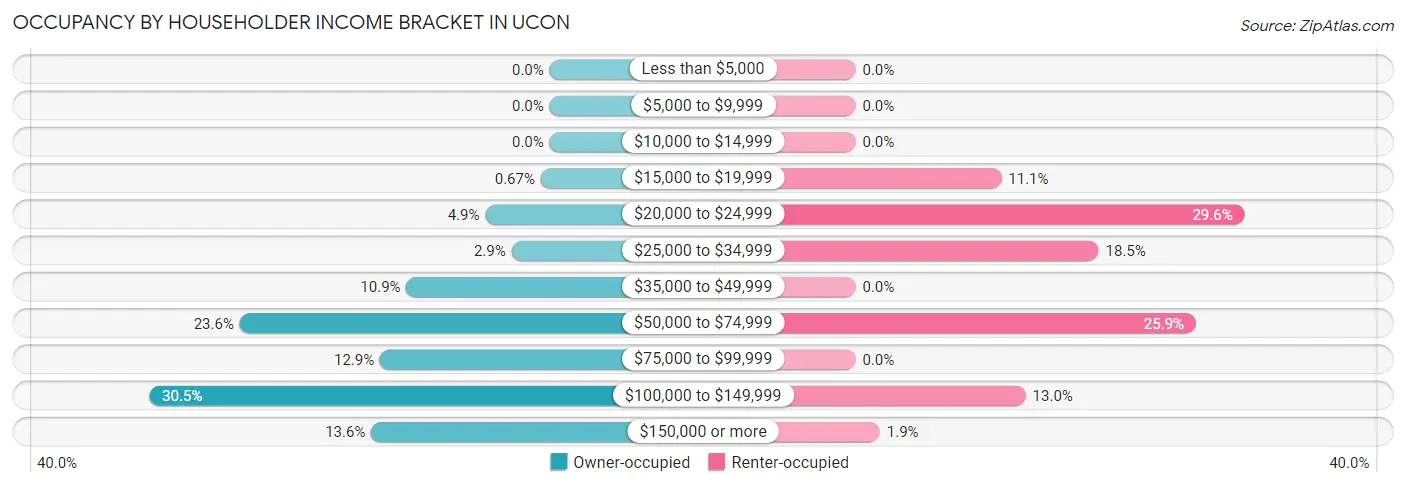
| Income Bracket | Owner-occupied | Renter-occupied |
| Less than $5,000 | 0 (0.0%) | 0 (0.0%) |
| $5,000 to $9,999 | 0 (0.0%) | 0 (0.0%) |
| $10,000 to $14,999 | 0 (0.0%) | 0 (0.0%) |
| $15,000 to $19,999 | 3 (0.7%) | 6 (11.1%) |
| $20,000 to $24,999 | 22 (4.9%) | 16 (29.6%) |
| $25,000 to $34,999 | 13 (2.9%) | 10 (18.5%) |
| $35,000 to $49,999 | 49 (10.9%) | 0 (0.0%) |
| $50,000 to $74,999 | 106 (23.6%) | 14 (25.9%) |
| $75,000 to $99,999 | 58 (12.9%) | 0 (0.0%) |
| $100,000 to $149,999 | 137 (30.5%) | 7 (13.0%) |
| $150,000 or more | 61 (13.6%) | 1 (1.8%) |
| Total | 449 (100.0%) | 54 (100.0%) |
Monthly Housing Cost Tiers in Ucon
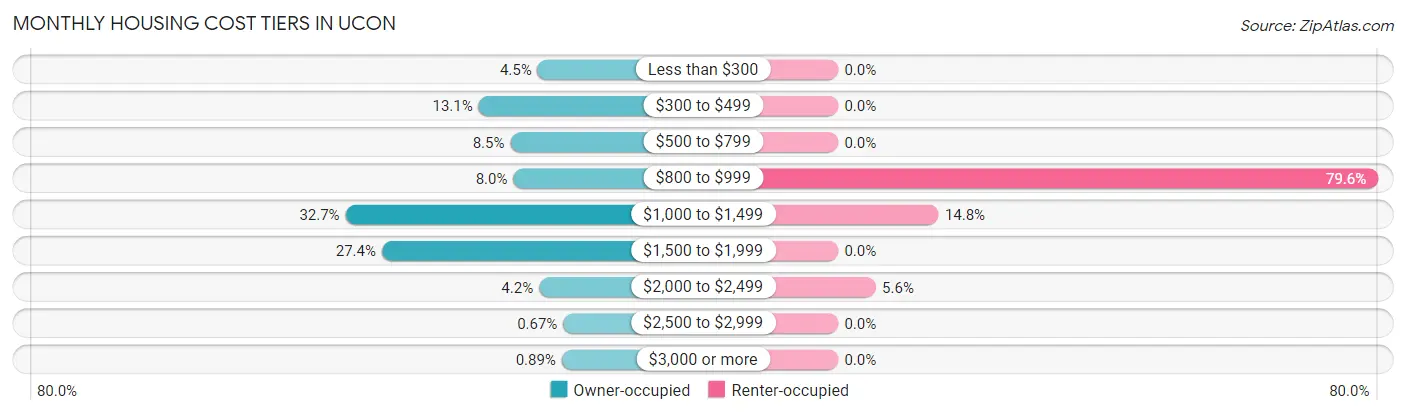
| Monthly Cost | Owner-occupied | Renter-occupied |
| Less than $300 | 20 (4.4%) | 0 (0.0%) |
| $300 to $499 | 59 (13.1%) | 0 (0.0%) |
| $500 to $799 | 38 (8.5%) | 0 (0.0%) |
| $800 to $999 | 36 (8.0%) | 43 (79.6%) |
| $1,000 to $1,499 | 147 (32.7%) | 8 (14.8%) |
| $1,500 to $1,999 | 123 (27.4%) | 0 (0.0%) |
| $2,000 to $2,499 | 19 (4.2%) | 3 (5.6%) |
| $2,500 to $2,999 | 3 (0.7%) | 0 (0.0%) |
| $3,000 or more | 4 (0.9%) | 0 (0.0%) |
| Total | 449 (100.0%) | 54 (100.0%) |
Physical Housing Characteristics in Ucon
Housing Structures in Ucon
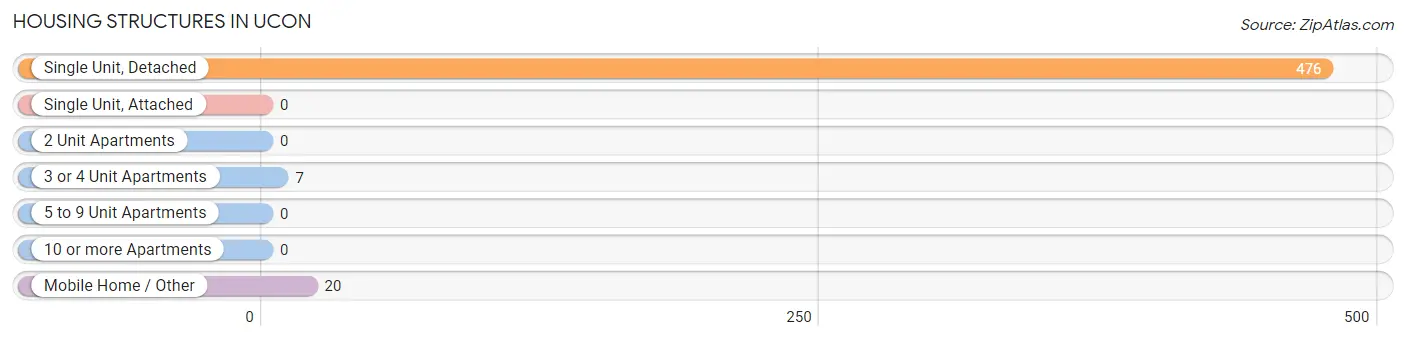
| Structure Type | # Housing Units | % Housing Units |
| Single Unit, Detached | 476 | 94.6% |
| Single Unit, Attached | 0 | 0.0% |
| 2 Unit Apartments | 0 | 0.0% |
| 3 or 4 Unit Apartments | 7 | 1.4% |
| 5 to 9 Unit Apartments | 0 | 0.0% |
| 10 or more Apartments | 0 | 0.0% |
| Mobile Home / Other | 20 | 4.0% |
| Total | 503 | 100.0% |
Housing Structures by Occupancy in Ucon
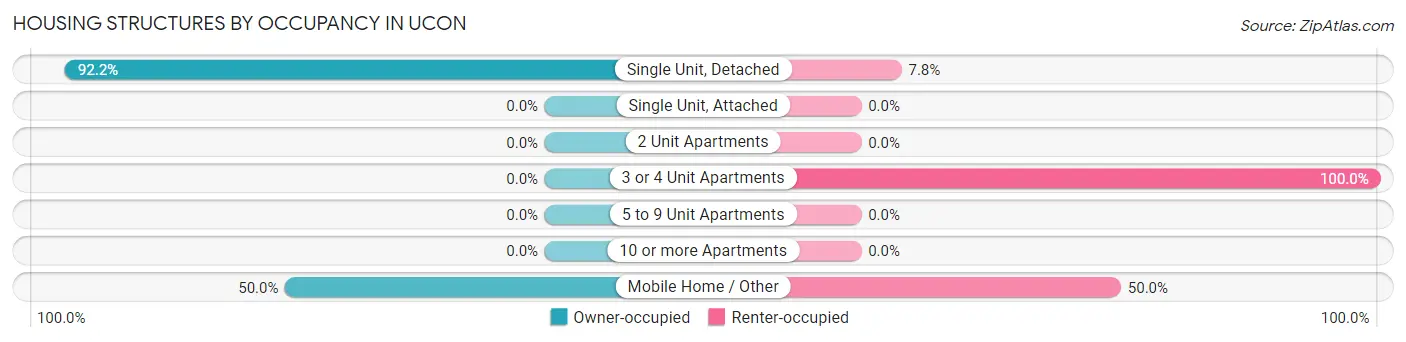
| Structure Type | Owner-occupied | Renter-occupied |
| Single Unit, Detached | 439 (92.2%) | 37 (7.8%) |
| Single Unit, Attached | 0 (0.0%) | 0 (0.0%) |
| 2 Unit Apartments | 0 (0.0%) | 0 (0.0%) |
| 3 or 4 Unit Apartments | 0 (0.0%) | 7 (100.0%) |
| 5 to 9 Unit Apartments | 0 (0.0%) | 0 (0.0%) |
| 10 or more Apartments | 0 (0.0%) | 0 (0.0%) |
| Mobile Home / Other | 10 (50.0%) | 10 (50.0%) |
| Total | 449 (89.3%) | 54 (10.7%) |
Housing Structures by Number of Rooms in Ucon
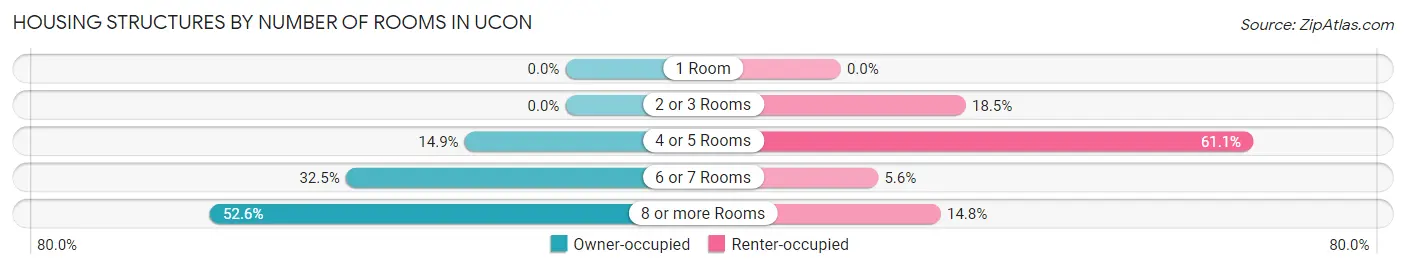
| Number of Rooms | Owner-occupied | Renter-occupied |
| 1 Room | 0 (0.0%) | 0 (0.0%) |
| 2 or 3 Rooms | 0 (0.0%) | 10 (18.5%) |
| 4 or 5 Rooms | 67 (14.9%) | 33 (61.1%) |
| 6 or 7 Rooms | 146 (32.5%) | 3 (5.6%) |
| 8 or more Rooms | 236 (52.6%) | 8 (14.8%) |
| Total | 449 (100.0%) | 54 (100.0%) |
Housing Structure by Heating Type in Ucon
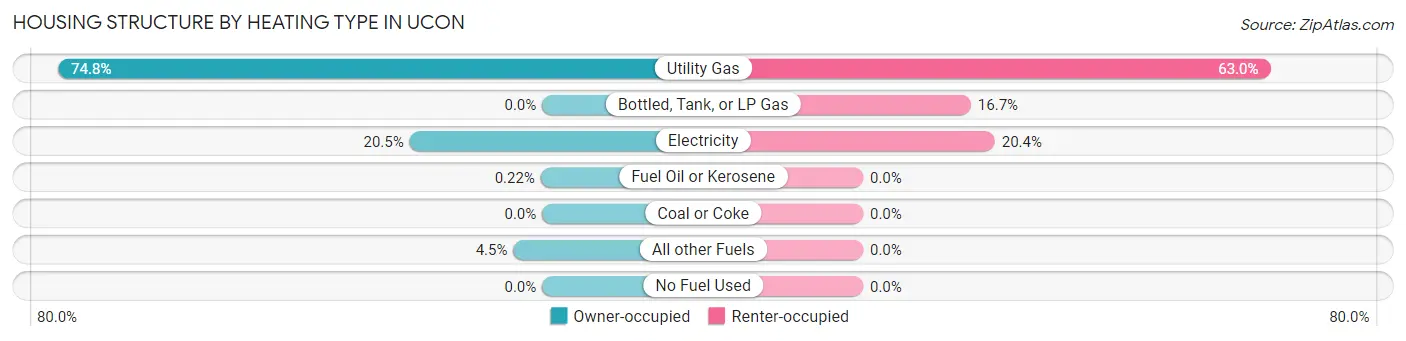
| Heating Type | Owner-occupied | Renter-occupied |
| Utility Gas | 336 (74.8%) | 34 (63.0%) |
| Bottled, Tank, or LP Gas | 0 (0.0%) | 9 (16.7%) |
| Electricity | 92 (20.5%) | 11 (20.4%) |
| Fuel Oil or Kerosene | 1 (0.2%) | 0 (0.0%) |
| Coal or Coke | 0 (0.0%) | 0 (0.0%) |
| All other Fuels | 20 (4.4%) | 0 (0.0%) |
| No Fuel Used | 0 (0.0%) | 0 (0.0%) |
| Total | 449 (100.0%) | 54 (100.0%) |
Household Vehicle Usage in Ucon
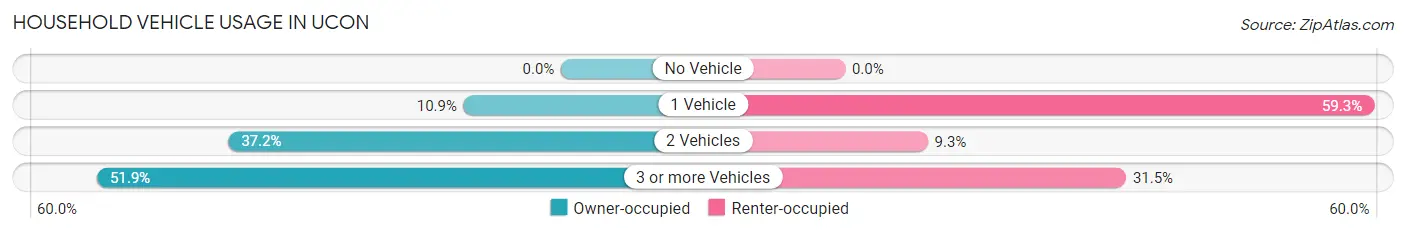
| Vehicles per Household | Owner-occupied | Renter-occupied |
| No Vehicle | 0 (0.0%) | 0 (0.0%) |
| 1 Vehicle | 49 (10.9%) | 32 (59.3%) |
| 2 Vehicles | 167 (37.2%) | 5 (9.3%) |
| 3 or more Vehicles | 233 (51.9%) | 17 (31.5%) |
| Total | 449 (100.0%) | 54 (100.0%) |
Real Estate & Mortgages in Ucon
Real Estate and Mortgage Overview in Ucon
| Characteristic | Without Mortgage | With Mortgage |
| Housing Units | 78 | 371 |
| Median Property Value | $253,300 | $278,900 |
| Median Household Income | $68,500 | $48 |
| Monthly Housing Costs | $331 | $4 |
| Real Estate Taxes | $1,163 | $9 |
Property Value by Mortgage Status in Ucon
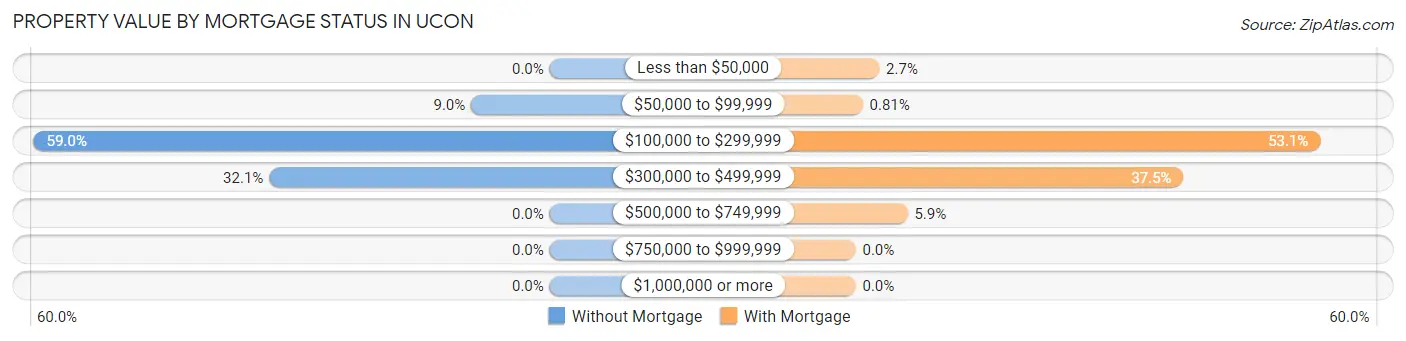
| Property Value | Without Mortgage | With Mortgage |
| Less than $50,000 | 0 (0.0%) | 10 (2.7%) |
| $50,000 to $99,999 | 7 (9.0%) | 3 (0.8%) |
| $100,000 to $299,999 | 46 (59.0%) | 197 (53.1%) |
| $300,000 to $499,999 | 25 (32.1%) | 139 (37.5%) |
| $500,000 to $749,999 | 0 (0.0%) | 22 (5.9%) |
| $750,000 to $999,999 | 0 (0.0%) | 0 (0.0%) |
| $1,000,000 or more | 0 (0.0%) | 0 (0.0%) |
| Total | 78 (100.0%) | 371 (100.0%) |
Household Income by Mortgage Status in Ucon
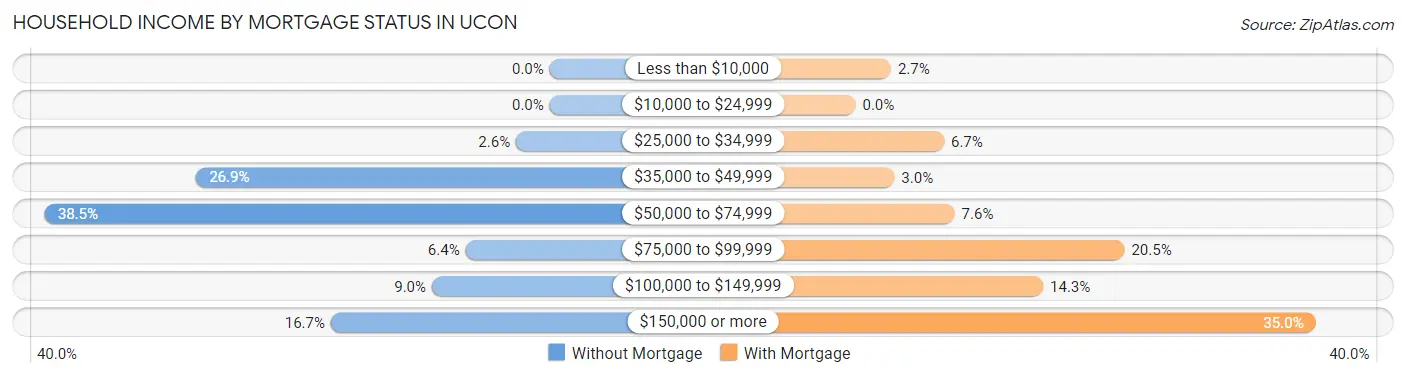
| Household Income | Without Mortgage | With Mortgage |
| Less than $10,000 | 0 (0.0%) | 10 (2.7%) |
| $10,000 to $24,999 | 0 (0.0%) | 0 (0.0%) |
| $25,000 to $34,999 | 2 (2.6%) | 25 (6.7%) |
| $35,000 to $49,999 | 21 (26.9%) | 11 (3.0%) |
| $50,000 to $74,999 | 30 (38.5%) | 28 (7.5%) |
| $75,000 to $99,999 | 5 (6.4%) | 76 (20.5%) |
| $100,000 to $149,999 | 7 (9.0%) | 53 (14.3%) |
| $150,000 or more | 13 (16.7%) | 130 (35.0%) |
| Total | 78 (100.0%) | 371 (100.0%) |
Property Value to Household Income Ratio in Ucon
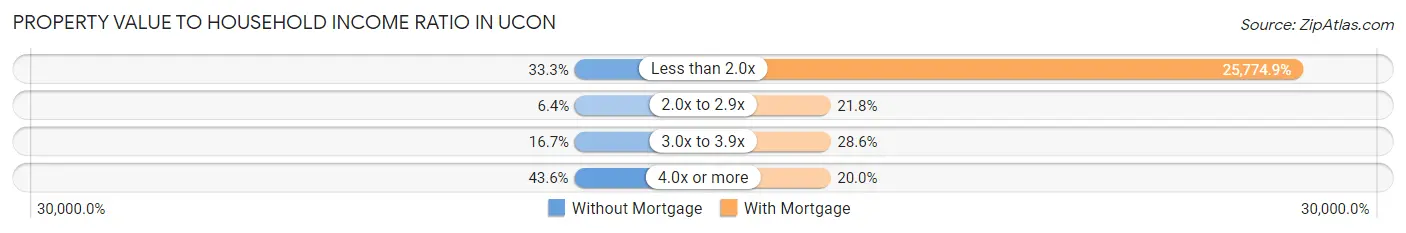
| Value-to-Income Ratio | Without Mortgage | With Mortgage |
| Less than 2.0x | 26 (33.3%) | 95,625 (25,774.9%) |
| 2.0x to 2.9x | 5 (6.4%) | 81 (21.8%) |
| 3.0x to 3.9x | 13 (16.7%) | 106 (28.6%) |
| 4.0x or more | 34 (43.6%) | 74 (20.0%) |
| Total | 78 (100.0%) | 371 (100.0%) |
Real Estate Taxes by Mortgage Status in Ucon
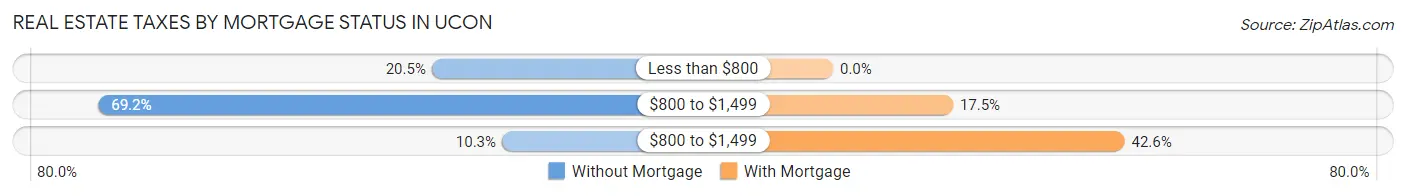
| Property Taxes | Without Mortgage | With Mortgage |
| Less than $800 | 16 (20.5%) | 0 (0.0%) |
| $800 to $1,499 | 54 (69.2%) | 65 (17.5%) |
| $800 to $1,499 | 8 (10.3%) | 158 (42.6%) |
| Total | 78 (100.0%) | 371 (100.0%) |
Health & Disability in Ucon
Health Insurance Coverage by Age in Ucon
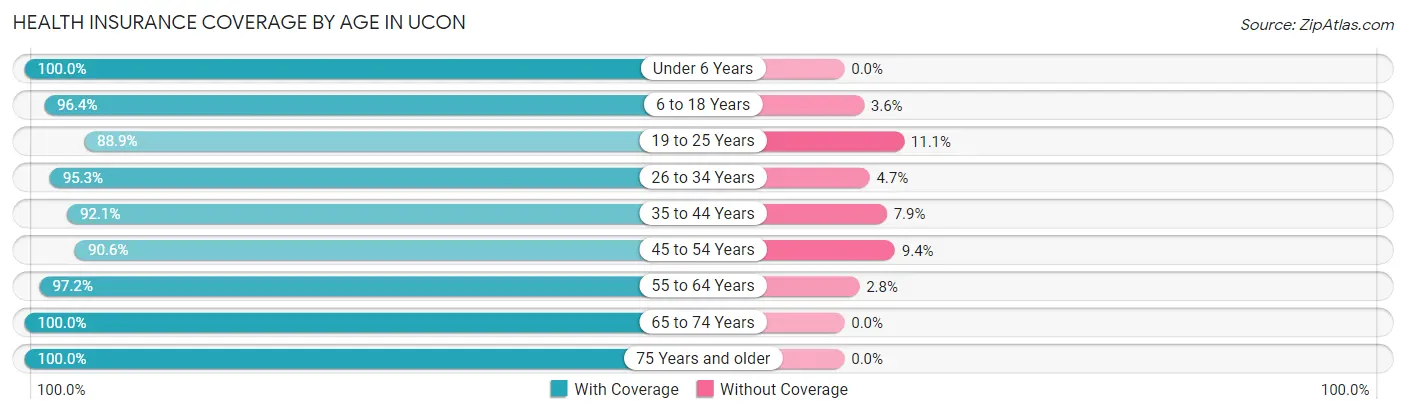
| Age Bracket | With Coverage | Without Coverage |
| Under 6 Years | 116 (100.0%) | 0 (0.0%) |
| 6 to 18 Years | 424 (96.4%) | 16 (3.6%) |
| 19 to 25 Years | 120 (88.9%) | 15 (11.1%) |
| 26 to 34 Years | 122 (95.3%) | 6 (4.7%) |
| 35 to 44 Years | 291 (92.1%) | 25 (7.9%) |
| 45 to 54 Years | 173 (90.6%) | 18 (9.4%) |
| 55 to 64 Years | 105 (97.2%) | 3 (2.8%) |
| 65 to 74 Years | 125 (100.0%) | 0 (0.0%) |
| 75 Years and older | 72 (100.0%) | 0 (0.0%) |
| Total | 1,548 (94.9%) | 83 (5.1%) |
Health Insurance Coverage by Citizenship Status in Ucon
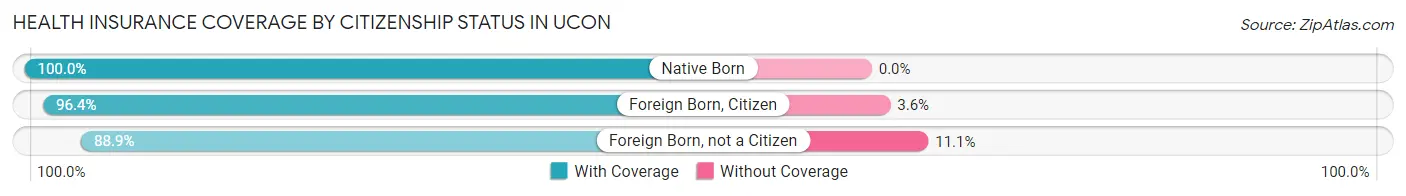
| Citizenship Status | With Coverage | Without Coverage |
| Native Born | 116 (100.0%) | 0 (0.0%) |
| Foreign Born, Citizen | 424 (96.4%) | 16 (3.6%) |
| Foreign Born, not a Citizen | 120 (88.9%) | 15 (11.1%) |
Health Insurance Coverage by Household Income in Ucon
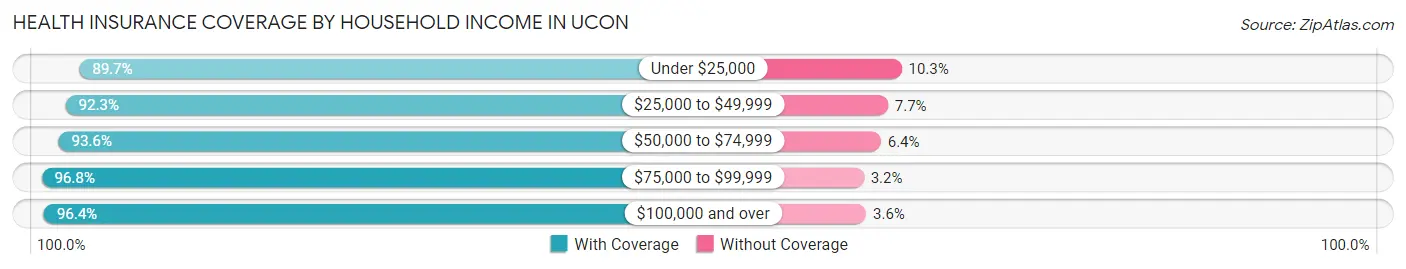
| Household Income | With Coverage | Without Coverage |
| Under $25,000 | 70 (89.7%) | 8 (10.3%) |
| $25,000 to $49,999 | 180 (92.3%) | 15 (7.7%) |
| $50,000 to $74,999 | 397 (93.6%) | 27 (6.4%) |
| $75,000 to $99,999 | 183 (96.8%) | 6 (3.2%) |
| $100,000 and over | 718 (96.4%) | 27 (3.6%) |
Public vs Private Health Insurance Coverage by Age in Ucon
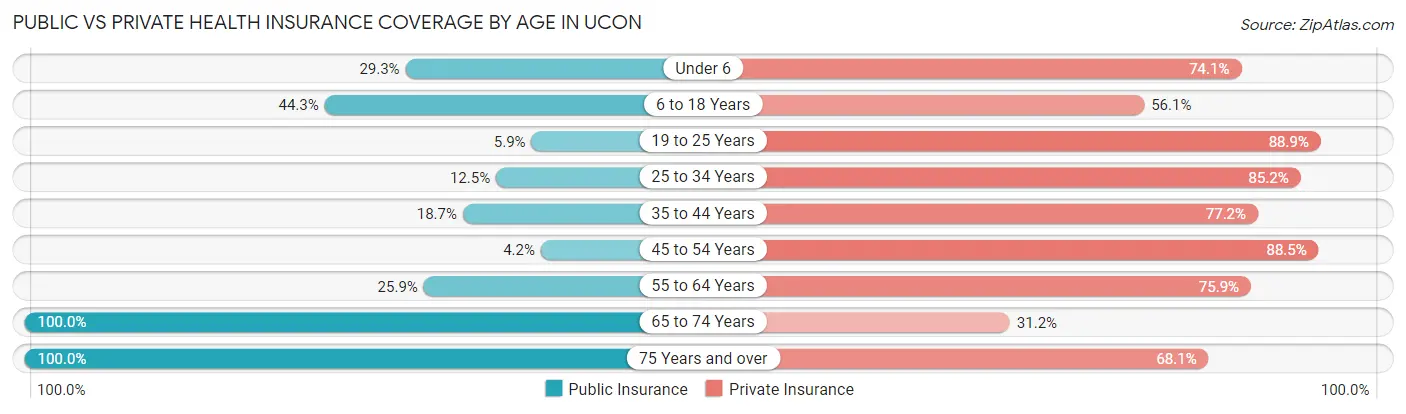
| Age Bracket | Public Insurance | Private Insurance |
| Under 6 | 34 (29.3%) | 86 (74.1%) |
| 6 to 18 Years | 195 (44.3%) | 247 (56.1%) |
| 19 to 25 Years | 8 (5.9%) | 120 (88.9%) |
| 25 to 34 Years | 16 (12.5%) | 109 (85.2%) |
| 35 to 44 Years | 59 (18.7%) | 244 (77.2%) |
| 45 to 54 Years | 8 (4.2%) | 169 (88.5%) |
| 55 to 64 Years | 28 (25.9%) | 82 (75.9%) |
| 65 to 74 Years | 125 (100.0%) | 39 (31.2%) |
| 75 Years and over | 72 (100.0%) | 49 (68.1%) |
| Total | 545 (33.4%) | 1,145 (70.2%) |
Disability Status by Sex by Age in Ucon
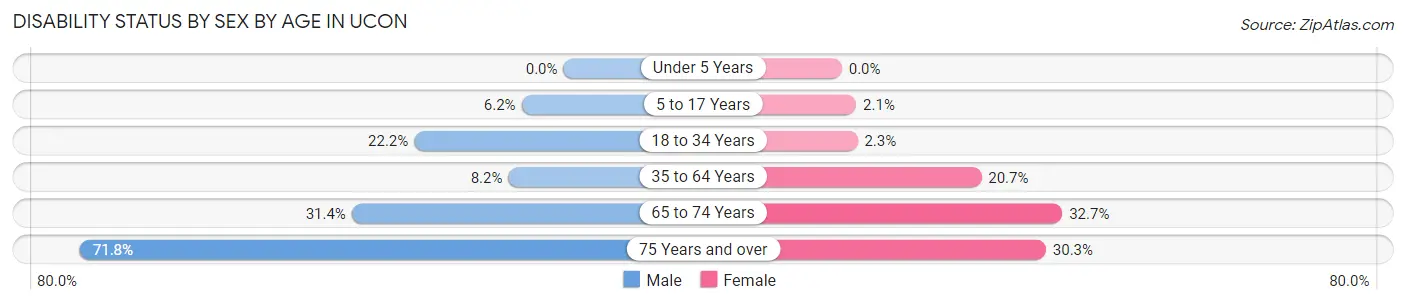
| Age Bracket | Male | Female |
| Under 5 Years | 0 (0.0%) | 0 (0.0%) |
| 5 to 17 Years | 15 (6.2%) | 4 (2.1%) |
| 18 to 34 Years | 41 (22.2%) | 3 (2.3%) |
| 35 to 64 Years | 25 (8.2%) | 64 (20.7%) |
| 65 to 74 Years | 22 (31.4%) | 18 (32.7%) |
| 75 Years and over | 28 (71.8%) | 10 (30.3%) |
Disability Class by Sex by Age in Ucon
Disability Class: Hearing Difficulty
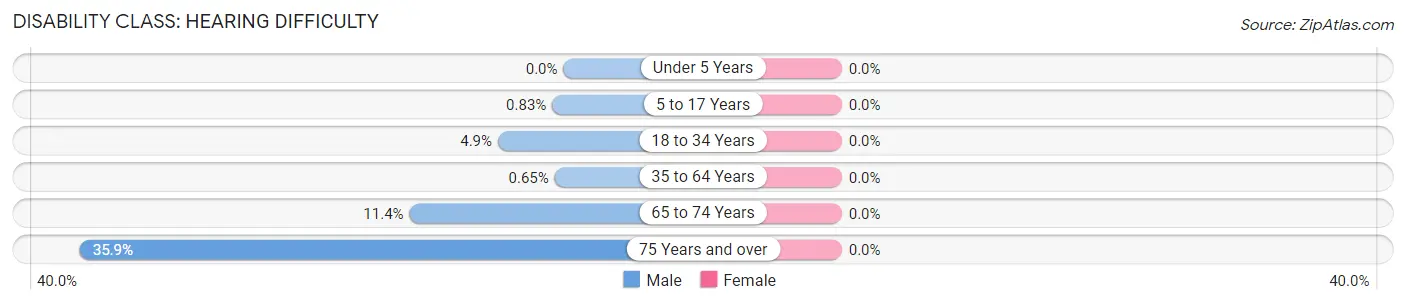
| Age Bracket | Male | Female |
| Under 5 Years | 0 (0.0%) | 0 (0.0%) |
| 5 to 17 Years | 2 (0.8%) | 0 (0.0%) |
| 18 to 34 Years | 9 (4.9%) | 0 (0.0%) |
| 35 to 64 Years | 2 (0.6%) | 0 (0.0%) |
| 65 to 74 Years | 8 (11.4%) | 0 (0.0%) |
| 75 Years and over | 14 (35.9%) | 0 (0.0%) |
Disability Class: Vision Difficulty
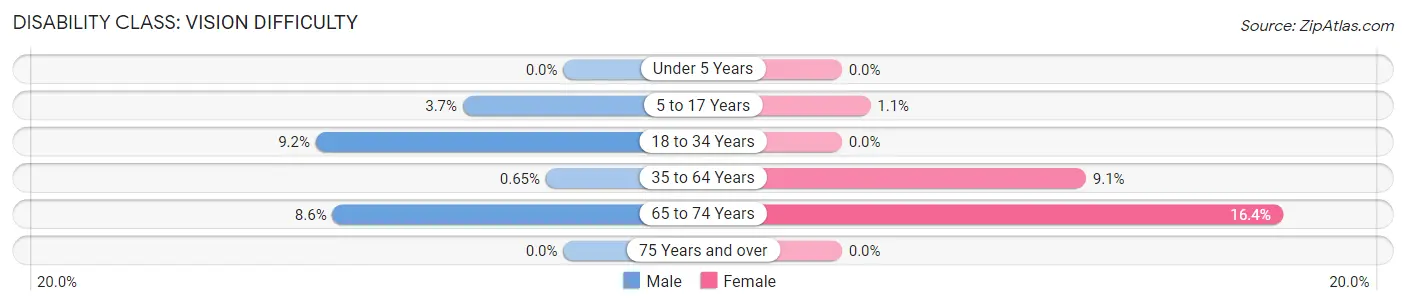
| Age Bracket | Male | Female |
| Under 5 Years | 0 (0.0%) | 0 (0.0%) |
| 5 to 17 Years | 9 (3.7%) | 2 (1.1%) |
| 18 to 34 Years | 17 (9.2%) | 0 (0.0%) |
| 35 to 64 Years | 2 (0.6%) | 28 (9.1%) |
| 65 to 74 Years | 6 (8.6%) | 9 (16.4%) |
| 75 Years and over | 0 (0.0%) | 0 (0.0%) |
Disability Class: Cognitive Difficulty
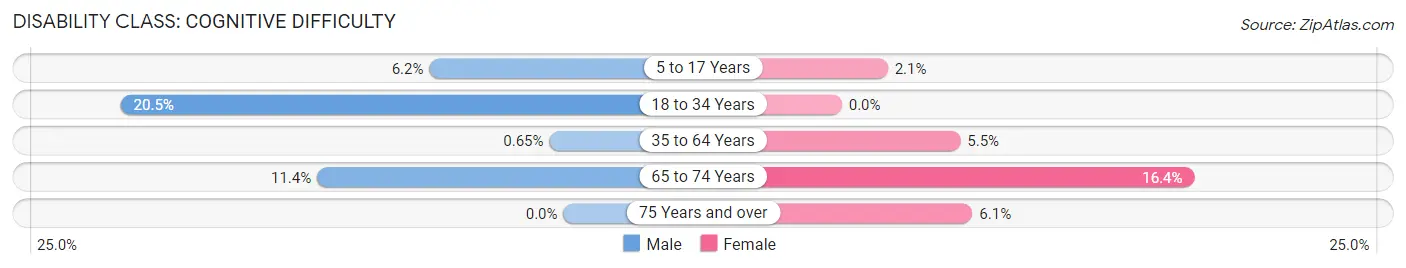
| Age Bracket | Male | Female |
| 5 to 17 Years | 15 (6.2%) | 4 (2.1%) |
| 18 to 34 Years | 38 (20.5%) | 0 (0.0%) |
| 35 to 64 Years | 2 (0.6%) | 17 (5.5%) |
| 65 to 74 Years | 8 (11.4%) | 9 (16.4%) |
| 75 Years and over | 0 (0.0%) | 2 (6.1%) |
Disability Class: Ambulatory Difficulty
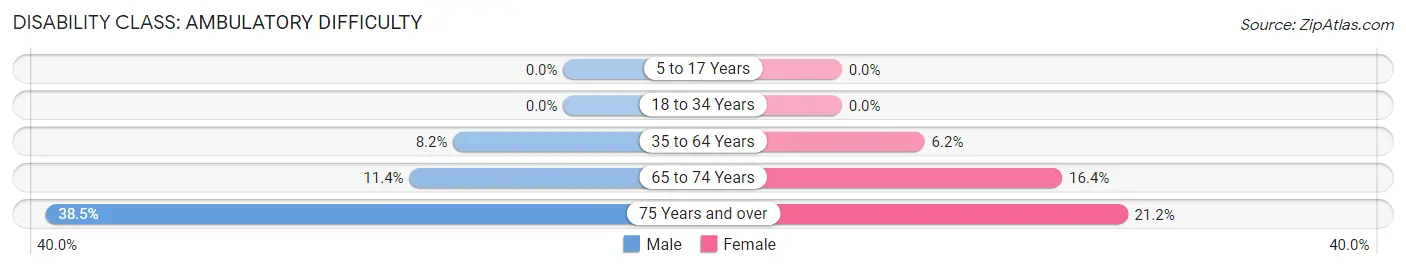
| Age Bracket | Male | Female |
| 5 to 17 Years | 0 (0.0%) | 0 (0.0%) |
| 18 to 34 Years | 0 (0.0%) | 0 (0.0%) |
| 35 to 64 Years | 25 (8.2%) | 19 (6.1%) |
| 65 to 74 Years | 8 (11.4%) | 9 (16.4%) |
| 75 Years and over | 15 (38.5%) | 7 (21.2%) |
Disability Class: Self-Care Difficulty
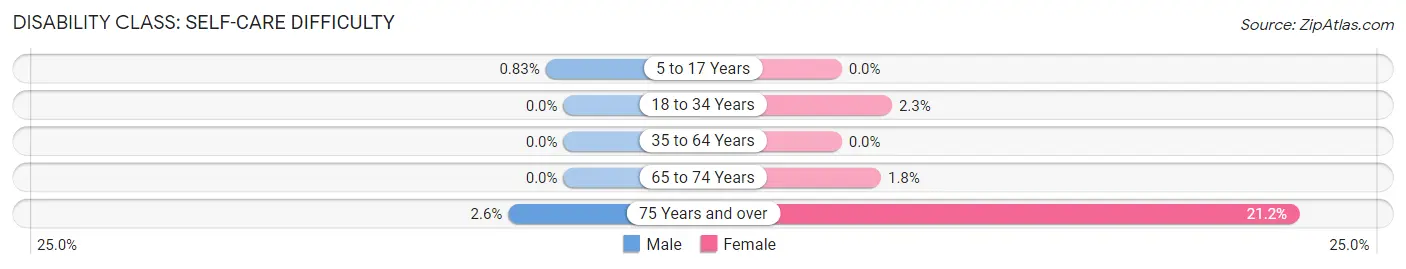
| Age Bracket | Male | Female |
| 5 to 17 Years | 2 (0.8%) | 0 (0.0%) |
| 18 to 34 Years | 0 (0.0%) | 3 (2.3%) |
| 35 to 64 Years | 0 (0.0%) | 0 (0.0%) |
| 65 to 74 Years | 0 (0.0%) | 1 (1.8%) |
| 75 Years and over | 1 (2.6%) | 7 (21.2%) |
Technology Access in Ucon
Computing Device Access in Ucon
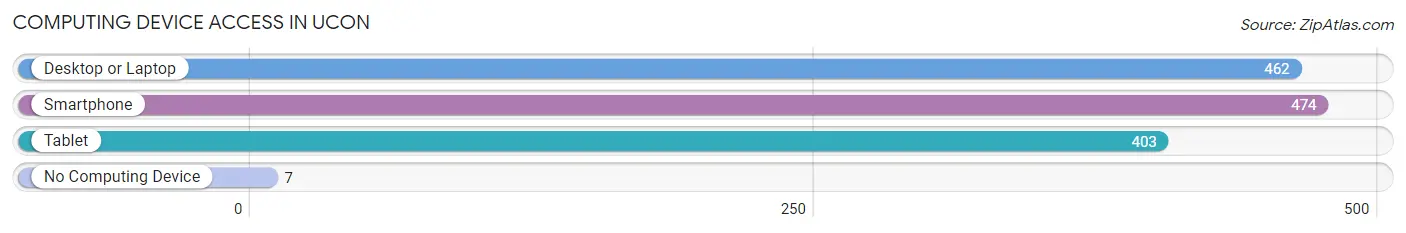
| Device Type | # Households | % Households |
| Desktop or Laptop | 462 | 91.8% |
| Smartphone | 474 | 94.2% |
| Tablet | 403 | 80.1% |
| No Computing Device | 7 | 1.4% |
| Total | 503 | 100.0% |
Internet Access in Ucon
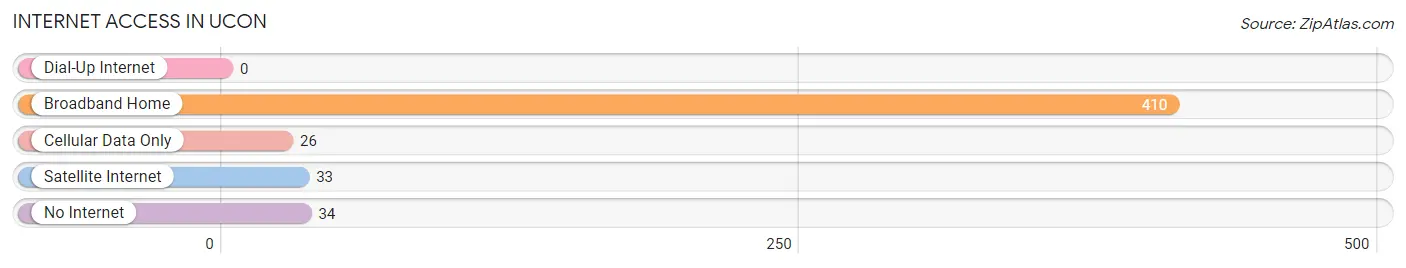
| Internet Type | # Households | % Households |
| Dial-Up Internet | 0 | 0.0% |
| Broadband Home | 410 | 81.5% |
| Cellular Data Only | 26 | 5.2% |
| Satellite Internet | 33 | 6.6% |
| No Internet | 34 | 6.8% |
| Total | 503 | 100.0% |
Ucon Summary
Ucon is a city located in the southeastern part of Idaho, United States. It is the county seat of Bonneville County and the largest city in the county. The city is situated along the Snake River and is part of the Idaho Falls Metropolitan Statistical Area. As of the 2010 census, the population of Ucon was 15,523.
History
Ucon was founded in 1864 by Mormon settlers who were sent to the area by Brigham Young. The city was named after Ucon, a Native American chief who lived in the area. The settlers built a fort and a sawmill, and the city quickly grew. In 1872, the city was incorporated and the first mayor was elected.
In the late 19th century, Ucon became a major railroad hub, with the Union Pacific Railroad running through the city. This allowed the city to become a major agricultural center, with many farms and ranches in the area.
In the early 20th century, Ucon experienced a period of growth and development. The city was home to several large businesses, including a sugar beet factory, a flour mill, and a woolen mill. The city also became a major center for education, with several colleges and universities located in the area.
Geography
Ucon is located in southeastern Idaho, in the Snake River Valley. The city is situated along the Snake River, and is bordered by the cities of Idaho Falls, Ammon, and Iona. The city is located at an elevation of 4,845 feet (1,476 m).
The climate in Ucon is semi-arid, with hot summers and cold winters. The average annual temperature is 48°F (9°C). The average annual precipitation is 11.5 inches (292 mm).
Economy
Ucon is a major agricultural center, with many farms and ranches in the area. The city is also home to several large businesses, including a sugar beet factory, a flour mill, and a woolen mill.
The city is also home to several educational institutions, including Idaho State University, Brigham Young University-Idaho, and the University of Idaho.
Demographics
As of the 2010 census, the population of Ucon was 15,523. The racial makeup of the city was 90.2% White, 0.7% African American, 0.7% Native American, 0.7% Asian, 0.2% Pacific Islander, 5.3% from other races, and 2.1% from two or more races. Hispanic or Latino of any race were 8.3% of the population.
The median income for a household in Ucon was $41,945, and the median income for a family was $50,945. The per capita income for the city was $20,945. About 8.3% of families and 11.3% of the population were below the poverty line.
Common Questions
What is Per Capita Income in Ucon?
Per Capita income in Ucon is $31,374.
What is the Median Family Income in Ucon?
Median Family Income in Ucon is $101,875.
What is the Median Household income in Ucon?
Median Household Income in Ucon is $81,771.
What is Income or Wage Gap in Ucon?
Income or Wage Gap in Ucon is 36.6%.
Women in Ucon earn 63.4 cents for every dollar earned by a man.
What is Inequality or Gini Index in Ucon?
Inequality or Gini Index in Ucon is 0.35.
What is the Total Population of Ucon?
Total Population of Ucon is 1,631.
What is the Total Male Population of Ucon?
Total Male Population of Ucon is 882.
What is the Total Female Population of Ucon?
Total Female Population of Ucon is 749.
What is the Ratio of Males per 100 Females in Ucon?
There are 117.76 Males per 100 Females in Ucon.
What is the Ratio of Females per 100 Males in Ucon?
There are 84.92 Females per 100 Males in Ucon.
What is the Median Population Age in Ucon?
Median Population Age in Ucon is 34.8 Years.
What is the Average Family Size in Ucon
Average Family Size in Ucon is 3.6 People.
What is the Average Household Size in Ucon
Average Household Size in Ucon is 3.2 People.
How Large is the Labor Force in Ucon?
There are 866 People in the Labor Forcein in Ucon.
What is the Percentage of People in the Labor Force in Ucon?
72.2% of People are in the Labor Force in Ucon.
What is the Unemployment Rate in Ucon?
Unemployment Rate in Ucon is 5.1%.