Hamer, ID Map & Demographics
Hamer Map
Hamer Overview
$28,711
PER CAPITA INCOME
$100,000
AVG FAMILY INCOME
$103,750
AVG HOUSEHOLD INCOME
52.4%
WAGE / INCOME GAP [ % ]
47.6¢/ $1
WAGE / INCOME GAP [ $ ]
0.30
INEQUALITY / GINI INDEX
38
TOTAL POPULATION
23
MALE POPULATION
15
FEMALE POPULATION
153.33
MALES / 100 FEMALES
65.22
FEMALES / 100 MALES
61.5
MEDIAN AGE
3.5
AVG FAMILY SIZE
2.9
AVG HOUSEHOLD SIZE
17
LABOR FORCE [ PEOPLE ]
54.8%
PERCENT IN LABOR FORCE
Hamer Zip Codes
Hamer Area Codes
Income in Hamer
Income Overview in Hamer
Per Capita Income in Hamer is $28,711, while median incomes of families and households are $100,000 and $103,750 respectively.
| Characteristic | Number | Measure |
| Per Capita Income | 38 | $28,711 |
| Median Family Income | 10 | $100,000 |
| Mean Family Income | 10 | $79,580 |
| Median Household Income | 13 | $103,750 |
| Mean Household Income | 13 | $85,346 |
| Income Deficit | 10 | $0 |
| Wage / Income Gap (%) | 38 | 52.39% |
| Wage / Income Gap ($) | 38 | 47.61¢ per $1 |
| Gini / Inequality Index | 38 | 0.30 |
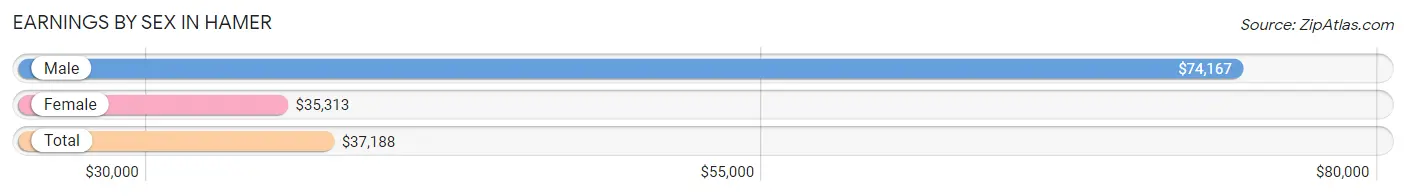
Earnings by Sex in Hamer
Average Earnings in Hamer are $37,188, $74,167 for men and $35,313 for women, a difference of 52.4%.
| Sex | Number | Average Earnings |
| Male | 8 (47.1%) | $74,167 |
| Female | 9 (52.9%) | $35,313 |
| Total | 17 (100.0%) | $37,188 |
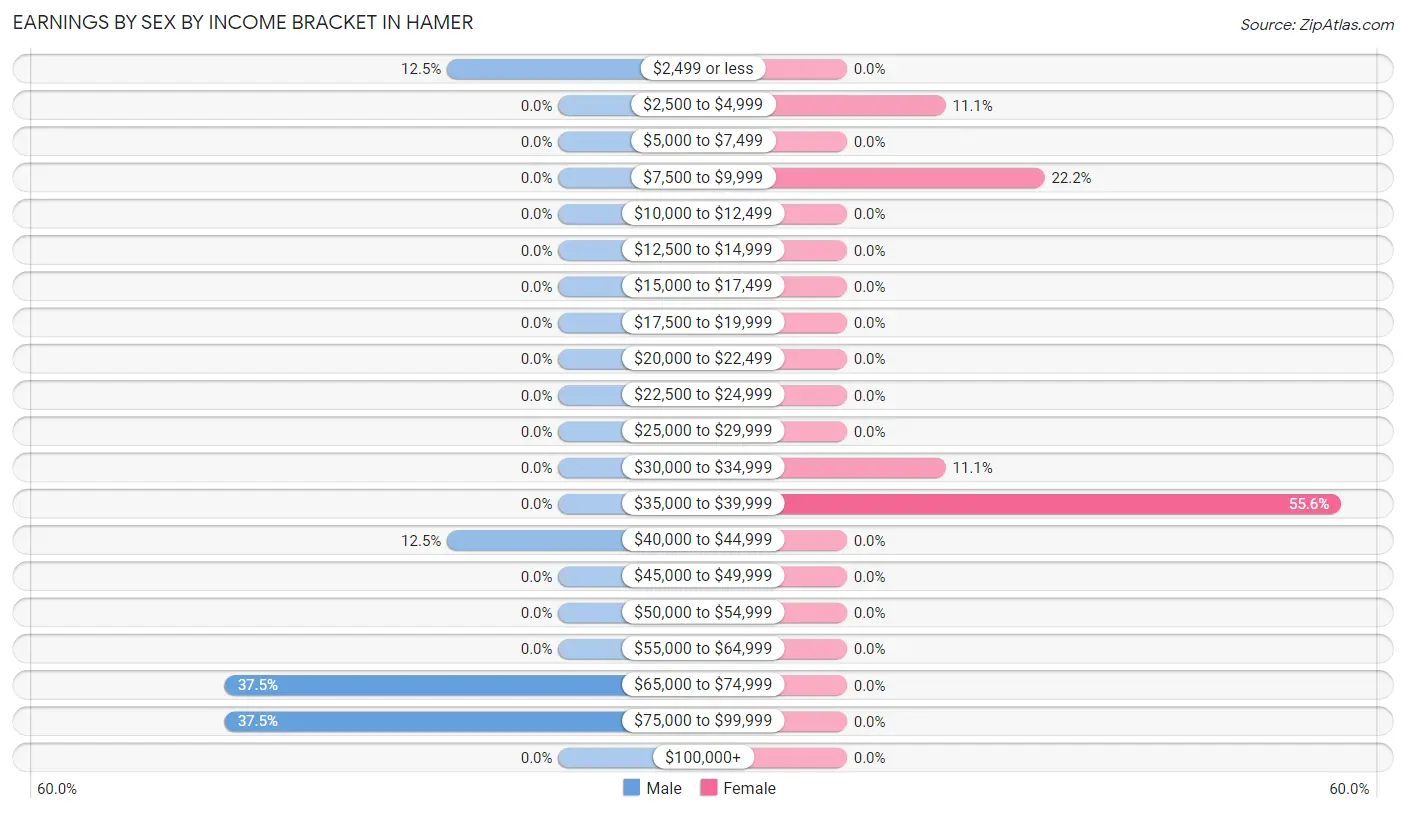
Earnings by Sex by Income Bracket in Hamer
The most common earnings brackets in Hamer are $65,000 to $74,999 for men (3 | 37.5%) and $35,000 to $39,999 for women (5 | 55.6%).
| Income | Male | Female |
| $2,499 or less | 1 (12.5%) | 0 (0.0%) |
| $2,500 to $4,999 | 0 (0.0%) | 1 (11.1%) |
| $5,000 to $7,499 | 0 (0.0%) | 0 (0.0%) |
| $7,500 to $9,999 | 0 (0.0%) | 2 (22.2%) |
| $10,000 to $12,499 | 0 (0.0%) | 0 (0.0%) |
| $12,500 to $14,999 | 0 (0.0%) | 0 (0.0%) |
| $15,000 to $17,499 | 0 (0.0%) | 0 (0.0%) |
| $17,500 to $19,999 | 0 (0.0%) | 0 (0.0%) |
| $20,000 to $22,499 | 0 (0.0%) | 0 (0.0%) |
| $22,500 to $24,999 | 0 (0.0%) | 0 (0.0%) |
| $25,000 to $29,999 | 0 (0.0%) | 0 (0.0%) |
| $30,000 to $34,999 | 0 (0.0%) | 1 (11.1%) |
| $35,000 to $39,999 | 0 (0.0%) | 5 (55.6%) |
| $40,000 to $44,999 | 1 (12.5%) | 0 (0.0%) |
| $45,000 to $49,999 | 0 (0.0%) | 0 (0.0%) |
| $50,000 to $54,999 | 0 (0.0%) | 0 (0.0%) |
| $55,000 to $64,999 | 0 (0.0%) | 0 (0.0%) |
| $65,000 to $74,999 | 3 (37.5%) | 0 (0.0%) |
| $75,000 to $99,999 | 3 (37.5%) | 0 (0.0%) |
| $100,000+ | 0 (0.0%) | 0 (0.0%) |
| Total | 8 (100.0%) | 9 (100.0%) |
Earnings by Sex by Educational Attainment in Hamer
| Educational Attainment | Male Income | Female Income |
| Less than High School | - | - |
| High School Diploma | - | - |
| College or Associate's Degree | - | - |
| Bachelor's Degree | - | - |
| Graduate Degree | - | - |
| Total | $74,583 | $35,625 |
Family Income in Hamer
Family Income Brackets in Hamer
According to the Hamer family income data, there are 5 families falling into the $100,000 to $149,999 income range, which is the most common income bracket and makes up 50.0% of all families.
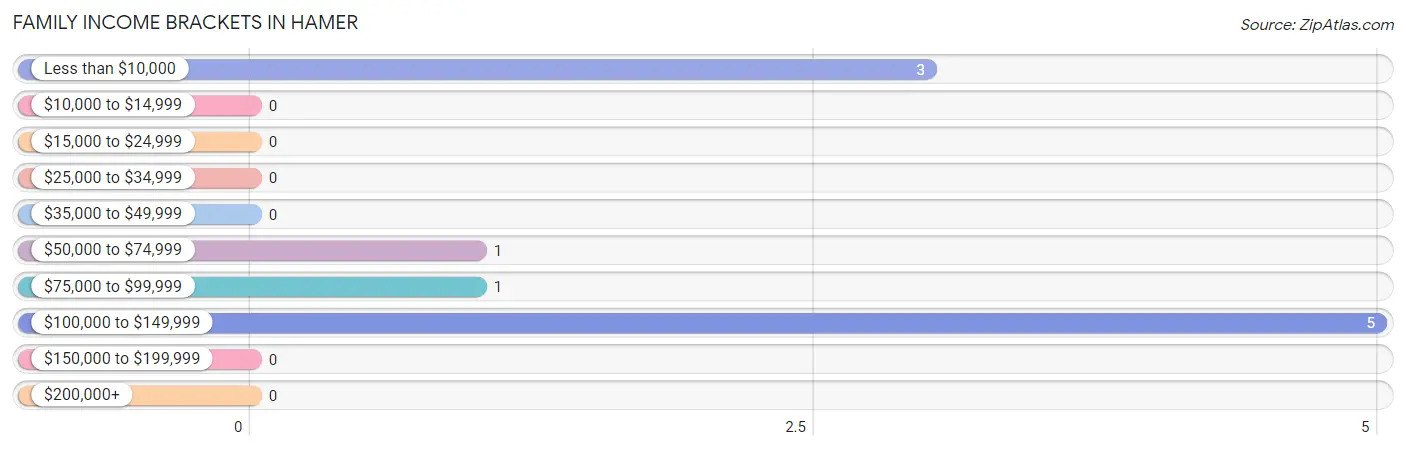
| Income Bracket | # Families | % Families |
| Less than $10,000 | 3 | 30.0% |
| $10,000 to $14,999 | 0 | 0.0% |
| $15,000 to $24,999 | 0 | 0.0% |
| $25,000 to $34,999 | 0 | 0.0% |
| $35,000 to $49,999 | 0 | 0.0% |
| $50,000 to $74,999 | 1 | 10.0% |
| $75,000 to $99,999 | 1 | 10.0% |
| $100,000 to $149,999 | 5 | 50.0% |
| $150,000 to $199,999 | 0 | 0.0% |
| $200,000+ | 0 | 0.0% |
Family Income by Famaliy Size in Hamer
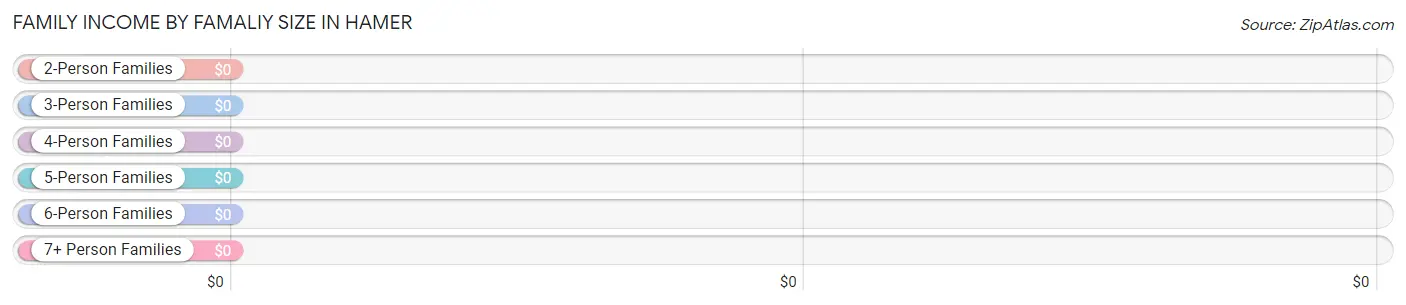
| Income Bracket | # Families | Median Income |
| 2-Person Families | 4 (40.0%) | $0 |
| 3-Person Families | 4 (40.0%) | $0 |
| 4-Person Families | 0 (0.0%) | $0 |
| 5-Person Families | 1 (10.0%) | $0 |
| 6-Person Families | 1 (10.0%) | $0 |
| 7+ Person Families | 0 (0.0%) | $0 |
| Total | 10 (100.0%) | $100,000 |
Family Income by Number of Earners in Hamer
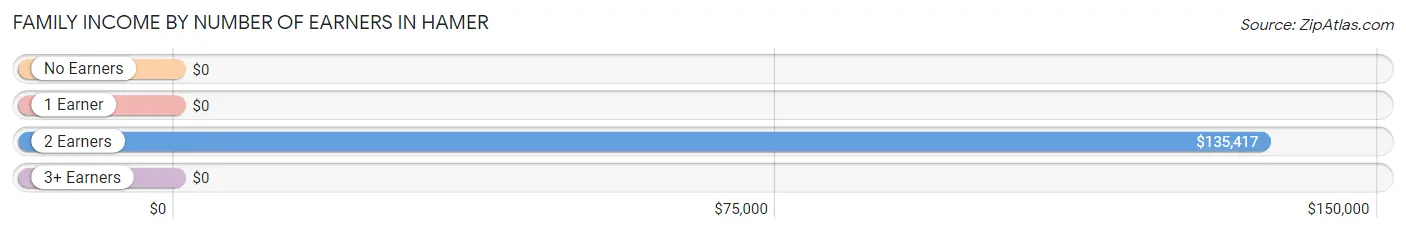
| Number of Earners | # Families | Median Income |
| No Earners | 4 (40.0%) | $0 |
| 1 Earner | 0 (0.0%) | $0 |
| 2 Earners | 5 (50.0%) | $135,417 |
| 3+ Earners | 1 (10.0%) | $0 |
| Total | 10 (100.0%) | $100,000 |
Household Income in Hamer
Household Income Brackets in Hamer
With 8 households falling in the category, the $100,000 to $149,999 income range is the most frequent in Hamer, accounting for 61.5% of all households.
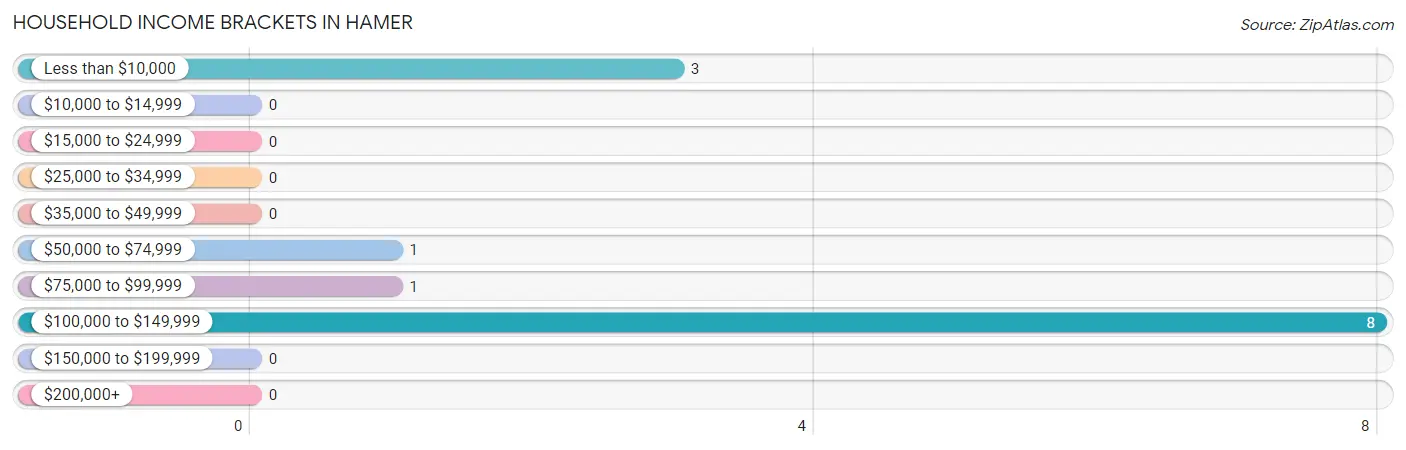
| Income Bracket | # Households | % Households |
| Less than $10,000 | 3 | 23.1% |
| $10,000 to $14,999 | 0 | 0.0% |
| $15,000 to $24,999 | 0 | 0.0% |
| $25,000 to $34,999 | 0 | 0.0% |
| $35,000 to $49,999 | 0 | 0.0% |
| $50,000 to $74,999 | 1 | 7.7% |
| $75,000 to $99,999 | 1 | 7.7% |
| $100,000 to $149,999 | 8 | 61.5% |
| $150,000 to $199,999 | 0 | 0.0% |
| $200,000+ | 0 | 0.0% |
Household Income by Householder Age in Hamer
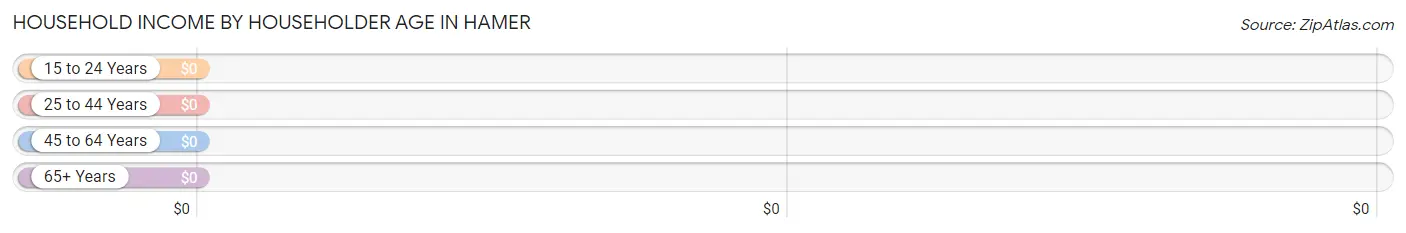
| Income Bracket | # Households | Median Income |
| 15 to 24 Years | 0 (0.0%) | $0 |
| 25 to 44 Years | 1 (7.7%) | $0 |
| 45 to 64 Years | 4 (30.8%) | $0 |
| 65+ Years | 8 (61.5%) | $0 |
| Total | 13 (100.0%) | $103,750 |
Poverty in Hamer
Income Below Poverty by Sex and Age in Hamer
With 13.0% poverty level for males and 20.0% for females among the residents of Hamer, 65 to 74 year old males and 65 to 74 year old females are the most vulnerable to poverty, with 3 males (50.0%) and 2 females (100.0%) in their respective age groups living below the poverty level.
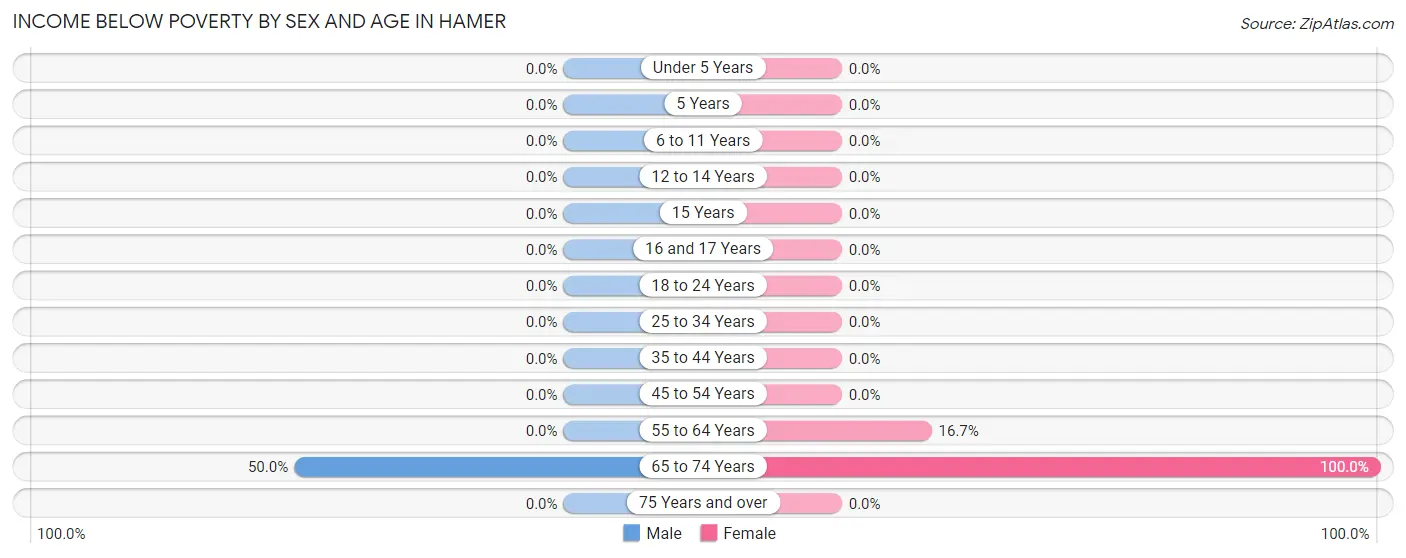
| Age Bracket | Male | Female |
| Under 5 Years | 0 (0.0%) | 0 (0.0%) |
| 5 Years | 0 (0.0%) | 0 (0.0%) |
| 6 to 11 Years | 0 (0.0%) | 0 (0.0%) |
| 12 to 14 Years | 0 (0.0%) | 0 (0.0%) |
| 15 Years | 0 (0.0%) | 0 (0.0%) |
| 16 and 17 Years | 0 (0.0%) | 0 (0.0%) |
| 18 to 24 Years | 0 (0.0%) | 0 (0.0%) |
| 25 to 34 Years | 0 (0.0%) | 0 (0.0%) |
| 35 to 44 Years | 0 (0.0%) | 0 (0.0%) |
| 45 to 54 Years | 0 (0.0%) | 0 (0.0%) |
| 55 to 64 Years | 0 (0.0%) | 1 (16.7%) |
| 65 to 74 Years | 3 (50.0%) | 2 (100.0%) |
| 75 Years and over | 0 (0.0%) | 0 (0.0%) |
| Total | 3 (13.0%) | 3 (20.0%) |
Income Above Poverty by Sex and Age in Hamer
According to the poverty statistics in Hamer, males aged 6 to 11 years and females aged 6 to 11 years are the age groups that are most secure financially, with 100.0% of males and 100.0% of females in these age groups living above the poverty line.
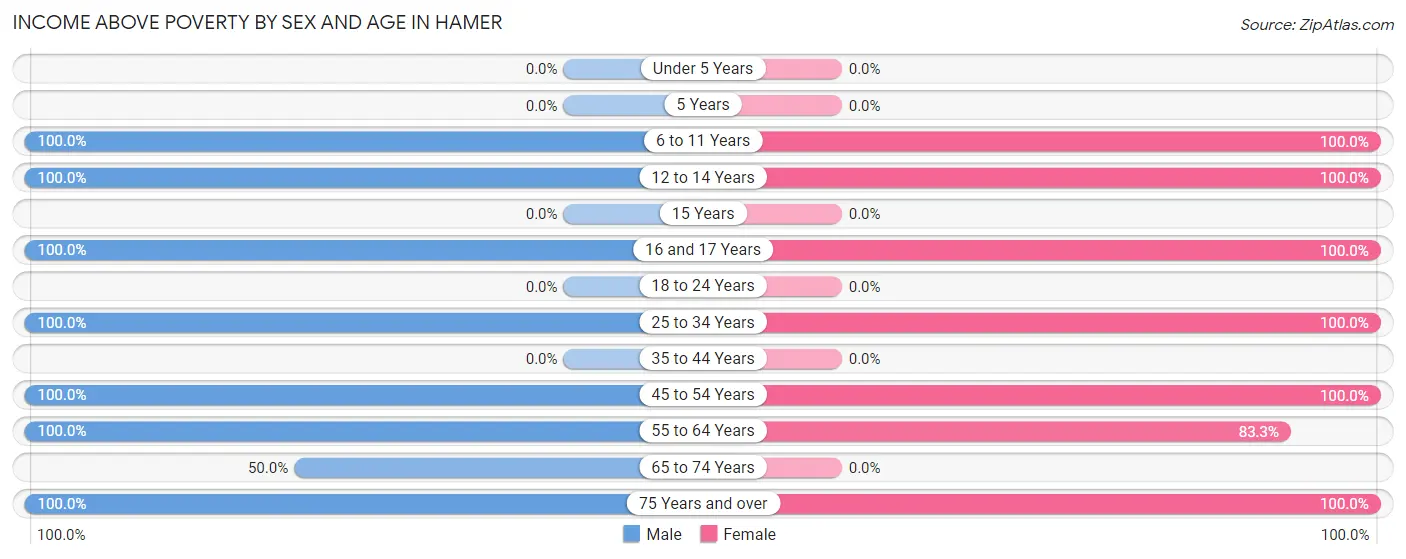
| Age Bracket | Male | Female |
| Under 5 Years | 0 (0.0%) | 0 (0.0%) |
| 5 Years | 0 (0.0%) | 0 (0.0%) |
| 6 to 11 Years | 3 (100.0%) | 1 (100.0%) |
| 12 to 14 Years | 2 (100.0%) | 1 (100.0%) |
| 15 Years | 0 (0.0%) | 0 (0.0%) |
| 16 and 17 Years | 1 (100.0%) | 1 (100.0%) |
| 18 to 24 Years | 0 (0.0%) | 0 (0.0%) |
| 25 to 34 Years | 2 (100.0%) | 1 (100.0%) |
| 35 to 44 Years | 0 (0.0%) | 0 (0.0%) |
| 45 to 54 Years | 3 (100.0%) | 2 (100.0%) |
| 55 to 64 Years | 4 (100.0%) | 5 (83.3%) |
| 65 to 74 Years | 3 (50.0%) | 0 (0.0%) |
| 75 Years and over | 2 (100.0%) | 1 (100.0%) |
| Total | 20 (87.0%) | 12 (80.0%) |
Income Below Poverty Among Married-Couple Families in Hamer
The poverty statistics for married-couple families in Hamer show that 33.3% or 3 of the total 9 families live below the poverty line. Families with no children have the highest poverty rate of 42.9%, comprising of 3 families. On the other hand, families with 1 or 2 children have the lowest poverty rate of 0.0%, which includes 0 families.
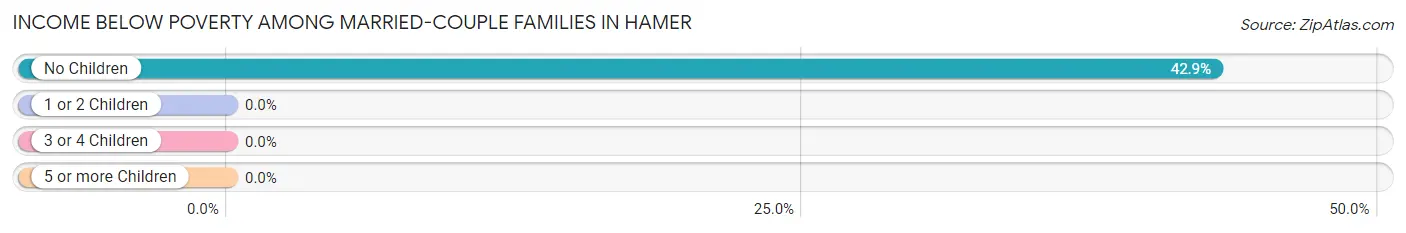
| Children | Above Poverty | Below Poverty |
| No Children | 4 (57.1%) | 3 (42.9%) |
| 1 or 2 Children | 1 (100.0%) | 0 (0.0%) |
| 3 or 4 Children | 1 (100.0%) | 0 (0.0%) |
| 5 or more Children | 0 (0.0%) | 0 (0.0%) |
| Total | 6 (66.7%) | 3 (33.3%) |
Income Below Poverty Among Single-Parent Households in Hamer
| Children | Single Father | Single Mother |
| No Children | 0 (0.0%) | 0 (0.0%) |
| 1 or 2 Children | 0 (0.0%) | 0 (0.0%) |
| 3 or 4 Children | 0 (0.0%) | 0 (0.0%) |
| 5 or more Children | 0 (0.0%) | 0 (0.0%) |
| Total | 0 (0.0%) | 0 (0.0%) |
Income Below Poverty Among Married-Couple vs Single-Parent Households in Hamer
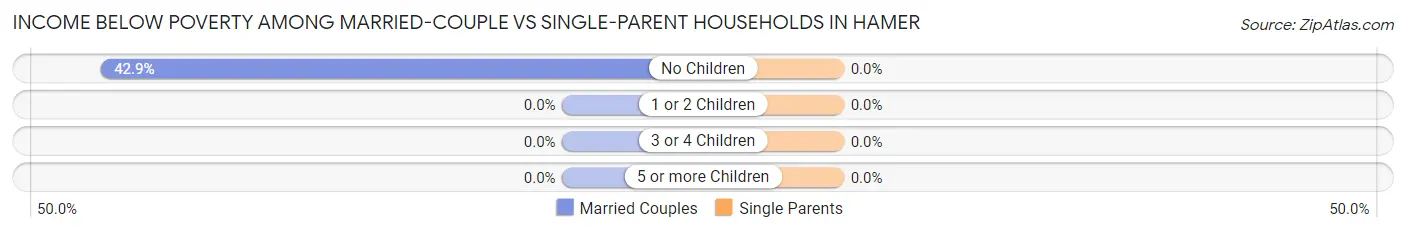
| Children | Married-Couple Families | Single-Parent Households |
| No Children | 3 (42.9%) | 0 (0.0%) |
| 1 or 2 Children | 0 (0.0%) | 0 (0.0%) |
| 3 or 4 Children | 0 (0.0%) | 0 (0.0%) |
| 5 or more Children | 0 (0.0%) | 0 (0.0%) |
| Total | 3 (33.3%) | 0 (0.0%) |
Race in Hamer
The most populous races in Hamer are White / Caucasian (28 | 73.7%), Hispanic or Latino (10 | 26.3%), and Some other Race (9 | 23.7%).
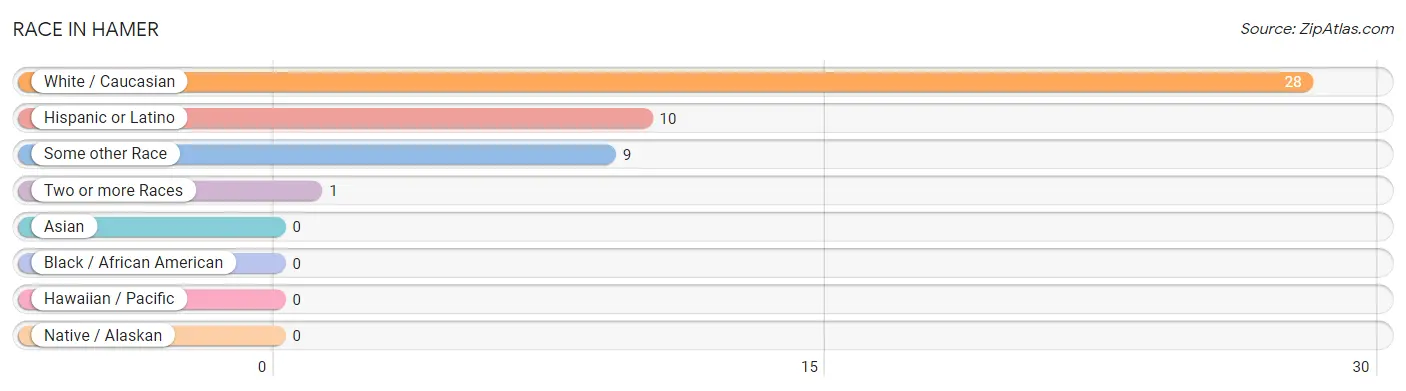
| Race | # Population | % Population |
| Asian | 0 | 0.0% |
| Black / African American | 0 | 0.0% |
| Hawaiian / Pacific | 0 | 0.0% |
| Hispanic or Latino | 10 | 26.3% |
| Native / Alaskan | 0 | 0.0% |
| White / Caucasian | 28 | 73.7% |
| Two or more Races | 1 | 2.6% |
| Some other Race | 9 | 23.7% |
| Total | 38 | 100.0% |
Ancestry in Hamer
The most populous ancestries reported in Hamer are English (11 | 28.9%), Mexican (9 | 23.7%), German (6 | 15.8%), and Cuban (1 | 2.6%), together accounting for 71.1% of all Hamer residents.
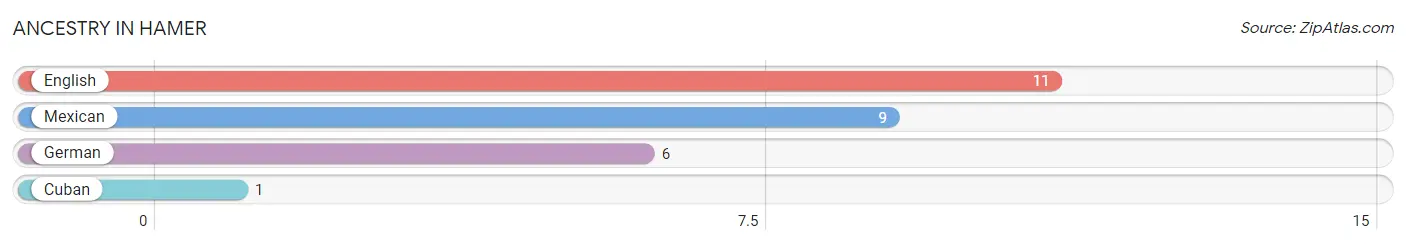
| Ancestry | # Population | % Population |
| Cuban | 1 | 2.6% |
| English | 11 | 28.9% |
| German | 6 | 15.8% |
| Mexican | 9 | 23.7% | View All 4 Rows |
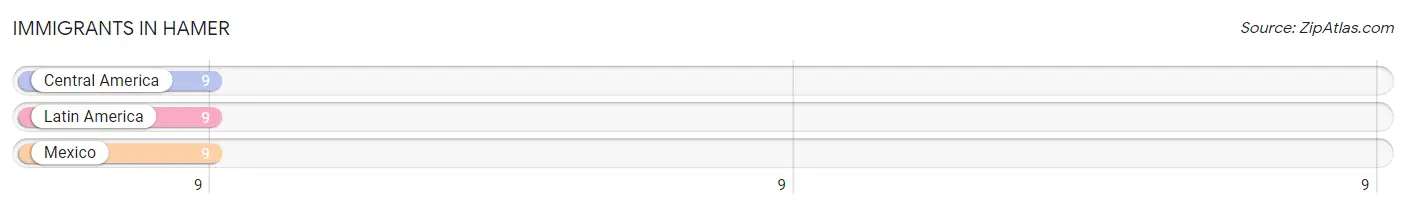
Immigrants in Hamer
The most numerous immigrant groups reported in Hamer came from Central America (9 | 23.7%), Latin America (9 | 23.7%), and Mexico (9 | 23.7%), together accounting for 71.0% of all Hamer residents.
| Immigration Origin | # Population | % Population |
| Central America | 9 | 23.7% |
| Latin America | 9 | 23.7% |
| Mexico | 9 | 23.7% | View All 3 Rows |
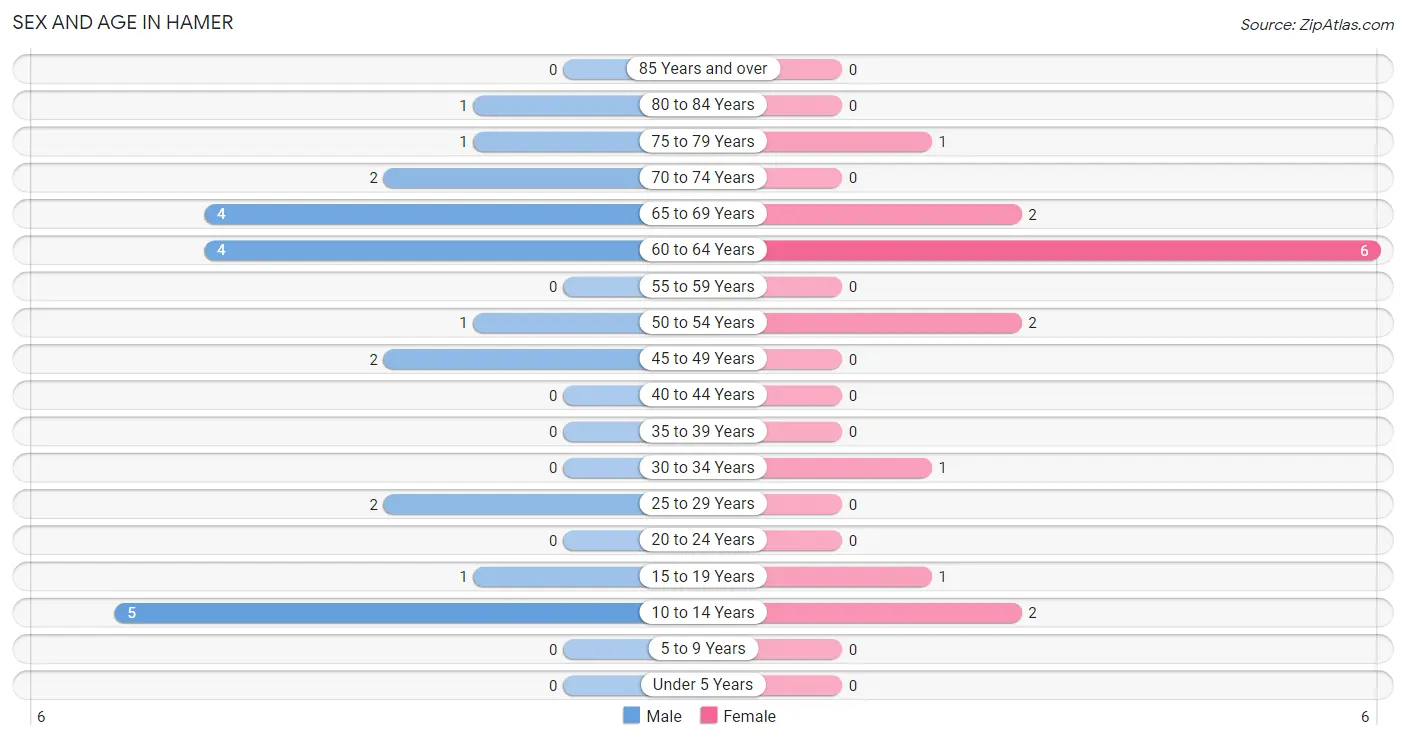
Sex and Age in Hamer
Sex and Age in Hamer
The most populous age groups in Hamer are 10 to 14 Years (5 | 21.7%) for men and 60 to 64 Years (6 | 40.0%) for women.
| Age Bracket | Male | Female |
| Under 5 Years | 0 (0.0%) | 0 (0.0%) |
| 5 to 9 Years | 0 (0.0%) | 0 (0.0%) |
| 10 to 14 Years | 5 (21.7%) | 2 (13.3%) |
| 15 to 19 Years | 1 (4.3%) | 1 (6.7%) |
| 20 to 24 Years | 0 (0.0%) | 0 (0.0%) |
| 25 to 29 Years | 2 (8.7%) | 0 (0.0%) |
| 30 to 34 Years | 0 (0.0%) | 1 (6.7%) |
| 35 to 39 Years | 0 (0.0%) | 0 (0.0%) |
| 40 to 44 Years | 0 (0.0%) | 0 (0.0%) |
| 45 to 49 Years | 2 (8.7%) | 0 (0.0%) |
| 50 to 54 Years | 1 (4.3%) | 2 (13.3%) |
| 55 to 59 Years | 0 (0.0%) | 0 (0.0%) |
| 60 to 64 Years | 4 (17.4%) | 6 (40.0%) |
| 65 to 69 Years | 4 (17.4%) | 2 (13.3%) |
| 70 to 74 Years | 2 (8.7%) | 0 (0.0%) |
| 75 to 79 Years | 1 (4.3%) | 1 (6.7%) |
| 80 to 84 Years | 1 (4.3%) | 0 (0.0%) |
| 85 Years and over | 0 (0.0%) | 0 (0.0%) |
| Total | 23 (100.0%) | 15 (100.0%) |
Families and Households in Hamer
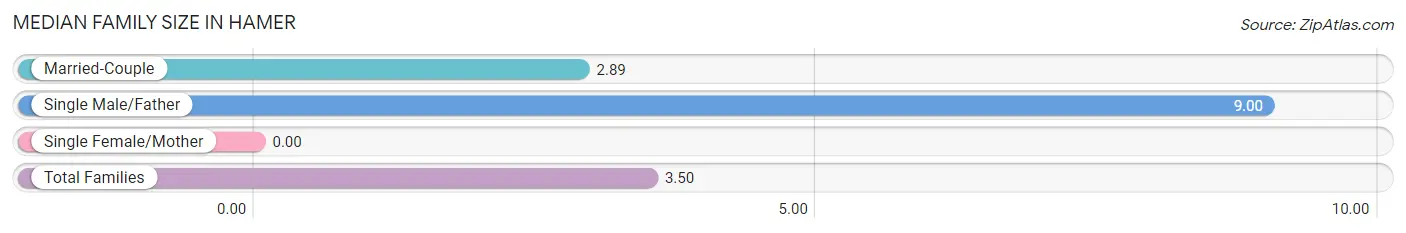
Median Family Size in Hamer
| Family Type | # Families | Family Size |
| Married-Couple | 9 (90.0%) | 2.89 |
| Single Male/Father | 1 (10.0%) | 9.00 |
| Single Female/Mother | 0 (0.0%) | - |
| Total Families | 10 (100.0%) | 3.50 |
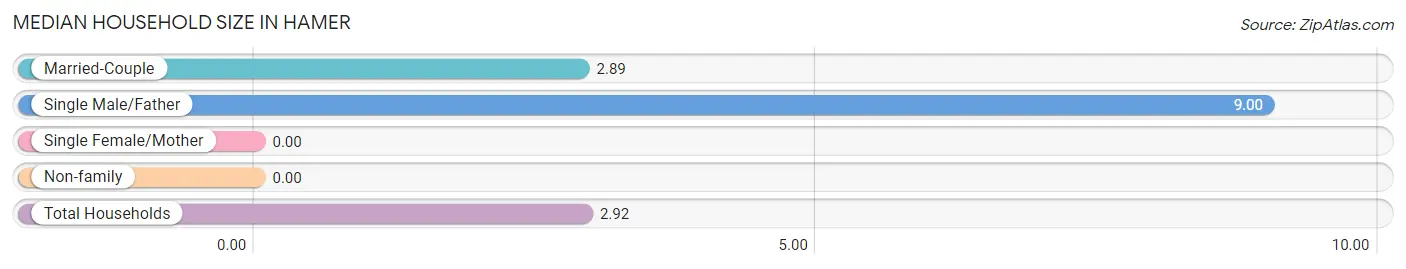
Median Household Size in Hamer
| Household Type | # Households | Household Size |
| Married-Couple | 9 (69.2%) | 2.89 |
| Single Male/Father | 1 (7.7%) | 9.00 |
| Single Female/Mother | 0 (0.0%) | - |
| Non-family | 3 (23.1%) | - |
| Total Households | 13 (100.0%) | 2.92 |
Household Size by Marriage Status in Hamer
Out of a total of 13 households in Hamer, 10 (76.9%) are family households, while 3 (23.1%) are nonfamily households. The most numerous type of family households are 2-person households, comprising 4, and the most common type of nonfamily households are 1-person households, comprising 3.
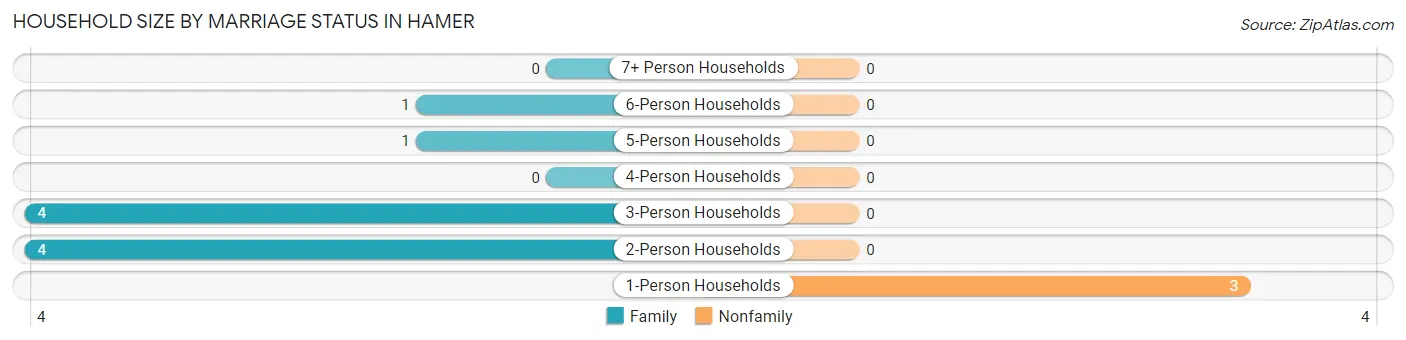
| Household Size | Family Households | Nonfamily Households |
| 1-Person Households | - | 3 (23.1%) |
| 2-Person Households | 4 (30.8%) | 0 (0.0%) |
| 3-Person Households | 4 (30.8%) | 0 (0.0%) |
| 4-Person Households | 0 (0.0%) | 0 (0.0%) |
| 5-Person Households | 1 (7.7%) | 0 (0.0%) |
| 6-Person Households | 1 (7.7%) | 0 (0.0%) |
| 7+ Person Households | 0 (0.0%) | 0 (0.0%) |
| Total | 10 (76.9%) | 3 (23.1%) |
Female Fertility in Hamer
Fertility by Age in Hamer
| Age Bracket | Women with Births | Births / 1,000 Women |
| 15 to 19 years | 0 (0.0%) | 0.0 |
| 20 to 34 years | 0 (0.0%) | 0.0 |
| 35 to 50 years | 0 (0.0%) | 0.0 |
| Total | 0 (0.0%) | 0.0 |
Fertility by Age by Marriage Status in Hamer
| Age Bracket | Married | Unmarried |
| 15 to 19 years | 0 (0.0%) | 0 (0.0%) |
| 20 to 34 years | 0 (0.0%) | 0 (0.0%) |
| 35 to 50 years | 0 (0.0%) | 0 (0.0%) |
| Total | 0 (0.0%) | 0 (0.0%) |
Fertility by Education in Hamer
| Educational Attainment | Women with Births | Births / 1,000 Women |
| Less than High School | 0 (0.0%) | 0.0 |
| High School Diploma | 0 (0.0%) | 0.0 |
| College or Associate's Degree | 0 (0.0%) | 0.0 |
| Bachelor's Degree | 0 (0.0%) | 0.0 |
| Graduate Degree | 0 (0.0%) | 0.0 |
| Total | 0 (0.0%) | 0.0 |
Fertility by Education by Marriage Status in Hamer
| Educational Attainment | Married | Unmarried |
| Less than High School | 0 (0.0%) | 0 (0.0%) |
| High School Diploma | 0 (0.0%) | 0 (0.0%) |
| College or Associate's Degree | 0 (0.0%) | 0 (0.0%) |
| Bachelor's Degree | 0 (0.0%) | 0 (0.0%) |
| Graduate Degree | 0 (0.0%) | 0 (0.0%) |
| Total | 0 (0.0%) | 0 (0.0%) |
Employment Characteristics in Hamer
Employment by Class of Employer in Hamer
Among the 17 employed individuals in Hamer, self-employed (not incorporated) (7 | 41.2%), private company employees (6 | 35.3%), and local government employees (3 | 17.6%) make up the most common classes of employment.
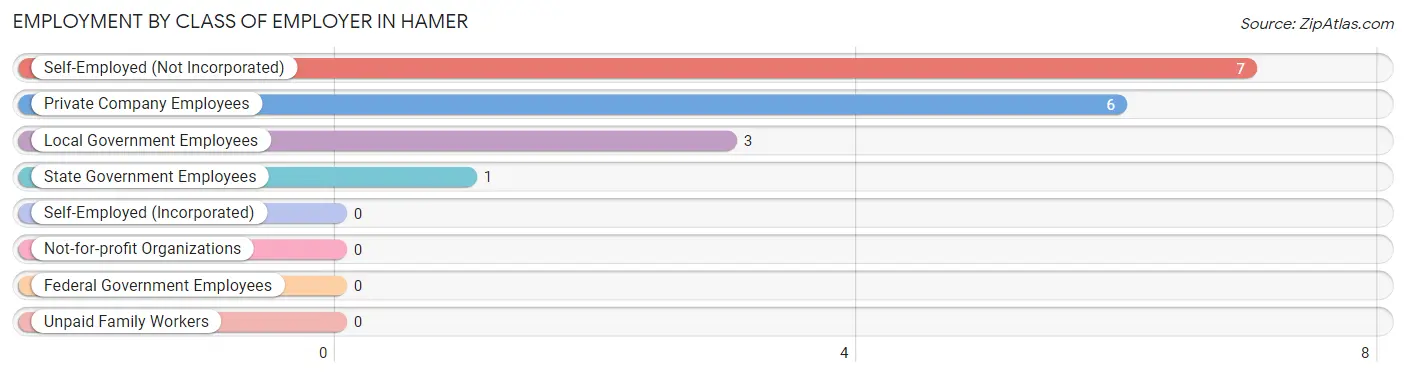
| Employer Class | # Employees | % Employees |
| Private Company Employees | 6 | 35.3% |
| Self-Employed (Incorporated) | 0 | 0.0% |
| Self-Employed (Not Incorporated) | 7 | 41.2% |
| Not-for-profit Organizations | 0 | 0.0% |
| Local Government Employees | 3 | 17.6% |
| State Government Employees | 1 | 5.9% |
| Federal Government Employees | 0 | 0.0% |
| Unpaid Family Workers | 0 | 0.0% |
| Total | 17 | 100.0% |
Employment Status by Age in Hamer
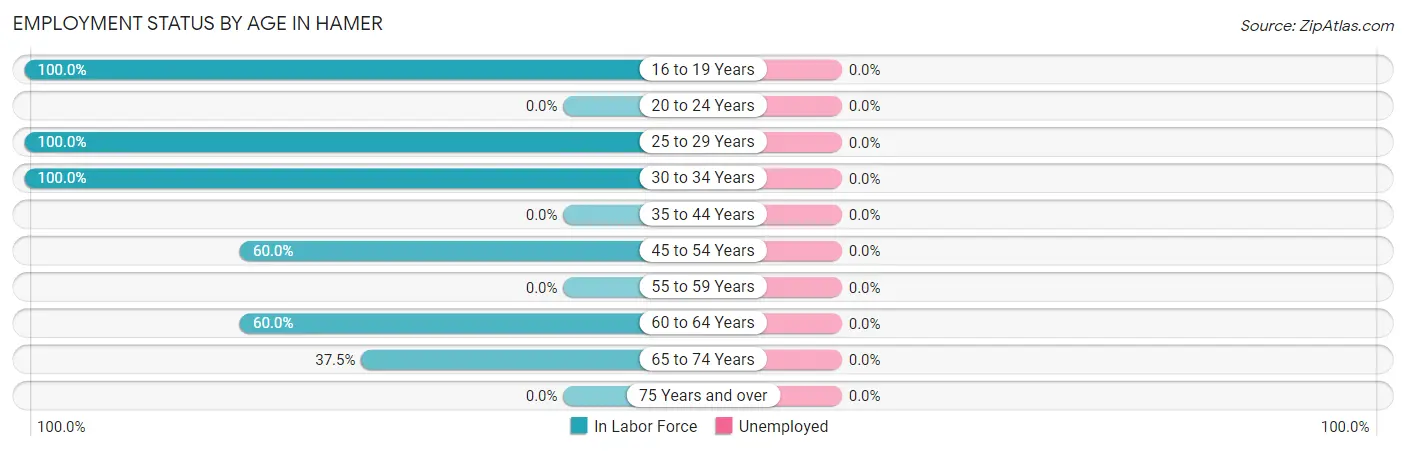
| Age Bracket | In Labor Force | Unemployed |
| 16 to 19 Years | 2 (100.0%) | 0 (0.0%) |
| 20 to 24 Years | 0 (0.0%) | 0 (0.0%) |
| 25 to 29 Years | 2 (100.0%) | 0 (0.0%) |
| 30 to 34 Years | 1 (100.0%) | 0 (0.0%) |
| 35 to 44 Years | 0 (0.0%) | 0 (0.0%) |
| 45 to 54 Years | 3 (60.0%) | 0 (0.0%) |
| 55 to 59 Years | 0 (0.0%) | 0 (0.0%) |
| 60 to 64 Years | 6 (60.0%) | 0 (0.0%) |
| 65 to 74 Years | 3 (37.5%) | 0 (0.0%) |
| 75 Years and over | 0 (0.0%) | 0 (0.0%) |
| Total | 17 (54.8%) | 0 (0.0%) |
Employment Status by Educational Attainment in Hamer
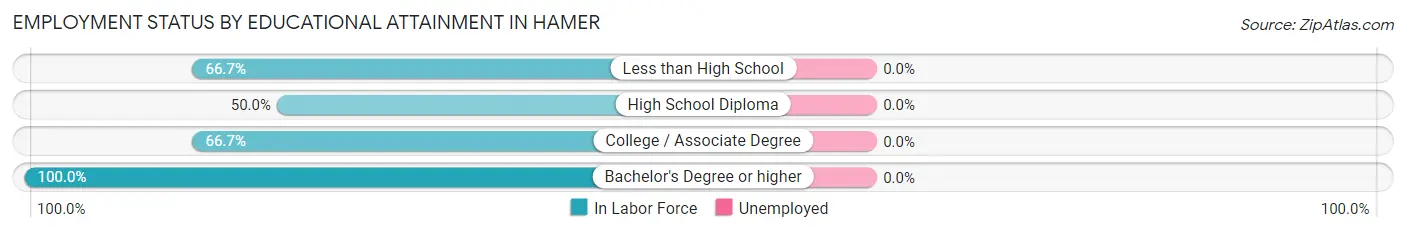
| Educational Attainment | In Labor Force | Unemployed |
| Less than High School | 6 (66.7%) | 0 (0.0%) |
| High School Diploma | 1 (50.0%) | 0 (0.0%) |
| College / Associate Degree | 4 (66.7%) | 0 (0.0%) |
| Bachelor's Degree or higher | 1 (100.0%) | 0 (0.0%) |
| Total | 12 (66.7%) | 0 (0.0%) |
Employment Occupations by Sex in Hamer
Management, Business, Science and Arts Occupations
The most common Management, Business, Science and Arts occupations in Hamer are Management (3 | 17.6%), Community & Social Service (3 | 17.6%), and Education Instruction & Library (3 | 17.6%).
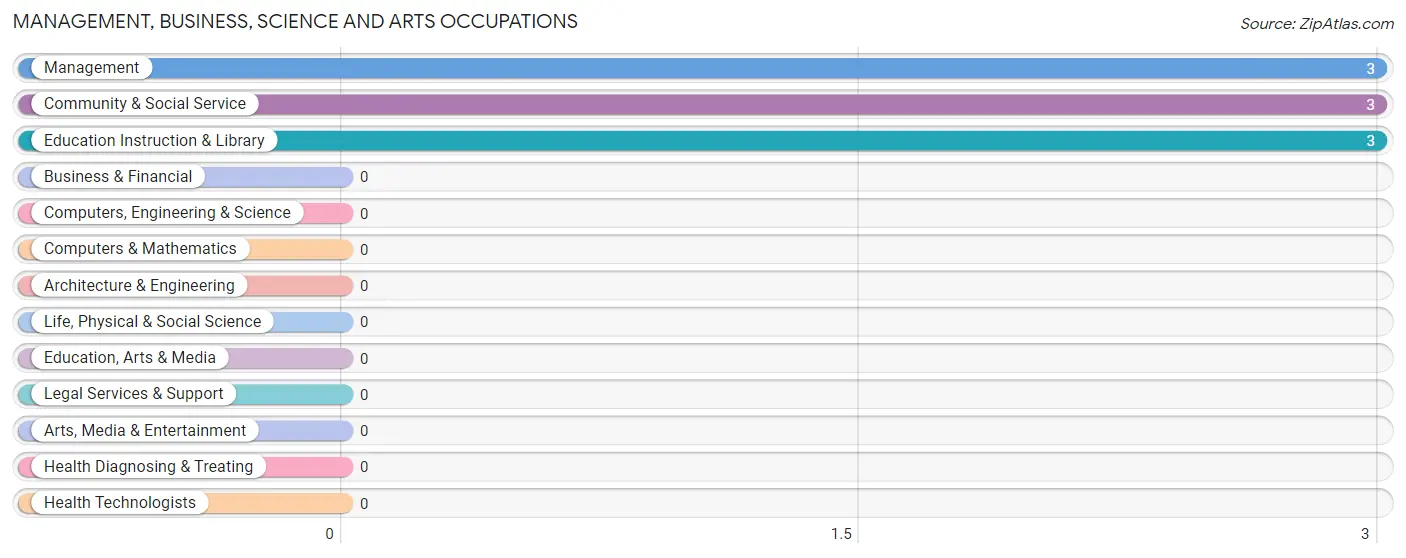
Management, Business, Science and Arts Occupations by Sex
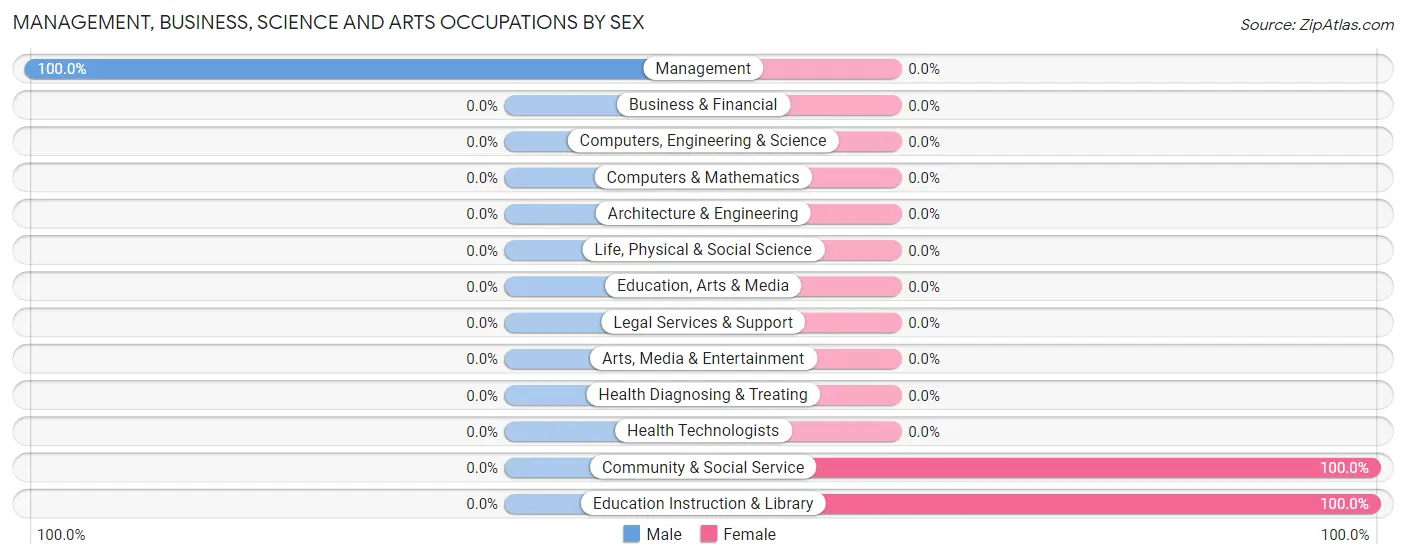
| Occupation | Male | Female |
| Management | 3 (100.0%) | 0 (0.0%) |
| Business & Financial | 0 (0.0%) | 0 (0.0%) |
| Computers, Engineering & Science | 0 (0.0%) | 0 (0.0%) |
| Computers & Mathematics | 0 (0.0%) | 0 (0.0%) |
| Architecture & Engineering | 0 (0.0%) | 0 (0.0%) |
| Life, Physical & Social Science | 0 (0.0%) | 0 (0.0%) |
| Community & Social Service | 0 (0.0%) | 3 (100.0%) |
| Education, Arts & Media | 0 (0.0%) | 0 (0.0%) |
| Legal Services & Support | 0 (0.0%) | 0 (0.0%) |
| Education Instruction & Library | 0 (0.0%) | 3 (100.0%) |
| Arts, Media & Entertainment | 0 (0.0%) | 0 (0.0%) |
| Health Diagnosing & Treating | 0 (0.0%) | 0 (0.0%) |
| Health Technologists | 0 (0.0%) | 0 (0.0%) |
| Total (Category) | 3 (50.0%) | 3 (50.0%) |
| Total (Overall) | 8 (47.1%) | 9 (52.9%) |
Services Occupations
The most common Services occupations in Hamer are Cleaning & Maintenance (4 | 23.5%), and Food Preparation & Serving (1 | 5.9%).
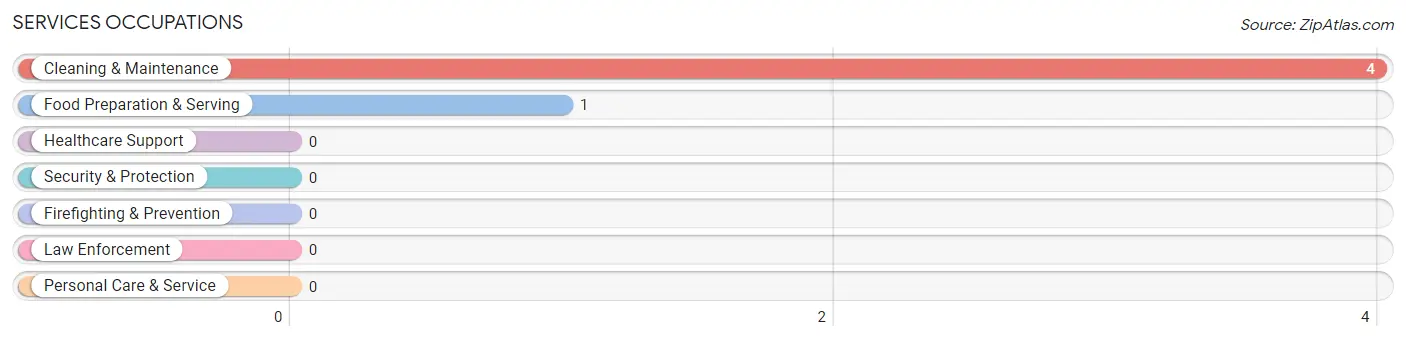
Services Occupations by Sex
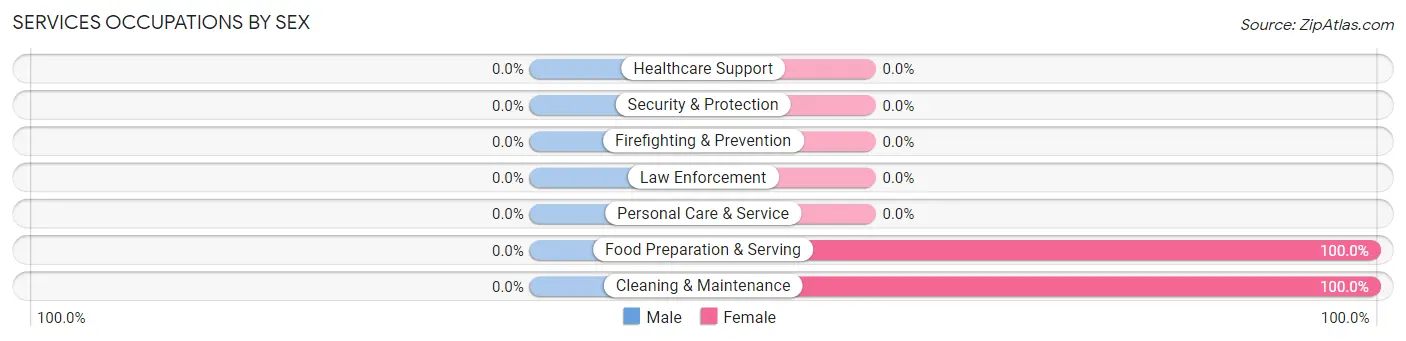
| Occupation | Male | Female |
| Healthcare Support | 0 (0.0%) | 0 (0.0%) |
| Security & Protection | 0 (0.0%) | 0 (0.0%) |
| Firefighting & Prevention | 0 (0.0%) | 0 (0.0%) |
| Law Enforcement | 0 (0.0%) | 0 (0.0%) |
| Food Preparation & Serving | 0 (0.0%) | 1 (100.0%) |
| Cleaning & Maintenance | 0 (0.0%) | 4 (100.0%) |
| Personal Care & Service | 0 (0.0%) | 0 (0.0%) |
| Total (Category) | 0 (0.0%) | 5 (100.0%) |
| Total (Overall) | 8 (47.1%) | 9 (52.9%) |
Sales and Office Occupations
The most common Sales and Office occupations in Hamer are Sales & Related (1 | 5.9%), and Office & Administration (1 | 5.9%).
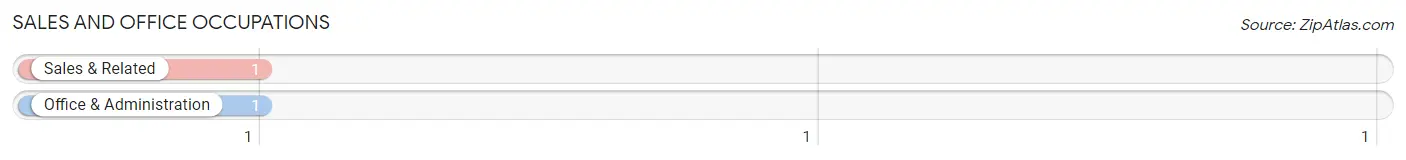
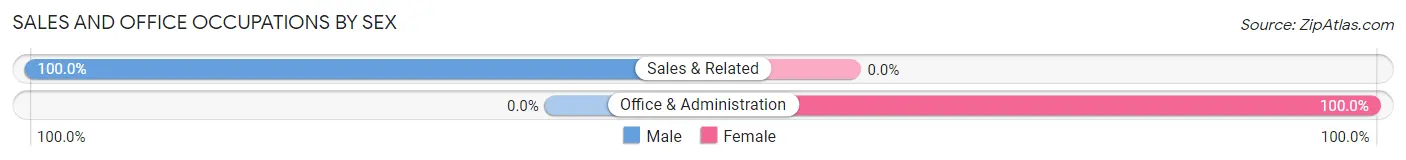
Sales and Office Occupations by Sex
| Occupation | Male | Female |
| Sales & Related | 1 (100.0%) | 0 (0.0%) |
| Office & Administration | 0 (0.0%) | 1 (100.0%) |
| Total (Category) | 1 (50.0%) | 1 (50.0%) |
| Total (Overall) | 8 (47.1%) | 9 (52.9%) |
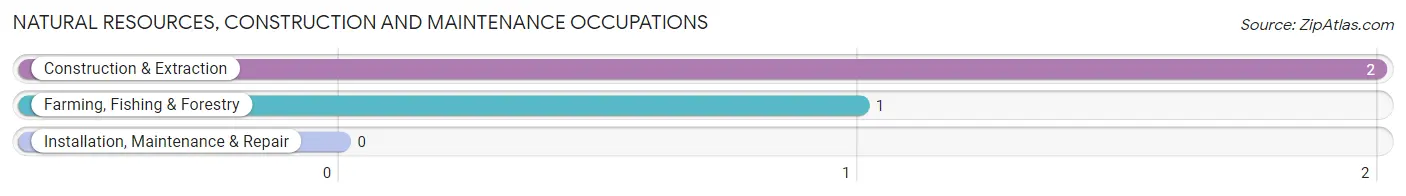
Natural Resources, Construction and Maintenance Occupations
The most common Natural Resources, Construction and Maintenance occupations in Hamer are Construction & Extraction (2 | 11.8%), and Farming, Fishing & Forestry (1 | 5.9%).
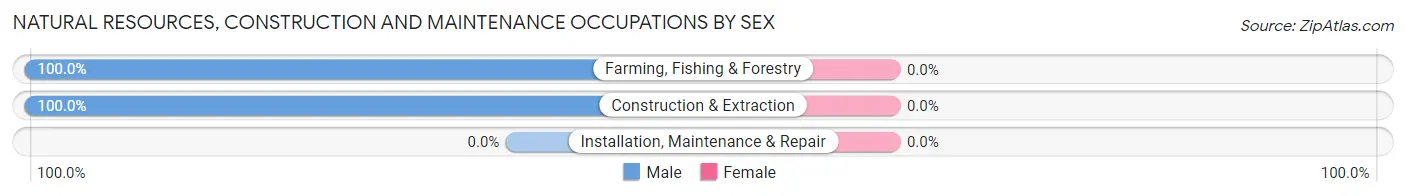
Natural Resources, Construction and Maintenance Occupations by Sex
| Occupation | Male | Female |
| Farming, Fishing & Forestry | 1 (100.0%) | 0 (0.0%) |
| Construction & Extraction | 2 (100.0%) | 0 (0.0%) |
| Installation, Maintenance & Repair | 0 (0.0%) | 0 (0.0%) |
| Total (Category) | 3 (100.0%) | 0 (0.0%) |
| Total (Overall) | 8 (47.1%) | 9 (52.9%) |
Production, Transportation and Moving Occupations
The most common Production, Transportation and Moving occupations in Hamer are , and Transportation (1 | 5.9%).
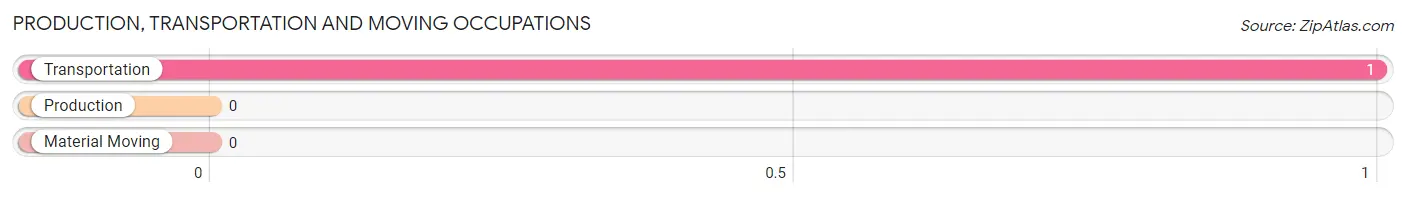
Production, Transportation and Moving Occupations by Sex
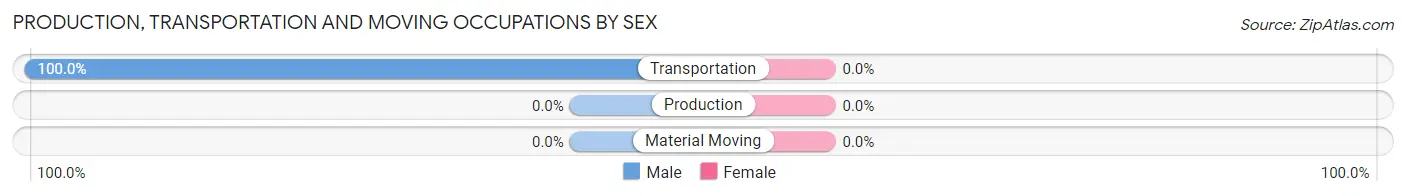
| Occupation | Male | Female |
| Production | 0 (0.0%) | 0 (0.0%) |
| Transportation | 1 (100.0%) | 0 (0.0%) |
| Material Moving | 0 (0.0%) | 0 (0.0%) |
| Total (Category) | 1 (100.0%) | 0 (0.0%) |
| Total (Overall) | 8 (47.1%) | 9 (52.9%) |
Employment Industries by Sex in Hamer
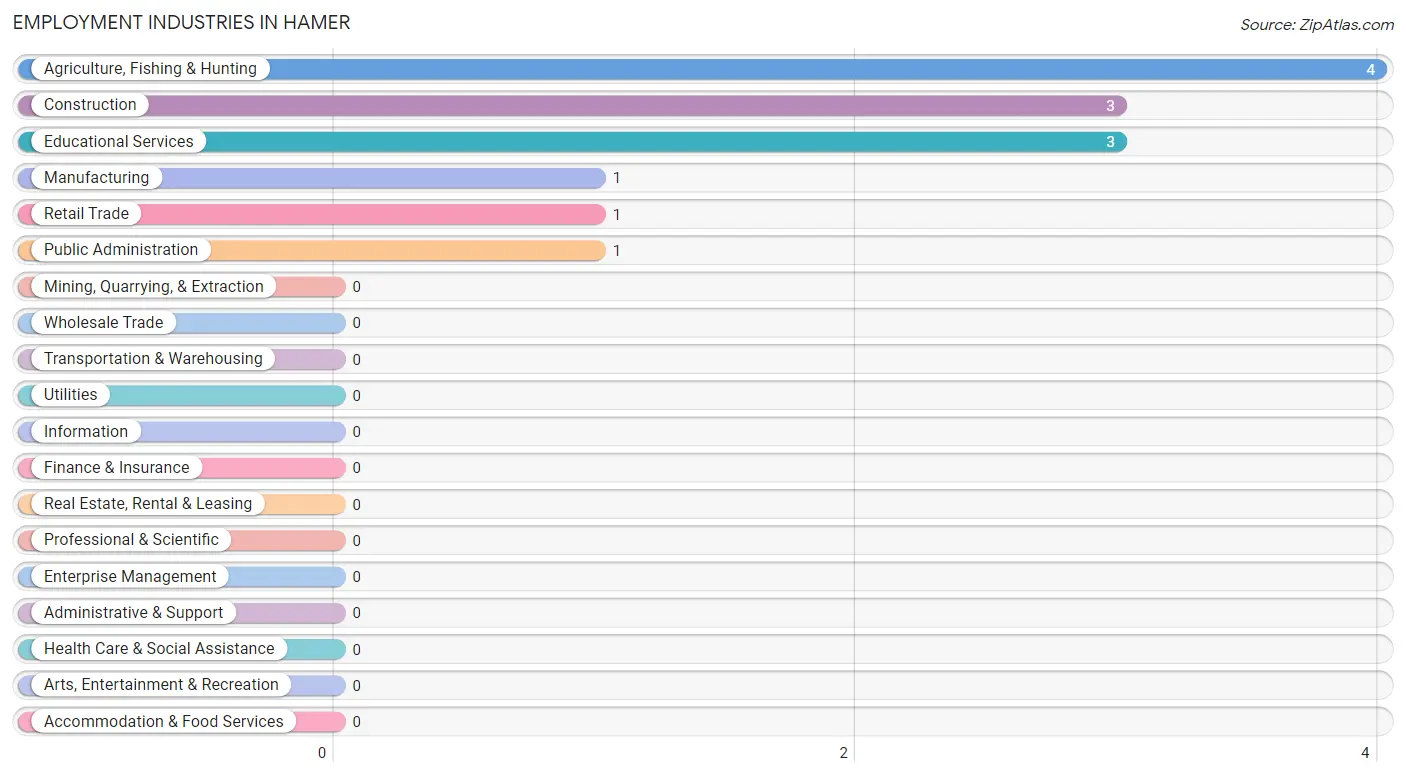
Employment Industries in Hamer
The major employment industries in Hamer include Agriculture, Fishing & Hunting (4 | 23.5%), Construction (3 | 17.6%), Educational Services (3 | 17.6%), Manufacturing (1 | 5.9%), and Retail Trade (1 | 5.9%).
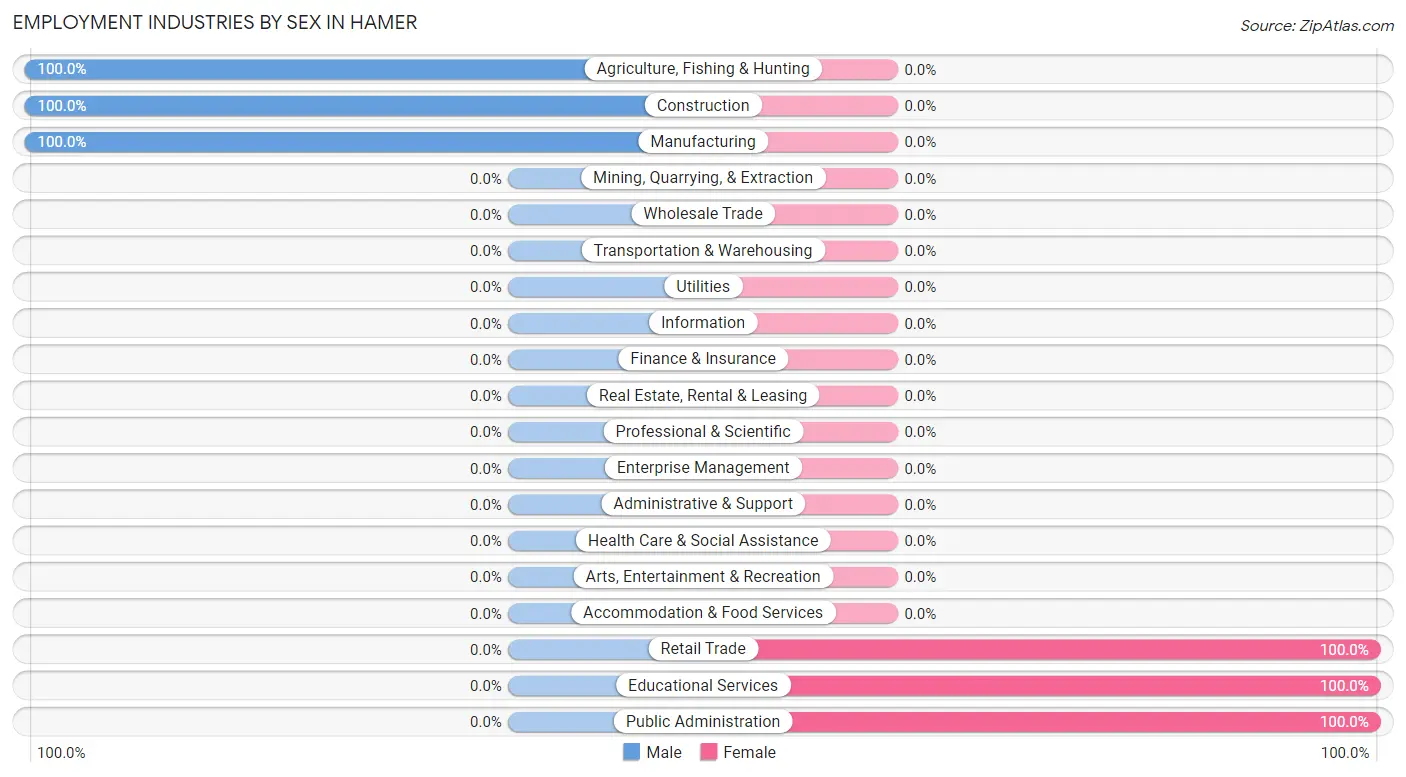
Employment Industries by Sex in Hamer
The Hamer industries that see more men than women are Agriculture, Fishing & Hunting (100.0%), Construction (100.0%), and Manufacturing (100.0%), whereas the industries that tend to have a higher number of women are Retail Trade (100.0%), Educational Services (100.0%), and Public Administration (100.0%).
| Industry | Male | Female |
| Agriculture, Fishing & Hunting | 4 (100.0%) | 0 (0.0%) |
| Mining, Quarrying, & Extraction | 0 (0.0%) | 0 (0.0%) |
| Construction | 3 (100.0%) | 0 (0.0%) |
| Manufacturing | 1 (100.0%) | 0 (0.0%) |
| Wholesale Trade | 0 (0.0%) | 0 (0.0%) |
| Retail Trade | 0 (0.0%) | 1 (100.0%) |
| Transportation & Warehousing | 0 (0.0%) | 0 (0.0%) |
| Utilities | 0 (0.0%) | 0 (0.0%) |
| Information | 0 (0.0%) | 0 (0.0%) |
| Finance & Insurance | 0 (0.0%) | 0 (0.0%) |
| Real Estate, Rental & Leasing | 0 (0.0%) | 0 (0.0%) |
| Professional & Scientific | 0 (0.0%) | 0 (0.0%) |
| Enterprise Management | 0 (0.0%) | 0 (0.0%) |
| Administrative & Support | 0 (0.0%) | 0 (0.0%) |
| Educational Services | 0 (0.0%) | 3 (100.0%) |
| Health Care & Social Assistance | 0 (0.0%) | 0 (0.0%) |
| Arts, Entertainment & Recreation | 0 (0.0%) | 0 (0.0%) |
| Accommodation & Food Services | 0 (0.0%) | 0 (0.0%) |
| Public Administration | 0 (0.0%) | 1 (100.0%) |
| Total | 8 (47.1%) | 9 (52.9%) |
Education in Hamer
School Enrollment in Hamer
The most common levels of schooling among the 9 students in Hamer are middle school (7 | 77.8%), and high school (2 | 22.2%).
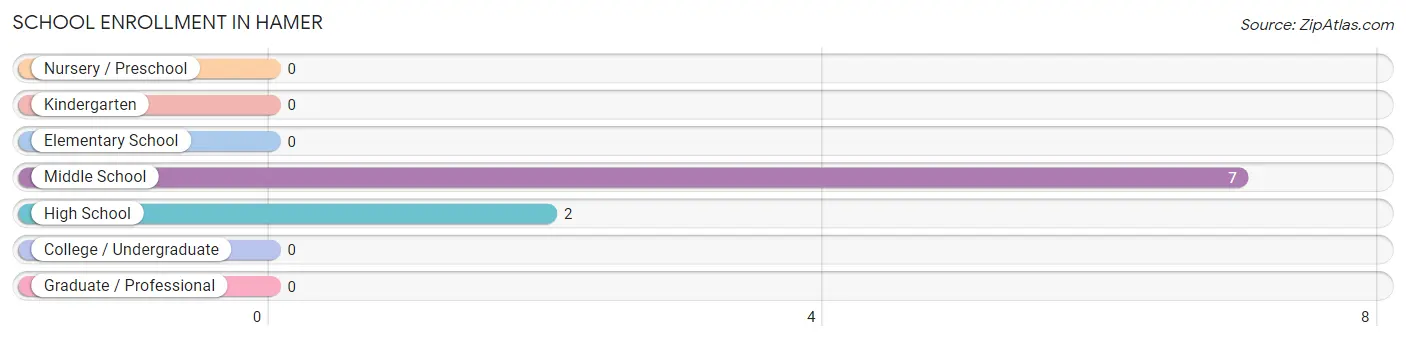
| School Level | # Students | % Students |
| Nursery / Preschool | 0 | 0.0% |
| Kindergarten | 0 | 0.0% |
| Elementary School | 0 | 0.0% |
| Middle School | 7 | 77.8% |
| High School | 2 | 22.2% |
| College / Undergraduate | 0 | 0.0% |
| Graduate / Professional | 0 | 0.0% |
| Total | 9 | 100.0% |
School Enrollment by Age by Funding Source in Hamer
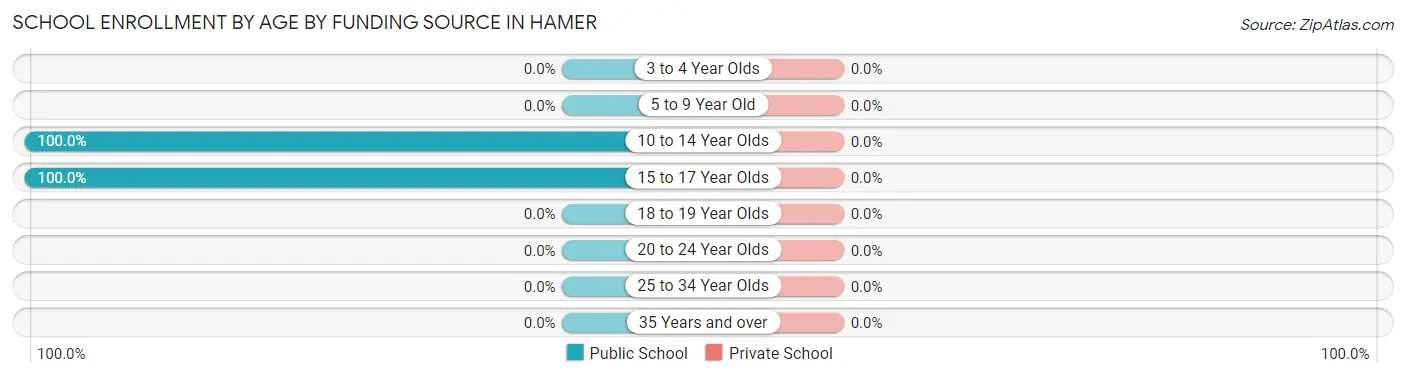
| Age Bracket | Public School | Private School |
| 3 to 4 Year Olds | 0 (0.0%) | 0 (0.0%) |
| 5 to 9 Year Old | 0 (0.0%) | 0 (0.0%) |
| 10 to 14 Year Olds | 7 (100.0%) | 0 (0.0%) |
| 15 to 17 Year Olds | 2 (100.0%) | 0 (0.0%) |
| 18 to 19 Year Olds | 0 (0.0%) | 0 (0.0%) |
| 20 to 24 Year Olds | 0 (0.0%) | 0 (0.0%) |
| 25 to 34 Year Olds | 0 (0.0%) | 0 (0.0%) |
| 35 Years and over | 0 (0.0%) | 0 (0.0%) |
| Total | 9 (100.0%) | 0 (0.0%) |
Educational Attainment by Field of Study in Hamer
Education (4 | 66.7%), psychology (1 | 16.7%), and business (1 | 16.7%) are the most common fields of study among 6 individuals in Hamer who have obtained a bachelor's degree or higher.
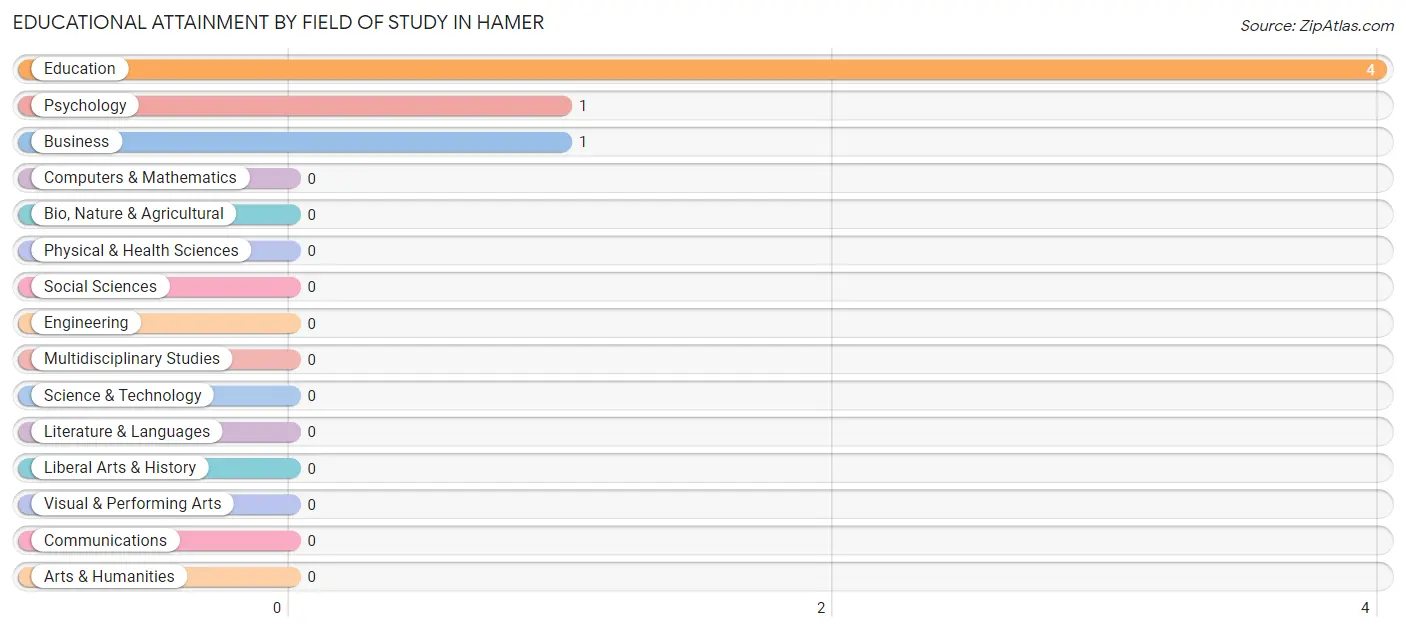
| Field of Study | # Graduates | % Graduates |
| Computers & Mathematics | 0 | 0.0% |
| Bio, Nature & Agricultural | 0 | 0.0% |
| Physical & Health Sciences | 0 | 0.0% |
| Psychology | 1 | 16.7% |
| Social Sciences | 0 | 0.0% |
| Engineering | 0 | 0.0% |
| Multidisciplinary Studies | 0 | 0.0% |
| Science & Technology | 0 | 0.0% |
| Business | 1 | 16.7% |
| Education | 4 | 66.7% |
| Literature & Languages | 0 | 0.0% |
| Liberal Arts & History | 0 | 0.0% |
| Visual & Performing Arts | 0 | 0.0% |
| Communications | 0 | 0.0% |
| Arts & Humanities | 0 | 0.0% |
| Total | 6 | 100.0% |
Transportation & Commute in Hamer
Vehicle Availability by Sex in Hamer
The most prevalent vehicle ownership categories in Hamer are males with 2 vehicles (3, accounting for 37.5%) and females with 2 vehicles (0, making up 33.3%).
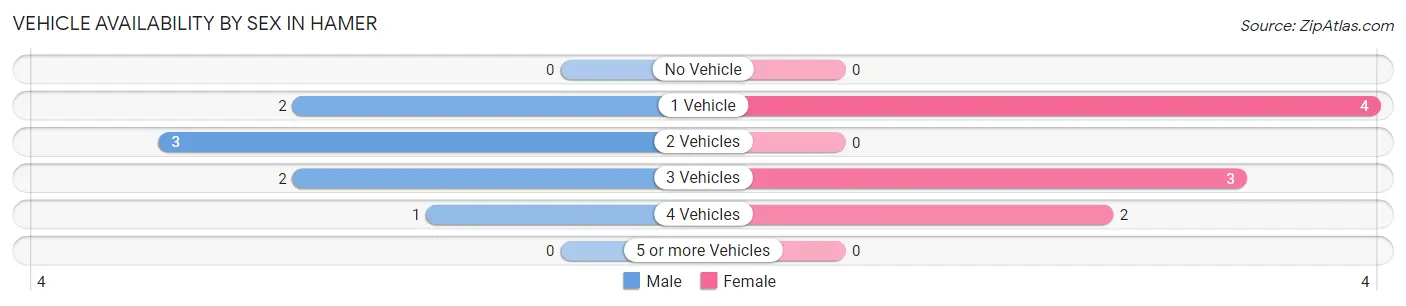
| Vehicles Available | Male | Female |
| No Vehicle | 0 (0.0%) | 0 (0.0%) |
| 1 Vehicle | 2 (25.0%) | 4 (44.4%) |
| 2 Vehicles | 3 (37.5%) | 0 (0.0%) |
| 3 Vehicles | 2 (25.0%) | 3 (33.3%) |
| 4 Vehicles | 1 (12.5%) | 2 (22.2%) |
| 5 or more Vehicles | 0 (0.0%) | 0 (0.0%) |
| Total | 8 (100.0%) | 9 (100.0%) |
Commute Time in Hamer
The most frequently occuring commute durations in Hamer are 20 to 24 minutes (8 commuters, 50.0%), 5 to 9 minutes (3 commuters, 18.8%), and 25 to 29 minutes (3 commuters, 18.8%).
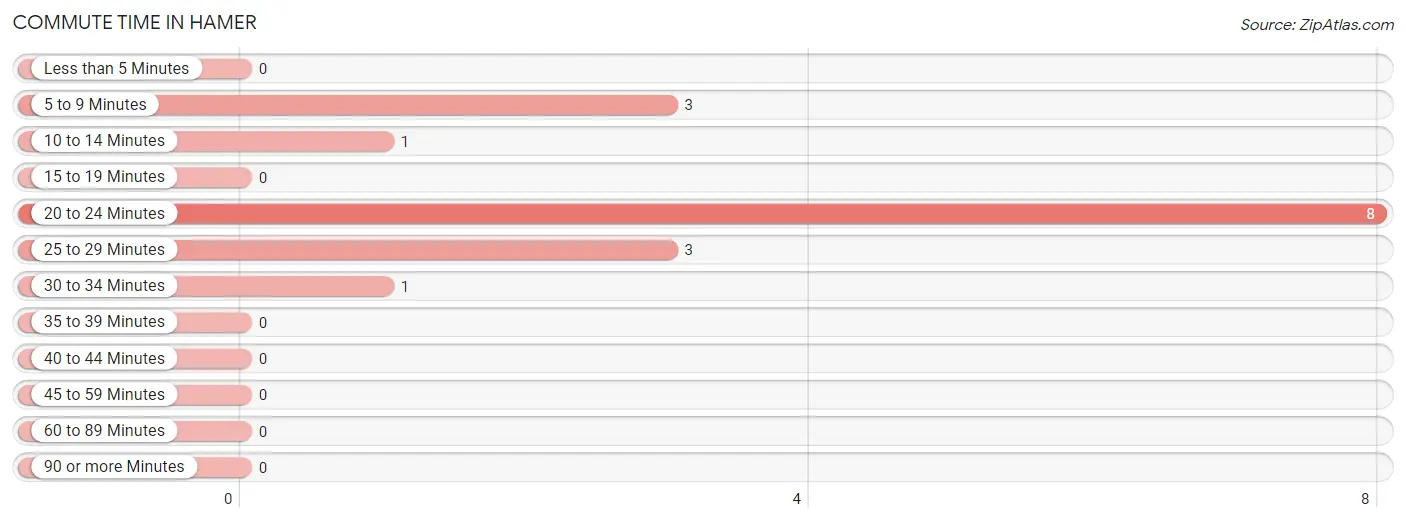
| Commute Time | # Commuters | % Commuters |
| Less than 5 Minutes | 0 | 0.0% |
| 5 to 9 Minutes | 3 | 18.8% |
| 10 to 14 Minutes | 1 | 6.2% |
| 15 to 19 Minutes | 0 | 0.0% |
| 20 to 24 Minutes | 8 | 50.0% |
| 25 to 29 Minutes | 3 | 18.8% |
| 30 to 34 Minutes | 1 | 6.2% |
| 35 to 39 Minutes | 0 | 0.0% |
| 40 to 44 Minutes | 0 | 0.0% |
| 45 to 59 Minutes | 0 | 0.0% |
| 60 to 89 Minutes | 0 | 0.0% |
| 90 or more Minutes | 0 | 0.0% |
Commute Time by Sex in Hamer
The most common commute times in Hamer are 5 to 9 minutes (3 commuters, 42.9%) for males and 20 to 24 minutes (5 commuters, 55.6%) for females.
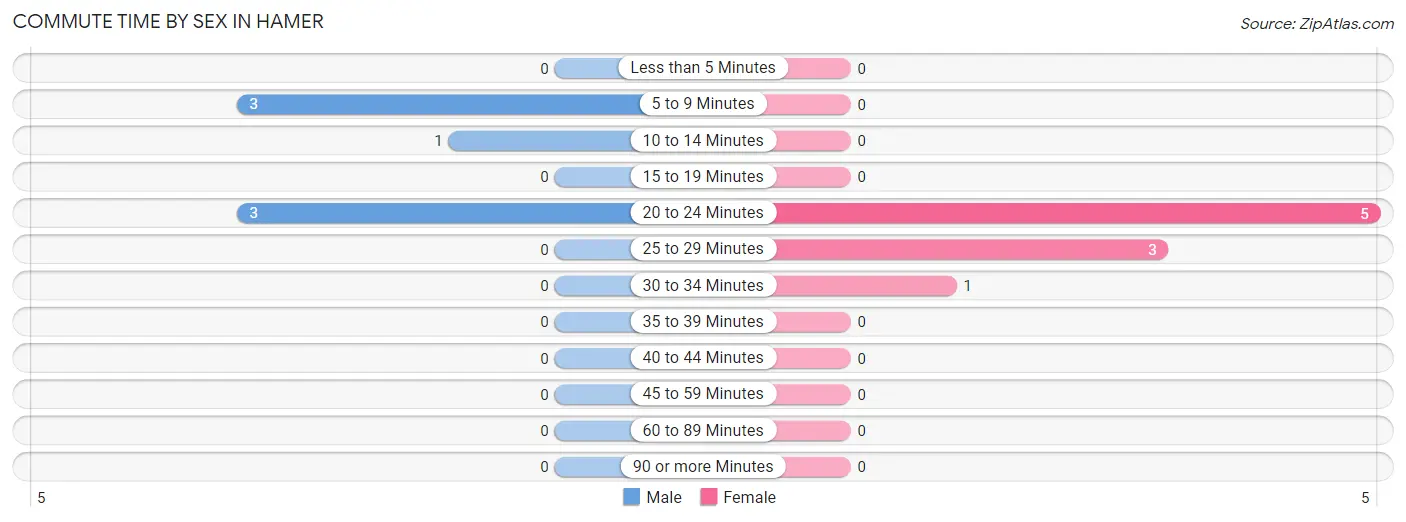
| Commute Time | Male | Female |
| Less than 5 Minutes | 0 (0.0%) | 0 (0.0%) |
| 5 to 9 Minutes | 3 (42.9%) | 0 (0.0%) |
| 10 to 14 Minutes | 1 (14.3%) | 0 (0.0%) |
| 15 to 19 Minutes | 0 (0.0%) | 0 (0.0%) |
| 20 to 24 Minutes | 3 (42.9%) | 5 (55.6%) |
| 25 to 29 Minutes | 0 (0.0%) | 3 (33.3%) |
| 30 to 34 Minutes | 0 (0.0%) | 1 (11.1%) |
| 35 to 39 Minutes | 0 (0.0%) | 0 (0.0%) |
| 40 to 44 Minutes | 0 (0.0%) | 0 (0.0%) |
| 45 to 59 Minutes | 0 (0.0%) | 0 (0.0%) |
| 60 to 89 Minutes | 0 (0.0%) | 0 (0.0%) |
| 90 or more Minutes | 0 (0.0%) | 0 (0.0%) |
Time of Departure to Work by Sex in Hamer
The most frequent times of departure to work in Hamer are 5:30 AM to 5:59 AM (3, 42.9%) for males and 6:30 AM to 6:59 AM (5, 55.6%) for females.
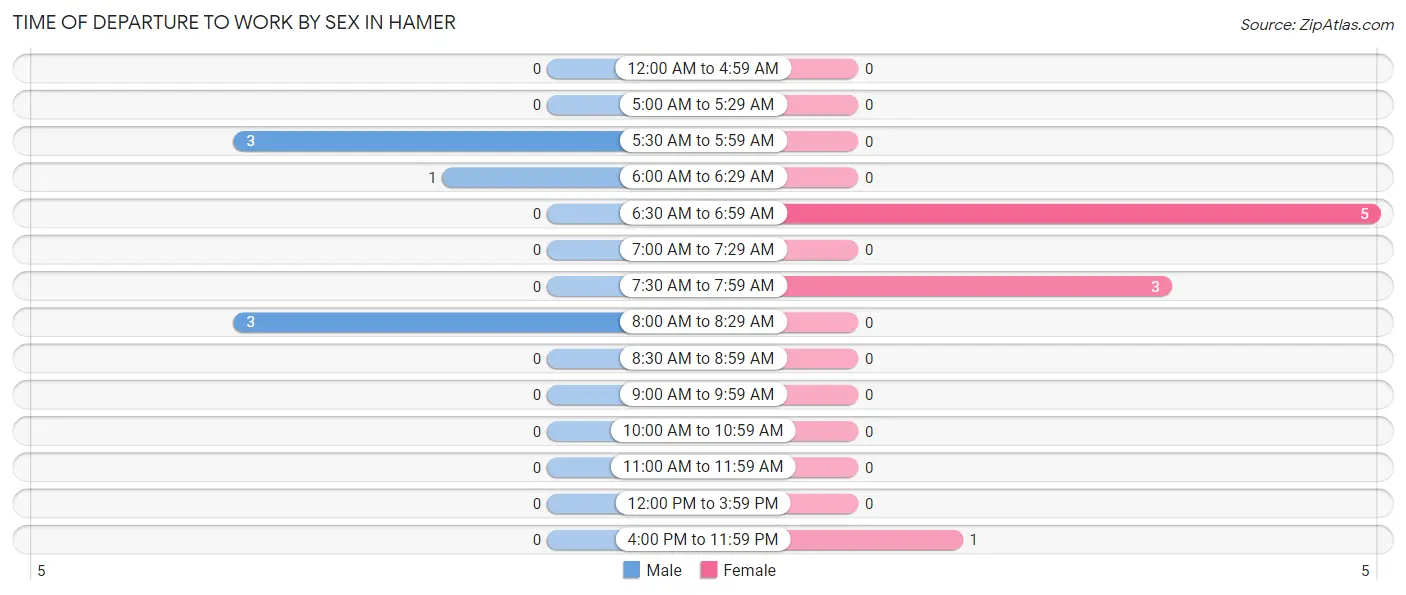
| Time of Departure | Male | Female |
| 12:00 AM to 4:59 AM | 0 (0.0%) | 0 (0.0%) |
| 5:00 AM to 5:29 AM | 0 (0.0%) | 0 (0.0%) |
| 5:30 AM to 5:59 AM | 3 (42.9%) | 0 (0.0%) |
| 6:00 AM to 6:29 AM | 1 (14.3%) | 0 (0.0%) |
| 6:30 AM to 6:59 AM | 0 (0.0%) | 5 (55.6%) |
| 7:00 AM to 7:29 AM | 0 (0.0%) | 0 (0.0%) |
| 7:30 AM to 7:59 AM | 0 (0.0%) | 3 (33.3%) |
| 8:00 AM to 8:29 AM | 3 (42.9%) | 0 (0.0%) |
| 8:30 AM to 8:59 AM | 0 (0.0%) | 0 (0.0%) |
| 9:00 AM to 9:59 AM | 0 (0.0%) | 0 (0.0%) |
| 10:00 AM to 10:59 AM | 0 (0.0%) | 0 (0.0%) |
| 11:00 AM to 11:59 AM | 0 (0.0%) | 0 (0.0%) |
| 12:00 PM to 3:59 PM | 0 (0.0%) | 0 (0.0%) |
| 4:00 PM to 11:59 PM | 0 (0.0%) | 1 (11.1%) |
| Total | 7 (100.0%) | 9 (100.0%) |
Housing Occupancy in Hamer
Occupancy by Ownership in Hamer
Of the total 13 dwellings in Hamer, owner-occupied units account for 10 (76.9%), while renter-occupied units make up 3 (23.1%).
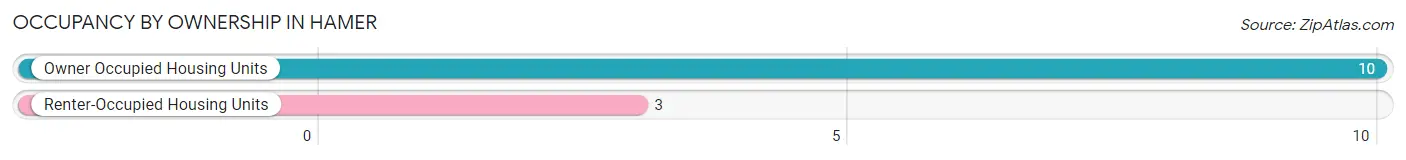
| Occupancy | # Housing Units | % Housing Units |
| Owner Occupied Housing Units | 10 | 76.9% |
| Renter-Occupied Housing Units | 3 | 23.1% |
| Total Occupied Housing Units | 13 | 100.0% |
Occupancy by Household Size in Hamer
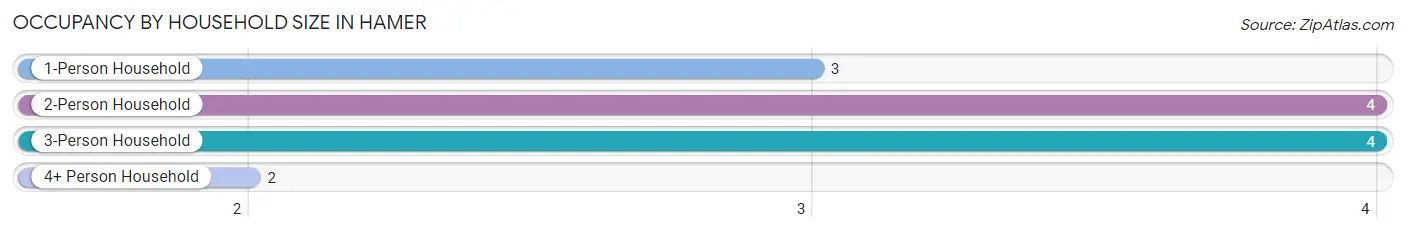
| Household Size | # Housing Units | % Housing Units |
| 1-Person Household | 3 | 23.1% |
| 2-Person Household | 4 | 30.8% |
| 3-Person Household | 4 | 30.8% |
| 4+ Person Household | 2 | 15.4% |
| Total Housing Units | 13 | 100.0% |
Occupancy by Ownership by Household Size in Hamer
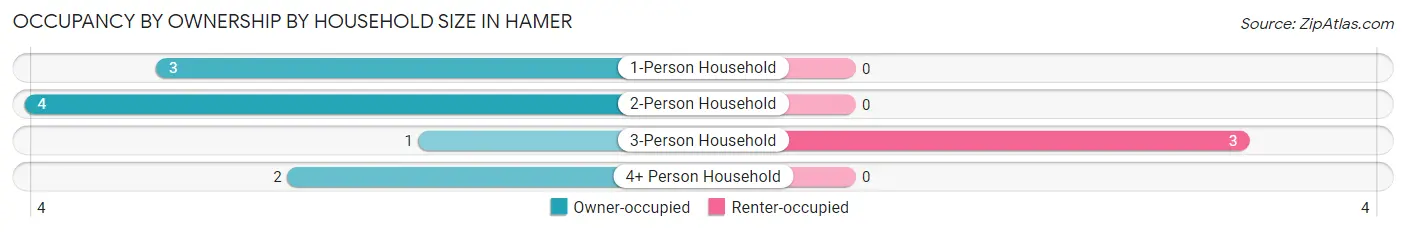
| Household Size | Owner-occupied | Renter-occupied |
| 1-Person Household | 3 (100.0%) | 0 (0.0%) |
| 2-Person Household | 4 (100.0%) | 0 (0.0%) |
| 3-Person Household | 1 (25.0%) | 3 (75.0%) |
| 4+ Person Household | 2 (100.0%) | 0 (0.0%) |
| Total Housing Units | 10 (76.9%) | 3 (23.1%) |
Occupancy by Educational Attainment in Hamer
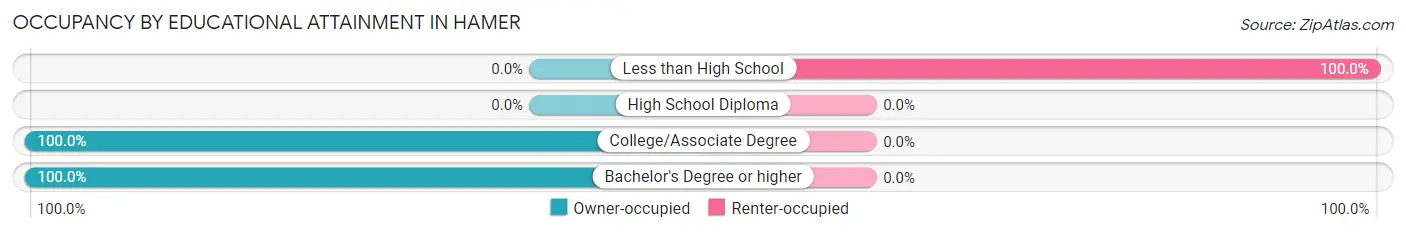
| Household Size | Owner-occupied | Renter-occupied |
| Less than High School | 0 (0.0%) | 3 (100.0%) |
| High School Diploma | 0 (0.0%) | 0 (0.0%) |
| College/Associate Degree | 6 (100.0%) | 0 (0.0%) |
| Bachelor's Degree or higher | 4 (100.0%) | 0 (0.0%) |
Occupancy by Age of Householder in Hamer
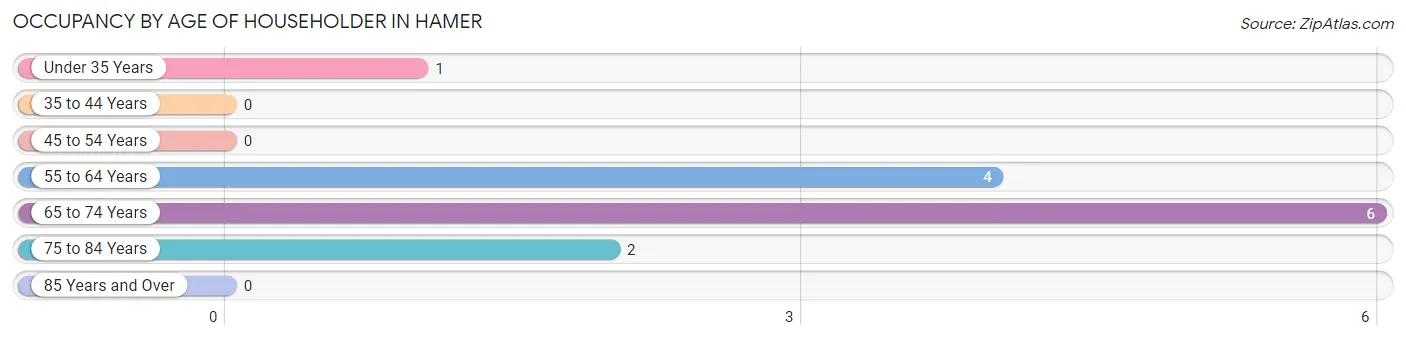
| Age Bracket | # Households | % Households |
| Under 35 Years | 1 | 7.7% |
| 35 to 44 Years | 0 | 0.0% |
| 45 to 54 Years | 0 | 0.0% |
| 55 to 64 Years | 4 | 30.8% |
| 65 to 74 Years | 6 | 46.2% |
| 75 to 84 Years | 2 | 15.4% |
| 85 Years and Over | 0 | 0.0% |
| Total | 13 | 100.0% |
Housing Finances in Hamer
Median Income by Occupancy in Hamer
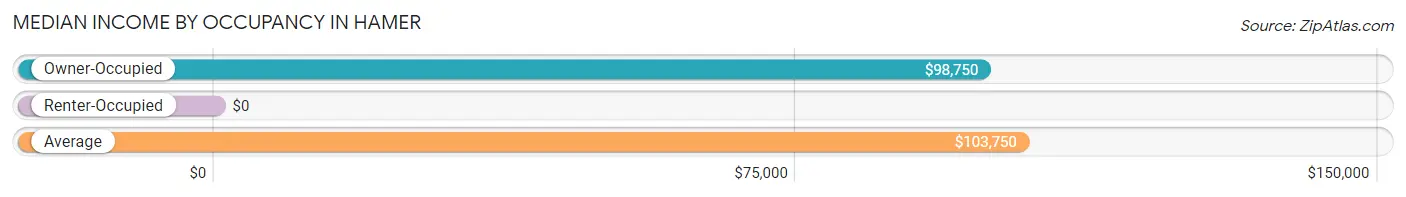
| Occupancy Type | # Households | Median Income |
| Owner-Occupied | 10 (76.9%) | $98,750 |
| Renter-Occupied | 3 (23.1%) | $0 |
| Average | 13 (100.0%) | $103,750 |
Occupancy by Householder Income Bracket in Hamer
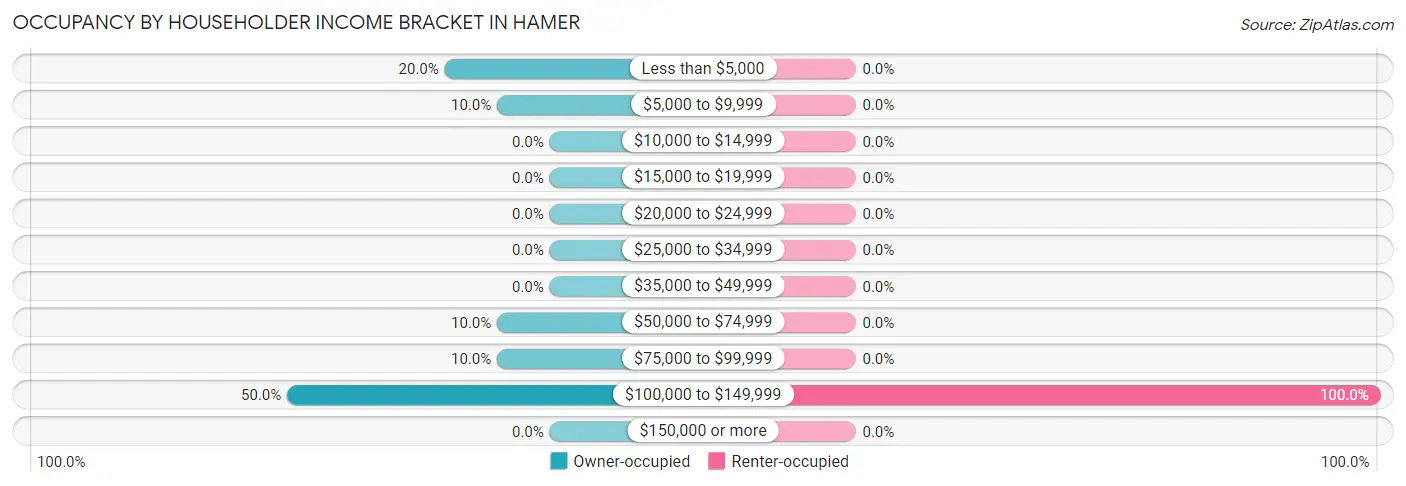
| Income Bracket | Owner-occupied | Renter-occupied |
| Less than $5,000 | 2 (20.0%) | 0 (0.0%) |
| $5,000 to $9,999 | 1 (10.0%) | 0 (0.0%) |
| $10,000 to $14,999 | 0 (0.0%) | 0 (0.0%) |
| $15,000 to $19,999 | 0 (0.0%) | 0 (0.0%) |
| $20,000 to $24,999 | 0 (0.0%) | 0 (0.0%) |
| $25,000 to $34,999 | 0 (0.0%) | 0 (0.0%) |
| $35,000 to $49,999 | 0 (0.0%) | 0 (0.0%) |
| $50,000 to $74,999 | 1 (10.0%) | 0 (0.0%) |
| $75,000 to $99,999 | 1 (10.0%) | 0 (0.0%) |
| $100,000 to $149,999 | 5 (50.0%) | 3 (100.0%) |
| $150,000 or more | 0 (0.0%) | 0 (0.0%) |
| Total | 10 (100.0%) | 3 (100.0%) |
Monthly Housing Cost Tiers in Hamer
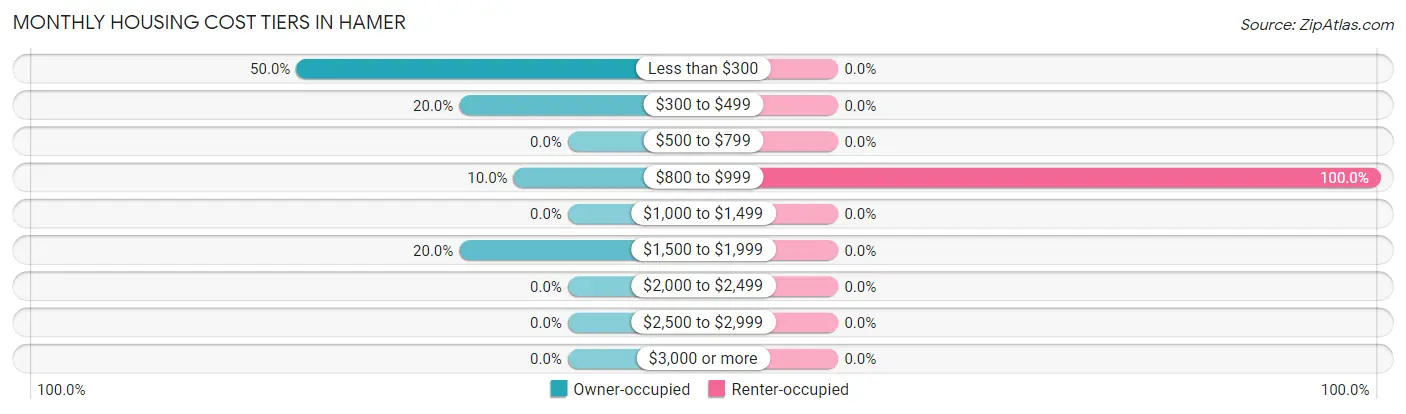
| Monthly Cost | Owner-occupied | Renter-occupied |
| Less than $300 | 5 (50.0%) | 0 (0.0%) |
| $300 to $499 | 2 (20.0%) | 0 (0.0%) |
| $500 to $799 | 0 (0.0%) | 0 (0.0%) |
| $800 to $999 | 1 (10.0%) | 3 (100.0%) |
| $1,000 to $1,499 | 0 (0.0%) | 0 (0.0%) |
| $1,500 to $1,999 | 2 (20.0%) | 0 (0.0%) |
| $2,000 to $2,499 | 0 (0.0%) | 0 (0.0%) |
| $2,500 to $2,999 | 0 (0.0%) | 0 (0.0%) |
| $3,000 or more | 0 (0.0%) | 0 (0.0%) |
| Total | 10 (100.0%) | 3 (100.0%) |
Physical Housing Characteristics in Hamer
Housing Structures in Hamer
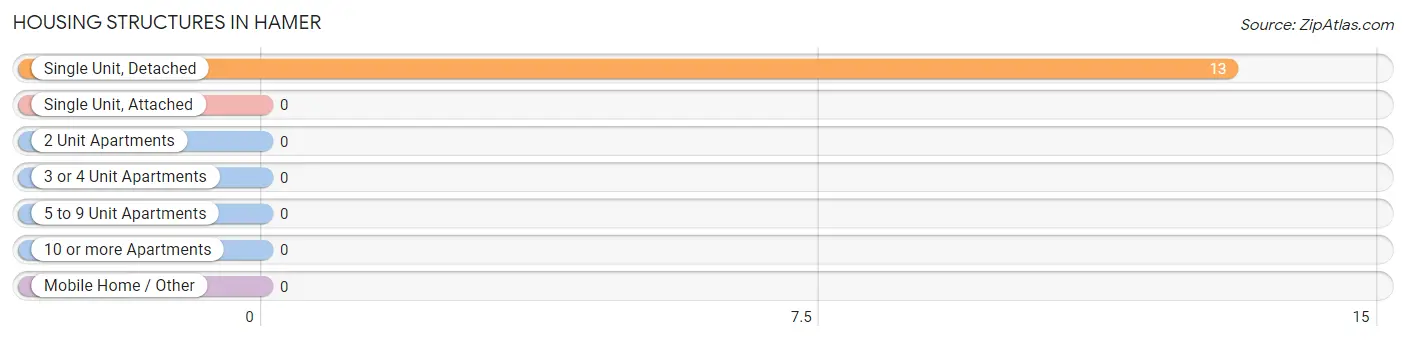
| Structure Type | # Housing Units | % Housing Units |
| Single Unit, Detached | 13 | 100.0% |
| Single Unit, Attached | 0 | 0.0% |
| 2 Unit Apartments | 0 | 0.0% |
| 3 or 4 Unit Apartments | 0 | 0.0% |
| 5 to 9 Unit Apartments | 0 | 0.0% |
| 10 or more Apartments | 0 | 0.0% |
| Mobile Home / Other | 0 | 0.0% |
| Total | 13 | 100.0% |
Housing Structures by Occupancy in Hamer
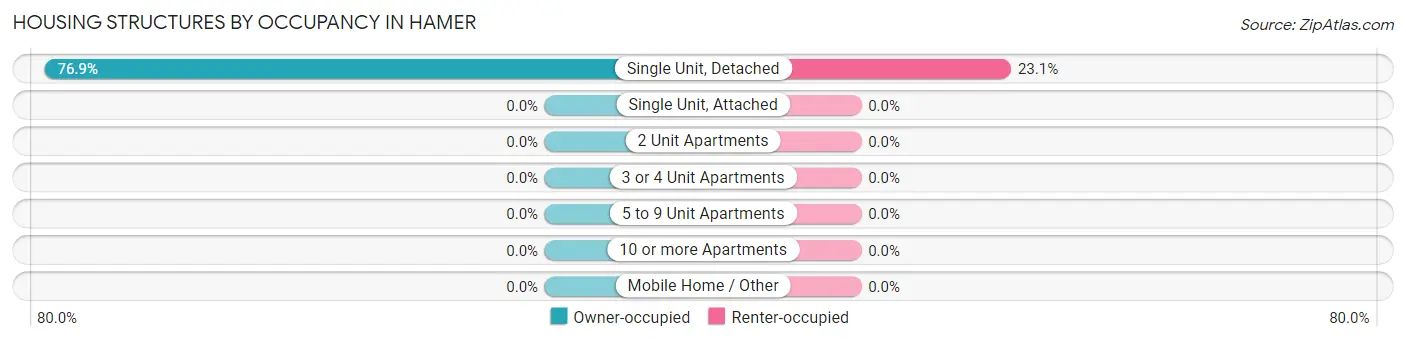
| Structure Type | Owner-occupied | Renter-occupied |
| Single Unit, Detached | 10 (76.9%) | 3 (23.1%) |
| Single Unit, Attached | 0 (0.0%) | 0 (0.0%) |
| 2 Unit Apartments | 0 (0.0%) | 0 (0.0%) |
| 3 or 4 Unit Apartments | 0 (0.0%) | 0 (0.0%) |
| 5 to 9 Unit Apartments | 0 (0.0%) | 0 (0.0%) |
| 10 or more Apartments | 0 (0.0%) | 0 (0.0%) |
| Mobile Home / Other | 0 (0.0%) | 0 (0.0%) |
| Total | 10 (76.9%) | 3 (23.1%) |
Housing Structures by Number of Rooms in Hamer
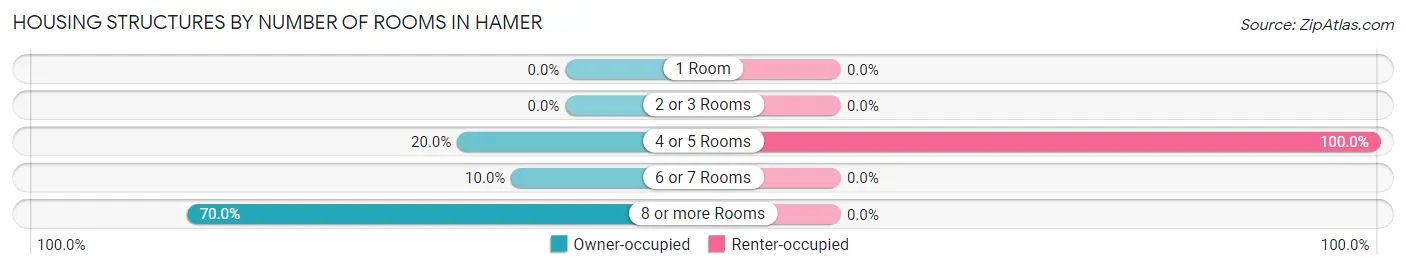
| Number of Rooms | Owner-occupied | Renter-occupied |
| 1 Room | 0 (0.0%) | 0 (0.0%) |
| 2 or 3 Rooms | 0 (0.0%) | 0 (0.0%) |
| 4 or 5 Rooms | 2 (20.0%) | 3 (100.0%) |
| 6 or 7 Rooms | 1 (10.0%) | 0 (0.0%) |
| 8 or more Rooms | 7 (70.0%) | 0 (0.0%) |
| Total | 10 (100.0%) | 3 (100.0%) |
Housing Structure by Heating Type in Hamer
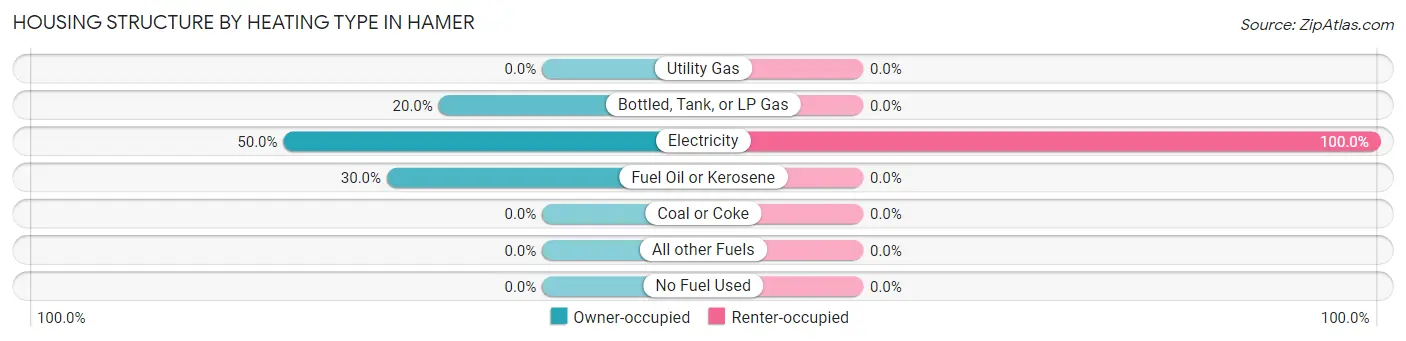
| Heating Type | Owner-occupied | Renter-occupied |
| Utility Gas | 0 (0.0%) | 0 (0.0%) |
| Bottled, Tank, or LP Gas | 2 (20.0%) | 0 (0.0%) |
| Electricity | 5 (50.0%) | 3 (100.0%) |
| Fuel Oil or Kerosene | 3 (30.0%) | 0 (0.0%) |
| Coal or Coke | 0 (0.0%) | 0 (0.0%) |
| All other Fuels | 0 (0.0%) | 0 (0.0%) |
| No Fuel Used | 0 (0.0%) | 0 (0.0%) |
| Total | 10 (100.0%) | 3 (100.0%) |
Household Vehicle Usage in Hamer
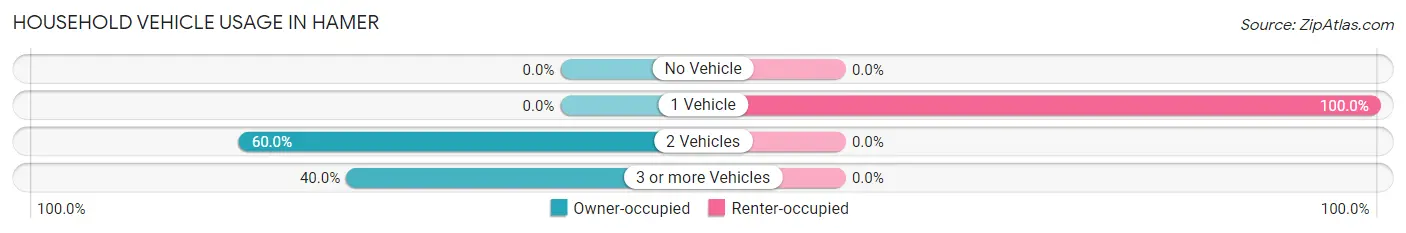
| Vehicles per Household | Owner-occupied | Renter-occupied |
| No Vehicle | 0 (0.0%) | 0 (0.0%) |
| 1 Vehicle | 0 (0.0%) | 3 (100.0%) |
| 2 Vehicles | 6 (60.0%) | 0 (0.0%) |
| 3 or more Vehicles | 4 (40.0%) | 0 (0.0%) |
| Total | 10 (100.0%) | 3 (100.0%) |
Real Estate & Mortgages in Hamer
Real Estate and Mortgage Overview in Hamer
| Characteristic | Without Mortgage | With Mortgage |
| Housing Units | 7 | 3 |
| Median Property Value | $275,000 | $225,000 |
| Median Household Income | $102,917 | $0 |
| Monthly Housing Costs | $275 | $0 |
| Real Estate Taxes | $500 | $0 |
Property Value by Mortgage Status in Hamer
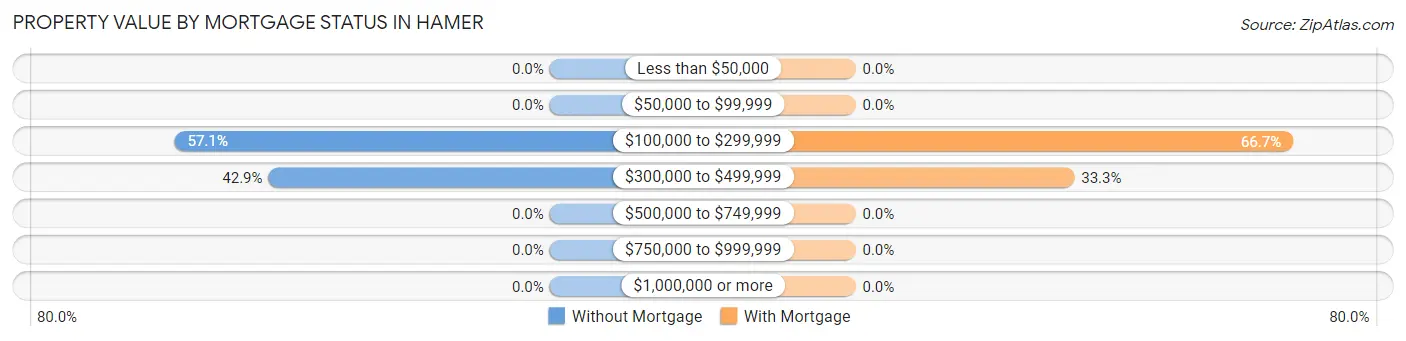
| Property Value | Without Mortgage | With Mortgage |
| Less than $50,000 | 0 (0.0%) | 0 (0.0%) |
| $50,000 to $99,999 | 0 (0.0%) | 0 (0.0%) |
| $100,000 to $299,999 | 4 (57.1%) | 2 (66.7%) |
| $300,000 to $499,999 | 3 (42.9%) | 1 (33.3%) |
| $500,000 to $749,999 | 0 (0.0%) | 0 (0.0%) |
| $750,000 to $999,999 | 0 (0.0%) | 0 (0.0%) |
| $1,000,000 or more | 0 (0.0%) | 0 (0.0%) |
| Total | 7 (100.0%) | 3 (100.0%) |
Household Income by Mortgage Status in Hamer
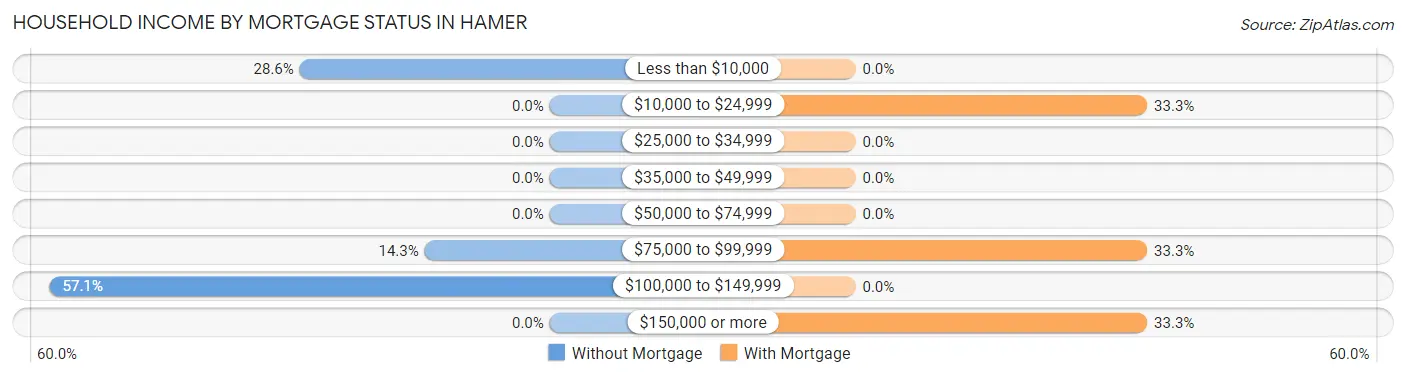
| Household Income | Without Mortgage | With Mortgage |
| Less than $10,000 | 2 (28.6%) | 0 (0.0%) |
| $10,000 to $24,999 | 0 (0.0%) | 1 (33.3%) |
| $25,000 to $34,999 | 0 (0.0%) | 0 (0.0%) |
| $35,000 to $49,999 | 0 (0.0%) | 0 (0.0%) |
| $50,000 to $74,999 | 0 (0.0%) | 0 (0.0%) |
| $75,000 to $99,999 | 1 (14.3%) | 1 (33.3%) |
| $100,000 to $149,999 | 4 (57.1%) | 0 (0.0%) |
| $150,000 or more | 0 (0.0%) | 1 (33.3%) |
| Total | 7 (100.0%) | 3 (100.0%) |
Property Value to Household Income Ratio in Hamer
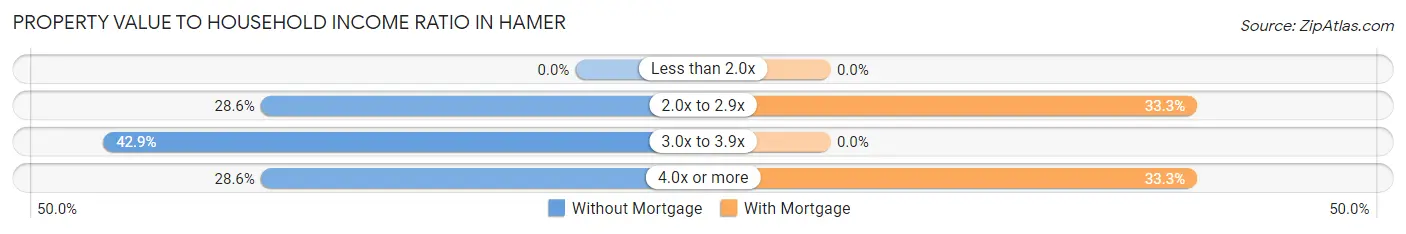
| Value-to-Income Ratio | Without Mortgage | With Mortgage |
| Less than 2.0x | 0 (0.0%) | 0 (0.0%) |
| 2.0x to 2.9x | 2 (28.6%) | 1 (33.3%) |
| 3.0x to 3.9x | 3 (42.9%) | 0 (0.0%) |
| 4.0x or more | 2 (28.6%) | 1 (33.3%) |
| Total | 7 (100.0%) | 3 (100.0%) |
Real Estate Taxes by Mortgage Status in Hamer
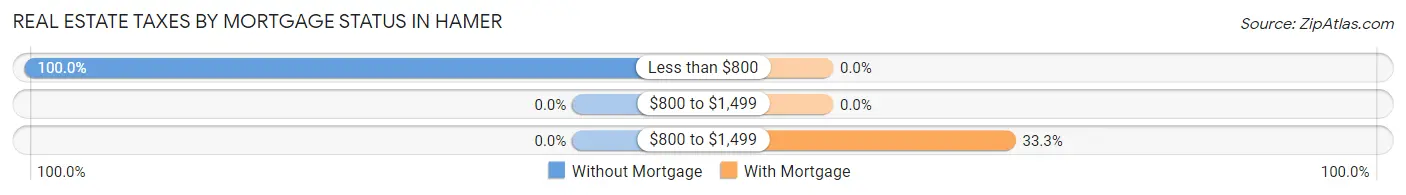
| Property Taxes | Without Mortgage | With Mortgage |
| Less than $800 | 7 (100.0%) | 0 (0.0%) |
| $800 to $1,499 | 0 (0.0%) | 0 (0.0%) |
| $800 to $1,499 | 0 (0.0%) | 1 (33.3%) |
| Total | 7 (100.0%) | 3 (100.0%) |
Health & Disability in Hamer
Health Insurance Coverage by Age in Hamer
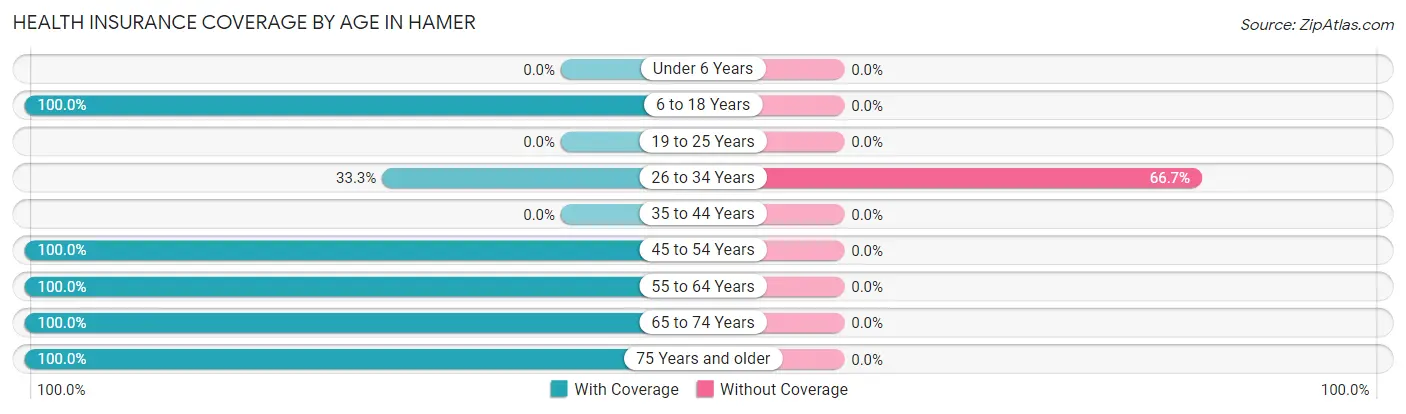
| Age Bracket | With Coverage | Without Coverage |
| Under 6 Years | 0 (0.0%) | 0 (0.0%) |
| 6 to 18 Years | 9 (100.0%) | 0 (0.0%) |
| 19 to 25 Years | 0 (0.0%) | 0 (0.0%) |
| 26 to 34 Years | 1 (33.3%) | 2 (66.7%) |
| 35 to 44 Years | 0 (0.0%) | 0 (0.0%) |
| 45 to 54 Years | 5 (100.0%) | 0 (0.0%) |
| 55 to 64 Years | 10 (100.0%) | 0 (0.0%) |
| 65 to 74 Years | 8 (100.0%) | 0 (0.0%) |
| 75 Years and older | 3 (100.0%) | 0 (0.0%) |
| Total | 36 (94.7%) | 2 (5.3%) |
Health Insurance Coverage by Citizenship Status in Hamer
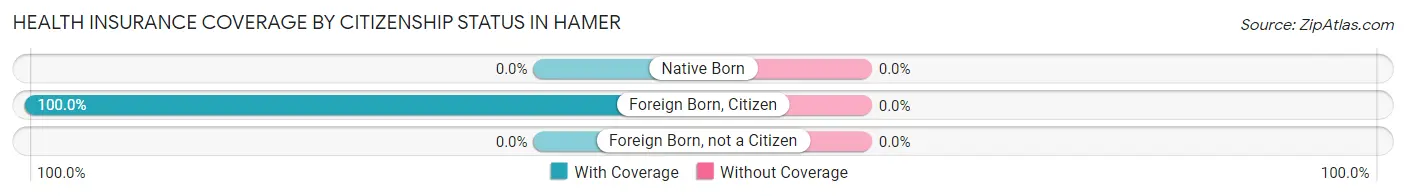
| Citizenship Status | With Coverage | Without Coverage |
| Native Born | 0 (0.0%) | 0 (0.0%) |
| Foreign Born, Citizen | 9 (100.0%) | 0 (0.0%) |
| Foreign Born, not a Citizen | 0 (0.0%) | 0 (0.0%) |
Health Insurance Coverage by Household Income in Hamer
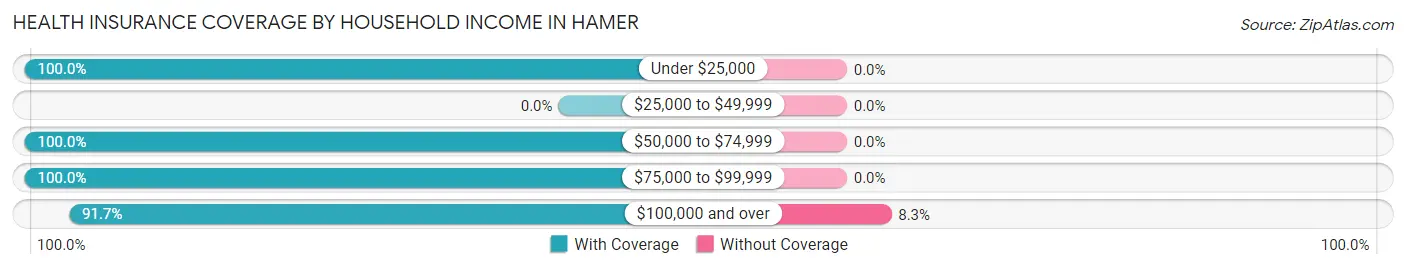
| Household Income | With Coverage | Without Coverage |
| Under $25,000 | 6 (100.0%) | 0 (0.0%) |
| $25,000 to $49,999 | 0 (0.0%) | 0 (0.0%) |
| $50,000 to $74,999 | 6 (100.0%) | 0 (0.0%) |
| $75,000 to $99,999 | 2 (100.0%) | 0 (0.0%) |
| $100,000 and over | 22 (91.7%) | 2 (8.3%) |
Public vs Private Health Insurance Coverage by Age in Hamer
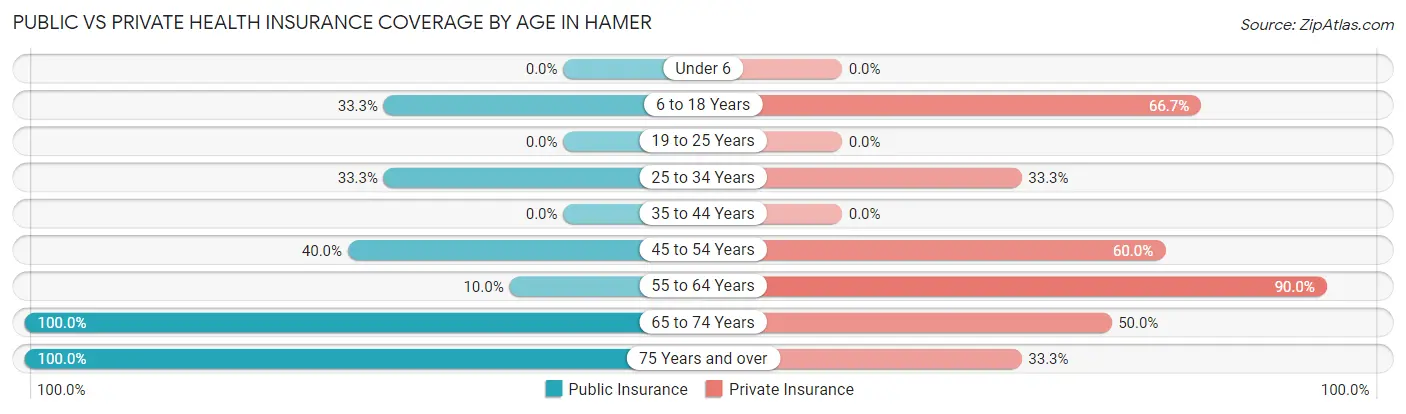
| Age Bracket | Public Insurance | Private Insurance |
| Under 6 | 0 (0.0%) | 0 (0.0%) |
| 6 to 18 Years | 3 (33.3%) | 6 (66.7%) |
| 19 to 25 Years | 0 (0.0%) | 0 (0.0%) |
| 25 to 34 Years | 1 (33.3%) | 1 (33.3%) |
| 35 to 44 Years | 0 (0.0%) | 0 (0.0%) |
| 45 to 54 Years | 2 (40.0%) | 3 (60.0%) |
| 55 to 64 Years | 1 (10.0%) | 9 (90.0%) |
| 65 to 74 Years | 8 (100.0%) | 4 (50.0%) |
| 75 Years and over | 3 (100.0%) | 1 (33.3%) |
| Total | 18 (47.4%) | 24 (63.2%) |
Disability Status by Sex by Age in Hamer
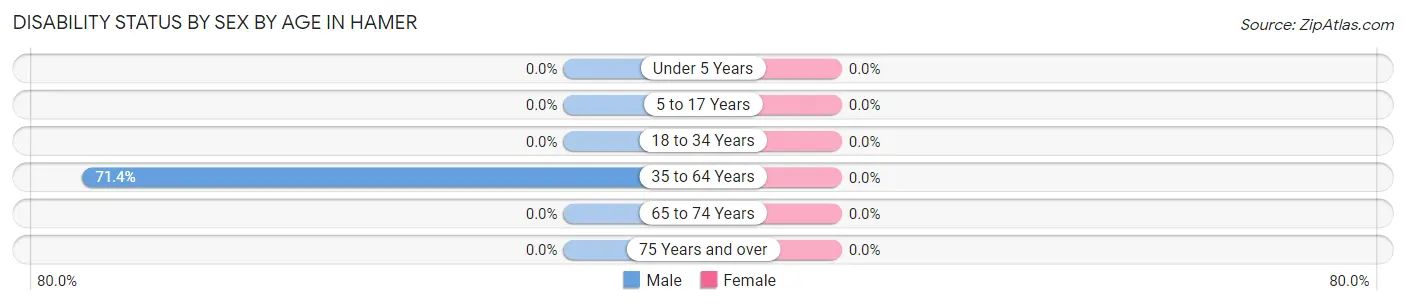
| Age Bracket | Male | Female |
| Under 5 Years | 0 (0.0%) | 0 (0.0%) |
| 5 to 17 Years | 0 (0.0%) | 0 (0.0%) |
| 18 to 34 Years | 0 (0.0%) | 0 (0.0%) |
| 35 to 64 Years | 5 (71.4%) | 0 (0.0%) |
| 65 to 74 Years | 0 (0.0%) | 0 (0.0%) |
| 75 Years and over | 0 (0.0%) | 0 (0.0%) |
Disability Class by Sex by Age in Hamer
Disability Class: Hearing Difficulty
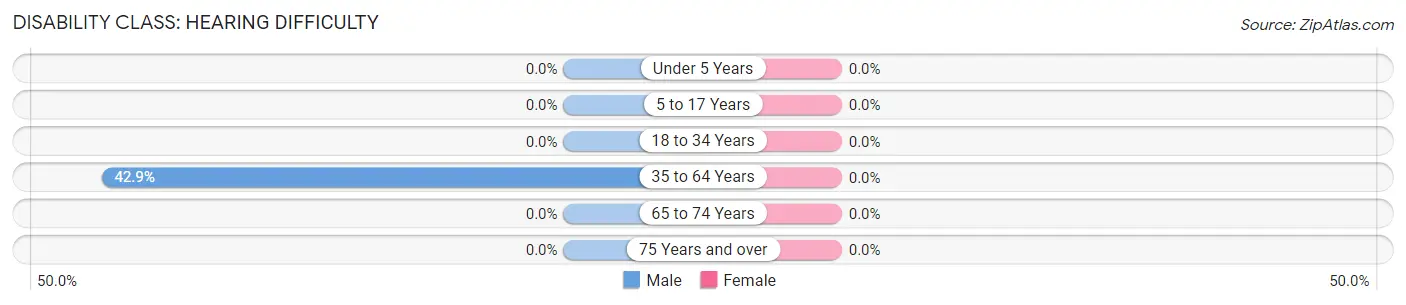
| Age Bracket | Male | Female |
| Under 5 Years | 0 (0.0%) | 0 (0.0%) |
| 5 to 17 Years | 0 (0.0%) | 0 (0.0%) |
| 18 to 34 Years | 0 (0.0%) | 0 (0.0%) |
| 35 to 64 Years | 3 (42.9%) | 0 (0.0%) |
| 65 to 74 Years | 0 (0.0%) | 0 (0.0%) |
| 75 Years and over | 0 (0.0%) | 0 (0.0%) |
Disability Class: Vision Difficulty
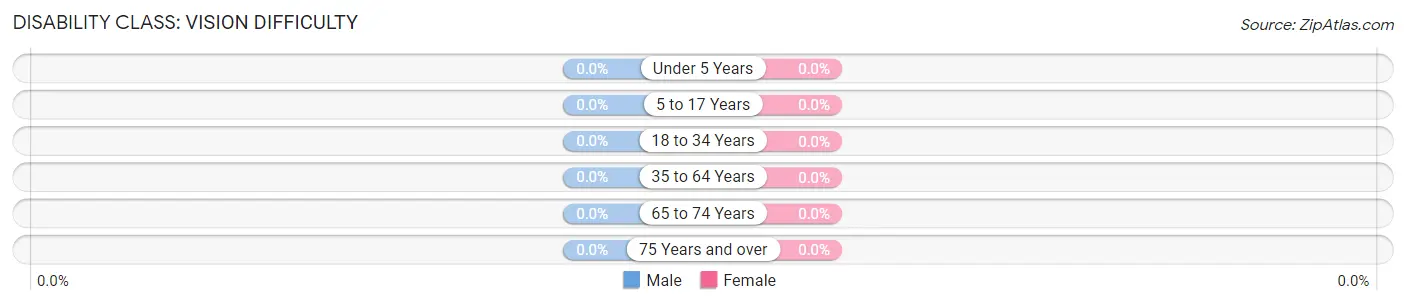
| Age Bracket | Male | Female |
| Under 5 Years | 0 (0.0%) | 0 (0.0%) |
| 5 to 17 Years | 0 (0.0%) | 0 (0.0%) |
| 18 to 34 Years | 0 (0.0%) | 0 (0.0%) |
| 35 to 64 Years | 0 (0.0%) | 0 (0.0%) |
| 65 to 74 Years | 0 (0.0%) | 0 (0.0%) |
| 75 Years and over | 0 (0.0%) | 0 (0.0%) |
Disability Class: Cognitive Difficulty

| Age Bracket | Male | Female |
| 5 to 17 Years | 0 (0.0%) | 0 (0.0%) |
| 18 to 34 Years | 0 (0.0%) | 0 (0.0%) |
| 35 to 64 Years | 0 (0.0%) | 0 (0.0%) |
| 65 to 74 Years | 0 (0.0%) | 0 (0.0%) |
| 75 Years and over | 0 (0.0%) | 0 (0.0%) |
Disability Class: Ambulatory Difficulty
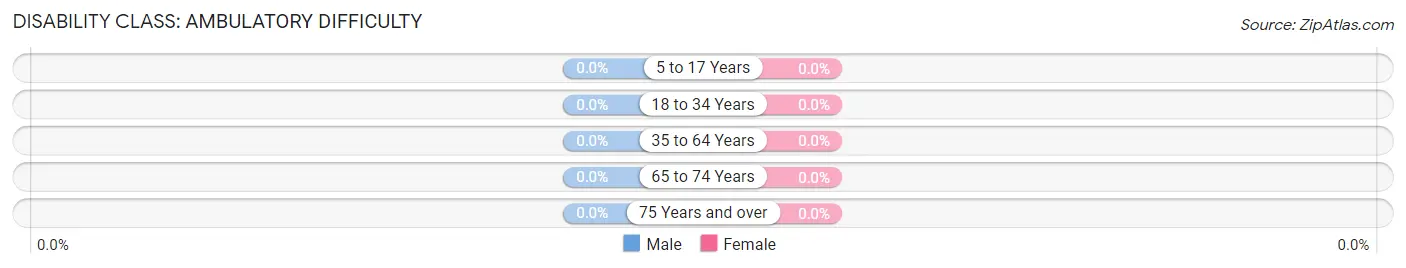
| Age Bracket | Male | Female |
| 5 to 17 Years | 0 (0.0%) | 0 (0.0%) |
| 18 to 34 Years | 0 (0.0%) | 0 (0.0%) |
| 35 to 64 Years | 0 (0.0%) | 0 (0.0%) |
| 65 to 74 Years | 0 (0.0%) | 0 (0.0%) |
| 75 Years and over | 0 (0.0%) | 0 (0.0%) |
Disability Class: Self-Care Difficulty
| Age Bracket | Male | Female |
| 5 to 17 Years | 0 (0.0%) | 0 (0.0%) |
| 18 to 34 Years | 0 (0.0%) | 0 (0.0%) |
| 35 to 64 Years | 0 (0.0%) | 0 (0.0%) |
| 65 to 74 Years | 0 (0.0%) | 0 (0.0%) |
| 75 Years and over | 0 (0.0%) | 0 (0.0%) |
Technology Access in Hamer
Computing Device Access in Hamer
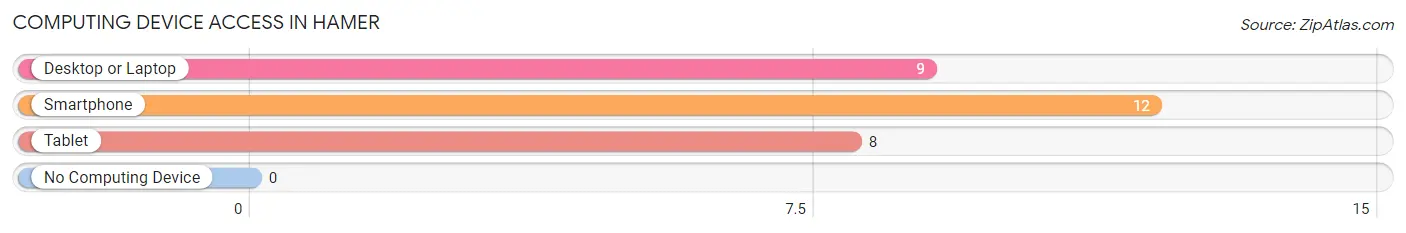
| Device Type | # Households | % Households |
| Desktop or Laptop | 9 | 69.2% |
| Smartphone | 12 | 92.3% |
| Tablet | 8 | 61.5% |
| No Computing Device | 0 | 0.0% |
| Total | 13 | 100.0% |
Internet Access in Hamer
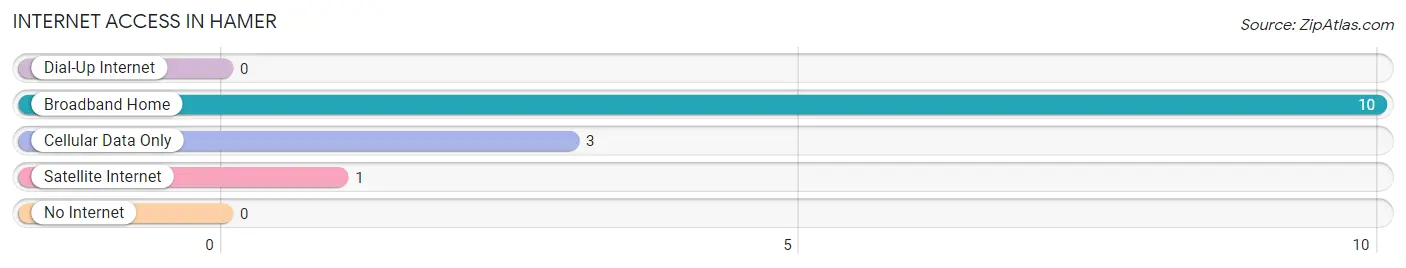
| Internet Type | # Households | % Households |
| Dial-Up Internet | 0 | 0.0% |
| Broadband Home | 10 | 76.9% |
| Cellular Data Only | 3 | 23.1% |
| Satellite Internet | 1 | 7.7% |
| No Internet | 0 | 0.0% |
| Total | 13 | 100.0% |
Hamer Summary
Hamer is a small city located in the southeastern corner of Idaho, in the United States. It is situated in the Snake River Plain, a region of the Great Basin Desert. The city is located in Bannock County, and is part of the Pocatello, Idaho Metropolitan Statistical Area. As of the 2010 census, the population of Hamer was 545.
Geography
Hamer is located at an elevation of 4,845 feet (1,477 m) above sea level. It is situated in the Snake River Plain, a region of the Great Basin Desert. The city is located in Bannock County, and is part of the Pocatello, Idaho Metropolitan Statistical Area. The city is located near the Portneuf River, which flows through the city.
Climate
Hamer has a semi-arid climate, with hot summers and cold winters. The average annual temperature is 44.3°F (6.8°C). The average annual precipitation is 11.2 inches (284 mm).
Demographics
As of the 2010 census, the population of Hamer was 545. The racial makeup of the city was 95.2% White, 0.2% African American, 0.7% Native American, 0.2% Asian, 0.2% Pacific Islander, 1.3% from other races, and 2.2% from two or more races. Hispanic or Latino of any race were 3.3% of the population.
Economy
Hamer is a small city with a limited economy. The city is home to a few small businesses, including a grocery store, a gas station, and a few restaurants. The city is also home to a few small manufacturing companies. The city is also home to a few farms, which produce a variety of crops, including potatoes, corn, and hay.
History
Hamer was founded in 1883 by a group of settlers from Utah. The city was named after a local rancher, John Hamer. The city was incorporated in 1891.
In the early 1900s, the city was a major stop on the Union Pacific Railroad. The railroad brought many new settlers to the area, and the city grew rapidly. The city was also home to a number of businesses, including a flour mill, a creamery, and a brickyard.
In the 1950s, the city began to decline. The railroad stopped running through the city, and many of the businesses closed. The population of the city began to decline, and by the 2000 census, the population had dropped to 545.
Today, Hamer is a small city with a limited economy. The city is home to a few small businesses, including a grocery store, a gas station, and a few restaurants. The city is also home to a few small manufacturing companies. The city is also home to a few farms, which produce a variety of crops, including potatoes, corn, and hay.
Common Questions
What is Per Capita Income in Hamer?
Per Capita income in Hamer is $28,711.
What is the Median Family Income in Hamer?
Median Family Income in Hamer is $100,000.
What is the Median Household income in Hamer?
Median Household Income in Hamer is $103,750.
What is Income or Wage Gap in Hamer?
Income or Wage Gap in Hamer is 52.4%.
Women in Hamer earn 47.6 cents for every dollar earned by a man.
What is Inequality or Gini Index in Hamer?
Inequality or Gini Index in Hamer is 0.30.
What is the Total Population of Hamer?
Total Population of Hamer is 38.
What is the Total Male Population of Hamer?
Total Male Population of Hamer is 23.
What is the Total Female Population of Hamer?
Total Female Population of Hamer is 15.
What is the Ratio of Males per 100 Females in Hamer?
There are 153.33 Males per 100 Females in Hamer.
What is the Ratio of Females per 100 Males in Hamer?
There are 65.22 Females per 100 Males in Hamer.
What is the Median Population Age in Hamer?
Median Population Age in Hamer is 61.5 Years.
What is the Average Family Size in Hamer
Average Family Size in Hamer is 3.5 People.
What is the Average Household Size in Hamer
Average Household Size in Hamer is 2.9 People.
How Large is the Labor Force in Hamer?
There are 17 People in the Labor Forcein in Hamer.
What is the Percentage of People in the Labor Force in Hamer?
54.8% of People are in the Labor Force in Hamer.