St Anthony, ID Map & Demographics
St Anthony Map
St Anthony Overview
$20,258
PER CAPITA INCOME
$51,646
AVG FAMILY INCOME
$44,313
AVG HOUSEHOLD INCOME
18.6%
WAGE / INCOME GAP [ % ]
81.4¢/ $1
WAGE / INCOME GAP [ $ ]
0.44
INEQUALITY / GINI INDEX
3,730
TOTAL POPULATION
1,868
MALE POPULATION
1,862
FEMALE POPULATION
100.32
MALES / 100 FEMALES
99.68
FEMALES / 100 MALES
33.5
MEDIAN AGE
3.5
AVG FAMILY SIZE
3.0
AVG HOUSEHOLD SIZE
1,450
LABOR FORCE [ PEOPLE ]
48.8%
PERCENT IN LABOR FORCE
8.1%
UNEMPLOYMENT RATE
Income in St Anthony
Income Overview in St Anthony
Per Capita Income in St Anthony is $20,258, while median incomes of families and households are $51,646 and $44,313 respectively.
| Characteristic | Number | Measure |
| Per Capita Income | 3,730 | $20,258 |
| Median Family Income | 842 | $51,646 |
| Mean Family Income | 842 | $55,149 |
| Median Household Income | 1,141 | $44,313 |
| Mean Household Income | 1,141 | $58,936 |
| Income Deficit | 842 | $0 |
| Wage / Income Gap (%) | 3,730 | 18.62% |
| Wage / Income Gap ($) | 3,730 | 81.38¢ per $1 |
| Gini / Inequality Index | 3,730 | 0.44 |
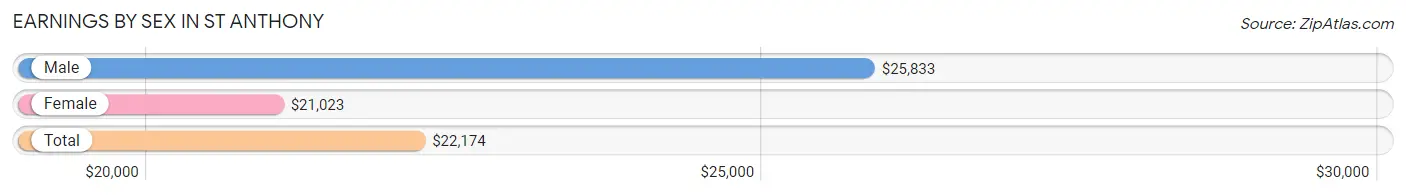
Earnings by Sex in St Anthony
Average Earnings in St Anthony are $22,174, $25,833 for men and $21,023 for women, a difference of 18.6%.
| Sex | Number | Average Earnings |
| Male | 1,030 (58.2%) | $25,833 |
| Female | 741 (41.8%) | $21,023 |
| Total | 1,771 (100.0%) | $22,174 |
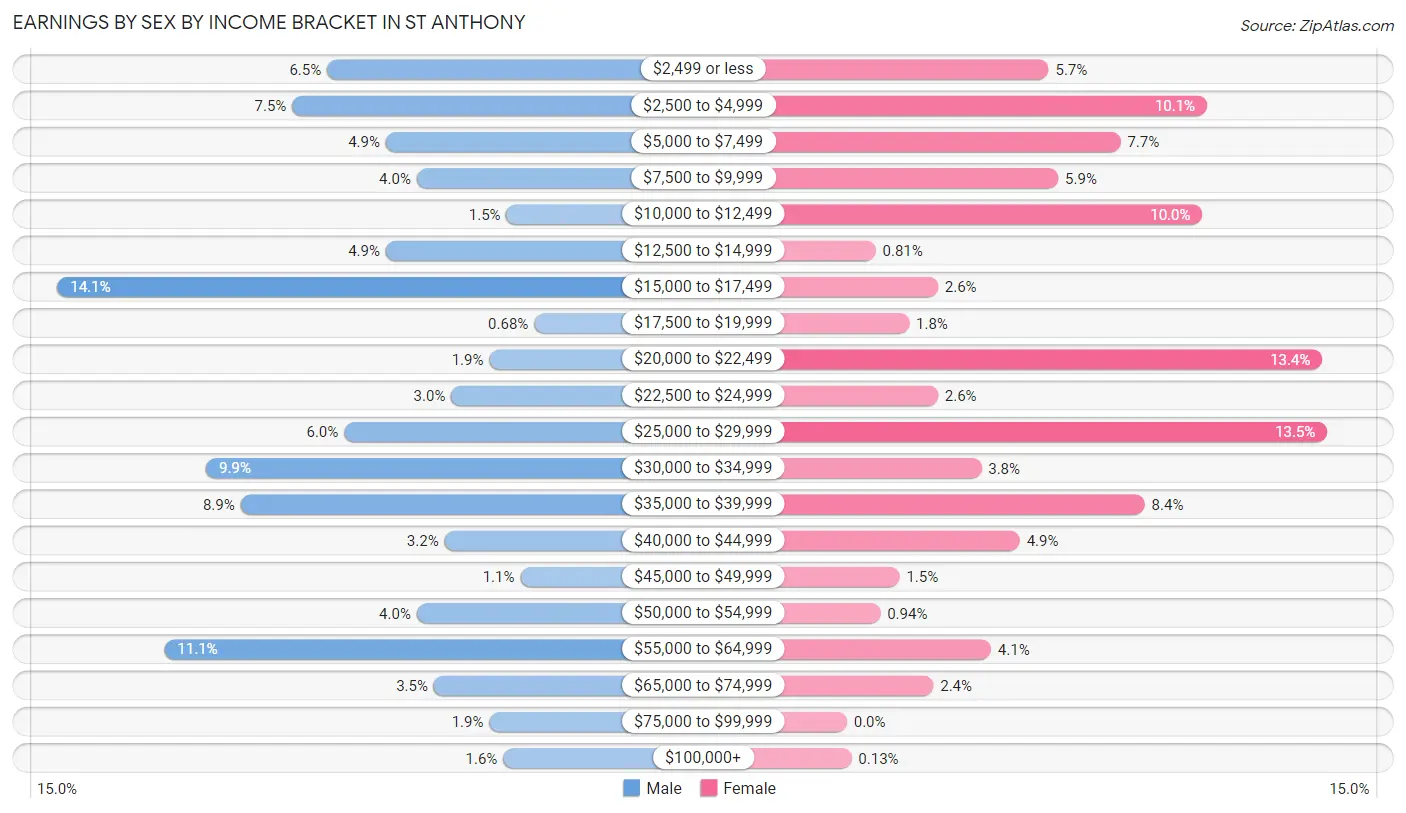
Earnings by Sex by Income Bracket in St Anthony
The most common earnings brackets in St Anthony are $15,000 to $17,499 for men (145 | 14.1%) and $25,000 to $29,999 for women (100 | 13.5%).
| Income | Male | Female |
| $2,499 or less | 67 (6.5%) | 42 (5.7%) |
| $2,500 to $4,999 | 77 (7.5%) | 75 (10.1%) |
| $5,000 to $7,499 | 50 (4.9%) | 57 (7.7%) |
| $7,500 to $9,999 | 41 (4.0%) | 44 (5.9%) |
| $10,000 to $12,499 | 15 (1.5%) | 74 (10.0%) |
| $12,500 to $14,999 | 50 (4.9%) | 6 (0.8%) |
| $15,000 to $17,499 | 145 (14.1%) | 19 (2.6%) |
| $17,500 to $19,999 | 7 (0.7%) | 13 (1.8%) |
| $20,000 to $22,499 | 20 (1.9%) | 99 (13.4%) |
| $22,500 to $24,999 | 31 (3.0%) | 19 (2.6%) |
| $25,000 to $29,999 | 62 (6.0%) | 100 (13.5%) |
| $30,000 to $34,999 | 102 (9.9%) | 28 (3.8%) |
| $35,000 to $39,999 | 92 (8.9%) | 62 (8.4%) |
| $40,000 to $44,999 | 33 (3.2%) | 36 (4.9%) |
| $45,000 to $49,999 | 11 (1.1%) | 11 (1.5%) |
| $50,000 to $54,999 | 41 (4.0%) | 7 (0.9%) |
| $55,000 to $64,999 | 114 (11.1%) | 30 (4.1%) |
| $65,000 to $74,999 | 36 (3.5%) | 18 (2.4%) |
| $75,000 to $99,999 | 20 (1.9%) | 0 (0.0%) |
| $100,000+ | 16 (1.5%) | 1 (0.1%) |
| Total | 1,030 (100.0%) | 741 (100.0%) |
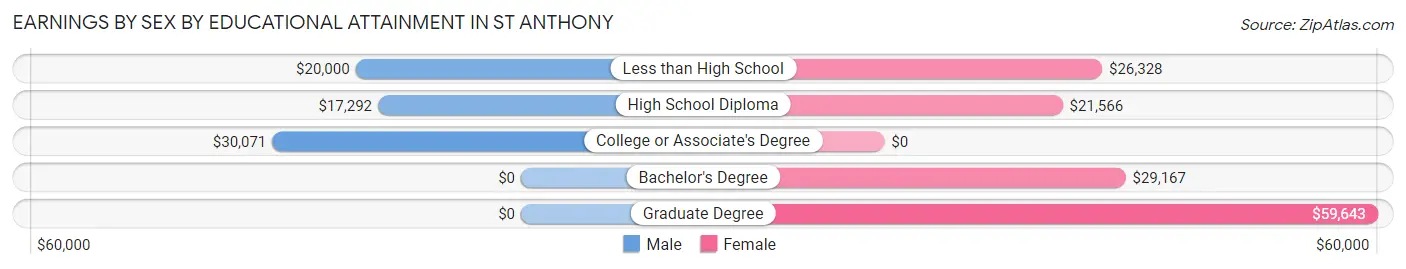
Earnings by Sex by Educational Attainment in St Anthony
Average earnings in St Anthony are $25,446 for men and $22,472 for women, a difference of 11.7%. Men with an educational attainment of college or associate's degree enjoy the highest average annual earnings of $30,071, while those with high school diploma education earn the least with $17,292. Women with an educational attainment of graduate degree earn the most with the average annual earnings of $59,643, while those with high school diploma education have the smallest earnings of $21,566.
| Educational Attainment | Male Income | Female Income |
| Less than High School | $20,000 | $26,328 |
| High School Diploma | $17,292 | $21,566 |
| College or Associate's Degree | $30,071 | $0 |
| Bachelor's Degree | - | - |
| Graduate Degree | - | - |
| Total | $25,446 | $22,472 |
Family Income in St Anthony
Family Income Brackets in St Anthony
According to the St Anthony family income data, there are 248 families falling into the $50,000 to $74,999 income range, which is the most common income bracket and makes up 29.4% of all families. Conversely, the $200,000+ income bracket is the least frequent group with only 5 families (0.6%) belonging to this category.
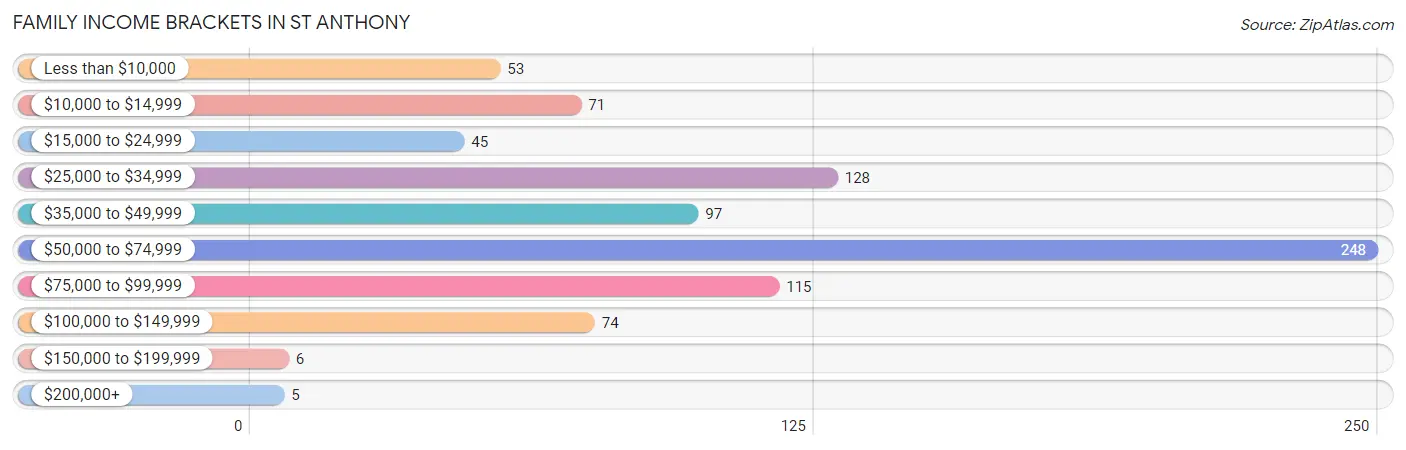
| Income Bracket | # Families | % Families |
| Less than $10,000 | 53 | 6.3% |
| $10,000 to $14,999 | 71 | 8.4% |
| $15,000 to $24,999 | 45 | 5.3% |
| $25,000 to $34,999 | 128 | 15.2% |
| $35,000 to $49,999 | 97 | 11.5% |
| $50,000 to $74,999 | 248 | 29.5% |
| $75,000 to $99,999 | 115 | 13.7% |
| $100,000 to $149,999 | 74 | 8.8% |
| $150,000 to $199,999 | 6 | 0.7% |
| $200,000+ | 5 | 0.6% |
Family Income by Famaliy Size in St Anthony
5-person families (47 | 5.6%) account for the highest median family income in St Anthony with $62,188 per family, while 2-person families (366 | 43.5%) have the highest median income of $24,834 per family member.
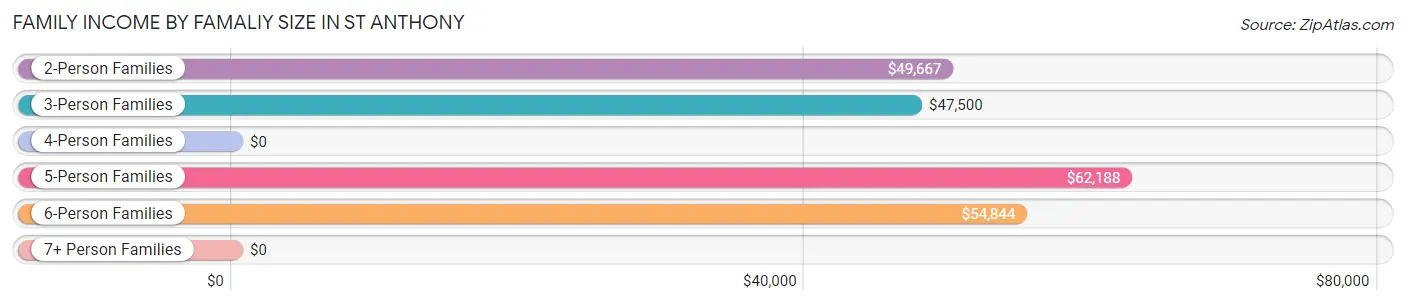
| Income Bracket | # Families | Median Income |
| 2-Person Families | 366 (43.5%) | $49,667 |
| 3-Person Families | 172 (20.4%) | $47,500 |
| 4-Person Families | 165 (19.6%) | $0 |
| 5-Person Families | 47 (5.6%) | $62,188 |
| 6-Person Families | 83 (9.9%) | $54,844 |
| 7+ Person Families | 9 (1.1%) | $0 |
| Total | 842 (100.0%) | $51,646 |
Family Income by Number of Earners in St Anthony
The median family income in St Anthony is $51,646, with families comprising 2 earners (370) having the highest median family income of $64,324, while families with 1 earner (229) have the lowest median family income of $33,725, accounting for 43.9% and 27.2% of families, respectively.
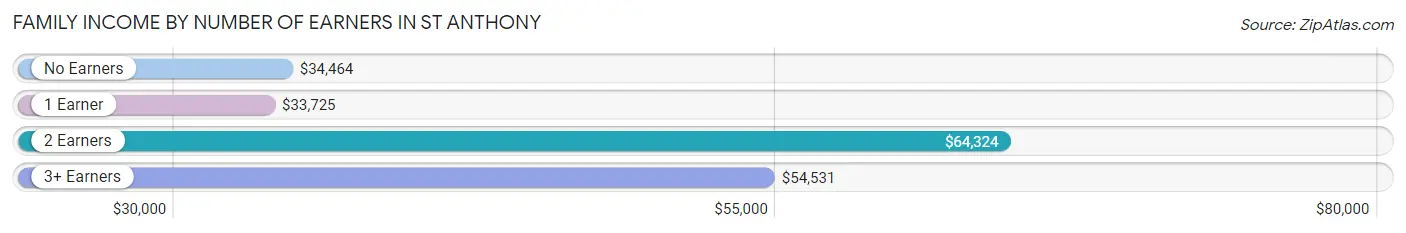
| Number of Earners | # Families | Median Income |
| No Earners | 192 (22.8%) | $34,464 |
| 1 Earner | 229 (27.2%) | $33,725 |
| 2 Earners | 370 (43.9%) | $64,324 |
| 3+ Earners | 51 (6.1%) | $54,531 |
| Total | 842 (100.0%) | $51,646 |
Household Income in St Anthony
Household Income Brackets in St Anthony
With 248 households falling in the category, the $50,000 to $74,999 income range is the most frequent in St Anthony, accounting for 21.7% of all households. In contrast, only 6 households (0.5%) fall into the $150,000 to $199,999 income bracket, making it the least populous group.
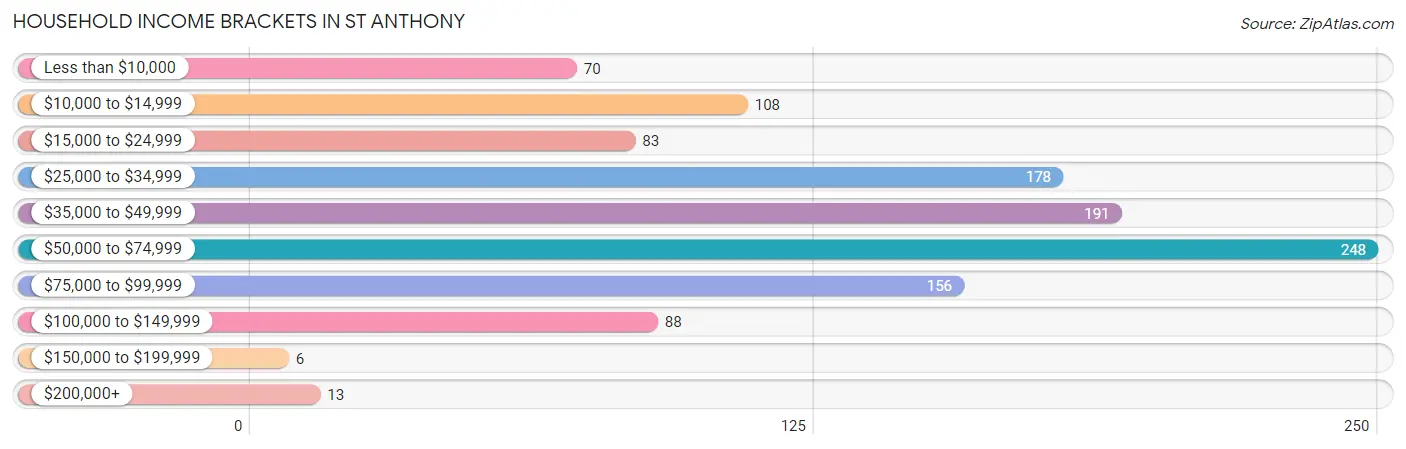
| Income Bracket | # Households | % Households |
| Less than $10,000 | 70 | 6.1% |
| $10,000 to $14,999 | 108 | 9.5% |
| $15,000 to $24,999 | 83 | 7.3% |
| $25,000 to $34,999 | 178 | 15.6% |
| $35,000 to $49,999 | 191 | 16.7% |
| $50,000 to $74,999 | 248 | 21.7% |
| $75,000 to $99,999 | 156 | 13.7% |
| $100,000 to $149,999 | 88 | 7.7% |
| $150,000 to $199,999 | 6 | 0.5% |
| $200,000+ | 13 | 1.1% |
Household Income by Householder Age in St Anthony
The median household income in St Anthony is $44,313, with the highest median household income of $62,019 found in the 45 to 64 years age bracket for the primary householder. A total of 409 households (35.8%) fall into this category. Meanwhile, the 65+ years age bracket for the primary householder has the lowest median household income of $39,375, with 336 households (29.4%) in this group.
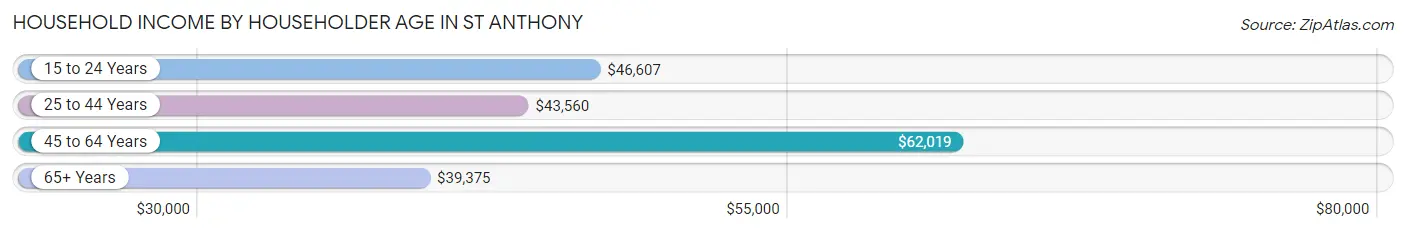
| Income Bracket | # Households | Median Income |
| 15 to 24 Years | 49 (4.3%) | $46,607 |
| 25 to 44 Years | 347 (30.4%) | $43,560 |
| 45 to 64 Years | 409 (35.8%) | $62,019 |
| 65+ Years | 336 (29.4%) | $39,375 |
| Total | 1,141 (100.0%) | $44,313 |
Poverty in St Anthony
Income Below Poverty by Sex and Age in St Anthony
With 21.1% poverty level for males and 24.9% for females among the residents of St Anthony, 16 and 17 year old males and 15 year old females are the most vulnerable to poverty, with 34 males (59.7%) and 11 females (50.0%) in their respective age groups living below the poverty level.
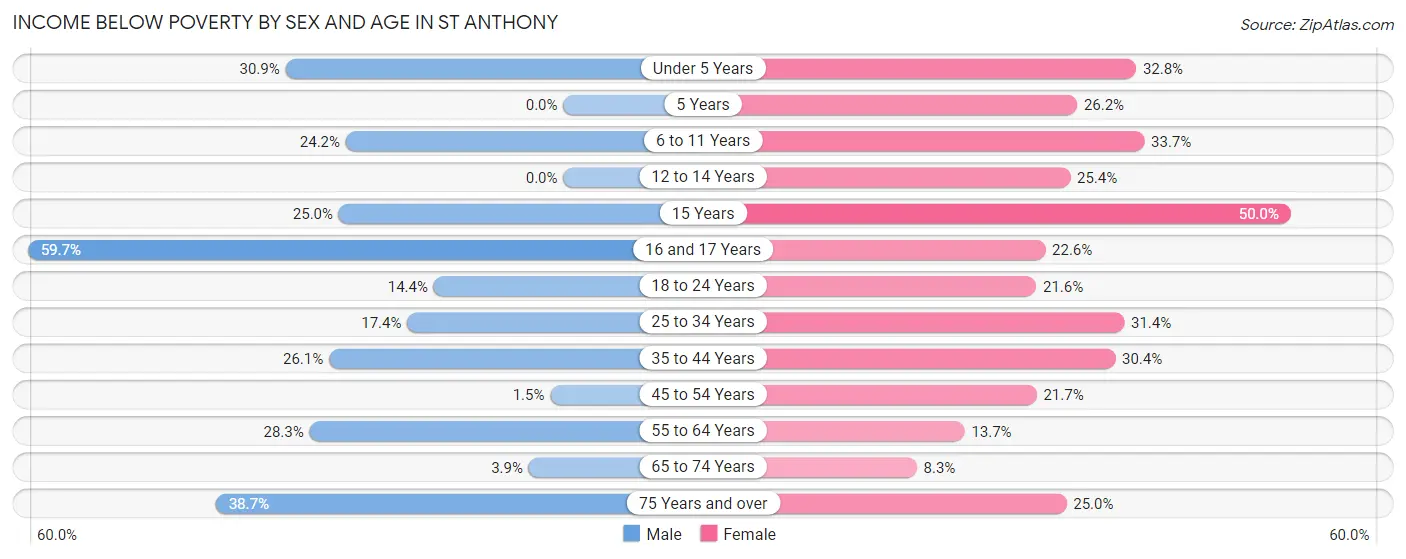
| Age Bracket | Male | Female |
| Under 5 Years | 43 (30.9%) | 38 (32.8%) |
| 5 Years | 0 (0.0%) | 11 (26.2%) |
| 6 to 11 Years | 31 (24.2%) | 67 (33.7%) |
| 12 to 14 Years | 0 (0.0%) | 15 (25.4%) |
| 15 Years | 6 (25.0%) | 11 (50.0%) |
| 16 and 17 Years | 34 (59.7%) | 12 (22.6%) |
| 18 to 24 Years | 14 (14.4%) | 45 (21.6%) |
| 25 to 34 Years | 57 (17.4%) | 99 (31.4%) |
| 35 to 44 Years | 36 (26.1%) | 42 (30.4%) |
| 45 to 54 Years | 3 (1.5%) | 49 (21.7%) |
| 55 to 64 Years | 54 (28.3%) | 25 (13.7%) |
| 65 to 74 Years | 4 (3.8%) | 13 (8.3%) |
| 75 Years and over | 48 (38.7%) | 35 (25.0%) |
| Total | 330 (21.1%) | 462 (24.9%) |
Income Above Poverty by Sex and Age in St Anthony
According to the poverty statistics in St Anthony, males aged 5 years and females aged 65 to 74 years are the age groups that are most secure financially, with 100.0% of males and 91.7% of females in these age groups living above the poverty line.
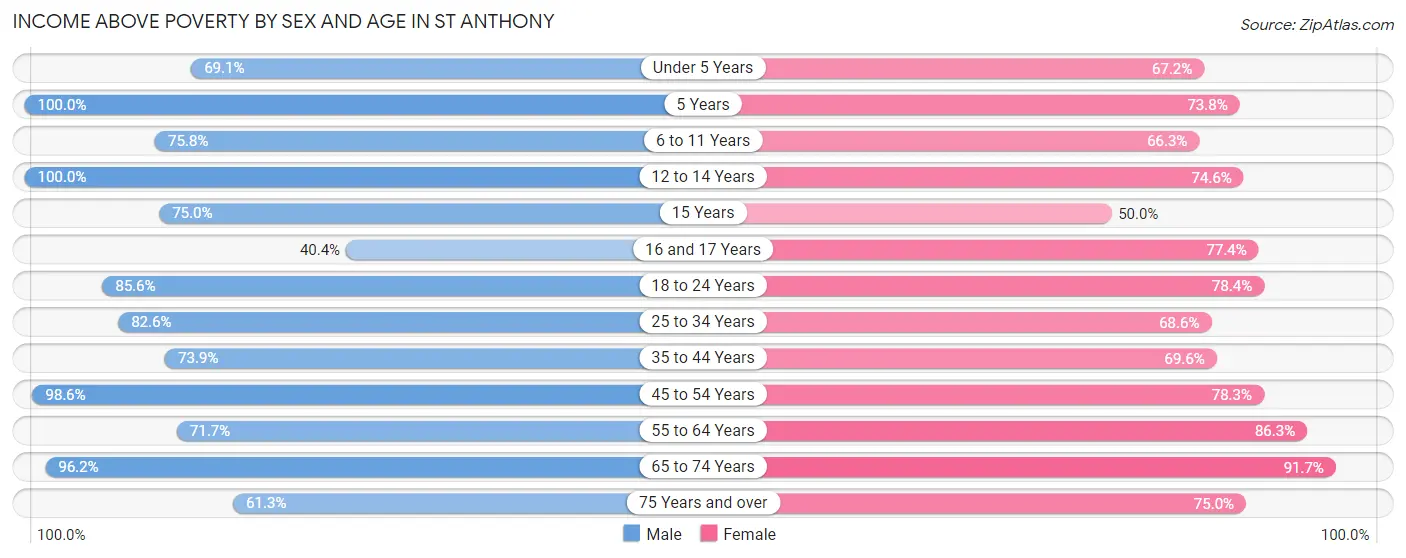
| Age Bracket | Male | Female |
| Under 5 Years | 96 (69.1%) | 78 (67.2%) |
| 5 Years | 2 (100.0%) | 31 (73.8%) |
| 6 to 11 Years | 97 (75.8%) | 132 (66.3%) |
| 12 to 14 Years | 23 (100.0%) | 44 (74.6%) |
| 15 Years | 18 (75.0%) | 11 (50.0%) |
| 16 and 17 Years | 23 (40.4%) | 41 (77.4%) |
| 18 to 24 Years | 83 (85.6%) | 163 (78.4%) |
| 25 to 34 Years | 271 (82.6%) | 216 (68.6%) |
| 35 to 44 Years | 102 (73.9%) | 96 (69.6%) |
| 45 to 54 Years | 204 (98.6%) | 177 (78.3%) |
| 55 to 64 Years | 137 (71.7%) | 158 (86.3%) |
| 65 to 74 Years | 100 (96.2%) | 143 (91.7%) |
| 75 Years and over | 76 (61.3%) | 105 (75.0%) |
| Total | 1,232 (78.9%) | 1,395 (75.1%) |
Income Below Poverty Among Married-Couple Families in St Anthony
The poverty statistics for married-couple families in St Anthony show that 19.6% or 116 of the total 593 families live below the poverty line. Families with 1 or 2 children have the highest poverty rate of 37.9%, comprising of 58 families. On the other hand, families with 5 or more children have the lowest poverty rate of 0.0%, which includes 0 families.
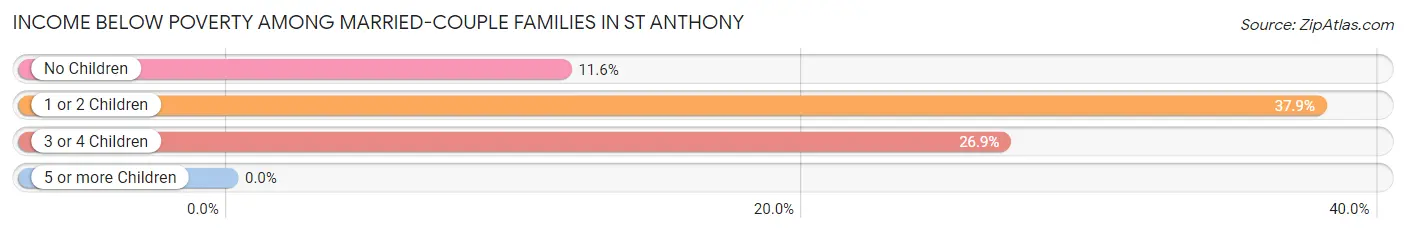
| Children | Above Poverty | Below Poverty |
| No Children | 335 (88.4%) | 44 (11.6%) |
| 1 or 2 Children | 95 (62.1%) | 58 (37.9%) |
| 3 or 4 Children | 38 (73.1%) | 14 (26.9%) |
| 5 or more Children | 9 (100.0%) | 0 (0.0%) |
| Total | 477 (80.4%) | 116 (19.6%) |
Income Below Poverty Among Single-Parent Households in St Anthony
According to the poverty data in St Anthony, 24.1% or 20 single-father households and 22.9% or 38 single-mother households are living below the poverty line. Among single-father households, those with 3 or 4 children have the highest poverty rate, with 9 households (100.0%) experiencing poverty. Likewise, among single-mother households, those with 5 or more children have the highest poverty rate, with 5 households (100.0%) falling below the poverty line.
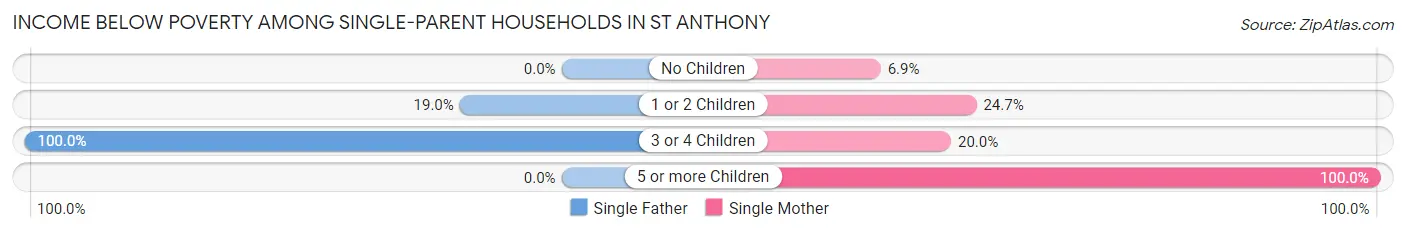
| Children | Single Father | Single Mother |
| No Children | 0 (0.0%) | 2 (6.9%) |
| 1 or 2 Children | 11 (19.0%) | 24 (24.7%) |
| 3 or 4 Children | 9 (100.0%) | 7 (20.0%) |
| 5 or more Children | 0 (0.0%) | 5 (100.0%) |
| Total | 20 (24.1%) | 38 (22.9%) |
Income Below Poverty Among Married-Couple vs Single-Parent Households in St Anthony
The poverty data for St Anthony shows that 116 of the married-couple family households (19.6%) and 58 of the single-parent households (23.3%) are living below the poverty level. Within the married-couple family households, those with 1 or 2 children have the highest poverty rate, with 58 households (37.9%) falling below the poverty line. Among the single-parent households, those with 5 or more children have the highest poverty rate, with 5 household (100.0%) living below poverty.
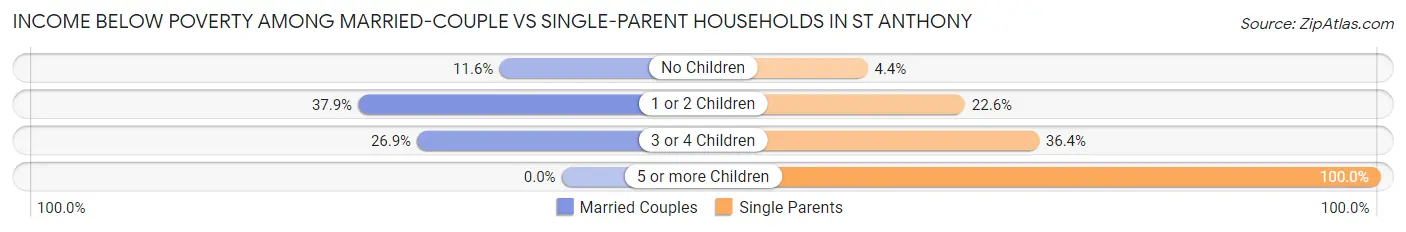
| Children | Married-Couple Families | Single-Parent Households |
| No Children | 44 (11.6%) | 2 (4.4%) |
| 1 or 2 Children | 58 (37.9%) | 35 (22.6%) |
| 3 or 4 Children | 14 (26.9%) | 16 (36.4%) |
| 5 or more Children | 0 (0.0%) | 5 (100.0%) |
| Total | 116 (19.6%) | 58 (23.3%) |
Race in St Anthony
The most populous races in St Anthony are White / Caucasian (2,946 | 79.0%), Hispanic or Latino (611 | 16.4%), and Some other Race (429 | 11.5%).
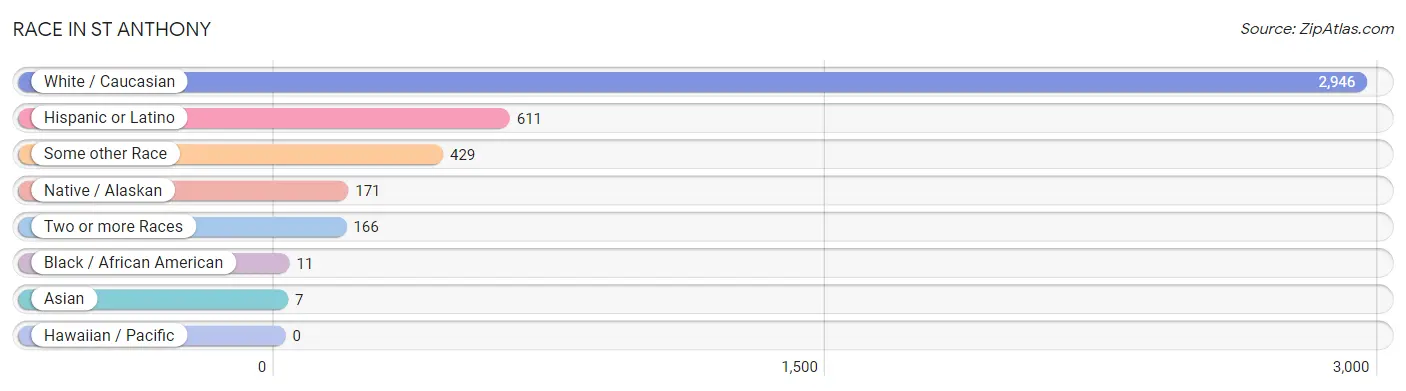
| Race | # Population | % Population |
| Asian | 7 | 0.2% |
| Black / African American | 11 | 0.3% |
| Hawaiian / Pacific | 0 | 0.0% |
| Hispanic or Latino | 611 | 16.4% |
| Native / Alaskan | 171 | 4.6% |
| White / Caucasian | 2,946 | 79.0% |
| Two or more Races | 166 | 4.4% |
| Some other Race | 429 | 11.5% |
| Total | 3,730 | 100.0% |
Ancestry in St Anthony
The most populous ancestries reported in St Anthony are English (968 | 26.0%), Mexican (542 | 14.5%), German (461 | 12.4%), Irish (236 | 6.3%), and Danish (211 | 5.7%), together accounting for 64.8% of all St Anthony residents.
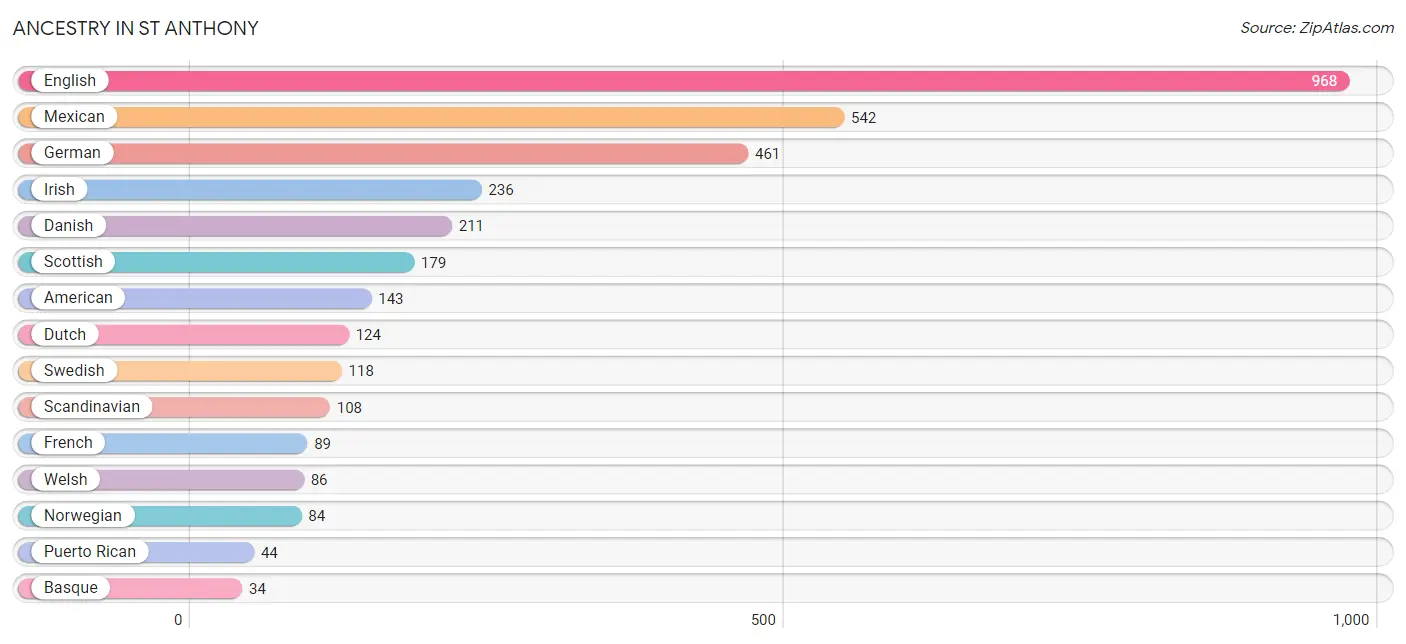
| Ancestry | # Population | % Population |
| American | 143 | 3.8% |
| Australian | 5 | 0.1% |
| Basque | 34 | 0.9% |
| Bhutanese | 7 | 0.2% |
| British | 13 | 0.4% |
| Canadian | 20 | 0.5% |
| Creek | 4 | 0.1% |
| Danish | 211 | 5.7% |
| Dutch | 124 | 3.3% |
| English | 968 | 26.0% |
| Ethiopian | 5 | 0.1% |
| European | 25 | 0.7% |
| French | 89 | 2.4% |
| German | 461 | 12.4% |
| Greek | 7 | 0.2% |
| Irish | 236 | 6.3% |
| Italian | 12 | 0.3% |
| Mexican | 542 | 14.5% |
| Mexican American Indian | 19 | 0.5% |
| Norwegian | 84 | 2.2% |
| Polish | 20 | 0.5% |
| Portuguese | 17 | 0.5% |
| Puerto Rican | 44 | 1.2% |
| Samoan | 11 | 0.3% |
| Scandinavian | 108 | 2.9% |
| Scotch-Irish | 14 | 0.4% |
| Scottish | 179 | 4.8% |
| Spaniard | 14 | 0.4% |
| Subsaharan African | 5 | 0.1% |
| Swedish | 118 | 3.2% |
| Swiss | 28 | 0.7% |
| Turkish | 24 | 0.6% |
| Ute | 27 | 0.7% |
| Welsh | 86 | 2.3% | View All 34 Rows |
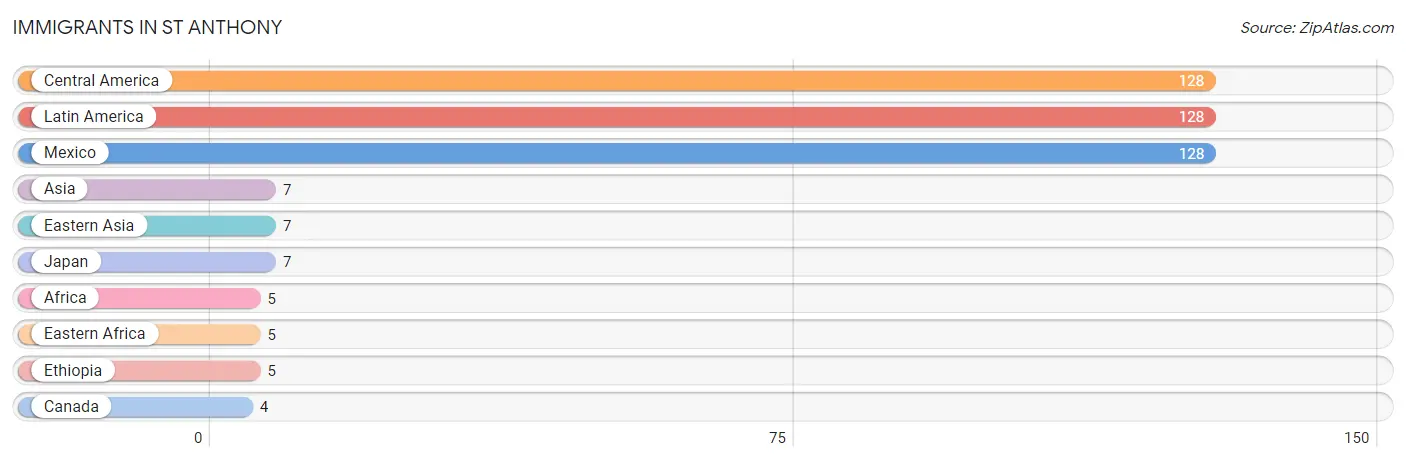
Immigrants in St Anthony
The most numerous immigrant groups reported in St Anthony came from Central America (128 | 3.4%), Latin America (128 | 3.4%), Mexico (128 | 3.4%), Asia (7 | 0.2%), and Eastern Asia (7 | 0.2%), together accounting for 10.7% of all St Anthony residents.
| Immigration Origin | # Population | % Population |
| Africa | 5 | 0.1% |
| Asia | 7 | 0.2% |
| Canada | 4 | 0.1% |
| Central America | 128 | 3.4% |
| Eastern Africa | 5 | 0.1% |
| Eastern Asia | 7 | 0.2% |
| Ethiopia | 5 | 0.1% |
| Japan | 7 | 0.2% |
| Latin America | 128 | 3.4% |
| Mexico | 128 | 3.4% | View All 10 Rows |
Sex and Age in St Anthony
Sex and Age in St Anthony
The most populous age groups in St Anthony are 25 to 29 Years (273 | 14.6%) for men and 25 to 29 Years (187 | 10.0%) for women.
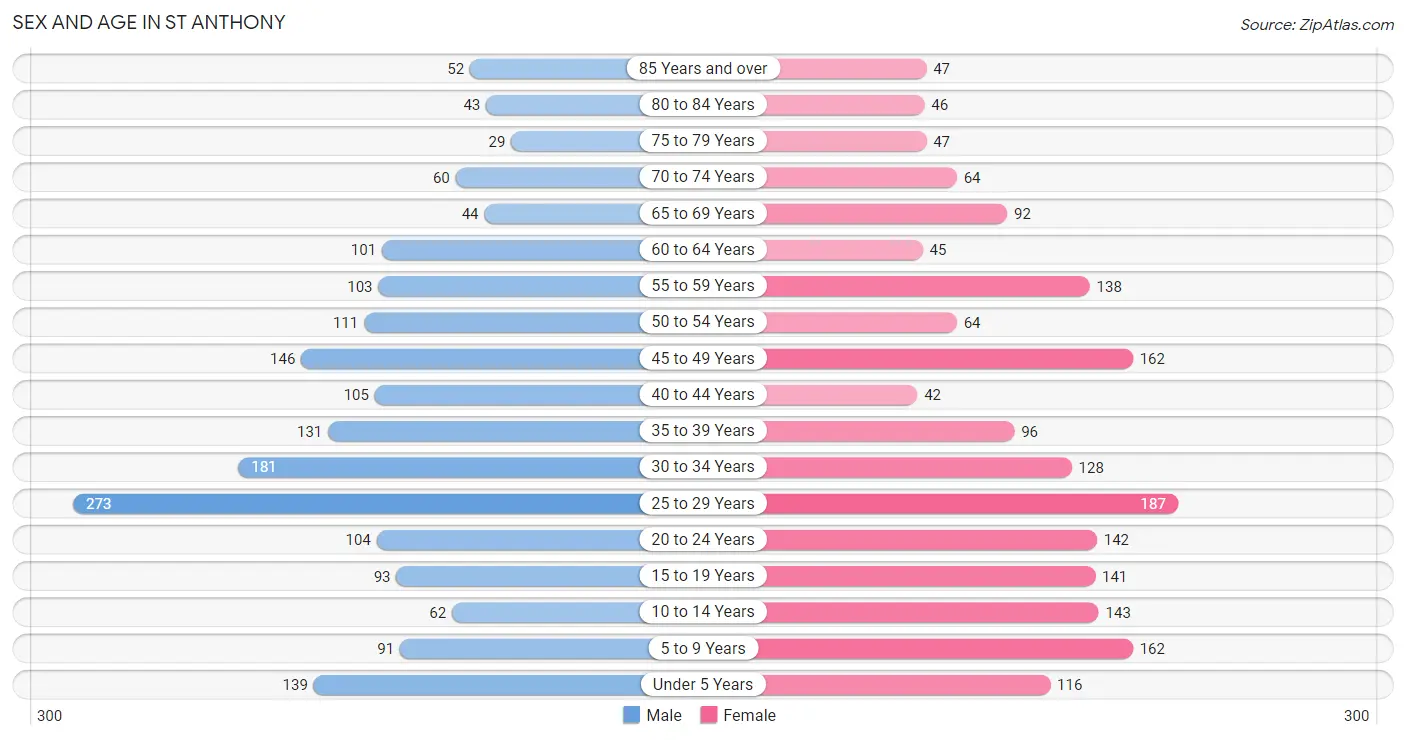
| Age Bracket | Male | Female |
| Under 5 Years | 139 (7.4%) | 116 (6.2%) |
| 5 to 9 Years | 91 (4.9%) | 162 (8.7%) |
| 10 to 14 Years | 62 (3.3%) | 143 (7.7%) |
| 15 to 19 Years | 93 (5.0%) | 141 (7.6%) |
| 20 to 24 Years | 104 (5.6%) | 142 (7.6%) |
| 25 to 29 Years | 273 (14.6%) | 187 (10.0%) |
| 30 to 34 Years | 181 (9.7%) | 128 (6.9%) |
| 35 to 39 Years | 131 (7.0%) | 96 (5.2%) |
| 40 to 44 Years | 105 (5.6%) | 42 (2.3%) |
| 45 to 49 Years | 146 (7.8%) | 162 (8.7%) |
| 50 to 54 Years | 111 (5.9%) | 64 (3.4%) |
| 55 to 59 Years | 103 (5.5%) | 138 (7.4%) |
| 60 to 64 Years | 101 (5.4%) | 45 (2.4%) |
| 65 to 69 Years | 44 (2.4%) | 92 (4.9%) |
| 70 to 74 Years | 60 (3.2%) | 64 (3.4%) |
| 75 to 79 Years | 29 (1.5%) | 47 (2.5%) |
| 80 to 84 Years | 43 (2.3%) | 46 (2.5%) |
| 85 Years and over | 52 (2.8%) | 47 (2.5%) |
| Total | 1,868 (100.0%) | 1,862 (100.0%) |
Families and Households in St Anthony
Median Family Size in St Anthony
The median family size in St Anthony is 3.48 persons per family, with single female/mother families (166 | 19.7%) accounting for the largest median family size of 4.16 persons per family. On the other hand, married-couple families (593 | 70.4%) represent the smallest median family size with 3.22 persons per family.
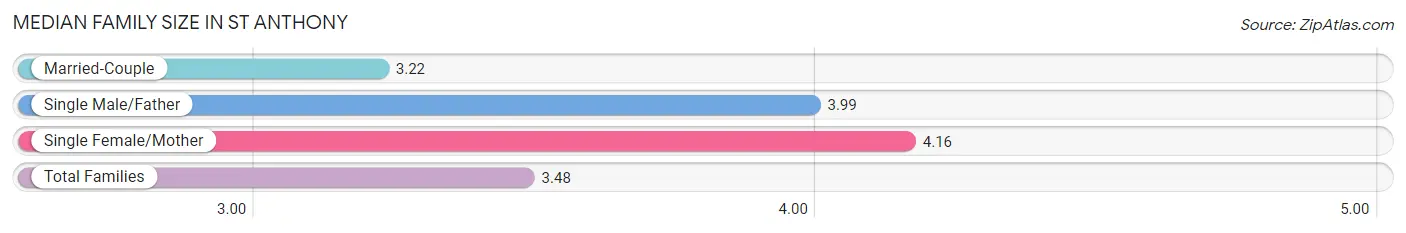
| Family Type | # Families | Family Size |
| Married-Couple | 593 (70.4%) | 3.22 |
| Single Male/Father | 83 (9.9%) | 3.99 |
| Single Female/Mother | 166 (19.7%) | 4.16 |
| Total Families | 842 (100.0%) | 3.48 |
Median Household Size in St Anthony
The median household size in St Anthony is 3.00 persons per household, with single male/father households (83 | 7.3%) accounting for the largest median household size of 4.59 persons per household. non-family households (299 | 26.2%) represent the smallest median household size with 1.26 persons per household.
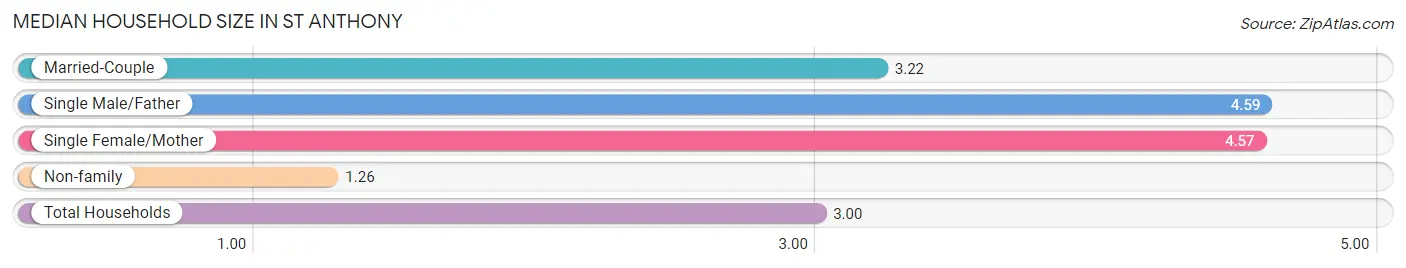
| Household Type | # Households | Household Size |
| Married-Couple | 593 (52.0%) | 3.22 |
| Single Male/Father | 83 (7.3%) | 4.59 |
| Single Female/Mother | 166 (14.5%) | 4.57 |
| Non-family | 299 (26.2%) | 1.26 |
| Total Households | 1,141 (100.0%) | 3.00 |
Household Size by Marriage Status in St Anthony
Out of a total of 1,141 households in St Anthony, 842 (73.8%) are family households, while 299 (26.2%) are nonfamily households. The most numerous type of family households are 2-person households, comprising 350, and the most common type of nonfamily households are 1-person households, comprising 235.
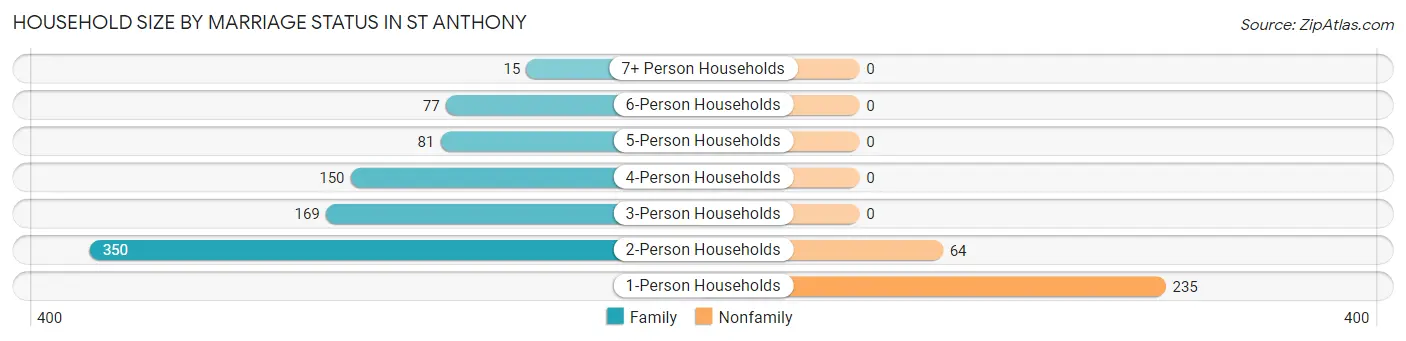
| Household Size | Family Households | Nonfamily Households |
| 1-Person Households | - | 235 (20.6%) |
| 2-Person Households | 350 (30.7%) | 64 (5.6%) |
| 3-Person Households | 169 (14.8%) | 0 (0.0%) |
| 4-Person Households | 150 (13.2%) | 0 (0.0%) |
| 5-Person Households | 81 (7.1%) | 0 (0.0%) |
| 6-Person Households | 77 (6.8%) | 0 (0.0%) |
| 7+ Person Households | 15 (1.3%) | 0 (0.0%) |
| Total | 842 (73.8%) | 299 (26.2%) |
Female Fertility in St Anthony
Fertility by Age in St Anthony
Average fertility rate in St Anthony is 37.0 births per 1,000 women. Women in the age bracket of 20 to 34 years have the highest fertility rate with 77.0 births per 1,000 women. Women in the age bracket of 20 to 34 years acount for 100.0% of all women with births.
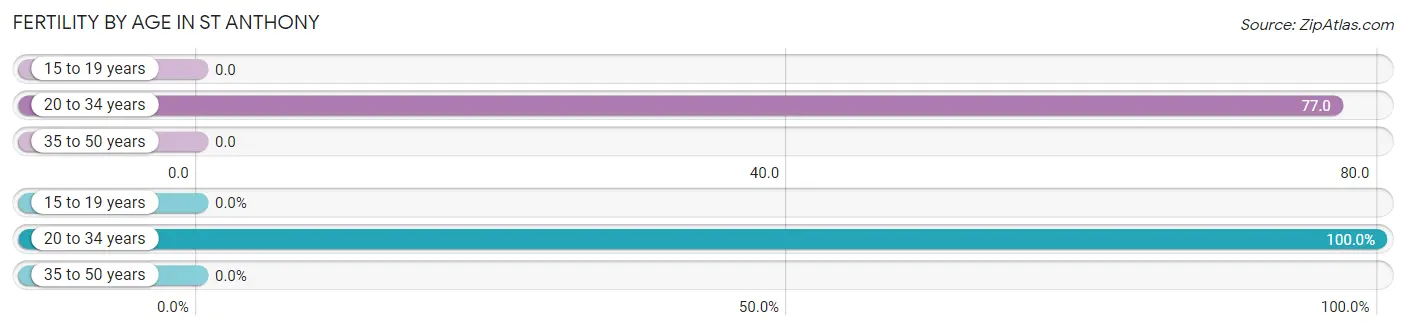
| Age Bracket | Women with Births | Births / 1,000 Women |
| 15 to 19 years | 0 (0.0%) | 0.0 |
| 20 to 34 years | 35 (100.0%) | 77.0 |
| 35 to 50 years | 0 (0.0%) | 0.0 |
| Total | 35 (100.0%) | 37.0 |
Fertility by Age by Marriage Status in St Anthony
88.6% of women with births (35) in St Anthony are married. The highest percentage of unmarried women with births falls into 20 to 34 years age bracket with 11.4% of them unmarried at the time of birth, while the lowest percentage of unmarried women with births belong to 20 to 34 years age bracket with 11.4% of them unmarried.
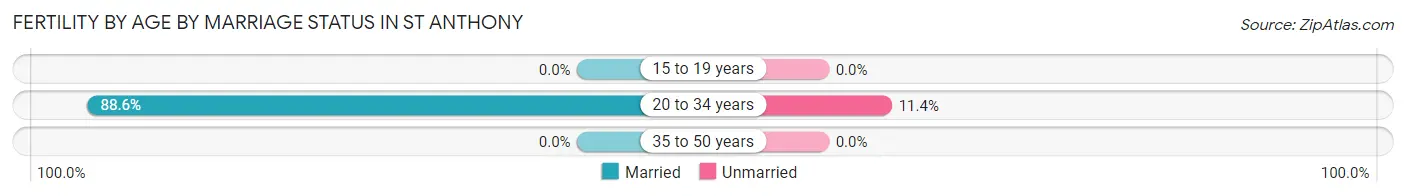
| Age Bracket | Married | Unmarried |
| 15 to 19 years | 0 (0.0%) | 0 (0.0%) |
| 20 to 34 years | 31 (88.6%) | 4 (11.4%) |
| 35 to 50 years | 0 (0.0%) | 0 (0.0%) |
| Total | 31 (88.6%) | 4 (11.4%) |
Fertility by Education in St Anthony
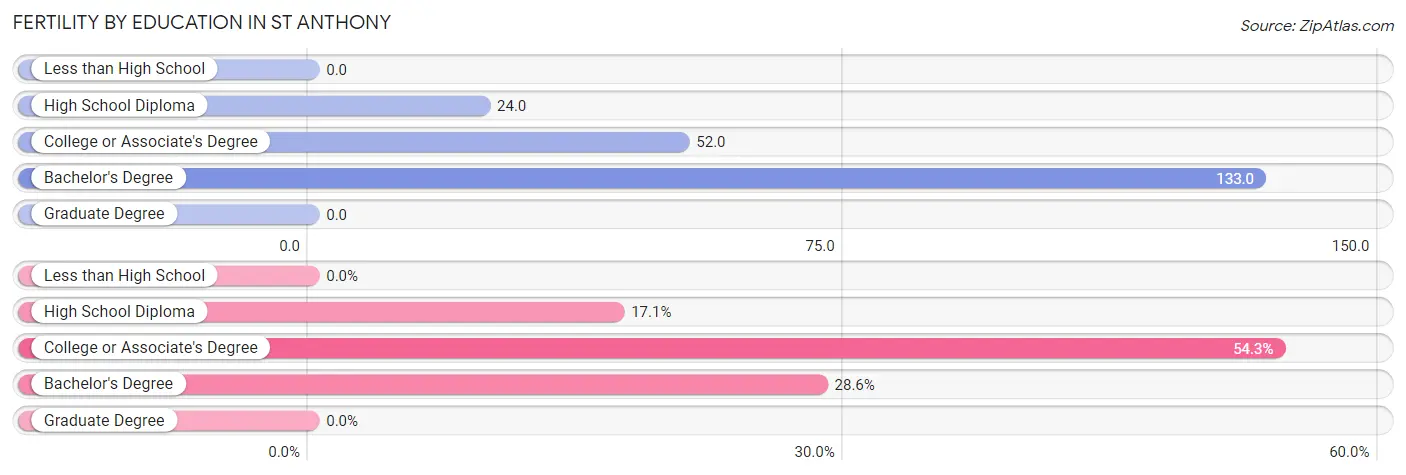
| Educational Attainment | Women with Births | Births / 1,000 Women |
| Less than High School | 0 (0.0%) | 0.0 |
| High School Diploma | 6 (17.1%) | 24.0 |
| College or Associate's Degree | 19 (54.3%) | 52.0 |
| Bachelor's Degree | 10 (28.6%) | 133.0 |
| Graduate Degree | 0 (0.0%) | 0.0 |
| Total | 35 (100.0%) | 37.0 |
Fertility by Education by Marriage Status in St Anthony
11.4% of women with births in St Anthony are unmarried. Women with the educational attainment of high school diploma are most likely to be married with 100.0% of them married at childbirth, while women with the educational attainment of college or associate's degree are least likely to be married with 21.0% of them unmarried at childbirth.
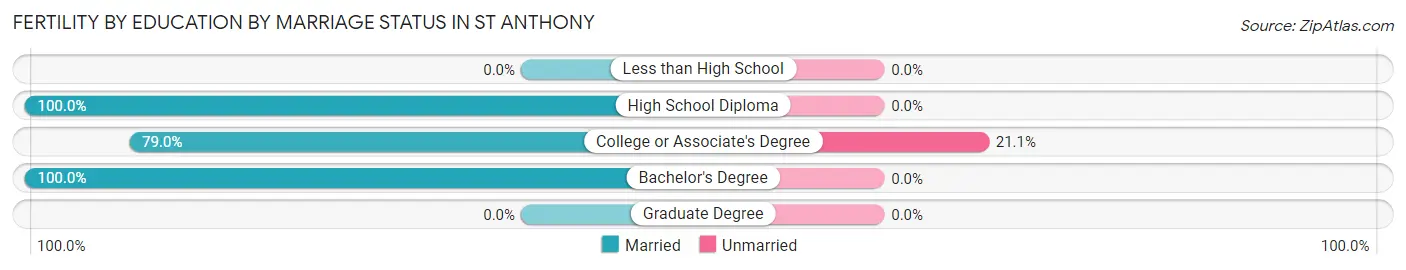
| Educational Attainment | Married | Unmarried |
| Less than High School | 0 (0.0%) | 0 (0.0%) |
| High School Diploma | 6 (100.0%) | 0 (0.0%) |
| College or Associate's Degree | 15 (78.9%) | 4 (21.0%) |
| Bachelor's Degree | 10 (100.0%) | 0 (0.0%) |
| Graduate Degree | 0 (0.0%) | 0 (0.0%) |
| Total | 31 (88.6%) | 4 (11.4%) |
Employment Characteristics in St Anthony
Employment by Class of Employer in St Anthony
Among the 1,316 employed individuals in St Anthony, private company employees (879 | 66.8%), state government employees (121 | 9.2%), and self-employed (not incorporated) (113 | 8.6%) make up the most common classes of employment.
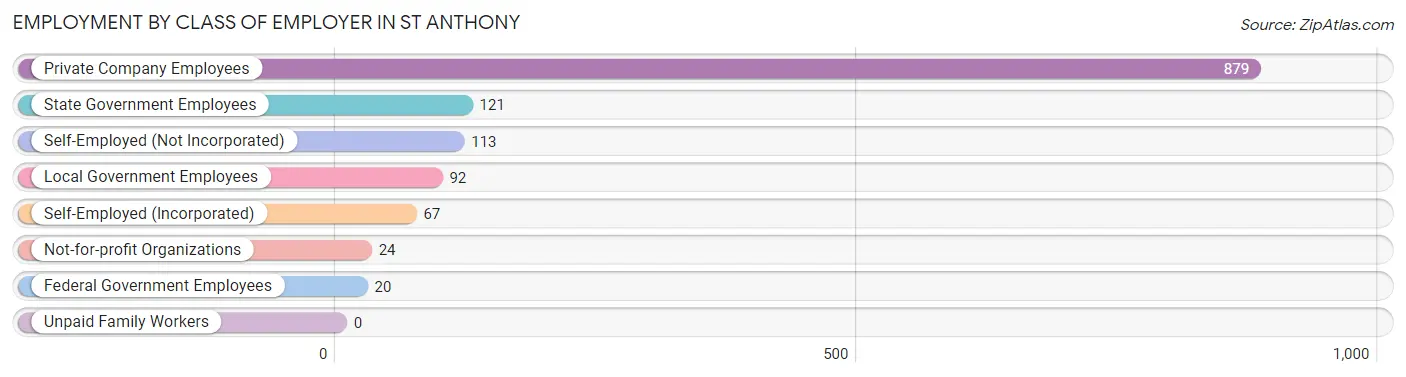
| Employer Class | # Employees | % Employees |
| Private Company Employees | 879 | 66.8% |
| Self-Employed (Incorporated) | 67 | 5.1% |
| Self-Employed (Not Incorporated) | 113 | 8.6% |
| Not-for-profit Organizations | 24 | 1.8% |
| Local Government Employees | 92 | 7.0% |
| State Government Employees | 121 | 9.2% |
| Federal Government Employees | 20 | 1.5% |
| Unpaid Family Workers | 0 | 0.0% |
| Total | 1,316 | 100.0% |
Employment Status by Age in St Anthony
According to the labor force statistics for St Anthony, out of the total population over 16 years of age (2,971), 48.8% or 1,450 individuals are in the labor force, with 8.1% or 117 of them unemployed. The age group with the highest labor force participation rate is 20 to 24 years, with 72.8% or 179 individuals in the labor force. Within the labor force, the 16 to 19 years age range has the highest percentage of unemployed individuals, with 36.4% or 20 of them being unemployed.
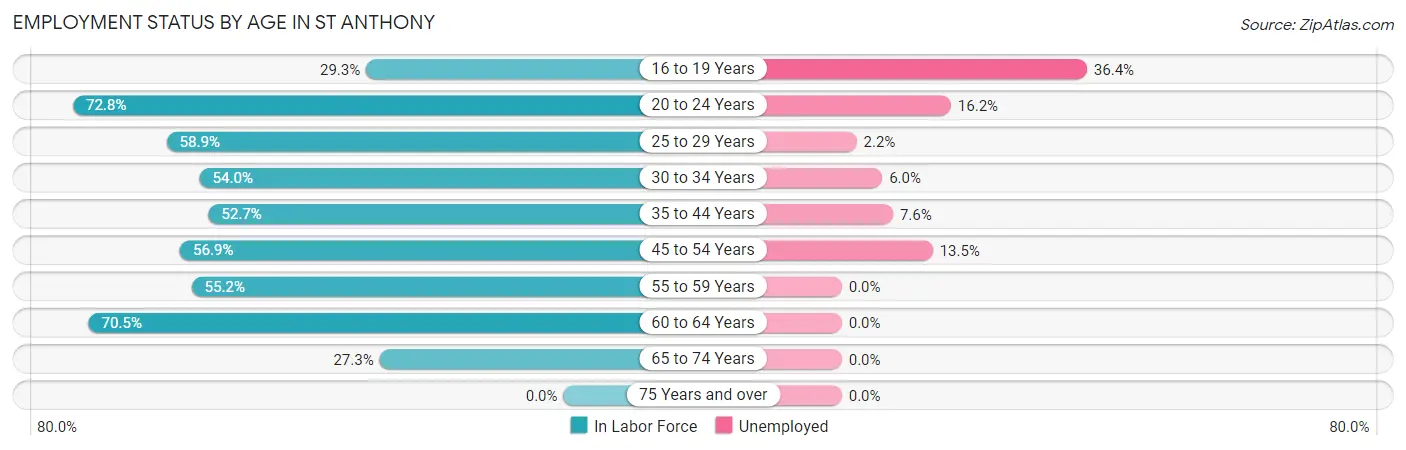
| Age Bracket | In Labor Force | Unemployed |
| 16 to 19 Years | 55 (29.3%) | 20 (36.4%) |
| 20 to 24 Years | 179 (72.8%) | 29 (16.2%) |
| 25 to 29 Years | 271 (58.9%) | 6 (2.2%) |
| 30 to 34 Years | 167 (54.0%) | 10 (6.0%) |
| 35 to 44 Years | 197 (52.7%) | 15 (7.6%) |
| 45 to 54 Years | 275 (56.9%) | 37 (13.5%) |
| 55 to 59 Years | 133 (55.2%) | 0 (0.0%) |
| 60 to 64 Years | 103 (70.5%) | 0 (0.0%) |
| 65 to 74 Years | 71 (27.3%) | 0 (0.0%) |
| 75 Years and over | 0 (0.0%) | 0 (0.0%) |
| Total | 1,450 (48.8%) | 117 (8.1%) |
Employment Status by Educational Attainment in St Anthony
According to labor force statistics for St Anthony, 56.9% of individuals (1,145) out of the total population between 25 and 64 years of age (2,013) are in the labor force, with 5.9% or 68 of them being unemployed. The group with the highest labor force participation rate are those with the educational attainment of bachelor's degree or higher, with 89.2% or 165 individuals in the labor force. Within the labor force, individuals with less than high school education have the highest percentage of unemployment, with 28.7% or 37 of them being unemployed.
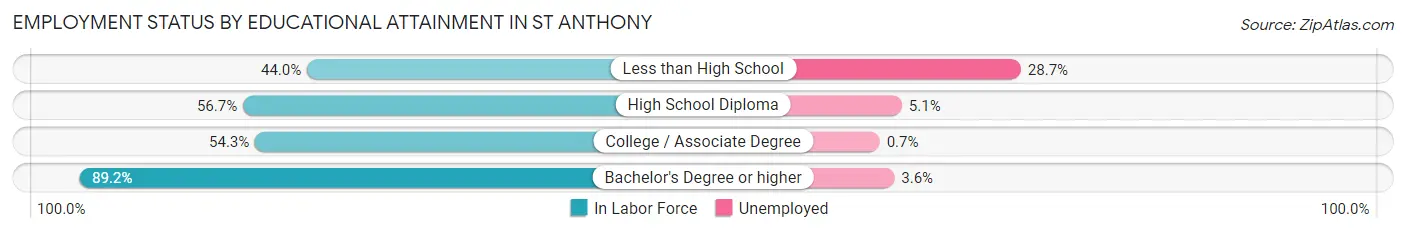
| Educational Attainment | In Labor Force | Unemployed |
| Less than High School | 129 (44.0%) | 84 (28.7%) |
| High School Diploma | 434 (56.7%) | 39 (5.1%) |
| College / Associate Degree | 418 (54.3%) | 5 (0.7%) |
| Bachelor's Degree or higher | 165 (89.2%) | 7 (3.6%) |
| Total | 1,145 (56.9%) | 119 (5.9%) |
Employment Occupations by Sex in St Anthony
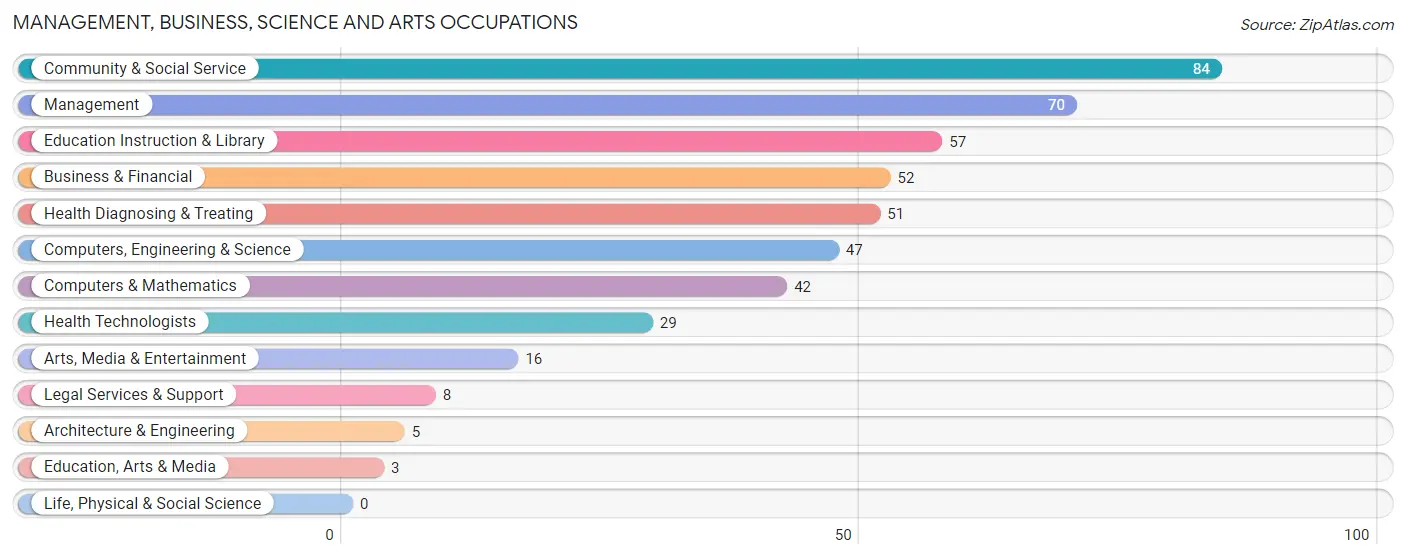
Management, Business, Science and Arts Occupations
The most common Management, Business, Science and Arts occupations in St Anthony are Community & Social Service (84 | 6.3%), Management (70 | 5.2%), Education Instruction & Library (57 | 4.3%), Business & Financial (52 | 3.9%), and Health Diagnosing & Treating (51 | 3.8%).
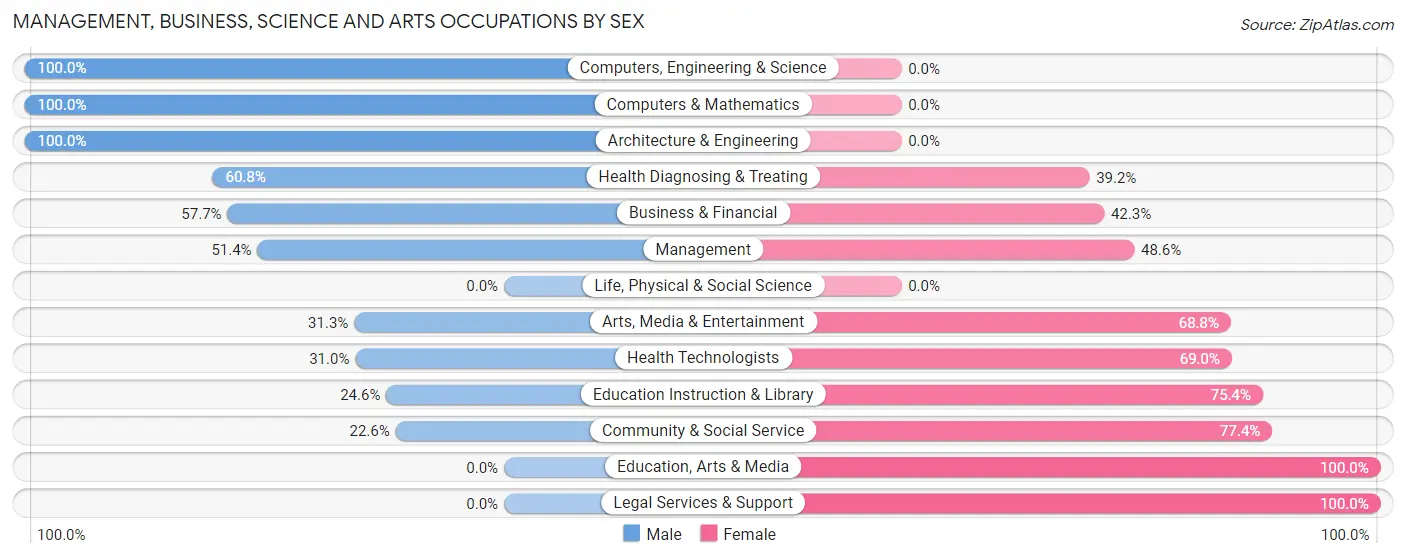
Management, Business, Science and Arts Occupations by Sex
Within the Management, Business, Science and Arts occupations in St Anthony, the most male-oriented occupations are Computers, Engineering & Science (100.0%), Computers & Mathematics (100.0%), and Architecture & Engineering (100.0%), while the most female-oriented occupations are Education, Arts & Media (100.0%), Legal Services & Support (100.0%), and Community & Social Service (77.4%).
| Occupation | Male | Female |
| Management | 36 (51.4%) | 34 (48.6%) |
| Business & Financial | 30 (57.7%) | 22 (42.3%) |
| Computers, Engineering & Science | 47 (100.0%) | 0 (0.0%) |
| Computers & Mathematics | 42 (100.0%) | 0 (0.0%) |
| Architecture & Engineering | 5 (100.0%) | 0 (0.0%) |
| Life, Physical & Social Science | 0 (0.0%) | 0 (0.0%) |
| Community & Social Service | 19 (22.6%) | 65 (77.4%) |
| Education, Arts & Media | 0 (0.0%) | 3 (100.0%) |
| Legal Services & Support | 0 (0.0%) | 8 (100.0%) |
| Education Instruction & Library | 14 (24.6%) | 43 (75.4%) |
| Arts, Media & Entertainment | 5 (31.2%) | 11 (68.8%) |
| Health Diagnosing & Treating | 31 (60.8%) | 20 (39.2%) |
| Health Technologists | 9 (31.0%) | 20 (69.0%) |
| Total (Category) | 163 (53.6%) | 141 (46.4%) |
| Total (Overall) | 730 (54.7%) | 604 (45.3%) |
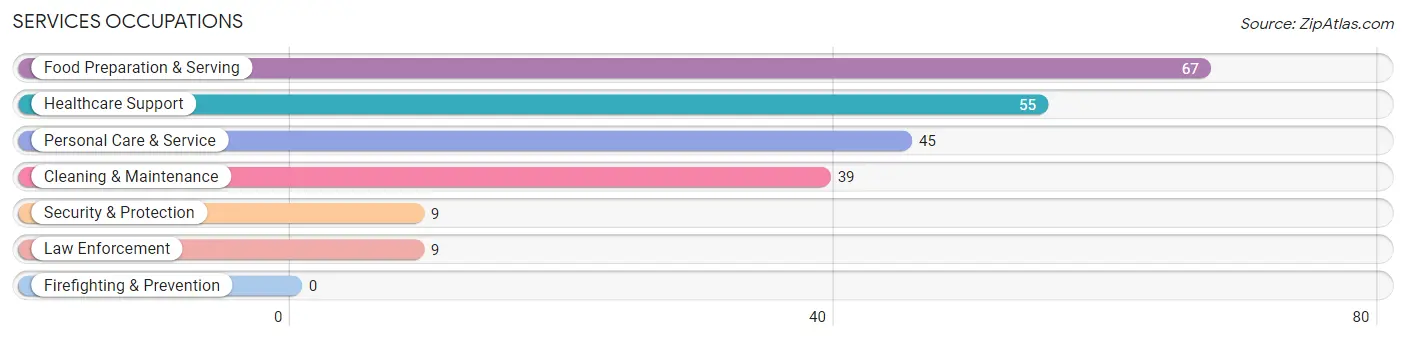
Services Occupations
The most common Services occupations in St Anthony are Food Preparation & Serving (67 | 5.0%), Healthcare Support (55 | 4.1%), Personal Care & Service (45 | 3.4%), Cleaning & Maintenance (39 | 2.9%), and Security & Protection (9 | 0.7%).
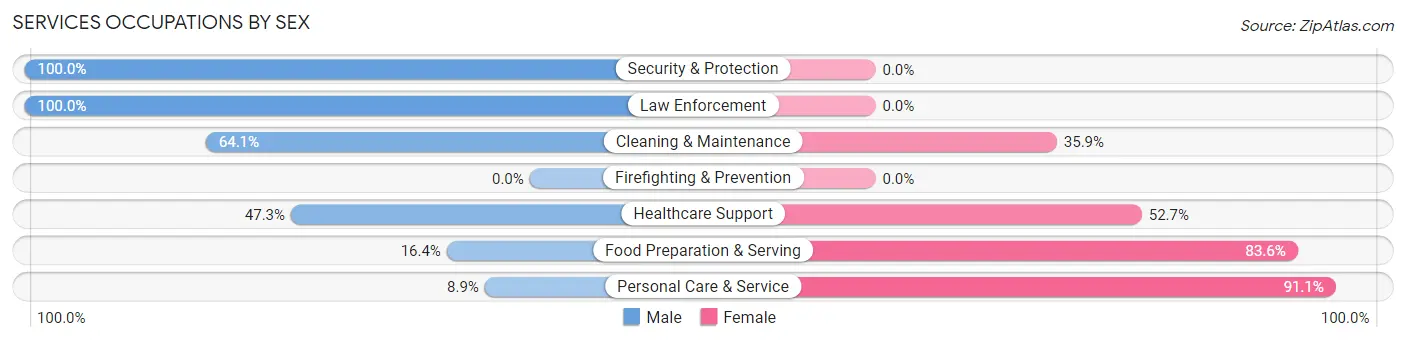
Services Occupations by Sex
Within the Services occupations in St Anthony, the most male-oriented occupations are Security & Protection (100.0%), Law Enforcement (100.0%), and Cleaning & Maintenance (64.1%), while the most female-oriented occupations are Personal Care & Service (91.1%), Food Preparation & Serving (83.6%), and Healthcare Support (52.7%).
| Occupation | Male | Female |
| Healthcare Support | 26 (47.3%) | 29 (52.7%) |
| Security & Protection | 9 (100.0%) | 0 (0.0%) |
| Firefighting & Prevention | 0 (0.0%) | 0 (0.0%) |
| Law Enforcement | 9 (100.0%) | 0 (0.0%) |
| Food Preparation & Serving | 11 (16.4%) | 56 (83.6%) |
| Cleaning & Maintenance | 25 (64.1%) | 14 (35.9%) |
| Personal Care & Service | 4 (8.9%) | 41 (91.1%) |
| Total (Category) | 75 (34.9%) | 140 (65.1%) |
| Total (Overall) | 730 (54.7%) | 604 (45.3%) |
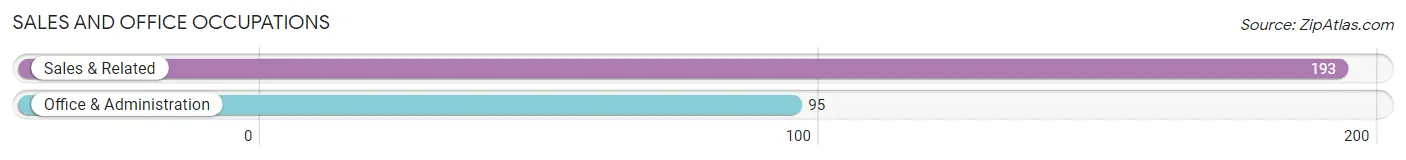
Sales and Office Occupations
The most common Sales and Office occupations in St Anthony are Sales & Related (193 | 14.5%), and Office & Administration (95 | 7.1%).
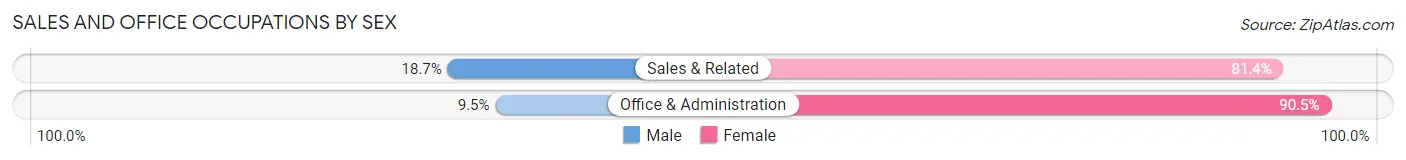
Sales and Office Occupations by Sex
| Occupation | Male | Female |
| Sales & Related | 36 (18.6%) | 157 (81.4%) |
| Office & Administration | 9 (9.5%) | 86 (90.5%) |
| Total (Category) | 45 (15.6%) | 243 (84.4%) |
| Total (Overall) | 730 (54.7%) | 604 (45.3%) |
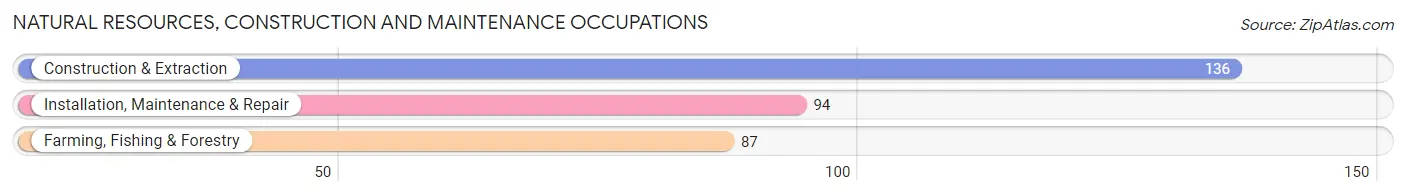
Natural Resources, Construction and Maintenance Occupations
The most common Natural Resources, Construction and Maintenance occupations in St Anthony are Construction & Extraction (136 | 10.2%), Installation, Maintenance & Repair (94 | 7.0%), and Farming, Fishing & Forestry (87 | 6.5%).
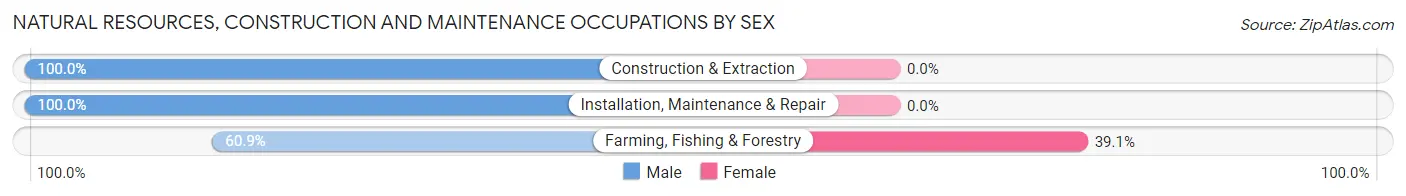
Natural Resources, Construction and Maintenance Occupations by Sex
| Occupation | Male | Female |
| Farming, Fishing & Forestry | 53 (60.9%) | 34 (39.1%) |
| Construction & Extraction | 136 (100.0%) | 0 (0.0%) |
| Installation, Maintenance & Repair | 94 (100.0%) | 0 (0.0%) |
| Total (Category) | 283 (89.3%) | 34 (10.7%) |
| Total (Overall) | 730 (54.7%) | 604 (45.3%) |
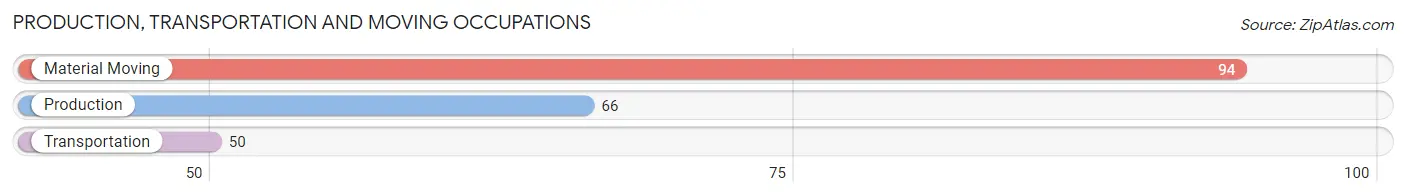
Production, Transportation and Moving Occupations
The most common Production, Transportation and Moving occupations in St Anthony are Material Moving (94 | 7.0%), Production (66 | 5.0%), and Transportation (50 | 3.7%).
Production, Transportation and Moving Occupations by Sex
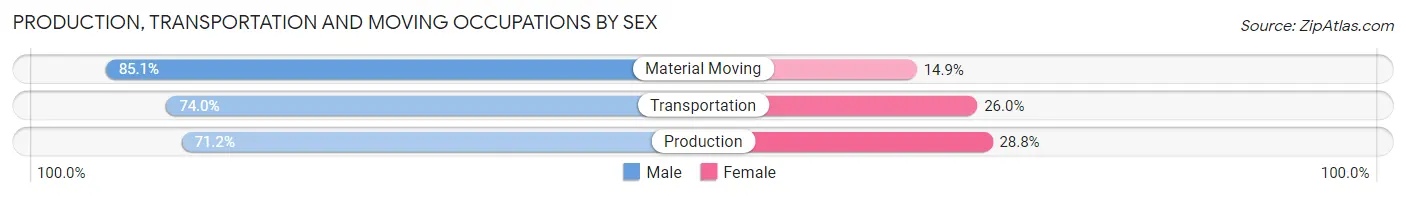
| Occupation | Male | Female |
| Production | 47 (71.2%) | 19 (28.8%) |
| Transportation | 37 (74.0%) | 13 (26.0%) |
| Material Moving | 80 (85.1%) | 14 (14.9%) |
| Total (Category) | 164 (78.1%) | 46 (21.9%) |
| Total (Overall) | 730 (54.7%) | 604 (45.3%) |
Employment Industries by Sex in St Anthony
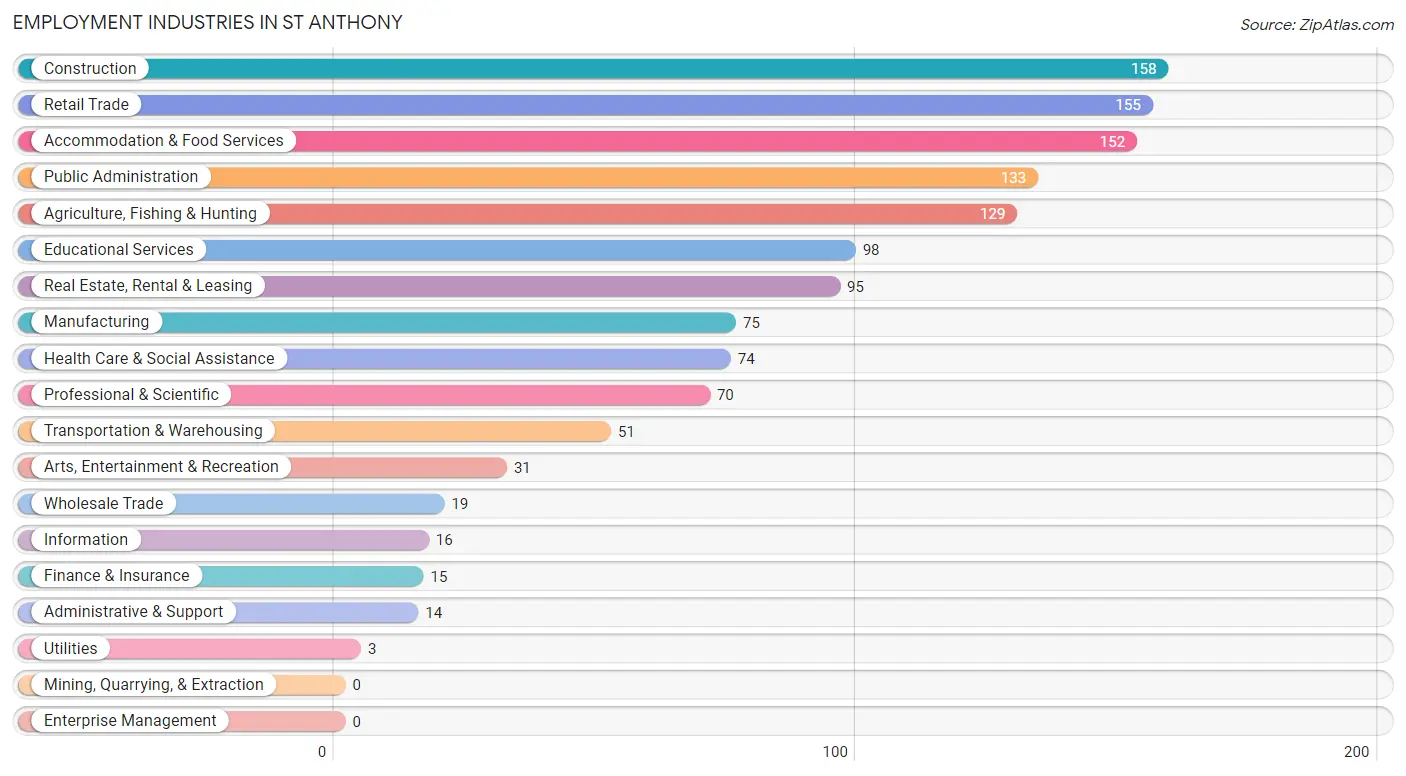
Employment Industries in St Anthony
The major employment industries in St Anthony include Construction (158 | 11.8%), Retail Trade (155 | 11.6%), Accommodation & Food Services (152 | 11.4%), Public Administration (133 | 10.0%), and Agriculture, Fishing & Hunting (129 | 9.7%).
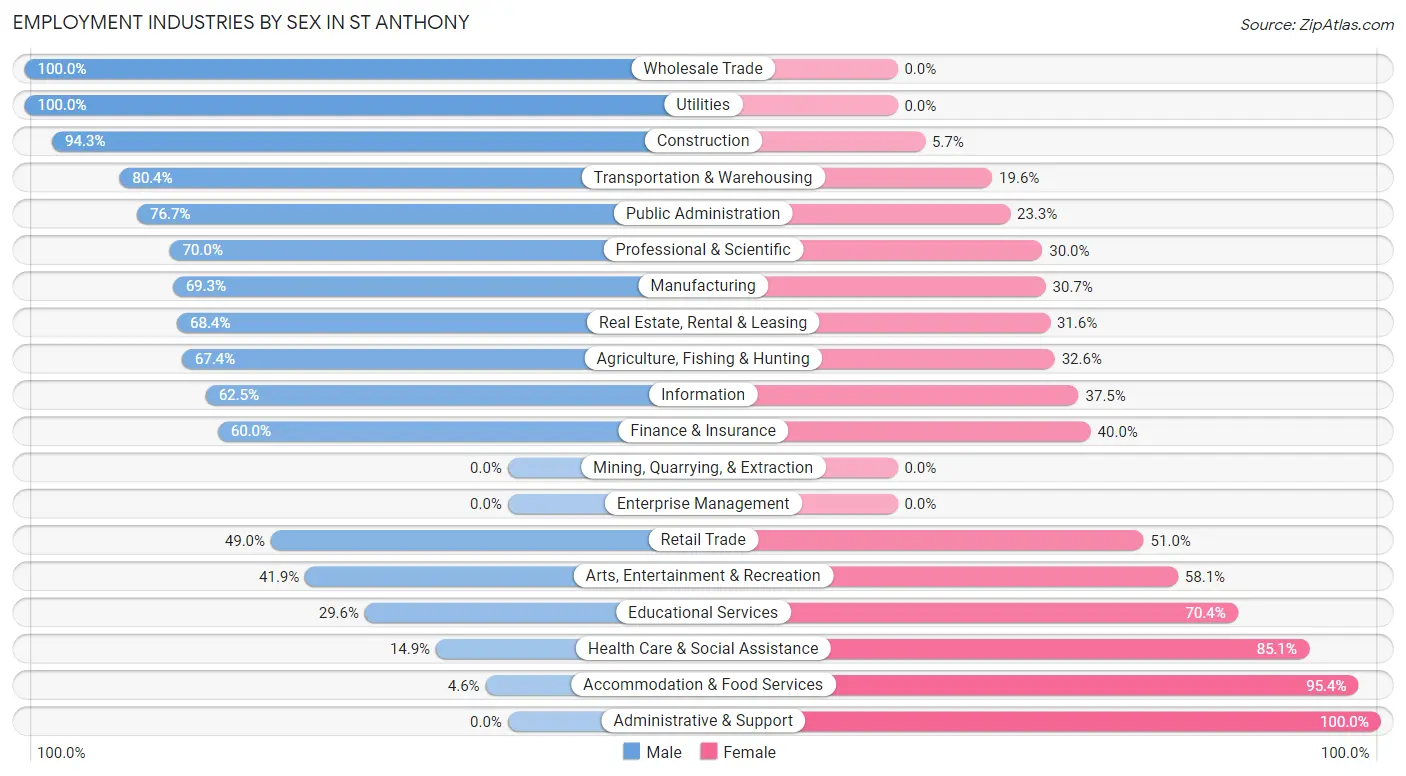
Employment Industries by Sex in St Anthony
The St Anthony industries that see more men than women are Wholesale Trade (100.0%), Utilities (100.0%), and Construction (94.3%), whereas the industries that tend to have a higher number of women are Administrative & Support (100.0%), Accommodation & Food Services (95.4%), and Health Care & Social Assistance (85.1%).
| Industry | Male | Female |
| Agriculture, Fishing & Hunting | 87 (67.4%) | 42 (32.6%) |
| Mining, Quarrying, & Extraction | 0 (0.0%) | 0 (0.0%) |
| Construction | 149 (94.3%) | 9 (5.7%) |
| Manufacturing | 52 (69.3%) | 23 (30.7%) |
| Wholesale Trade | 19 (100.0%) | 0 (0.0%) |
| Retail Trade | 76 (49.0%) | 79 (51.0%) |
| Transportation & Warehousing | 41 (80.4%) | 10 (19.6%) |
| Utilities | 3 (100.0%) | 0 (0.0%) |
| Information | 10 (62.5%) | 6 (37.5%) |
| Finance & Insurance | 9 (60.0%) | 6 (40.0%) |
| Real Estate, Rental & Leasing | 65 (68.4%) | 30 (31.6%) |
| Professional & Scientific | 49 (70.0%) | 21 (30.0%) |
| Enterprise Management | 0 (0.0%) | 0 (0.0%) |
| Administrative & Support | 0 (0.0%) | 14 (100.0%) |
| Educational Services | 29 (29.6%) | 69 (70.4%) |
| Health Care & Social Assistance | 11 (14.9%) | 63 (85.1%) |
| Arts, Entertainment & Recreation | 13 (41.9%) | 18 (58.1%) |
| Accommodation & Food Services | 7 (4.6%) | 145 (95.4%) |
| Public Administration | 102 (76.7%) | 31 (23.3%) |
| Total | 730 (54.7%) | 604 (45.3%) |
Education in St Anthony
School Enrollment in St Anthony
The most common levels of schooling among the 878 students in St Anthony are college / undergraduate (228 | 26.0%), elementary school (201 | 22.9%), and middle school (186 | 21.2%).
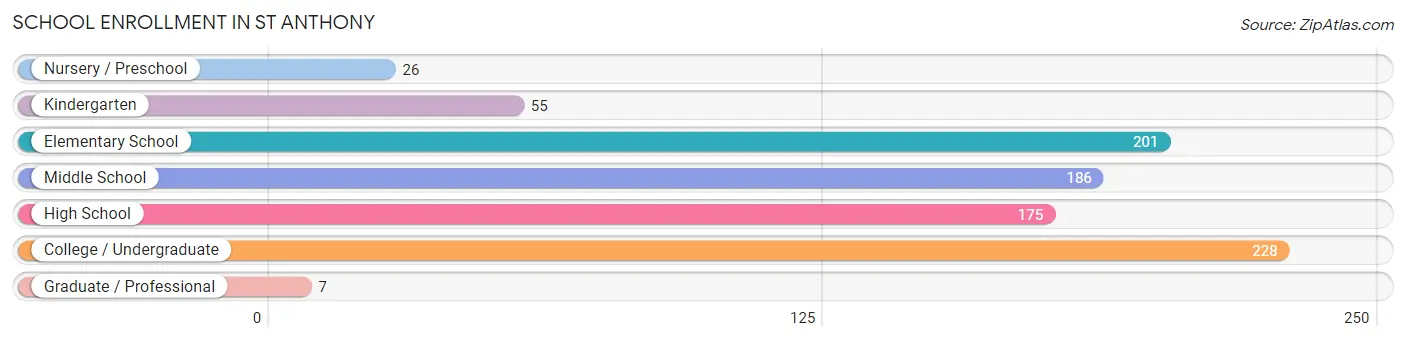
| School Level | # Students | % Students |
| Nursery / Preschool | 26 | 3.0% |
| Kindergarten | 55 | 6.3% |
| Elementary School | 201 | 22.9% |
| Middle School | 186 | 21.2% |
| High School | 175 | 19.9% |
| College / Undergraduate | 228 | 26.0% |
| Graduate / Professional | 7 | 0.8% |
| Total | 878 | 100.0% |
School Enrollment by Age by Funding Source in St Anthony
Out of a total of 878 students who are enrolled in schools in St Anthony, 134 (15.3%) attend a private institution, while the remaining 744 (84.7%) are enrolled in public schools. The age group of 20 to 24 year olds has the highest likelihood of being enrolled in private schools, with 29 (65.9% in the age bracket) enrolled. Conversely, the age group of 10 to 14 year olds has the lowest likelihood of being enrolled in a private school, with 205 (100.0% in the age bracket) attending a public institution.
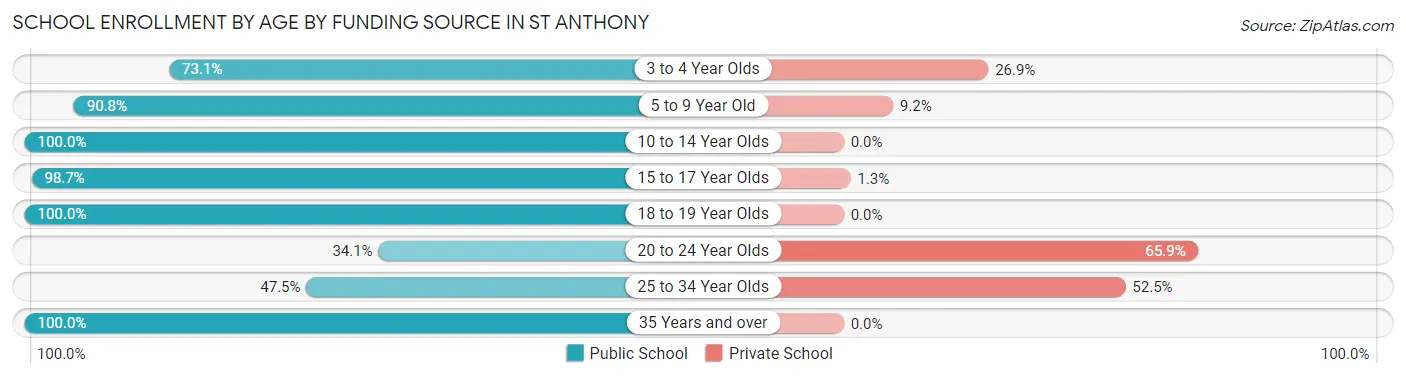
| Age Bracket | Public School | Private School |
| 3 to 4 Year Olds | 19 (73.1%) | 7 (26.9%) |
| 5 to 9 Year Old | 218 (90.8%) | 22 (9.2%) |
| 10 to 14 Year Olds | 205 (100.0%) | 0 (0.0%) |
| 15 to 17 Year Olds | 154 (98.7%) | 2 (1.3%) |
| 18 to 19 Year Olds | 47 (100.0%) | 0 (0.0%) |
| 20 to 24 Year Olds | 15 (34.1%) | 29 (65.9%) |
| 25 to 34 Year Olds | 67 (47.5%) | 74 (52.5%) |
| 35 Years and over | 19 (100.0%) | 0 (0.0%) |
| Total | 744 (84.7%) | 134 (15.3%) |
Educational Attainment by Field of Study in St Anthony
Education (88 | 30.1%), computers & mathematics (52 | 17.8%), arts & humanities (31 | 10.6%), social sciences (24 | 8.2%), and bio, nature & agricultural (21 | 7.2%) are the most common fields of study among 292 individuals in St Anthony who have obtained a bachelor's degree or higher.
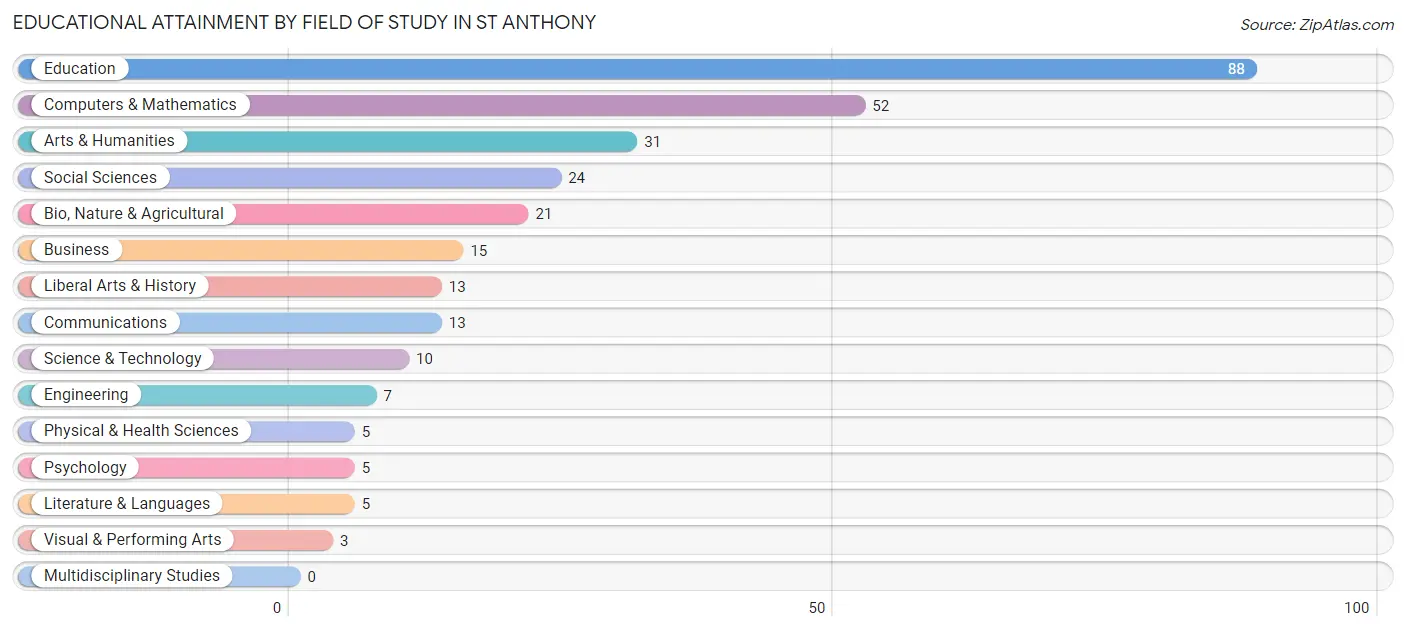
| Field of Study | # Graduates | % Graduates |
| Computers & Mathematics | 52 | 17.8% |
| Bio, Nature & Agricultural | 21 | 7.2% |
| Physical & Health Sciences | 5 | 1.7% |
| Psychology | 5 | 1.7% |
| Social Sciences | 24 | 8.2% |
| Engineering | 7 | 2.4% |
| Multidisciplinary Studies | 0 | 0.0% |
| Science & Technology | 10 | 3.4% |
| Business | 15 | 5.1% |
| Education | 88 | 30.1% |
| Literature & Languages | 5 | 1.7% |
| Liberal Arts & History | 13 | 4.4% |
| Visual & Performing Arts | 3 | 1.0% |
| Communications | 13 | 4.4% |
| Arts & Humanities | 31 | 10.6% |
| Total | 292 | 100.0% |
Transportation & Commute in St Anthony
Vehicle Availability by Sex in St Anthony
The most prevalent vehicle ownership categories in St Anthony are males with 2 vehicles (305, accounting for 42.0%) and females with 2 vehicles (206, making up 51.7%).
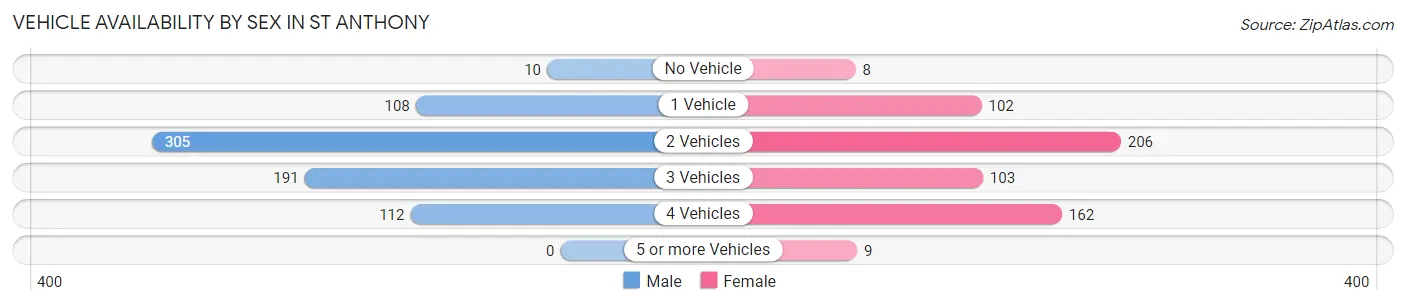
| Vehicles Available | Male | Female |
| No Vehicle | 10 (1.4%) | 8 (1.4%) |
| 1 Vehicle | 108 (14.9%) | 102 (17.3%) |
| 2 Vehicles | 305 (42.0%) | 206 (34.9%) |
| 3 Vehicles | 191 (26.3%) | 103 (17.5%) |
| 4 Vehicles | 112 (15.4%) | 162 (27.5%) |
| 5 or more Vehicles | 0 (0.0%) | 9 (1.5%) |
| Total | 726 (100.0%) | 590 (100.0%) |
Commute Time in St Anthony
The most frequently occuring commute durations in St Anthony are 15 to 19 minutes (271 commuters, 21.9%), 5 to 9 minutes (223 commuters, 18.1%), and 10 to 14 minutes (144 commuters, 11.7%).
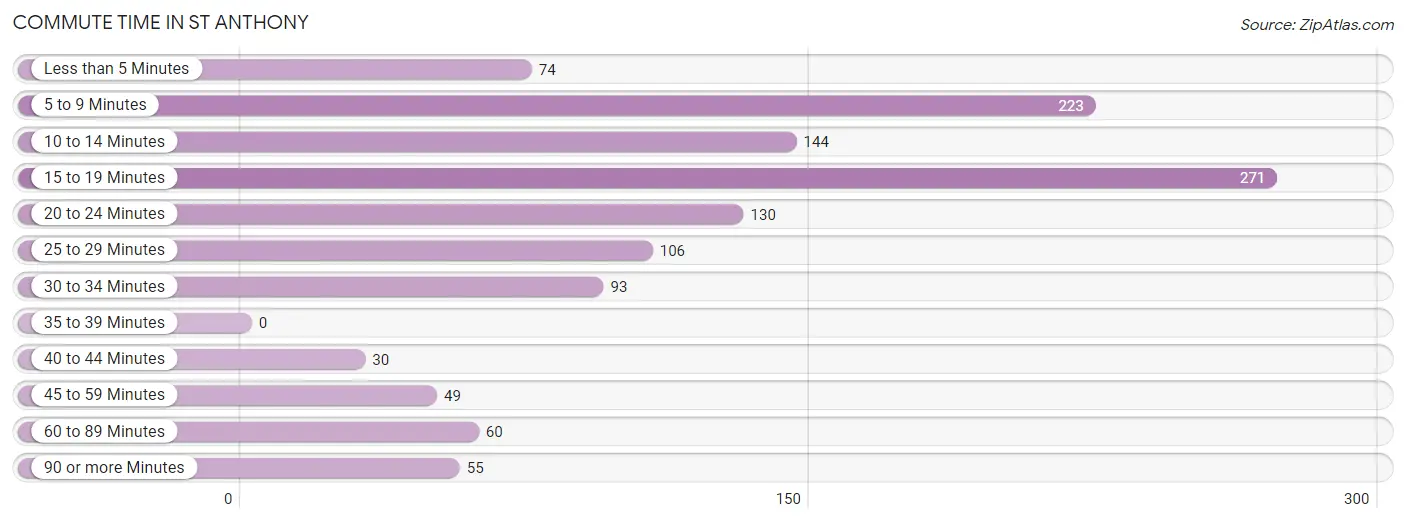
| Commute Time | # Commuters | % Commuters |
| Less than 5 Minutes | 74 | 6.0% |
| 5 to 9 Minutes | 223 | 18.1% |
| 10 to 14 Minutes | 144 | 11.7% |
| 15 to 19 Minutes | 271 | 21.9% |
| 20 to 24 Minutes | 130 | 10.5% |
| 25 to 29 Minutes | 106 | 8.6% |
| 30 to 34 Minutes | 93 | 7.5% |
| 35 to 39 Minutes | 0 | 0.0% |
| 40 to 44 Minutes | 30 | 2.4% |
| 45 to 59 Minutes | 49 | 4.0% |
| 60 to 89 Minutes | 60 | 4.9% |
| 90 or more Minutes | 55 | 4.4% |
Commute Time by Sex in St Anthony
The most common commute times in St Anthony are 15 to 19 minutes (199 commuters, 28.8%) for males and 5 to 9 minutes (106 commuters, 19.5%) for females.
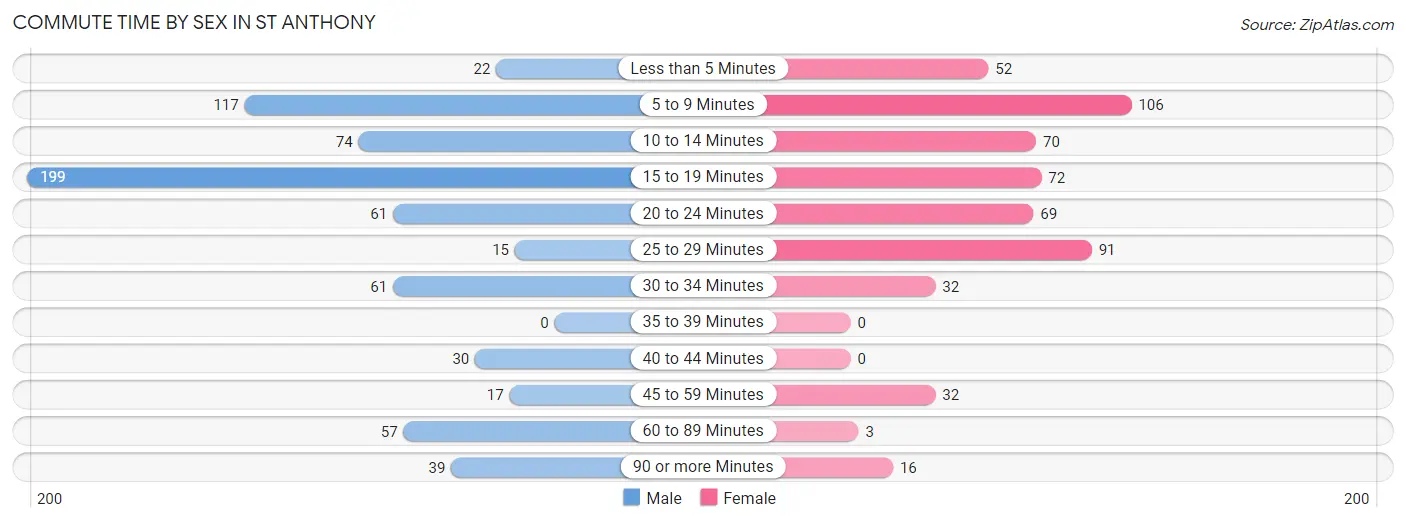
| Commute Time | Male | Female |
| Less than 5 Minutes | 22 (3.2%) | 52 (9.6%) |
| 5 to 9 Minutes | 117 (16.9%) | 106 (19.5%) |
| 10 to 14 Minutes | 74 (10.7%) | 70 (12.9%) |
| 15 to 19 Minutes | 199 (28.8%) | 72 (13.3%) |
| 20 to 24 Minutes | 61 (8.8%) | 69 (12.7%) |
| 25 to 29 Minutes | 15 (2.2%) | 91 (16.8%) |
| 30 to 34 Minutes | 61 (8.8%) | 32 (5.9%) |
| 35 to 39 Minutes | 0 (0.0%) | 0 (0.0%) |
| 40 to 44 Minutes | 30 (4.3%) | 0 (0.0%) |
| 45 to 59 Minutes | 17 (2.5%) | 32 (5.9%) |
| 60 to 89 Minutes | 57 (8.2%) | 3 (0.5%) |
| 90 or more Minutes | 39 (5.6%) | 16 (2.9%) |
Time of Departure to Work by Sex in St Anthony
The most frequent times of departure to work in St Anthony are 7:00 AM to 7:29 AM (183, 26.5%) for males and 7:30 AM to 7:59 AM (132, 24.3%) for females.
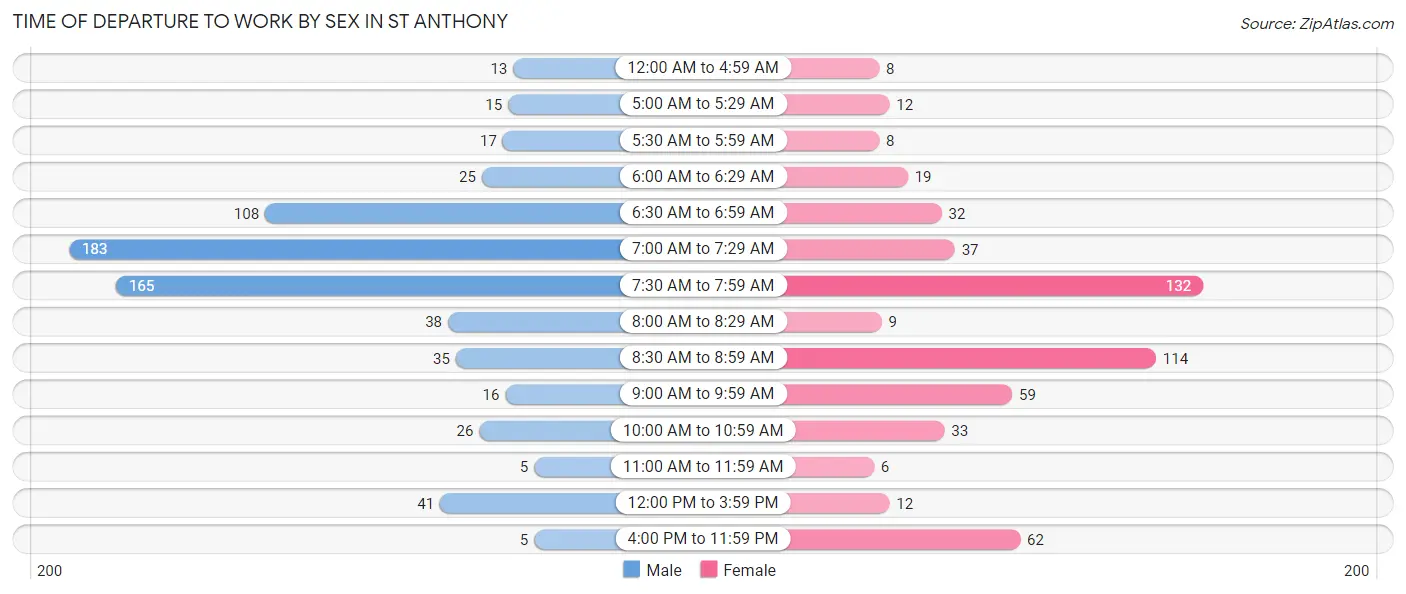
| Time of Departure | Male | Female |
| 12:00 AM to 4:59 AM | 13 (1.9%) | 8 (1.5%) |
| 5:00 AM to 5:29 AM | 15 (2.2%) | 12 (2.2%) |
| 5:30 AM to 5:59 AM | 17 (2.5%) | 8 (1.5%) |
| 6:00 AM to 6:29 AM | 25 (3.6%) | 19 (3.5%) |
| 6:30 AM to 6:59 AM | 108 (15.6%) | 32 (5.9%) |
| 7:00 AM to 7:29 AM | 183 (26.5%) | 37 (6.8%) |
| 7:30 AM to 7:59 AM | 165 (23.8%) | 132 (24.3%) |
| 8:00 AM to 8:29 AM | 38 (5.5%) | 9 (1.7%) |
| 8:30 AM to 8:59 AM | 35 (5.1%) | 114 (21.0%) |
| 9:00 AM to 9:59 AM | 16 (2.3%) | 59 (10.9%) |
| 10:00 AM to 10:59 AM | 26 (3.8%) | 33 (6.1%) |
| 11:00 AM to 11:59 AM | 5 (0.7%) | 6 (1.1%) |
| 12:00 PM to 3:59 PM | 41 (5.9%) | 12 (2.2%) |
| 4:00 PM to 11:59 PM | 5 (0.7%) | 62 (11.4%) |
| Total | 692 (100.0%) | 543 (100.0%) |
Housing Occupancy in St Anthony
Occupancy by Ownership in St Anthony
Of the total 1,141 dwellings in St Anthony, owner-occupied units account for 794 (69.6%), while renter-occupied units make up 347 (30.4%).
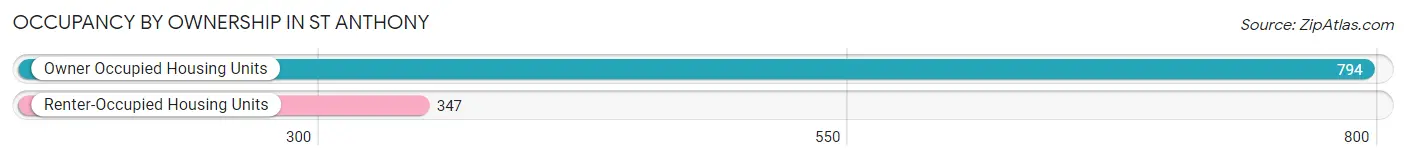
| Occupancy | # Housing Units | % Housing Units |
| Owner Occupied Housing Units | 794 | 69.6% |
| Renter-Occupied Housing Units | 347 | 30.4% |
| Total Occupied Housing Units | 1,141 | 100.0% |
Occupancy by Household Size in St Anthony
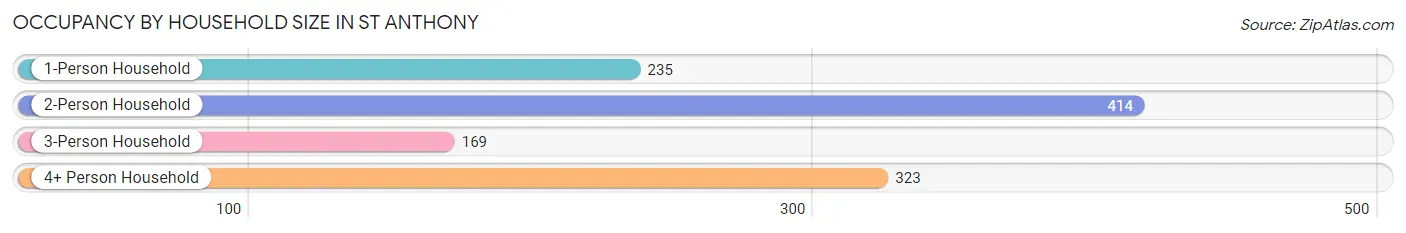
| Household Size | # Housing Units | % Housing Units |
| 1-Person Household | 235 | 20.6% |
| 2-Person Household | 414 | 36.3% |
| 3-Person Household | 169 | 14.8% |
| 4+ Person Household | 323 | 28.3% |
| Total Housing Units | 1,141 | 100.0% |
Occupancy by Ownership by Household Size in St Anthony
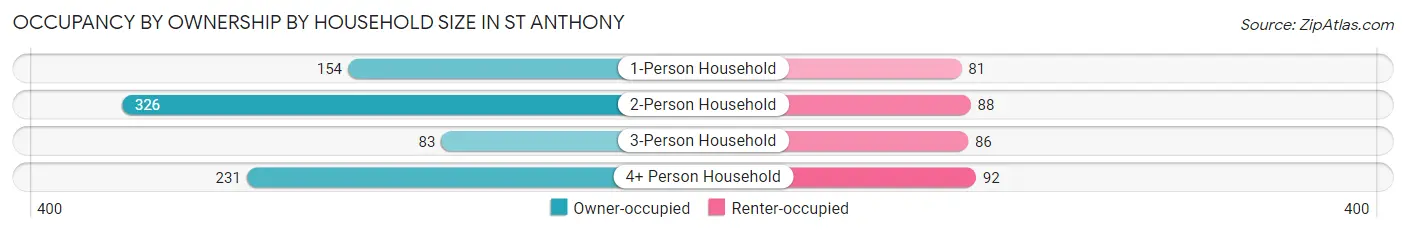
| Household Size | Owner-occupied | Renter-occupied |
| 1-Person Household | 154 (65.5%) | 81 (34.5%) |
| 2-Person Household | 326 (78.7%) | 88 (21.3%) |
| 3-Person Household | 83 (49.1%) | 86 (50.9%) |
| 4+ Person Household | 231 (71.5%) | 92 (28.5%) |
| Total Housing Units | 794 (69.6%) | 347 (30.4%) |
Occupancy by Educational Attainment in St Anthony
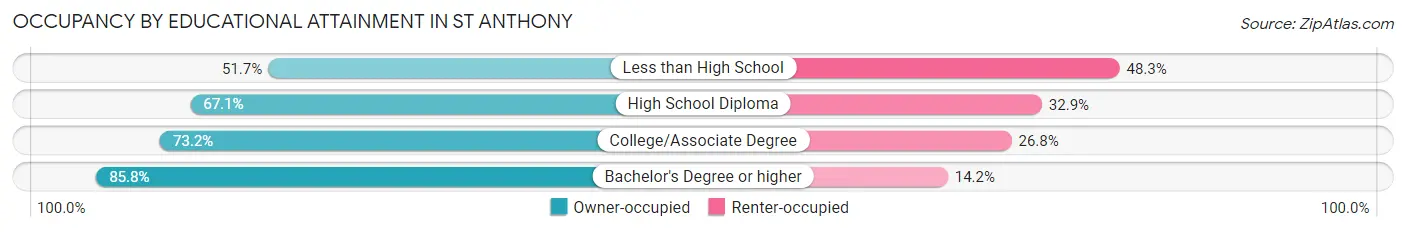
| Household Size | Owner-occupied | Renter-occupied |
| Less than High School | 89 (51.7%) | 83 (48.3%) |
| High School Diploma | 282 (67.1%) | 138 (32.9%) |
| College/Associate Degree | 278 (73.2%) | 102 (26.8%) |
| Bachelor's Degree or higher | 145 (85.8%) | 24 (14.2%) |
Occupancy by Age of Householder in St Anthony
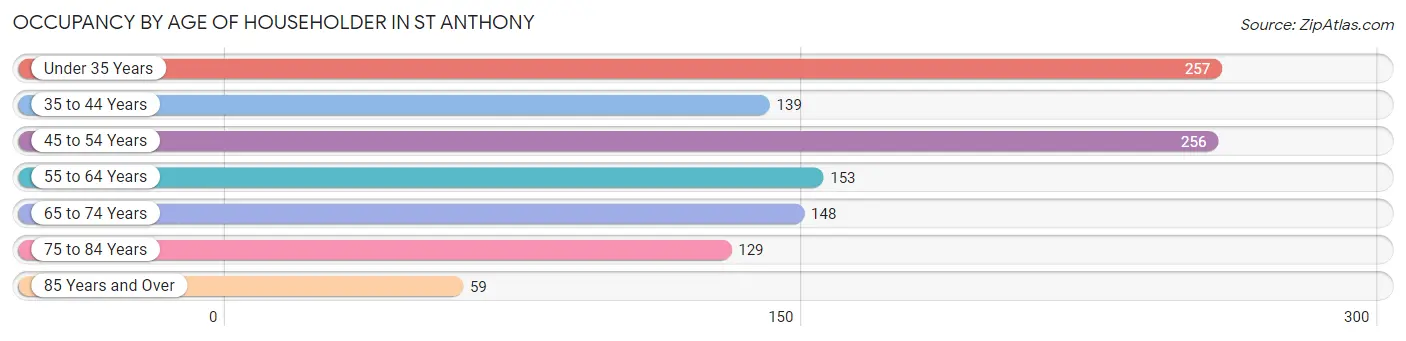
| Age Bracket | # Households | % Households |
| Under 35 Years | 257 | 22.5% |
| 35 to 44 Years | 139 | 12.2% |
| 45 to 54 Years | 256 | 22.4% |
| 55 to 64 Years | 153 | 13.4% |
| 65 to 74 Years | 148 | 13.0% |
| 75 to 84 Years | 129 | 11.3% |
| 85 Years and Over | 59 | 5.2% |
| Total | 1,141 | 100.0% |
Housing Finances in St Anthony
Median Income by Occupancy in St Anthony
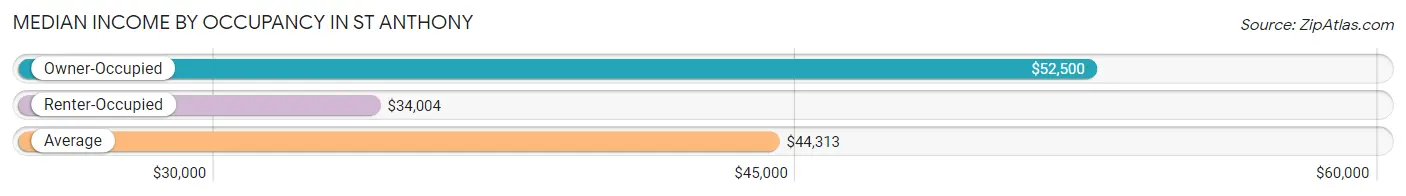
| Occupancy Type | # Households | Median Income |
| Owner-Occupied | 794 (69.6%) | $52,500 |
| Renter-Occupied | 347 (30.4%) | $34,004 |
| Average | 1,141 (100.0%) | $44,313 |
Occupancy by Householder Income Bracket in St Anthony
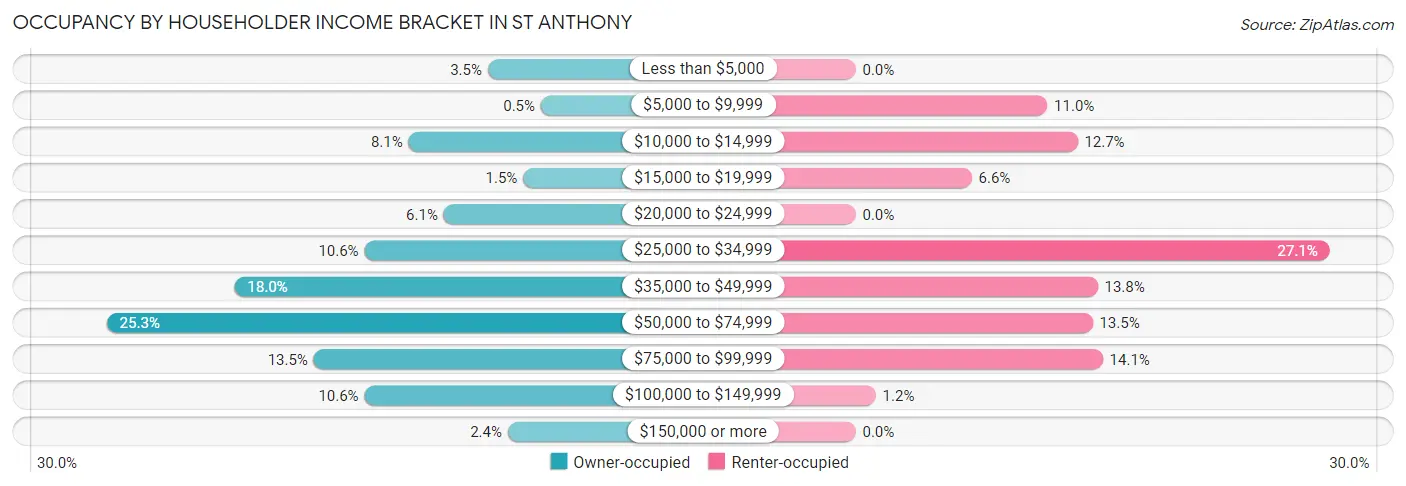
| Income Bracket | Owner-occupied | Renter-occupied |
| Less than $5,000 | 28 (3.5%) | 0 (0.0%) |
| $5,000 to $9,999 | 4 (0.5%) | 38 (11.0%) |
| $10,000 to $14,999 | 64 (8.1%) | 44 (12.7%) |
| $15,000 to $19,999 | 12 (1.5%) | 23 (6.6%) |
| $20,000 to $24,999 | 48 (6.0%) | 0 (0.0%) |
| $25,000 to $34,999 | 84 (10.6%) | 94 (27.1%) |
| $35,000 to $49,999 | 143 (18.0%) | 48 (13.8%) |
| $50,000 to $74,999 | 201 (25.3%) | 47 (13.5%) |
| $75,000 to $99,999 | 107 (13.5%) | 49 (14.1%) |
| $100,000 to $149,999 | 84 (10.6%) | 4 (1.1%) |
| $150,000 or more | 19 (2.4%) | 0 (0.0%) |
| Total | 794 (100.0%) | 347 (100.0%) |
Monthly Housing Cost Tiers in St Anthony
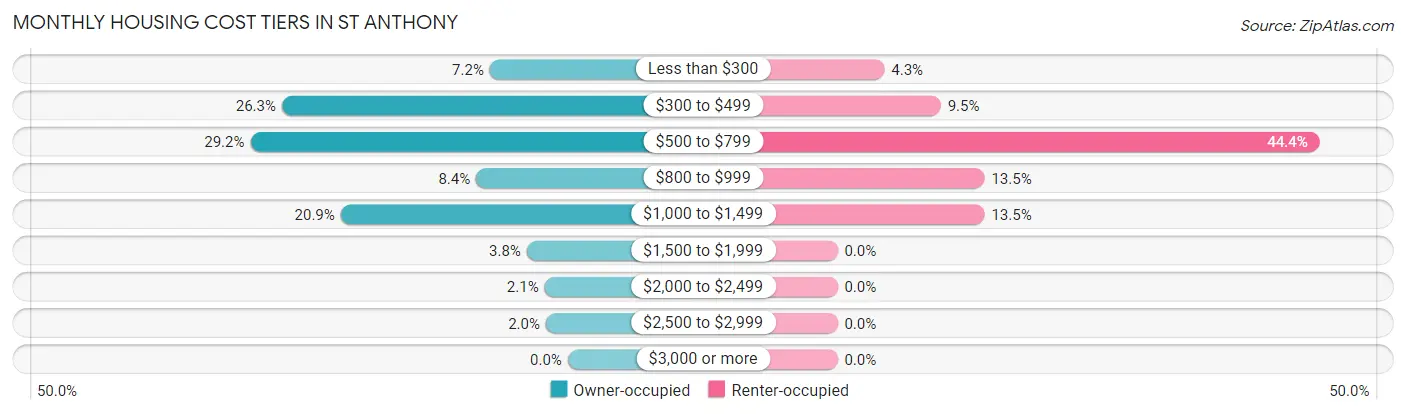
| Monthly Cost | Owner-occupied | Renter-occupied |
| Less than $300 | 57 (7.2%) | 15 (4.3%) |
| $300 to $499 | 209 (26.3%) | 33 (9.5%) |
| $500 to $799 | 232 (29.2%) | 154 (44.4%) |
| $800 to $999 | 67 (8.4%) | 47 (13.5%) |
| $1,000 to $1,499 | 166 (20.9%) | 47 (13.5%) |
| $1,500 to $1,999 | 30 (3.8%) | 0 (0.0%) |
| $2,000 to $2,499 | 17 (2.1%) | 0 (0.0%) |
| $2,500 to $2,999 | 16 (2.0%) | 0 (0.0%) |
| $3,000 or more | 0 (0.0%) | 0 (0.0%) |
| Total | 794 (100.0%) | 347 (100.0%) |
Physical Housing Characteristics in St Anthony
Housing Structures in St Anthony
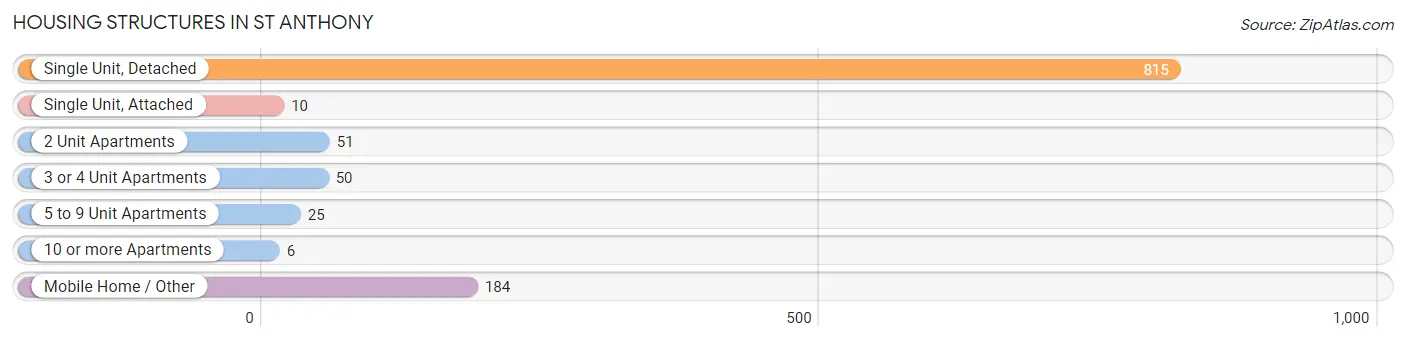
| Structure Type | # Housing Units | % Housing Units |
| Single Unit, Detached | 815 | 71.4% |
| Single Unit, Attached | 10 | 0.9% |
| 2 Unit Apartments | 51 | 4.5% |
| 3 or 4 Unit Apartments | 50 | 4.4% |
| 5 to 9 Unit Apartments | 25 | 2.2% |
| 10 or more Apartments | 6 | 0.5% |
| Mobile Home / Other | 184 | 16.1% |
| Total | 1,141 | 100.0% |
Housing Structures by Occupancy in St Anthony
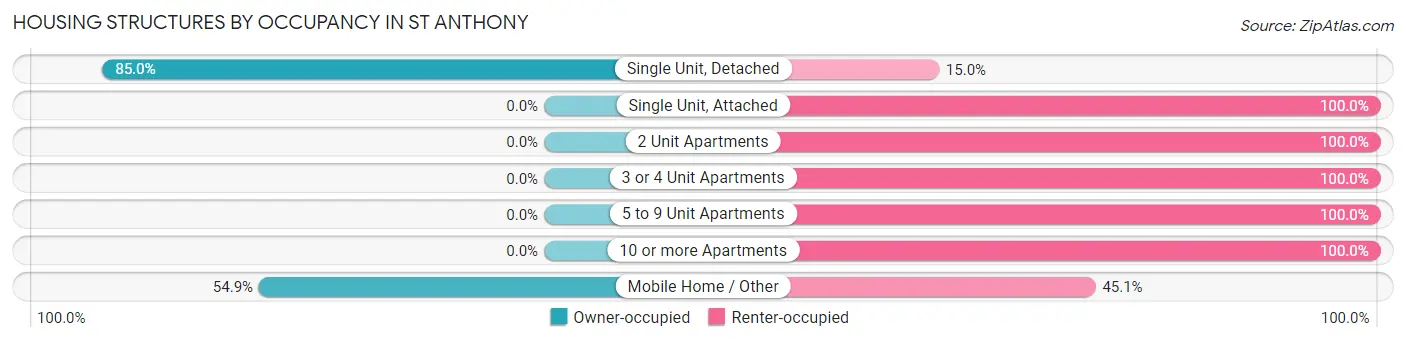
| Structure Type | Owner-occupied | Renter-occupied |
| Single Unit, Detached | 693 (85.0%) | 122 (15.0%) |
| Single Unit, Attached | 0 (0.0%) | 10 (100.0%) |
| 2 Unit Apartments | 0 (0.0%) | 51 (100.0%) |
| 3 or 4 Unit Apartments | 0 (0.0%) | 50 (100.0%) |
| 5 to 9 Unit Apartments | 0 (0.0%) | 25 (100.0%) |
| 10 or more Apartments | 0 (0.0%) | 6 (100.0%) |
| Mobile Home / Other | 101 (54.9%) | 83 (45.1%) |
| Total | 794 (69.6%) | 347 (30.4%) |
Housing Structures by Number of Rooms in St Anthony
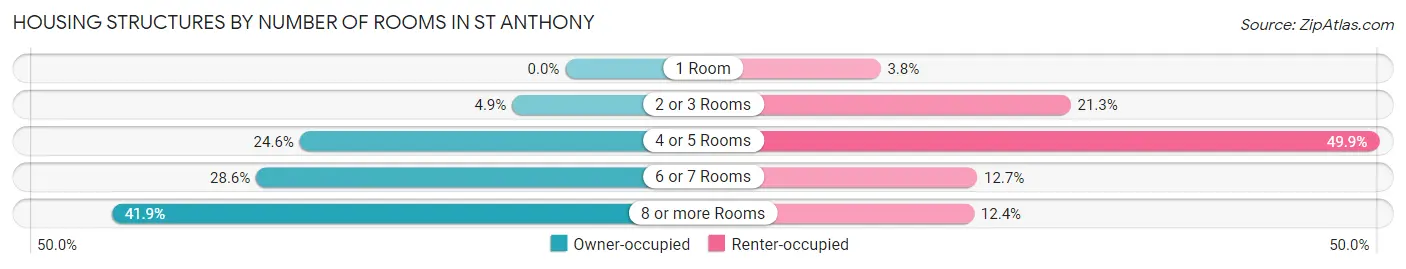
| Number of Rooms | Owner-occupied | Renter-occupied |
| 1 Room | 0 (0.0%) | 13 (3.7%) |
| 2 or 3 Rooms | 39 (4.9%) | 74 (21.3%) |
| 4 or 5 Rooms | 195 (24.6%) | 173 (49.9%) |
| 6 or 7 Rooms | 227 (28.6%) | 44 (12.7%) |
| 8 or more Rooms | 333 (41.9%) | 43 (12.4%) |
| Total | 794 (100.0%) | 347 (100.0%) |
Housing Structure by Heating Type in St Anthony
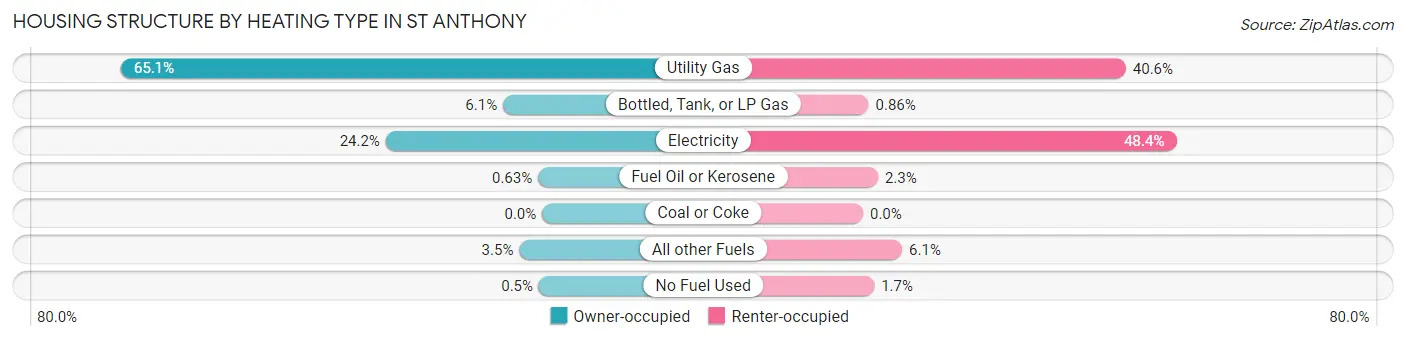
| Heating Type | Owner-occupied | Renter-occupied |
| Utility Gas | 517 (65.1%) | 141 (40.6%) |
| Bottled, Tank, or LP Gas | 48 (6.0%) | 3 (0.9%) |
| Electricity | 192 (24.2%) | 168 (48.4%) |
| Fuel Oil or Kerosene | 5 (0.6%) | 8 (2.3%) |
| Coal or Coke | 0 (0.0%) | 0 (0.0%) |
| All other Fuels | 28 (3.5%) | 21 (6.0%) |
| No Fuel Used | 4 (0.5%) | 6 (1.7%) |
| Total | 794 (100.0%) | 347 (100.0%) |
Household Vehicle Usage in St Anthony
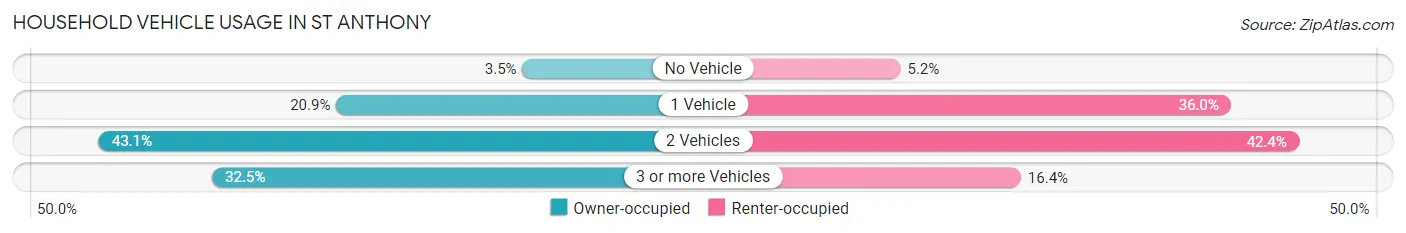
| Vehicles per Household | Owner-occupied | Renter-occupied |
| No Vehicle | 28 (3.5%) | 18 (5.2%) |
| 1 Vehicle | 166 (20.9%) | 125 (36.0%) |
| 2 Vehicles | 342 (43.1%) | 147 (42.4%) |
| 3 or more Vehicles | 258 (32.5%) | 57 (16.4%) |
| Total | 794 (100.0%) | 347 (100.0%) |
Real Estate & Mortgages in St Anthony
Real Estate and Mortgage Overview in St Anthony
| Characteristic | Without Mortgage | With Mortgage |
| Housing Units | 433 | 361 |
| Median Property Value | $160,900 | $178,500 |
| Median Household Income | $44,396 | $19 |
| Monthly Housing Costs | $457 | $0 |
| Real Estate Taxes | $1,302 | $28 |
Property Value by Mortgage Status in St Anthony
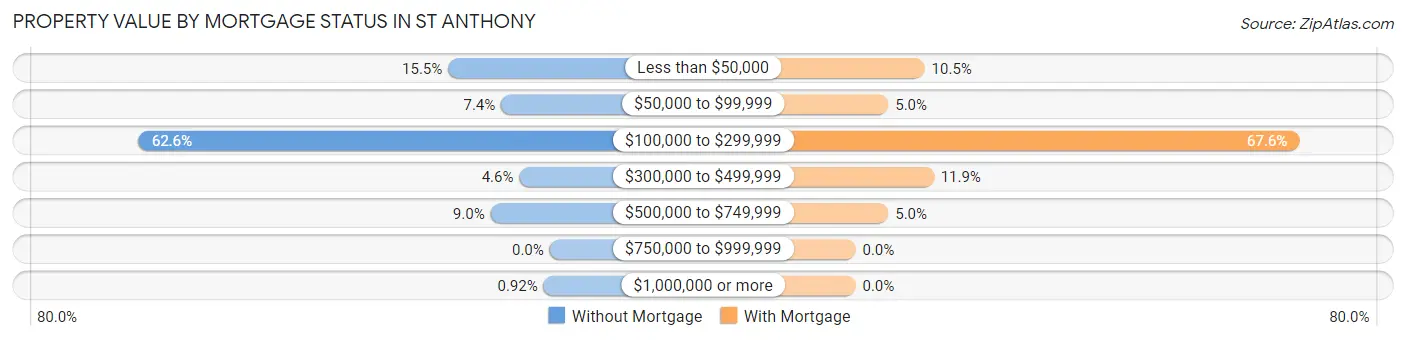
| Property Value | Without Mortgage | With Mortgage |
| Less than $50,000 | 67 (15.5%) | 38 (10.5%) |
| $50,000 to $99,999 | 32 (7.4%) | 18 (5.0%) |
| $100,000 to $299,999 | 271 (62.6%) | 244 (67.6%) |
| $300,000 to $499,999 | 20 (4.6%) | 43 (11.9%) |
| $500,000 to $749,999 | 39 (9.0%) | 18 (5.0%) |
| $750,000 to $999,999 | 0 (0.0%) | 0 (0.0%) |
| $1,000,000 or more | 4 (0.9%) | 0 (0.0%) |
| Total | 433 (100.0%) | 361 (100.0%) |
Household Income by Mortgage Status in St Anthony
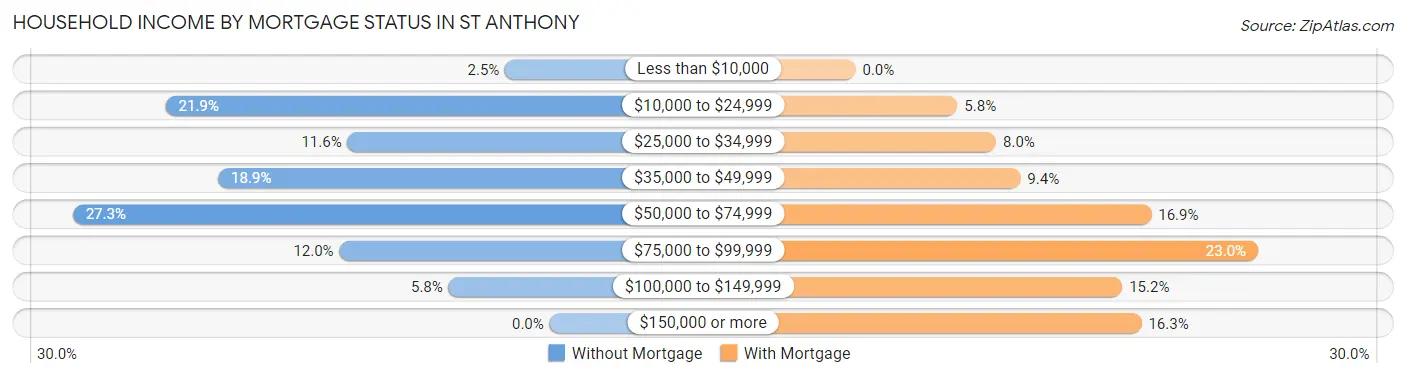
| Household Income | Without Mortgage | With Mortgage |
| Less than $10,000 | 11 (2.5%) | 0 (0.0%) |
| $10,000 to $24,999 | 95 (21.9%) | 21 (5.8%) |
| $25,000 to $34,999 | 50 (11.6%) | 29 (8.0%) |
| $35,000 to $49,999 | 82 (18.9%) | 34 (9.4%) |
| $50,000 to $74,999 | 118 (27.3%) | 61 (16.9%) |
| $75,000 to $99,999 | 52 (12.0%) | 83 (23.0%) |
| $100,000 to $149,999 | 25 (5.8%) | 55 (15.2%) |
| $150,000 or more | 0 (0.0%) | 59 (16.3%) |
| Total | 433 (100.0%) | 361 (100.0%) |
Property Value to Household Income Ratio in St Anthony
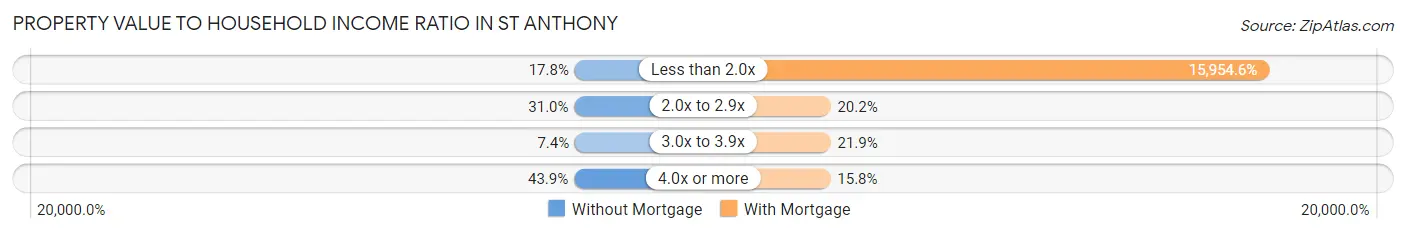
| Value-to-Income Ratio | Without Mortgage | With Mortgage |
| Less than 2.0x | 77 (17.8%) | 57,596 (15,954.6%) |
| 2.0x to 2.9x | 134 (30.9%) | 73 (20.2%) |
| 3.0x to 3.9x | 32 (7.4%) | 79 (21.9%) |
| 4.0x or more | 190 (43.9%) | 57 (15.8%) |
| Total | 433 (100.0%) | 361 (100.0%) |
Real Estate Taxes by Mortgage Status in St Anthony
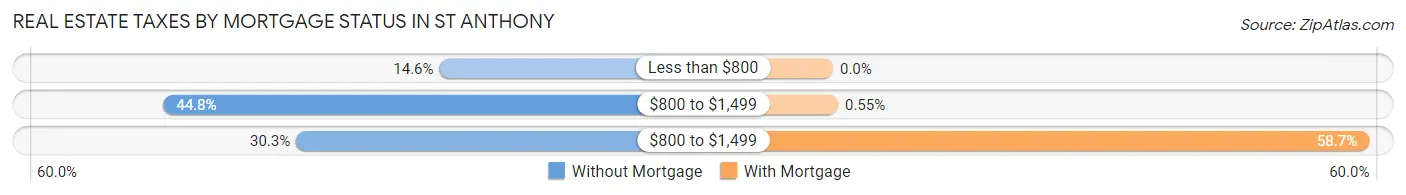
| Property Taxes | Without Mortgage | With Mortgage |
| Less than $800 | 63 (14.5%) | 0 (0.0%) |
| $800 to $1,499 | 194 (44.8%) | 2 (0.5%) |
| $800 to $1,499 | 131 (30.2%) | 212 (58.7%) |
| Total | 433 (100.0%) | 361 (100.0%) |
Health & Disability in St Anthony
Health Insurance Coverage by Age in St Anthony
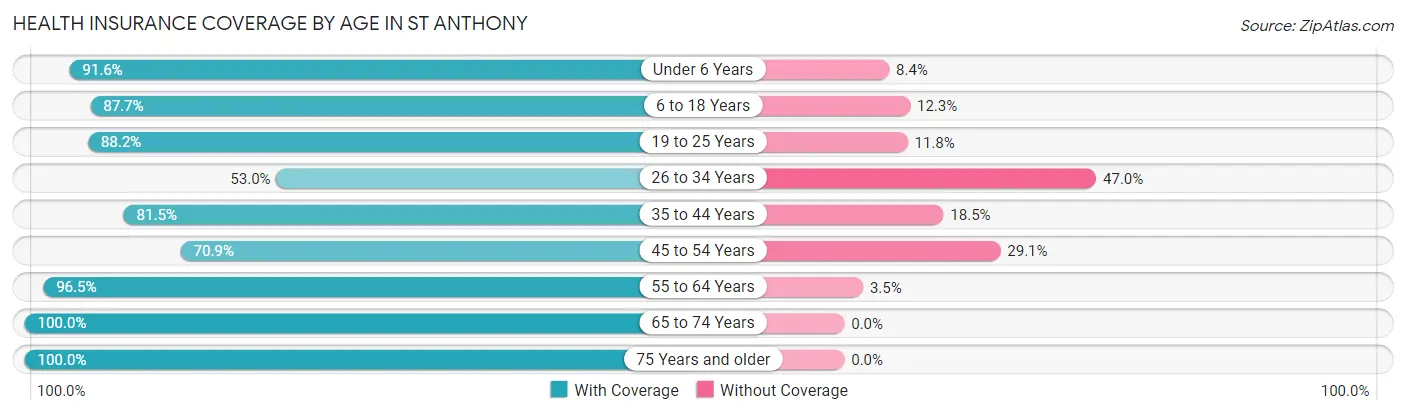
| Age Bracket | With Coverage | Without Coverage |
| Under 6 Years | 274 (91.6%) | 25 (8.4%) |
| 6 to 18 Years | 508 (87.7%) | 71 (12.3%) |
| 19 to 25 Years | 321 (88.2%) | 43 (11.8%) |
| 26 to 34 Years | 305 (53.0%) | 270 (47.0%) |
| 35 to 44 Years | 225 (81.5%) | 51 (18.5%) |
| 45 to 54 Years | 307 (70.9%) | 126 (29.1%) |
| 55 to 64 Years | 361 (96.5%) | 13 (3.5%) |
| 65 to 74 Years | 260 (100.0%) | 0 (0.0%) |
| 75 Years and older | 264 (100.0%) | 0 (0.0%) |
| Total | 2,825 (82.5%) | 599 (17.5%) |
Health Insurance Coverage by Citizenship Status in St Anthony
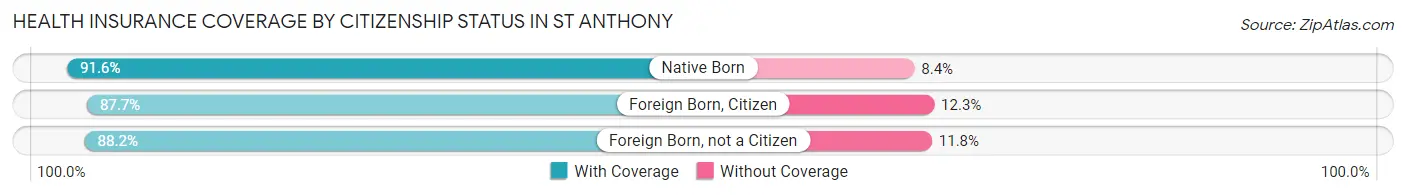
| Citizenship Status | With Coverage | Without Coverage |
| Native Born | 274 (91.6%) | 25 (8.4%) |
| Foreign Born, Citizen | 508 (87.7%) | 71 (12.3%) |
| Foreign Born, not a Citizen | 321 (88.2%) | 43 (11.8%) |
Health Insurance Coverage by Household Income in St Anthony
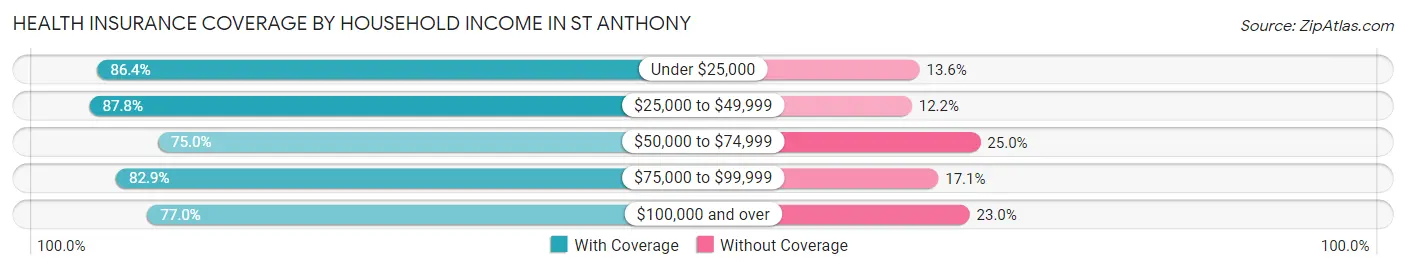
| Household Income | With Coverage | Without Coverage |
| Under $25,000 | 595 (86.4%) | 94 (13.6%) |
| $25,000 to $49,999 | 800 (87.8%) | 111 (12.2%) |
| $50,000 to $74,999 | 569 (75.0%) | 190 (25.0%) |
| $75,000 to $99,999 | 580 (82.9%) | 120 (17.1%) |
| $100,000 and over | 281 (77.0%) | 84 (23.0%) |
Public vs Private Health Insurance Coverage by Age in St Anthony
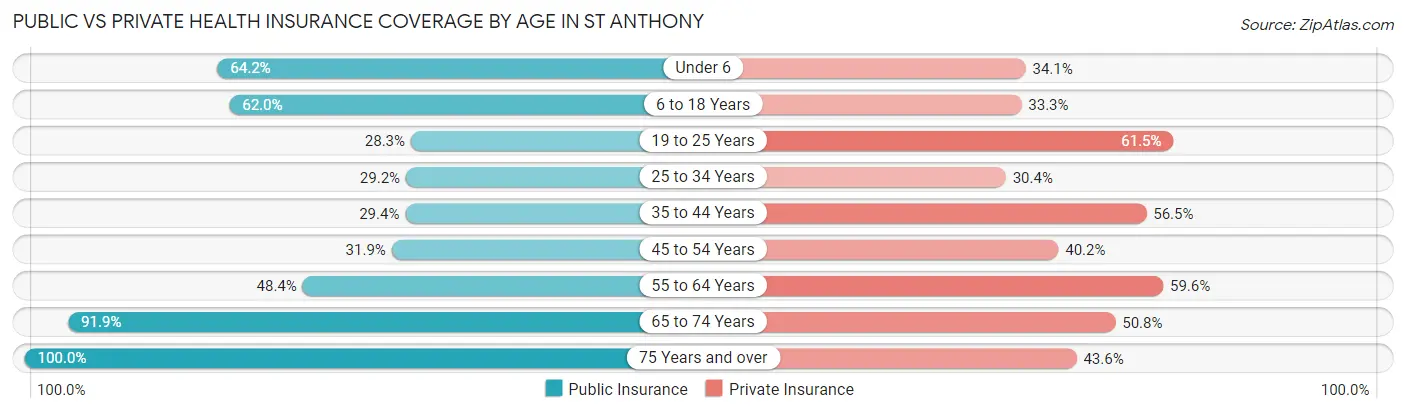
| Age Bracket | Public Insurance | Private Insurance |
| Under 6 | 192 (64.2%) | 102 (34.1%) |
| 6 to 18 Years | 359 (62.0%) | 193 (33.3%) |
| 19 to 25 Years | 103 (28.3%) | 224 (61.5%) |
| 25 to 34 Years | 168 (29.2%) | 175 (30.4%) |
| 35 to 44 Years | 81 (29.3%) | 156 (56.5%) |
| 45 to 54 Years | 138 (31.9%) | 174 (40.2%) |
| 55 to 64 Years | 181 (48.4%) | 223 (59.6%) |
| 65 to 74 Years | 239 (91.9%) | 132 (50.8%) |
| 75 Years and over | 264 (100.0%) | 115 (43.6%) |
| Total | 1,725 (50.4%) | 1,494 (43.6%) |
Disability Status by Sex by Age in St Anthony
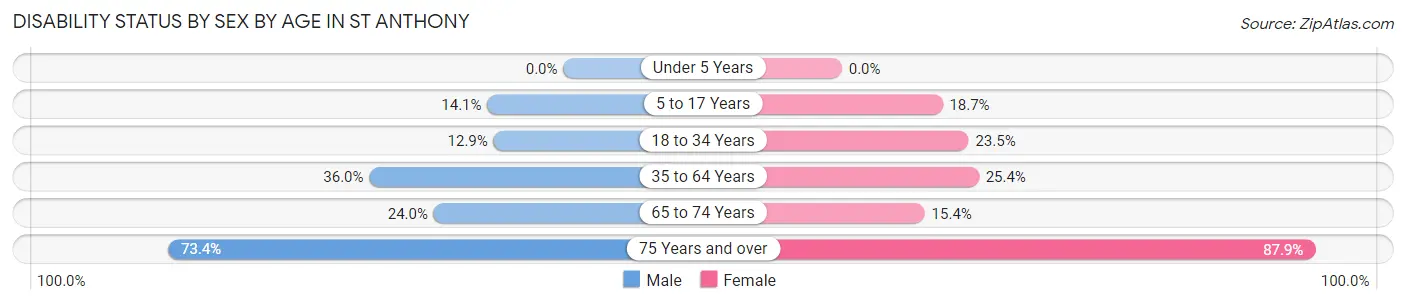
| Age Bracket | Male | Female |
| Under 5 Years | 0 (0.0%) | 0 (0.0%) |
| 5 to 17 Years | 33 (14.1%) | 71 (18.7%) |
| 18 to 34 Years | 55 (12.9%) | 123 (23.5%) |
| 35 to 64 Years | 193 (36.0%) | 139 (25.4%) |
| 65 to 74 Years | 25 (24.0%) | 24 (15.4%) |
| 75 Years and over | 91 (73.4%) | 123 (87.9%) |
Disability Class by Sex by Age in St Anthony
Disability Class: Hearing Difficulty
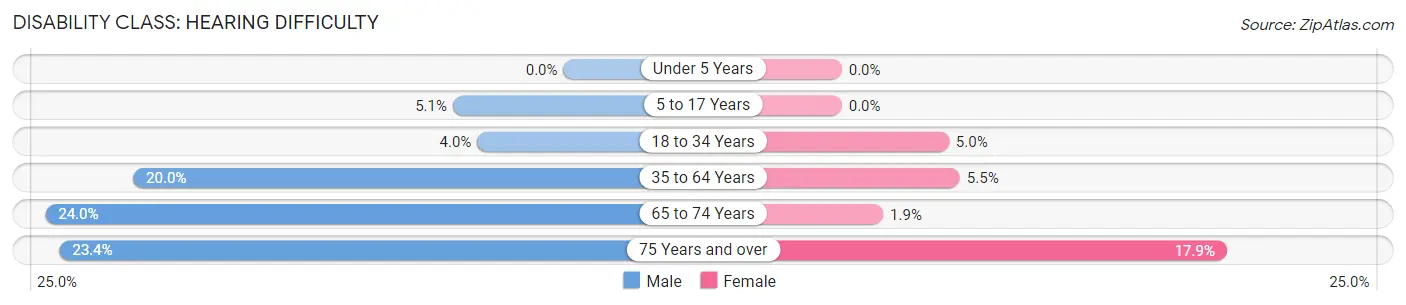
| Age Bracket | Male | Female |
| Under 5 Years | 0 (0.0%) | 0 (0.0%) |
| 5 to 17 Years | 12 (5.1%) | 0 (0.0%) |
| 18 to 34 Years | 17 (4.0%) | 26 (5.0%) |
| 35 to 64 Years | 107 (20.0%) | 30 (5.5%) |
| 65 to 74 Years | 25 (24.0%) | 3 (1.9%) |
| 75 Years and over | 29 (23.4%) | 25 (17.9%) |
Disability Class: Vision Difficulty
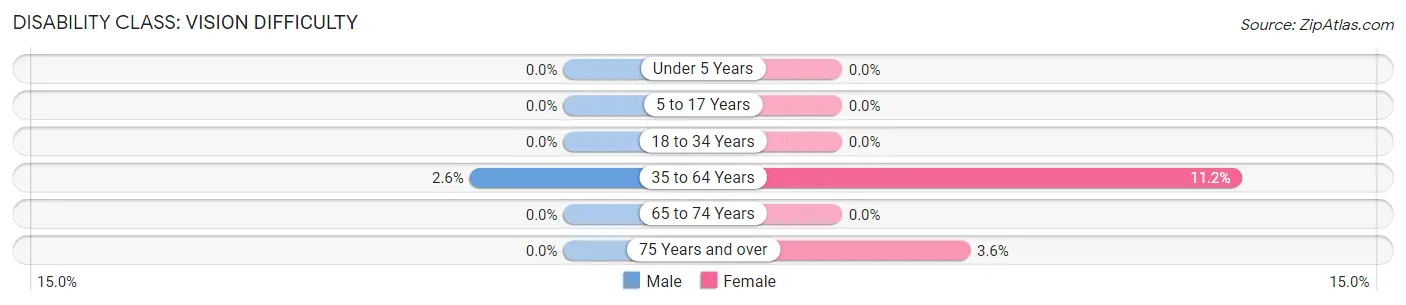
| Age Bracket | Male | Female |
| Under 5 Years | 0 (0.0%) | 0 (0.0%) |
| 5 to 17 Years | 0 (0.0%) | 0 (0.0%) |
| 18 to 34 Years | 0 (0.0%) | 0 (0.0%) |
| 35 to 64 Years | 14 (2.6%) | 61 (11.2%) |
| 65 to 74 Years | 0 (0.0%) | 0 (0.0%) |
| 75 Years and over | 0 (0.0%) | 5 (3.6%) |
Disability Class: Cognitive Difficulty
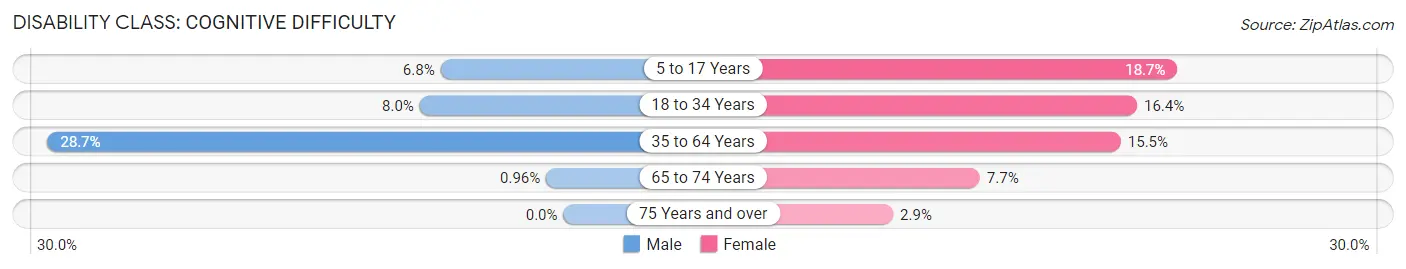
| Age Bracket | Male | Female |
| 5 to 17 Years | 16 (6.8%) | 71 (18.7%) |
| 18 to 34 Years | 34 (8.0%) | 86 (16.4%) |
| 35 to 64 Years | 154 (28.7%) | 85 (15.5%) |
| 65 to 74 Years | 1 (1.0%) | 12 (7.7%) |
| 75 Years and over | 0 (0.0%) | 4 (2.9%) |
Disability Class: Ambulatory Difficulty
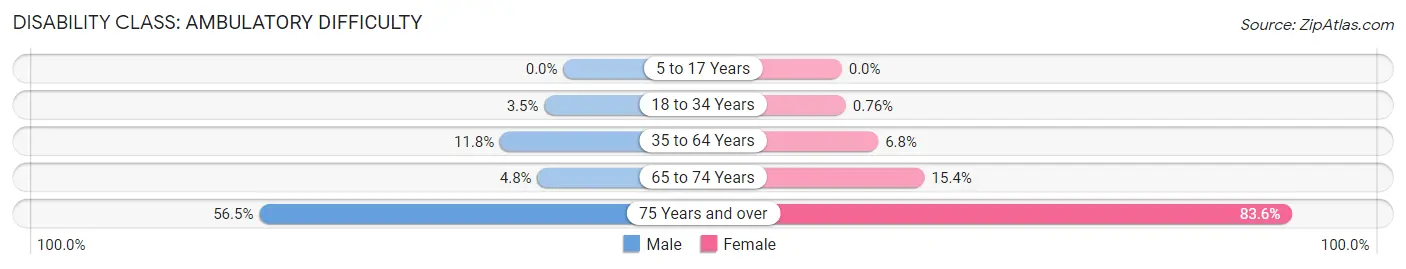
| Age Bracket | Male | Female |
| 5 to 17 Years | 0 (0.0%) | 0 (0.0%) |
| 18 to 34 Years | 15 (3.5%) | 4 (0.8%) |
| 35 to 64 Years | 63 (11.7%) | 37 (6.8%) |
| 65 to 74 Years | 5 (4.8%) | 24 (15.4%) |
| 75 Years and over | 70 (56.5%) | 117 (83.6%) |
Disability Class: Self-Care Difficulty
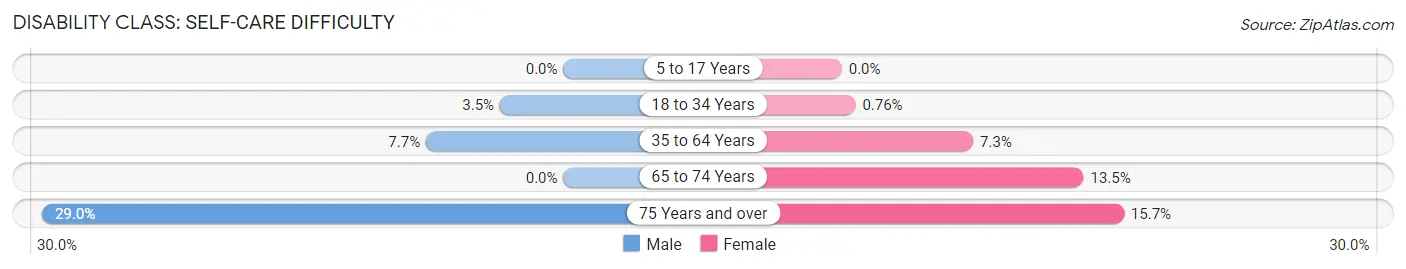
| Age Bracket | Male | Female |
| 5 to 17 Years | 0 (0.0%) | 0 (0.0%) |
| 18 to 34 Years | 15 (3.5%) | 4 (0.8%) |
| 35 to 64 Years | 41 (7.6%) | 40 (7.3%) |
| 65 to 74 Years | 0 (0.0%) | 21 (13.5%) |
| 75 Years and over | 36 (29.0%) | 22 (15.7%) |
Technology Access in St Anthony
Computing Device Access in St Anthony
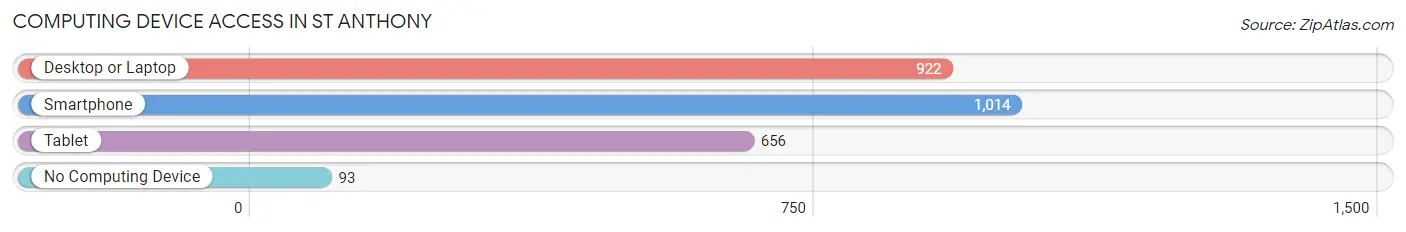
| Device Type | # Households | % Households |
| Desktop or Laptop | 922 | 80.8% |
| Smartphone | 1,014 | 88.9% |
| Tablet | 656 | 57.5% |
| No Computing Device | 93 | 8.2% |
| Total | 1,141 | 100.0% |
Internet Access in St Anthony
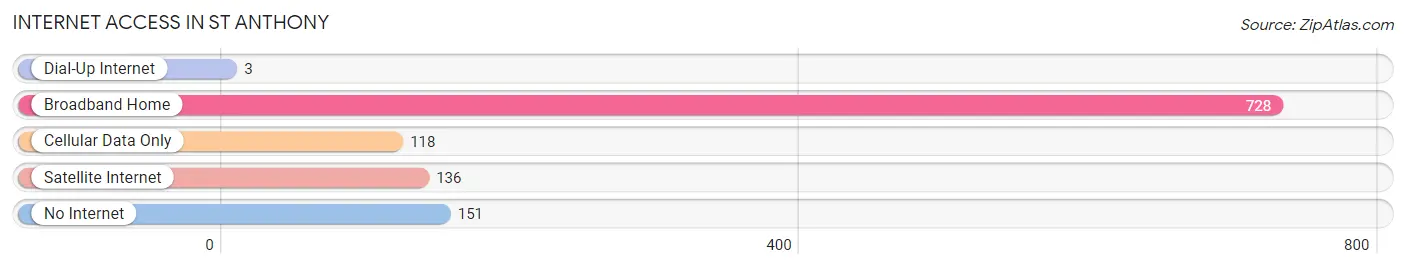
| Internet Type | # Households | % Households |
| Dial-Up Internet | 3 | 0.3% |
| Broadband Home | 728 | 63.8% |
| Cellular Data Only | 118 | 10.3% |
| Satellite Internet | 136 | 11.9% |
| No Internet | 151 | 13.2% |
| Total | 1,141 | 100.0% |
St Anthony Summary
St. Anthony is a city located in the southeastern corner of Idaho, in the county of Fremont. It is situated on the banks of the Henry’s Fork of the Snake River, and is the county seat of Fremont County. The city has a population of approximately 3,500 people, and is the largest city in the county.
History
St. Anthony was founded in 1878 by a group of Mormon settlers led by Charles C. Rich. The settlers were sent by Brigham Young to establish a settlement in the area. The city was named after St. Anthony of Padua, a Catholic saint. The settlers built a fort to protect themselves from Native American attacks, and the fort was later used as a trading post.
The city was incorporated in 1883, and the first mayor was Charles C. Rich. The city grew rapidly in the late 19th century, and by 1900 it had a population of over 1,000 people.
Geography
St. Anthony is located in the southeastern corner of Idaho, in the county of Fremont. It is situated on the banks of the Henry’s Fork of the Snake River, and is the county seat of Fremont County. The city has a total area of 4.2 square miles, all of which is land.
The city is located in a semi-arid climate zone, with hot summers and cold winters. The average annual temperature is 44.3 degrees Fahrenheit, and the average annual precipitation is 11.3 inches.
Economy
St. Anthony’s economy is largely based on agriculture and tourism. The city is home to several large farms, and the surrounding area is known for its production of potatoes, wheat, and other crops. The city is also home to several tourist attractions, including the St. Anthony Sand Dunes, the St. Anthony Falls, and the St. Anthony Wildlife Refuge.
The city is also home to several manufacturing companies, including a furniture factory, a plastics factory, and a food processing plant.
Demographics
As of the 2010 census, St. Anthony had a population of 3,500 people. The racial makeup of the city was 95.2% White, 0.7% African American, 0.3% Native American, 0.3% Asian, 0.1% Pacific Islander, 1.2% from other races, and 2.5% from two or more races. Hispanic or Latino of any race were 3.3% of the population.
The median income for a household in the city was $37,500, and the median income for a family was $45,000. The per capita income for the city was $17,000. About 11.2% of families and 14.2% of the population were below the poverty line, including 17.2% of those under age 18 and 8.3% of those age 65 or over.
Common Questions
What is Per Capita Income in St Anthony?
Per Capita income in St Anthony is $20,258.
What is the Median Family Income in St Anthony?
Median Family Income in St Anthony is $51,646.
What is the Median Household income in St Anthony?
Median Household Income in St Anthony is $44,313.
What is Income or Wage Gap in St Anthony?
Income or Wage Gap in St Anthony is 18.6%.
Women in St Anthony earn 81.4 cents for every dollar earned by a man.
What is Inequality or Gini Index in St Anthony?
Inequality or Gini Index in St Anthony is 0.44.
What is the Total Population of St Anthony?
Total Population of St Anthony is 3,730.
What is the Total Male Population of St Anthony?
Total Male Population of St Anthony is 1,868.
What is the Total Female Population of St Anthony?
Total Female Population of St Anthony is 1,862.
What is the Ratio of Males per 100 Females in St Anthony?
There are 100.32 Males per 100 Females in St Anthony.
What is the Ratio of Females per 100 Males in St Anthony?
There are 99.68 Females per 100 Males in St Anthony.
What is the Median Population Age in St Anthony?
Median Population Age in St Anthony is 33.5 Years.
What is the Average Family Size in St Anthony
Average Family Size in St Anthony is 3.5 People.
What is the Average Household Size in St Anthony
Average Household Size in St Anthony is 3.0 People.
How Large is the Labor Force in St Anthony?
There are 1,450 People in the Labor Forcein in St Anthony.
What is the Percentage of People in the Labor Force in St Anthony?
48.8% of People are in the Labor Force in St Anthony.
What is the Unemployment Rate in St Anthony?
Unemployment Rate in St Anthony is 8.1%.