Worley, ID Map & Demographics
Worley Map
Worley Overview
$26,606
PER CAPITA INCOME
$39,792
AVG FAMILY INCOME
$41,563
AVG HOUSEHOLD INCOME
19.1%
WAGE / INCOME GAP [ % ]
80.9¢/ $1
WAGE / INCOME GAP [ $ ]
0.47
INEQUALITY / GINI INDEX
258
TOTAL POPULATION
134
MALE POPULATION
124
FEMALE POPULATION
108.06
MALES / 100 FEMALES
92.54
FEMALES / 100 MALES
35.2
MEDIAN AGE
3.3
AVG FAMILY SIZE
2.8
AVG HOUSEHOLD SIZE
123
LABOR FORCE [ PEOPLE ]
62.4%
PERCENT IN LABOR FORCE
6.5%
UNEMPLOYMENT RATE
Worley Zip Codes
Worley Area Codes
Income in Worley
Income Overview in Worley
Per Capita Income in Worley is $26,606, while median incomes of families and households are $39,792 and $41,563 respectively.
| Characteristic | Number | Measure |
| Per Capita Income | 258 | $26,606 |
| Median Family Income | 65 | $39,792 |
| Mean Family Income | 65 | $60,538 |
| Median Household Income | 91 | $41,563 |
| Mean Household Income | 91 | $66,729 |
| Income Deficit | 65 | $0 |
| Wage / Income Gap (%) | 258 | 19.11% |
| Wage / Income Gap ($) | 258 | 80.89¢ per $1 |
| Gini / Inequality Index | 258 | 0.47 |
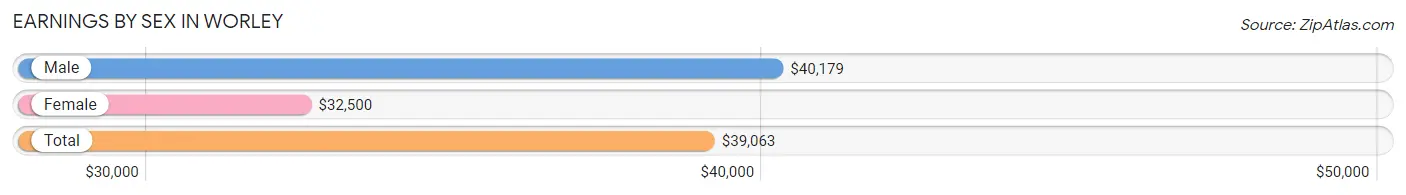
Earnings by Sex in Worley
Average Earnings in Worley are $39,063, $40,179 for men and $32,500 for women, a difference of 19.1%.
| Sex | Number | Average Earnings |
| Male | 63 (52.1%) | $40,179 |
| Female | 58 (47.9%) | $32,500 |
| Total | 121 (100.0%) | $39,063 |
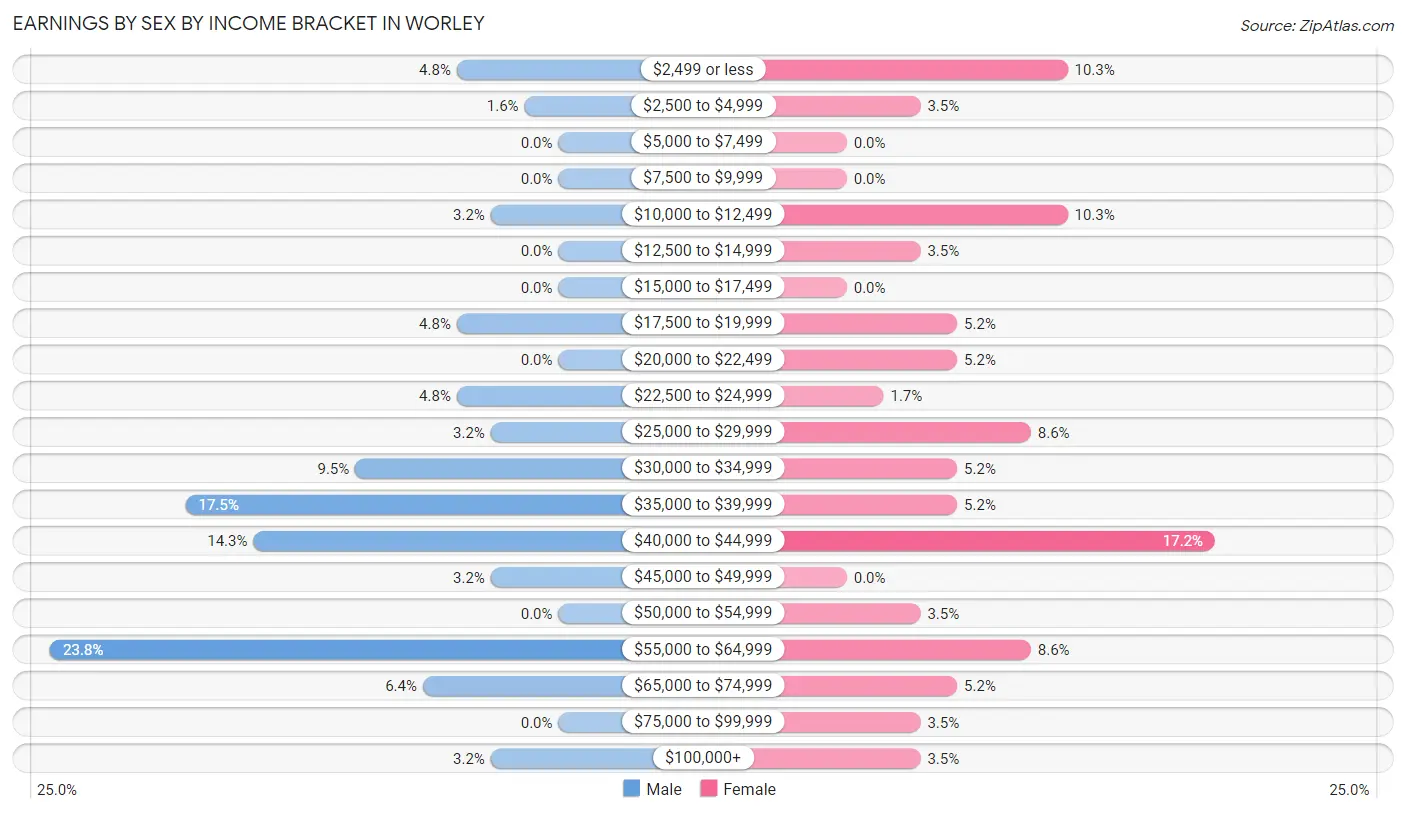
Earnings by Sex by Income Bracket in Worley
The most common earnings brackets in Worley are $55,000 to $64,999 for men (15 | 23.8%) and $40,000 to $44,999 for women (10 | 17.2%).
| Income | Male | Female |
| $2,499 or less | 3 (4.8%) | 6 (10.3%) |
| $2,500 to $4,999 | 1 (1.6%) | 2 (3.5%) |
| $5,000 to $7,499 | 0 (0.0%) | 0 (0.0%) |
| $7,500 to $9,999 | 0 (0.0%) | 0 (0.0%) |
| $10,000 to $12,499 | 2 (3.2%) | 6 (10.3%) |
| $12,500 to $14,999 | 0 (0.0%) | 2 (3.5%) |
| $15,000 to $17,499 | 0 (0.0%) | 0 (0.0%) |
| $17,500 to $19,999 | 3 (4.8%) | 3 (5.2%) |
| $20,000 to $22,499 | 0 (0.0%) | 3 (5.2%) |
| $22,500 to $24,999 | 3 (4.8%) | 1 (1.7%) |
| $25,000 to $29,999 | 2 (3.2%) | 5 (8.6%) |
| $30,000 to $34,999 | 6 (9.5%) | 3 (5.2%) |
| $35,000 to $39,999 | 11 (17.5%) | 3 (5.2%) |
| $40,000 to $44,999 | 9 (14.3%) | 10 (17.2%) |
| $45,000 to $49,999 | 2 (3.2%) | 0 (0.0%) |
| $50,000 to $54,999 | 0 (0.0%) | 2 (3.5%) |
| $55,000 to $64,999 | 15 (23.8%) | 5 (8.6%) |
| $65,000 to $74,999 | 4 (6.4%) | 3 (5.2%) |
| $75,000 to $99,999 | 0 (0.0%) | 2 (3.5%) |
| $100,000+ | 2 (3.2%) | 2 (3.5%) |
| Total | 63 (100.0%) | 58 (100.0%) |
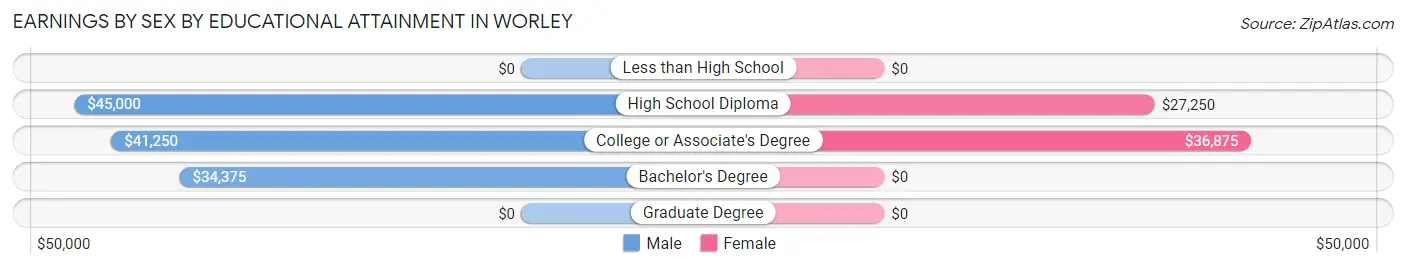
Earnings by Sex by Educational Attainment in Worley
Average earnings in Worley are $40,500 for men and $40,833 for women, a difference of 0.8%. Men with an educational attainment of high school diploma enjoy the highest average annual earnings of $45,000, while those with bachelor's degree education earn the least with $34,375. Women with an educational attainment of college or associate's degree earn the most with the average annual earnings of $36,875, while those with high school diploma education have the smallest earnings of $27,250.
| Educational Attainment | Male Income | Female Income |
| Less than High School | - | - |
| High School Diploma | $45,000 | $27,250 |
| College or Associate's Degree | $41,250 | $36,875 |
| Bachelor's Degree | $34,375 | $0 |
| Graduate Degree | - | - |
| Total | $40,500 | $40,833 |
Family Income in Worley
Family Income Brackets in Worley
According to the Worley family income data, there are 14 families falling into the $35,000 to $49,999 income range, which is the most common income bracket and makes up 21.5% of all families. Conversely, the $150,000 to $199,999 income bracket is the least frequent group with only 1 families (1.5%) belonging to this category.
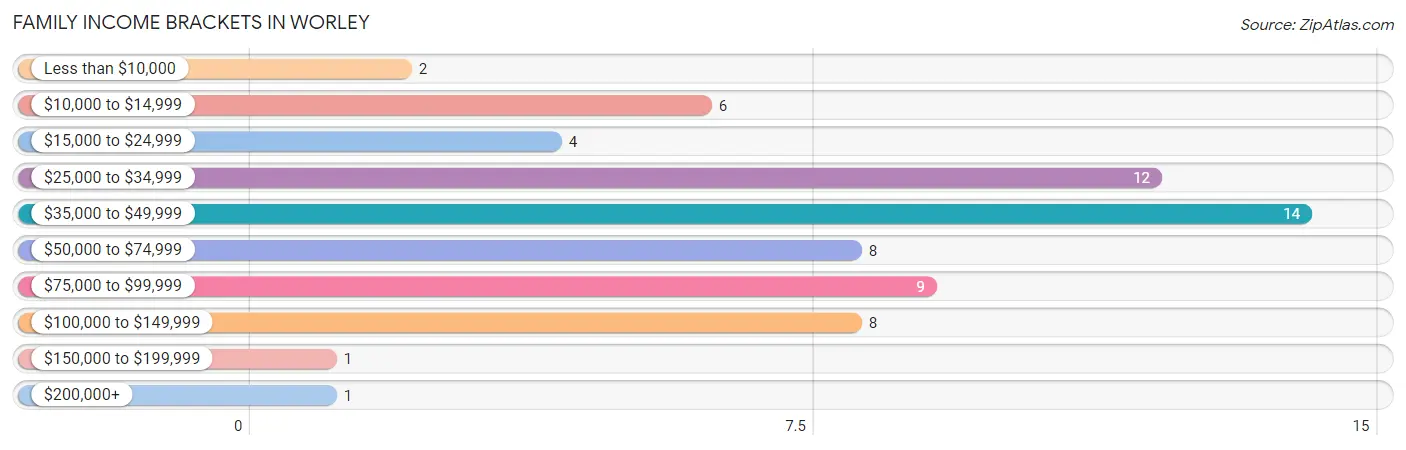
| Income Bracket | # Families | % Families |
| Less than $10,000 | 2 | 3.1% |
| $10,000 to $14,999 | 6 | 9.2% |
| $15,000 to $24,999 | 4 | 6.2% |
| $25,000 to $34,999 | 12 | 18.5% |
| $35,000 to $49,999 | 14 | 21.5% |
| $50,000 to $74,999 | 8 | 12.3% |
| $75,000 to $99,999 | 9 | 13.8% |
| $100,000 to $149,999 | 8 | 12.3% |
| $150,000 to $199,999 | 1 | 1.5% |
| $200,000+ | 1 | 1.5% |
Family Income by Famaliy Size in Worley
5-person families (5 | 7.7%) account for the highest median family income in Worley with $99,375 per family, while 5-person families (5 | 7.7%) have the highest median income of $19,875 per family member.
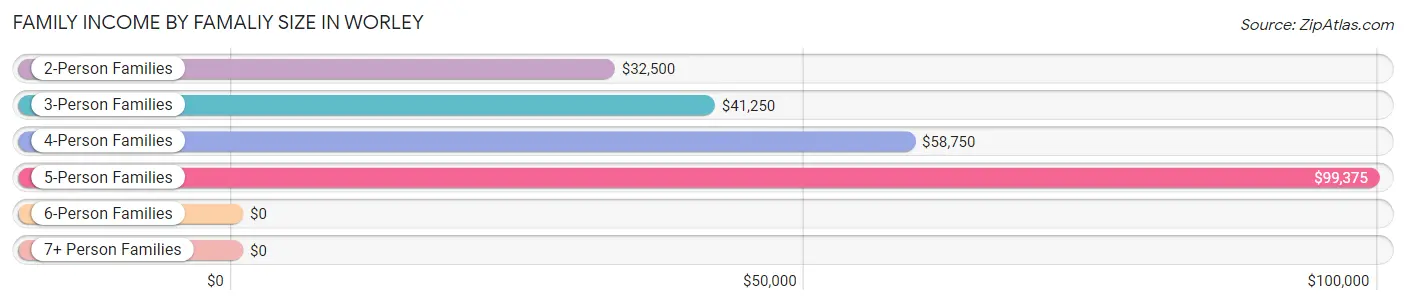
| Income Bracket | # Families | Median Income |
| 2-Person Families | 30 (46.2%) | $32,500 |
| 3-Person Families | 16 (24.6%) | $41,250 |
| 4-Person Families | 8 (12.3%) | $58,750 |
| 5-Person Families | 5 (7.7%) | $99,375 |
| 6-Person Families | 1 (1.5%) | $0 |
| 7+ Person Families | 5 (7.7%) | $0 |
| Total | 65 (100.0%) | $39,792 |
Family Income by Number of Earners in Worley
The median family income in Worley is $39,792, with families comprising 2 earners (15) having the highest median family income of $99,375, while families with no earners (11) have the lowest median family income of $26,875, accounting for 23.1% and 16.9% of families, respectively.
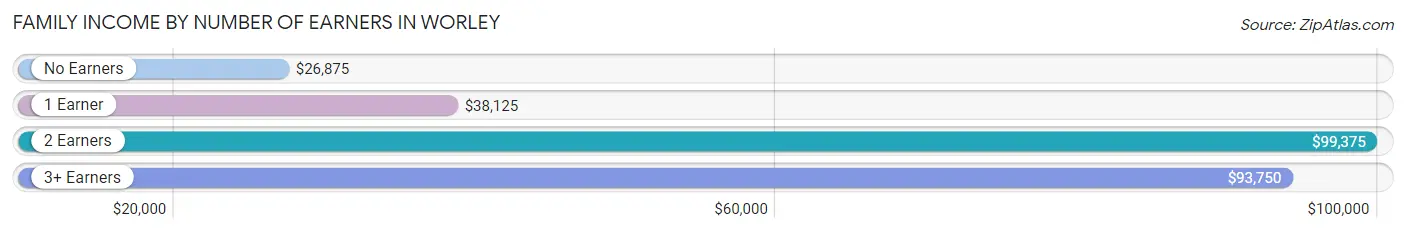
| Number of Earners | # Families | Median Income |
| No Earners | 11 (16.9%) | $26,875 |
| 1 Earner | 33 (50.8%) | $38,125 |
| 2 Earners | 15 (23.1%) | $99,375 |
| 3+ Earners | 6 (9.2%) | $93,750 |
| Total | 65 (100.0%) | $39,792 |
Household Income in Worley
Household Income Brackets in Worley
With 18 households falling in the category, the $35,000 to $49,999 income range is the most frequent in Worley, accounting for 19.8% of all households. In contrast, only 1 households (1.1%) fall into the $150,000 to $199,999 income bracket, making it the least populous group.
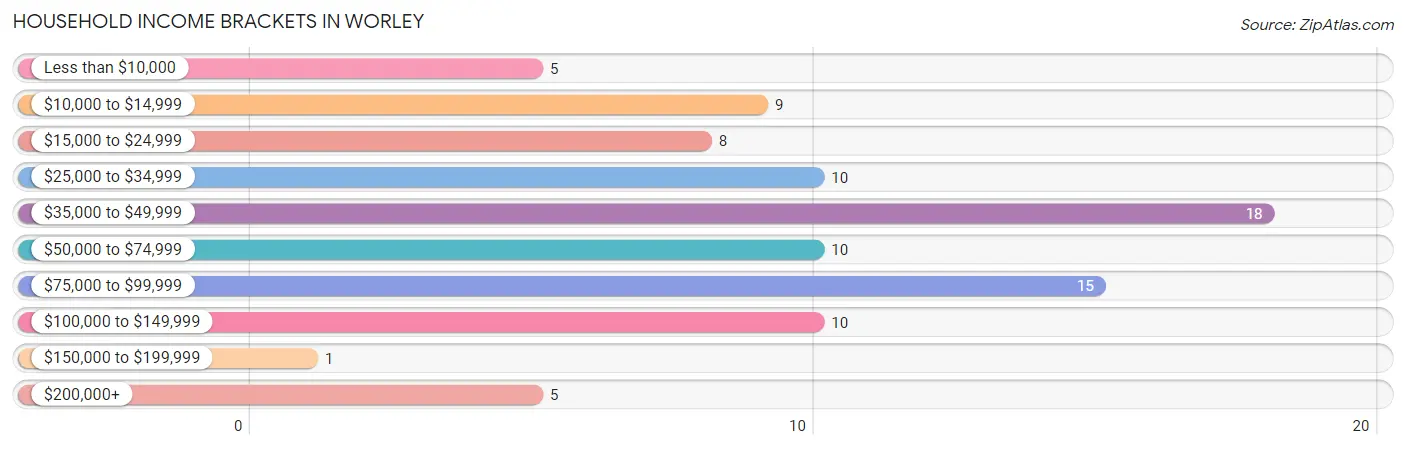
| Income Bracket | # Households | % Households |
| Less than $10,000 | 5 | 5.5% |
| $10,000 to $14,999 | 9 | 9.9% |
| $15,000 to $24,999 | 8 | 8.8% |
| $25,000 to $34,999 | 10 | 11.0% |
| $35,000 to $49,999 | 18 | 19.8% |
| $50,000 to $74,999 | 10 | 11.0% |
| $75,000 to $99,999 | 15 | 16.5% |
| $100,000 to $149,999 | 10 | 11.0% |
| $150,000 to $199,999 | 1 | 1.1% |
| $200,000+ | 5 | 5.5% |
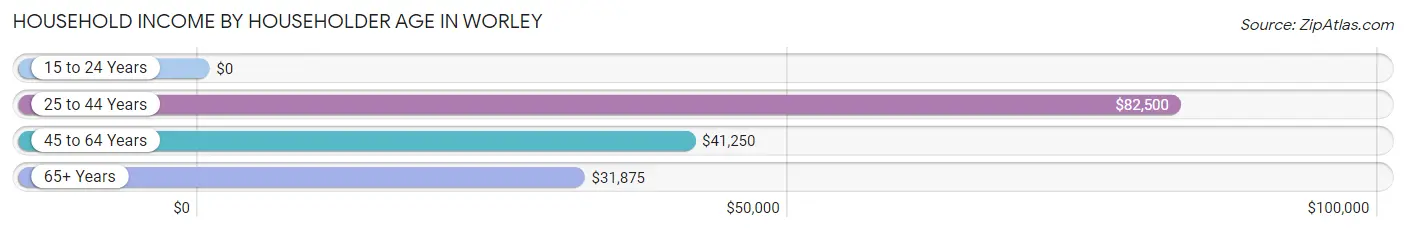
Household Income by Householder Age in Worley
The median household income in Worley is $41,563, with the highest median household income of $82,500 found in the 25 to 44 years age bracket for the primary householder. A total of 26 households (28.6%) fall into this category. Meanwhile, the 15 to 24 years age bracket for the primary householder has the lowest median household income of $0, with 3 households (3.3%) in this group.
| Income Bracket | # Households | Median Income |
| 15 to 24 Years | 3 (3.3%) | $0 |
| 25 to 44 Years | 26 (28.6%) | $82,500 |
| 45 to 64 Years | 42 (46.2%) | $41,250 |
| 65+ Years | 20 (22.0%) | $31,875 |
| Total | 91 (100.0%) | $41,563 |
Poverty in Worley
Income Below Poverty by Sex and Age in Worley
With 15.7% poverty level for males and 25.8% for females among the residents of Worley, 5 year old males and 16 and 17 year old females are the most vulnerable to poverty, with 2 males (100.0%) and 1 females (100.0%) in their respective age groups living below the poverty level.
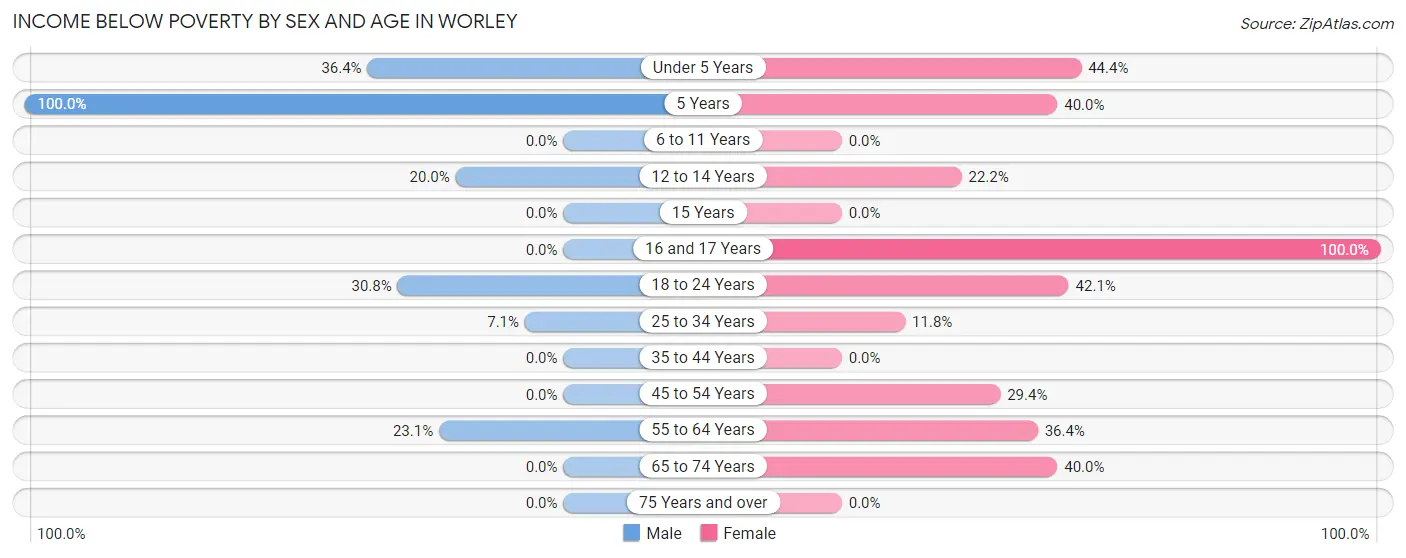
| Age Bracket | Male | Female |
| Under 5 Years | 4 (36.4%) | 4 (44.4%) |
| 5 Years | 2 (100.0%) | 2 (40.0%) |
| 6 to 11 Years | 0 (0.0%) | 0 (0.0%) |
| 12 to 14 Years | 1 (20.0%) | 2 (22.2%) |
| 15 Years | 0 (0.0%) | 0 (0.0%) |
| 16 and 17 Years | 0 (0.0%) | 1 (100.0%) |
| 18 to 24 Years | 4 (30.8%) | 8 (42.1%) |
| 25 to 34 Years | 1 (7.1%) | 2 (11.8%) |
| 35 to 44 Years | 0 (0.0%) | 0 (0.0%) |
| 45 to 54 Years | 0 (0.0%) | 5 (29.4%) |
| 55 to 64 Years | 9 (23.1%) | 4 (36.4%) |
| 65 to 74 Years | 0 (0.0%) | 4 (40.0%) |
| 75 Years and over | 0 (0.0%) | 0 (0.0%) |
| Total | 21 (15.7%) | 32 (25.8%) |
Income Above Poverty by Sex and Age in Worley
According to the poverty statistics in Worley, males aged 6 to 11 years and females aged 6 to 11 years are the age groups that are most secure financially, with 100.0% of males and 100.0% of females in these age groups living above the poverty line.
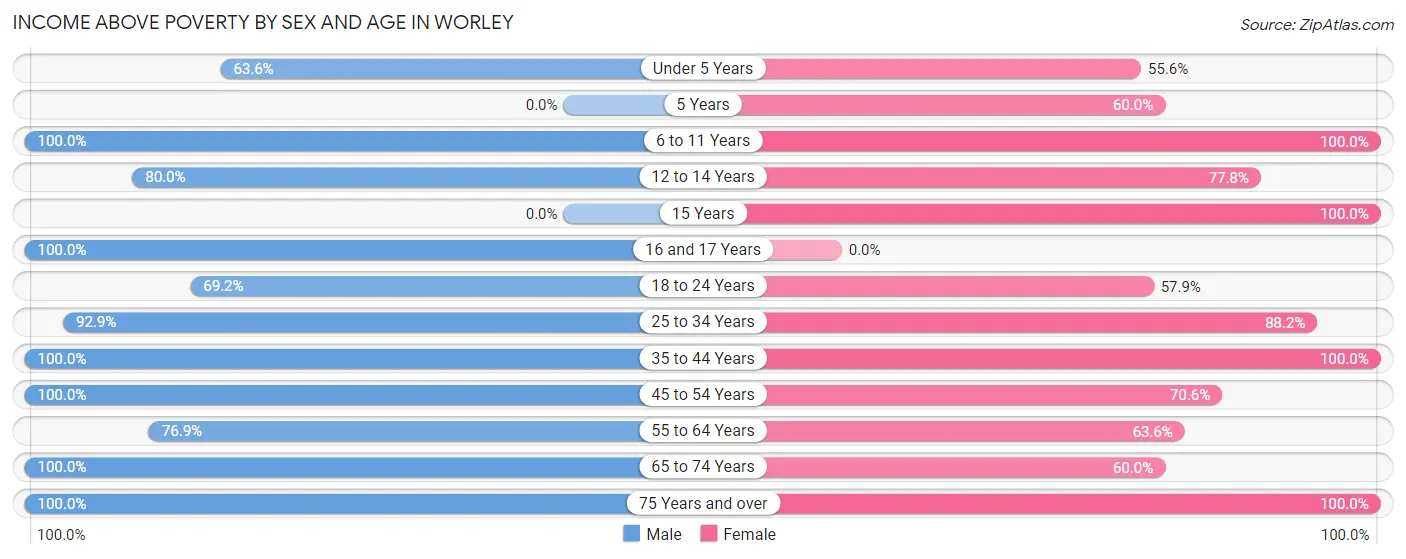
| Age Bracket | Male | Female |
| Under 5 Years | 7 (63.6%) | 5 (55.6%) |
| 5 Years | 0 (0.0%) | 3 (60.0%) |
| 6 to 11 Years | 6 (100.0%) | 9 (100.0%) |
| 12 to 14 Years | 4 (80.0%) | 7 (77.8%) |
| 15 Years | 0 (0.0%) | 5 (100.0%) |
| 16 and 17 Years | 3 (100.0%) | 0 (0.0%) |
| 18 to 24 Years | 9 (69.2%) | 11 (57.9%) |
| 25 to 34 Years | 13 (92.9%) | 15 (88.2%) |
| 35 to 44 Years | 14 (100.0%) | 9 (100.0%) |
| 45 to 54 Years | 8 (100.0%) | 12 (70.6%) |
| 55 to 64 Years | 30 (76.9%) | 7 (63.6%) |
| 65 to 74 Years | 11 (100.0%) | 6 (60.0%) |
| 75 Years and over | 8 (100.0%) | 3 (100.0%) |
| Total | 113 (84.3%) | 92 (74.2%) |
Income Below Poverty Among Married-Couple Families in Worley
The poverty statistics for married-couple families in Worley show that 9.8% or 4 of the total 41 families live below the poverty line. Families with 1 or 2 children have the highest poverty rate of 12.5%, comprising of 2 families. On the other hand, families with 3 or 4 children have the lowest poverty rate of 0.0%, which includes 0 families.
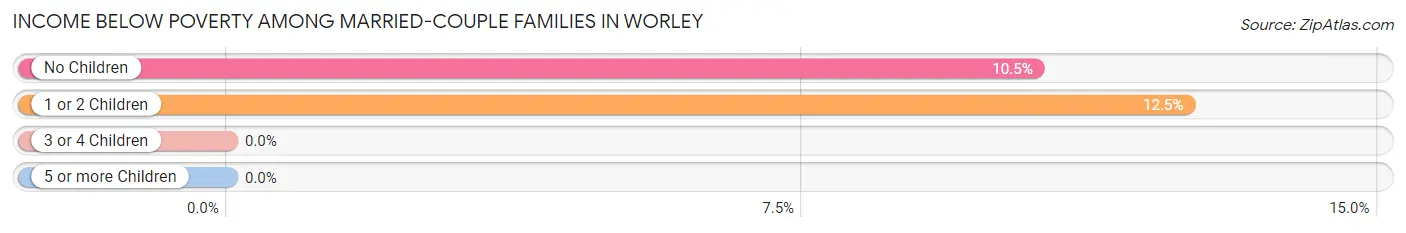
| Children | Above Poverty | Below Poverty |
| No Children | 17 (89.5%) | 2 (10.5%) |
| 1 or 2 Children | 14 (87.5%) | 2 (12.5%) |
| 3 or 4 Children | 6 (100.0%) | 0 (0.0%) |
| 5 or more Children | 0 (0.0%) | 0 (0.0%) |
| Total | 37 (90.2%) | 4 (9.8%) |
Income Below Poverty Among Single-Parent Households in Worley
According to the poverty data in Worley, 7.7% or 1 single-father households and 45.5% or 5 single-mother households are living below the poverty line. Among single-father households, those with 1 or 2 children have the highest poverty rate, with 1 households (11.1%) experiencing poverty. Likewise, among single-mother households, those with 5 or more children have the highest poverty rate, with 2 households (100.0%) falling below the poverty line.
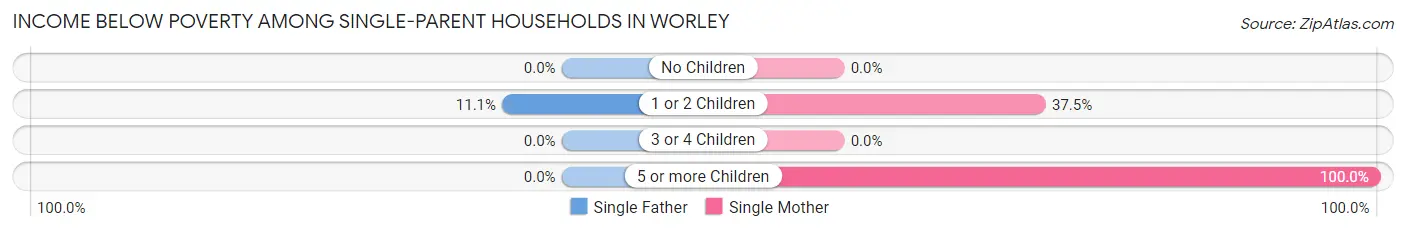
| Children | Single Father | Single Mother |
| No Children | 0 (0.0%) | 0 (0.0%) |
| 1 or 2 Children | 1 (11.1%) | 3 (37.5%) |
| 3 or 4 Children | 0 (0.0%) | 0 (0.0%) |
| 5 or more Children | 0 (0.0%) | 2 (100.0%) |
| Total | 1 (7.7%) | 5 (45.5%) |
Income Below Poverty Among Married-Couple vs Single-Parent Households in Worley
The poverty data for Worley shows that 4 of the married-couple family households (9.8%) and 6 of the single-parent households (25.0%) are living below the poverty level. Within the married-couple family households, those with 1 or 2 children have the highest poverty rate, with 2 households (12.5%) falling below the poverty line. Among the single-parent households, those with 5 or more children have the highest poverty rate, with 2 household (100.0%) living below poverty.
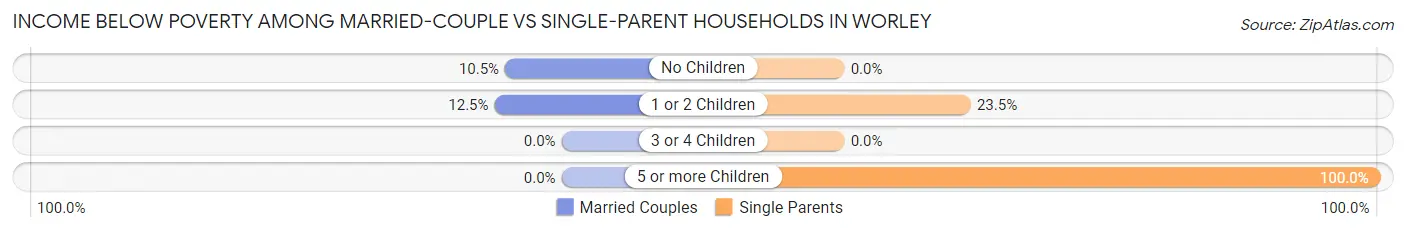
| Children | Married-Couple Families | Single-Parent Households |
| No Children | 2 (10.5%) | 0 (0.0%) |
| 1 or 2 Children | 2 (12.5%) | 4 (23.5%) |
| 3 or 4 Children | 0 (0.0%) | 0 (0.0%) |
| 5 or more Children | 0 (0.0%) | 2 (100.0%) |
| Total | 4 (9.8%) | 6 (25.0%) |
Race in Worley
The most populous races in Worley are White / Caucasian (120 | 46.5%), Native / Alaskan (97 | 37.6%), and Two or more Races (39 | 15.1%).
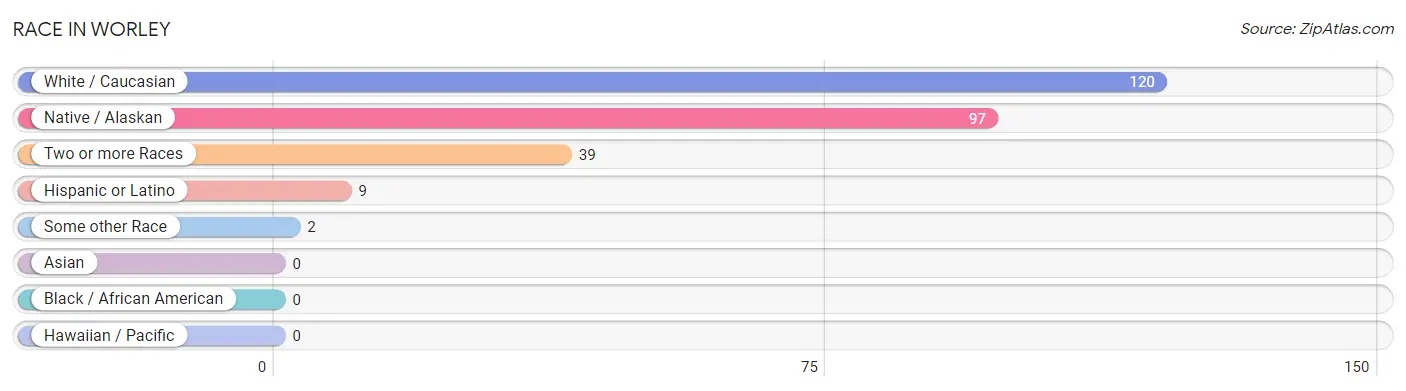
| Race | # Population | % Population |
| Asian | 0 | 0.0% |
| Black / African American | 0 | 0.0% |
| Hawaiian / Pacific | 0 | 0.0% |
| Hispanic or Latino | 9 | 3.5% |
| Native / Alaskan | 97 | 37.6% |
| White / Caucasian | 120 | 46.5% |
| Two or more Races | 39 | 15.1% |
| Some other Race | 2 | 0.8% |
| Total | 258 | 100.0% |
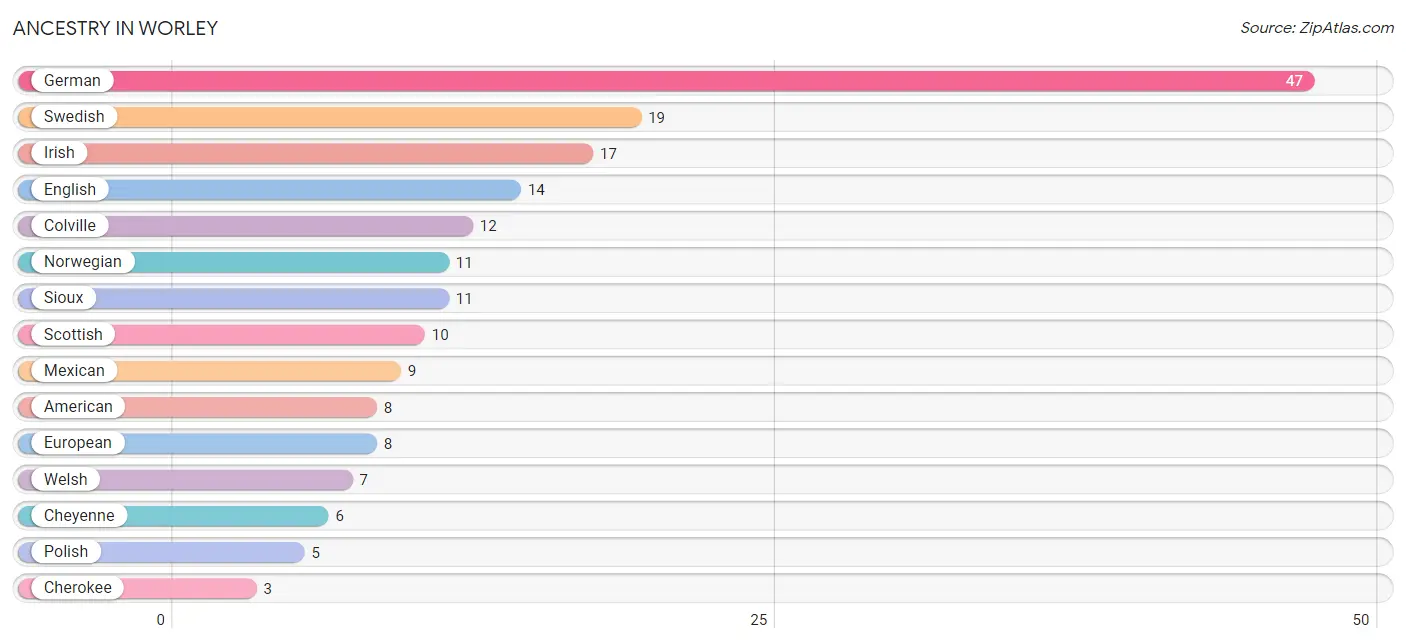
Ancestry in Worley
The most populous ancestries reported in Worley are German (47 | 18.2%), Swedish (19 | 7.4%), Irish (17 | 6.6%), English (14 | 5.4%), and Colville (12 | 4.6%), together accounting for 42.3% of all Worley residents.
| Ancestry | # Population | % Population |
| American | 8 | 3.1% |
| Cherokee | 3 | 1.2% |
| Cheyenne | 6 | 2.3% |
| Chippewa | 2 | 0.8% |
| Choctaw | 2 | 0.8% |
| Colville | 12 | 4.6% |
| Dutch | 2 | 0.8% |
| English | 14 | 5.4% |
| European | 8 | 3.1% |
| French | 2 | 0.8% |
| German | 47 | 18.2% |
| Irish | 17 | 6.6% |
| Italian | 3 | 1.2% |
| Mexican | 9 | 3.5% |
| Navajo | 1 | 0.4% |
| Norwegian | 11 | 4.3% |
| Polish | 5 | 1.9% |
| Scottish | 10 | 3.9% |
| Shoshone | 3 | 1.2% |
| Sioux | 11 | 4.3% |
| Swedish | 19 | 7.4% |
| Thai | 3 | 1.2% |
| Welsh | 7 | 2.7% | View All 23 Rows |
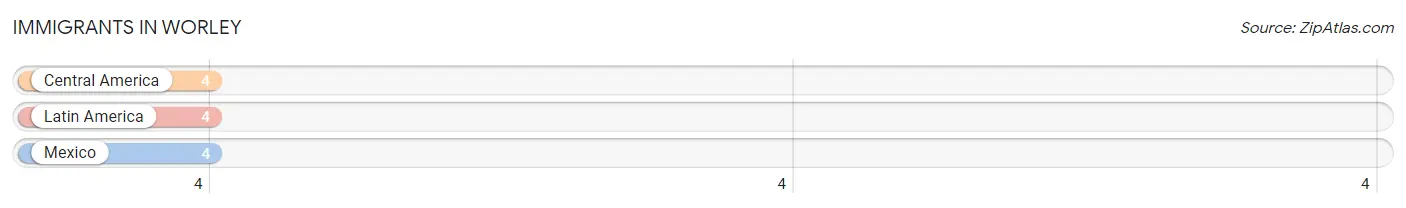
Immigrants in Worley
The most numerous immigrant groups reported in Worley came from Central America (4 | 1.5%), Latin America (4 | 1.5%), and Mexico (4 | 1.5%), together accounting for 4.6% of all Worley residents.
| Immigration Origin | # Population | % Population |
| Central America | 4 | 1.5% |
| Latin America | 4 | 1.5% |
| Mexico | 4 | 1.5% | View All 3 Rows |
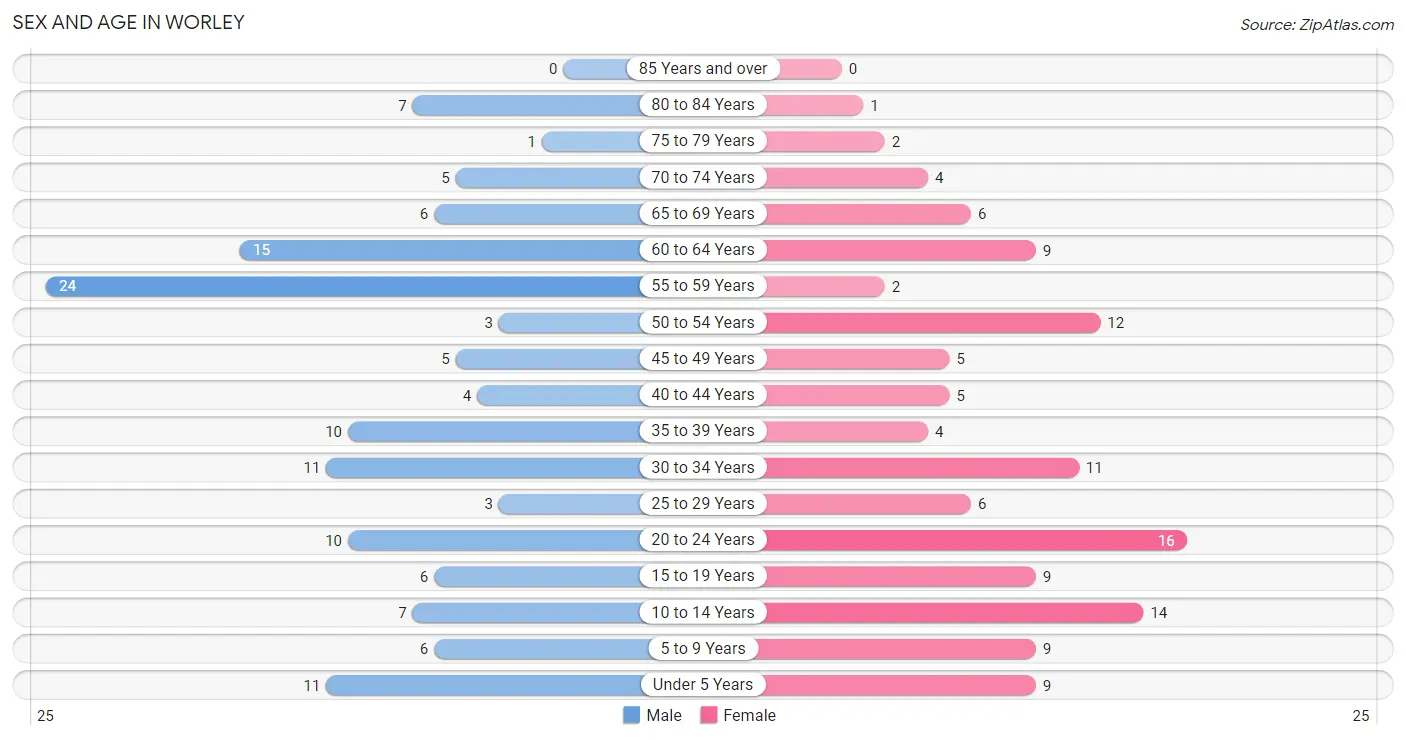
Sex and Age in Worley
Sex and Age in Worley
The most populous age groups in Worley are 55 to 59 Years (24 | 17.9%) for men and 20 to 24 Years (16 | 12.9%) for women.
| Age Bracket | Male | Female |
| Under 5 Years | 11 (8.2%) | 9 (7.3%) |
| 5 to 9 Years | 6 (4.5%) | 9 (7.3%) |
| 10 to 14 Years | 7 (5.2%) | 14 (11.3%) |
| 15 to 19 Years | 6 (4.5%) | 9 (7.3%) |
| 20 to 24 Years | 10 (7.5%) | 16 (12.9%) |
| 25 to 29 Years | 3 (2.2%) | 6 (4.8%) |
| 30 to 34 Years | 11 (8.2%) | 11 (8.9%) |
| 35 to 39 Years | 10 (7.5%) | 4 (3.2%) |
| 40 to 44 Years | 4 (3.0%) | 5 (4.0%) |
| 45 to 49 Years | 5 (3.7%) | 5 (4.0%) |
| 50 to 54 Years | 3 (2.2%) | 12 (9.7%) |
| 55 to 59 Years | 24 (17.9%) | 2 (1.6%) |
| 60 to 64 Years | 15 (11.2%) | 9 (7.3%) |
| 65 to 69 Years | 6 (4.5%) | 6 (4.8%) |
| 70 to 74 Years | 5 (3.7%) | 4 (3.2%) |
| 75 to 79 Years | 1 (0.7%) | 2 (1.6%) |
| 80 to 84 Years | 7 (5.2%) | 1 (0.8%) |
| 85 Years and over | 0 (0.0%) | 0 (0.0%) |
| Total | 134 (100.0%) | 124 (100.0%) |
Families and Households in Worley
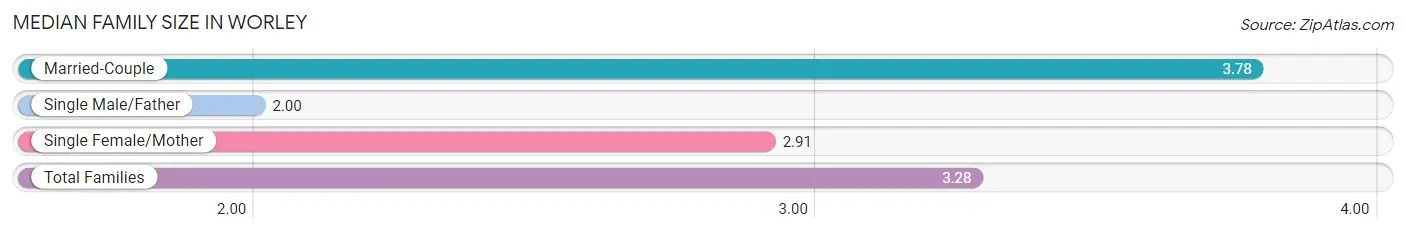
Median Family Size in Worley
The median family size in Worley is 3.28 persons per family, with married-couple families (41 | 63.1%) accounting for the largest median family size of 3.78 persons per family. On the other hand, single male/father families (13 | 20.0%) represent the smallest median family size with 2.00 persons per family.
| Family Type | # Families | Family Size |
| Married-Couple | 41 (63.1%) | 3.78 |
| Single Male/Father | 13 (20.0%) | 2.00 |
| Single Female/Mother | 11 (16.9%) | 2.91 |
| Total Families | 65 (100.0%) | 3.28 |
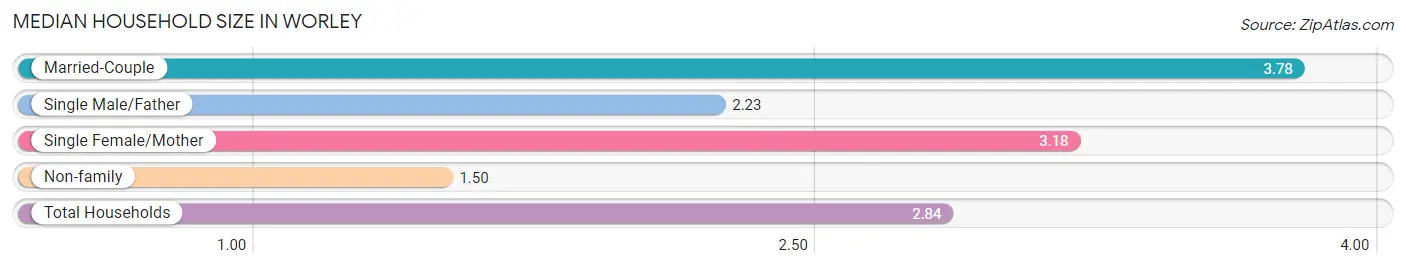
Median Household Size in Worley
The median household size in Worley is 2.84 persons per household, with married-couple households (41 | 45.1%) accounting for the largest median household size of 3.78 persons per household. non-family households (26 | 28.6%) represent the smallest median household size with 1.50 persons per household.
| Household Type | # Households | Household Size |
| Married-Couple | 41 (45.1%) | 3.78 |
| Single Male/Father | 13 (14.3%) | 2.23 |
| Single Female/Mother | 11 (12.1%) | 3.18 |
| Non-family | 26 (28.6%) | 1.50 |
| Total Households | 91 (100.0%) | 2.84 |
Household Size by Marriage Status in Worley
Out of a total of 91 households in Worley, 65 (71.4%) are family households, while 26 (28.6%) are nonfamily households. The most numerous type of family households are 2-person households, comprising 25, and the most common type of nonfamily households are 1-person households, comprising 20.
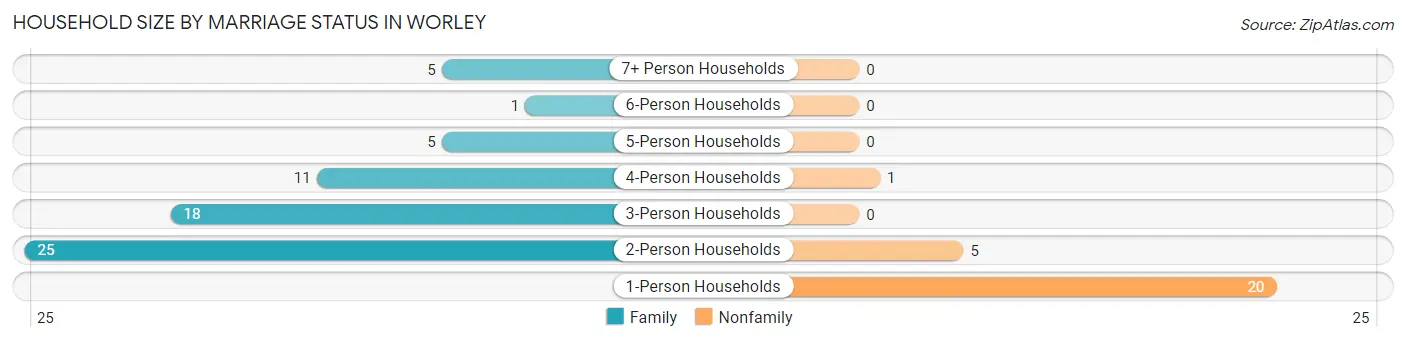
| Household Size | Family Households | Nonfamily Households |
| 1-Person Households | - | 20 (22.0%) |
| 2-Person Households | 25 (27.5%) | 5 (5.5%) |
| 3-Person Households | 18 (19.8%) | 0 (0.0%) |
| 4-Person Households | 11 (12.1%) | 1 (1.1%) |
| 5-Person Households | 5 (5.5%) | 0 (0.0%) |
| 6-Person Households | 1 (1.1%) | 0 (0.0%) |
| 7+ Person Households | 5 (5.5%) | 0 (0.0%) |
| Total | 65 (71.4%) | 26 (28.6%) |
Female Fertility in Worley
Fertility by Age in Worley
Average fertility rate in Worley is 86.0 births per 1,000 women. Women in the age bracket of 20 to 34 years have the highest fertility rate with 152.0 births per 1,000 women. Women in the age bracket of 20 to 34 years acount for 100.0% of all women with births.
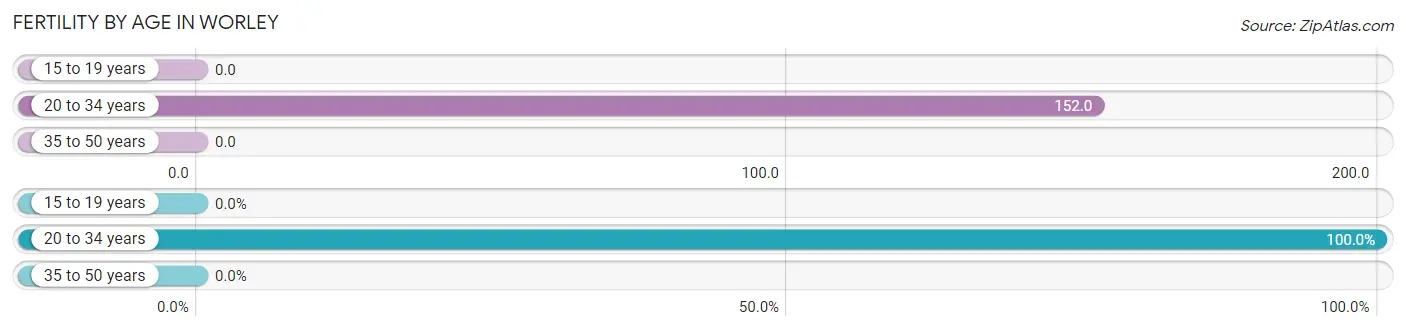
| Age Bracket | Women with Births | Births / 1,000 Women |
| 15 to 19 years | 0 (0.0%) | 0.0 |
| 20 to 34 years | 5 (100.0%) | 152.0 |
| 35 to 50 years | 0 (0.0%) | 0.0 |
| Total | 5 (100.0%) | 86.0 |
Fertility by Age by Marriage Status in Worley
60.0% of women with births (5) in Worley are married. The highest percentage of unmarried women with births falls into 20 to 34 years age bracket with 40.0% of them unmarried at the time of birth, while the lowest percentage of unmarried women with births belong to 20 to 34 years age bracket with 40.0% of them unmarried.
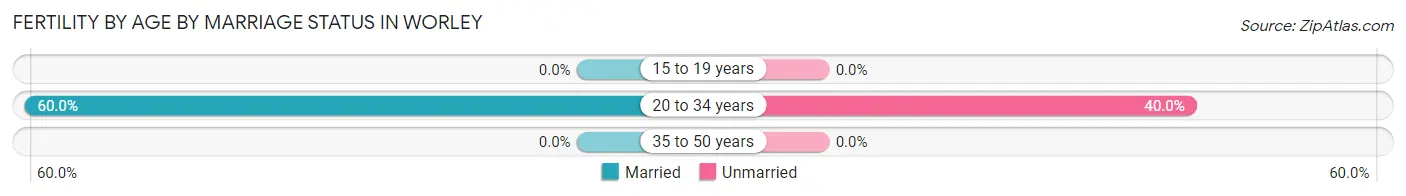
| Age Bracket | Married | Unmarried |
| 15 to 19 years | 0 (0.0%) | 0 (0.0%) |
| 20 to 34 years | 3 (60.0%) | 2 (40.0%) |
| 35 to 50 years | 0 (0.0%) | 0 (0.0%) |
| Total | 3 (60.0%) | 2 (40.0%) |
Fertility by Education in Worley
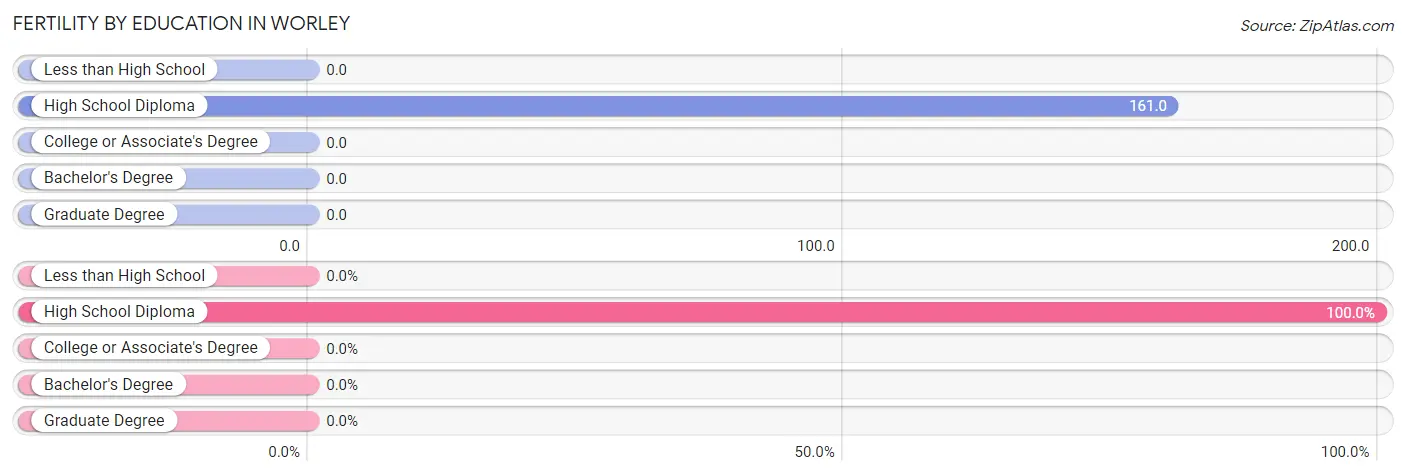
| Educational Attainment | Women with Births | Births / 1,000 Women |
| Less than High School | 0 (0.0%) | 0.0 |
| High School Diploma | 5 (100.0%) | 161.0 |
| College or Associate's Degree | 0 (0.0%) | 0.0 |
| Bachelor's Degree | 0 (0.0%) | 0.0 |
| Graduate Degree | 0 (0.0%) | 0.0 |
| Total | 5 (100.0%) | 86.0 |
Fertility by Education by Marriage Status in Worley
40.0% of women with births in Worley are unmarried. Women with the educational attainment of high school diploma are most likely to be married with 60.0% of them married at childbirth, while women with the educational attainment of high school diploma are least likely to be married with 40.0% of them unmarried at childbirth.
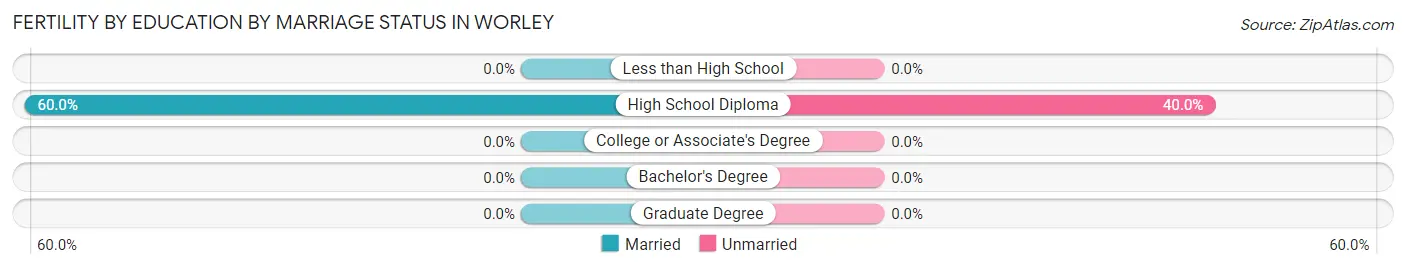
| Educational Attainment | Married | Unmarried |
| Less than High School | 0 (0.0%) | 0 (0.0%) |
| High School Diploma | 3 (60.0%) | 2 (40.0%) |
| College or Associate's Degree | 0 (0.0%) | 0 (0.0%) |
| Bachelor's Degree | 0 (0.0%) | 0 (0.0%) |
| Graduate Degree | 0 (0.0%) | 0 (0.0%) |
| Total | 3 (60.0%) | 2 (40.0%) |
Employment Characteristics in Worley
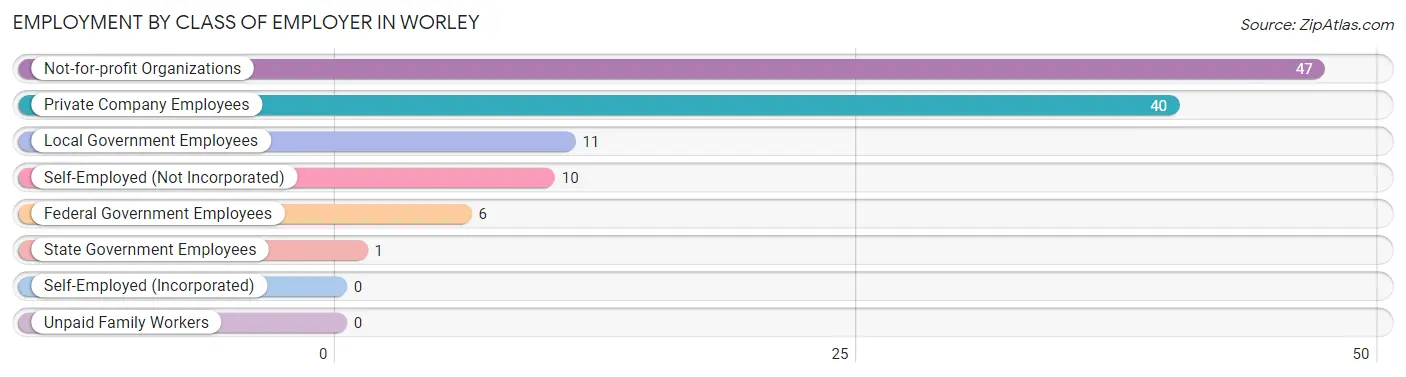
Employment by Class of Employer in Worley
Among the 115 employed individuals in Worley, not-for-profit organizations (47 | 40.9%), private company employees (40 | 34.8%), and local government employees (11 | 9.6%) make up the most common classes of employment.
| Employer Class | # Employees | % Employees |
| Private Company Employees | 40 | 34.8% |
| Self-Employed (Incorporated) | 0 | 0.0% |
| Self-Employed (Not Incorporated) | 10 | 8.7% |
| Not-for-profit Organizations | 47 | 40.9% |
| Local Government Employees | 11 | 9.6% |
| State Government Employees | 1 | 0.9% |
| Federal Government Employees | 6 | 5.2% |
| Unpaid Family Workers | 0 | 0.0% |
| Total | 115 | 100.0% |
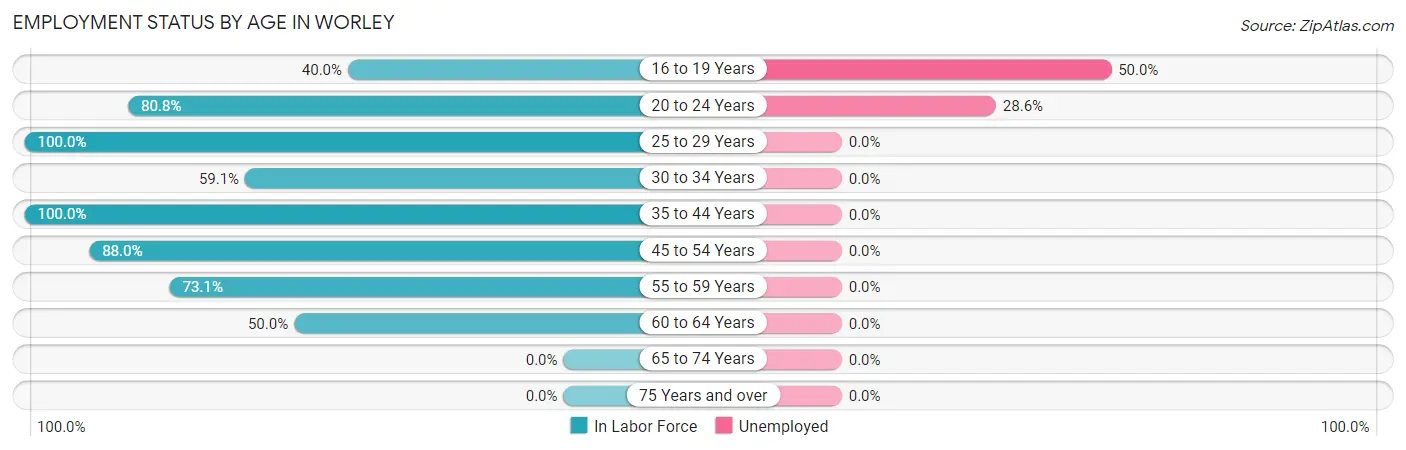
Employment Status by Age in Worley
According to the labor force statistics for Worley, out of the total population over 16 years of age (197), 62.4% or 123 individuals are in the labor force, with 6.5% or 8 of them unemployed. The age group with the highest labor force participation rate is 25 to 29 years, with 100.0% or 9 individuals in the labor force. Within the labor force, the 16 to 19 years age range has the highest percentage of unemployed individuals, with 50.0% or 2 of them being unemployed.
| Age Bracket | In Labor Force | Unemployed |
| 16 to 19 Years | 4 (40.0%) | 2 (50.0%) |
| 20 to 24 Years | 21 (80.8%) | 6 (28.6%) |
| 25 to 29 Years | 9 (100.0%) | 0 (0.0%) |
| 30 to 34 Years | 13 (59.1%) | 0 (0.0%) |
| 35 to 44 Years | 23 (100.0%) | 0 (0.0%) |
| 45 to 54 Years | 22 (88.0%) | 0 (0.0%) |
| 55 to 59 Years | 19 (73.1%) | 0 (0.0%) |
| 60 to 64 Years | 12 (50.0%) | 0 (0.0%) |
| 65 to 74 Years | 0 (0.0%) | 0 (0.0%) |
| 75 Years and over | 0 (0.0%) | 0 (0.0%) |
| Total | 123 (62.4%) | 8 (6.5%) |
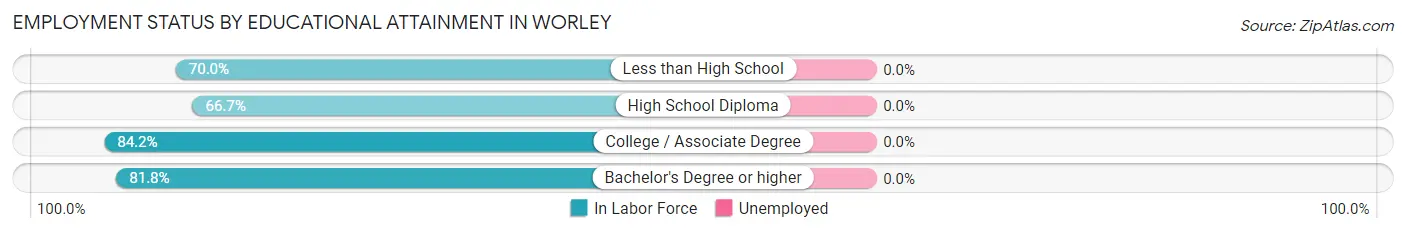
Employment Status by Educational Attainment in Worley
| Educational Attainment | In Labor Force | Unemployed |
| Less than High School | 7 (70.0%) | 0 (0.0%) |
| High School Diploma | 34 (66.7%) | 0 (0.0%) |
| College / Associate Degree | 48 (84.2%) | 0 (0.0%) |
| Bachelor's Degree or higher | 9 (81.8%) | 0 (0.0%) |
| Total | 98 (76.0%) | 0 (0.0%) |
Employment Occupations by Sex in Worley
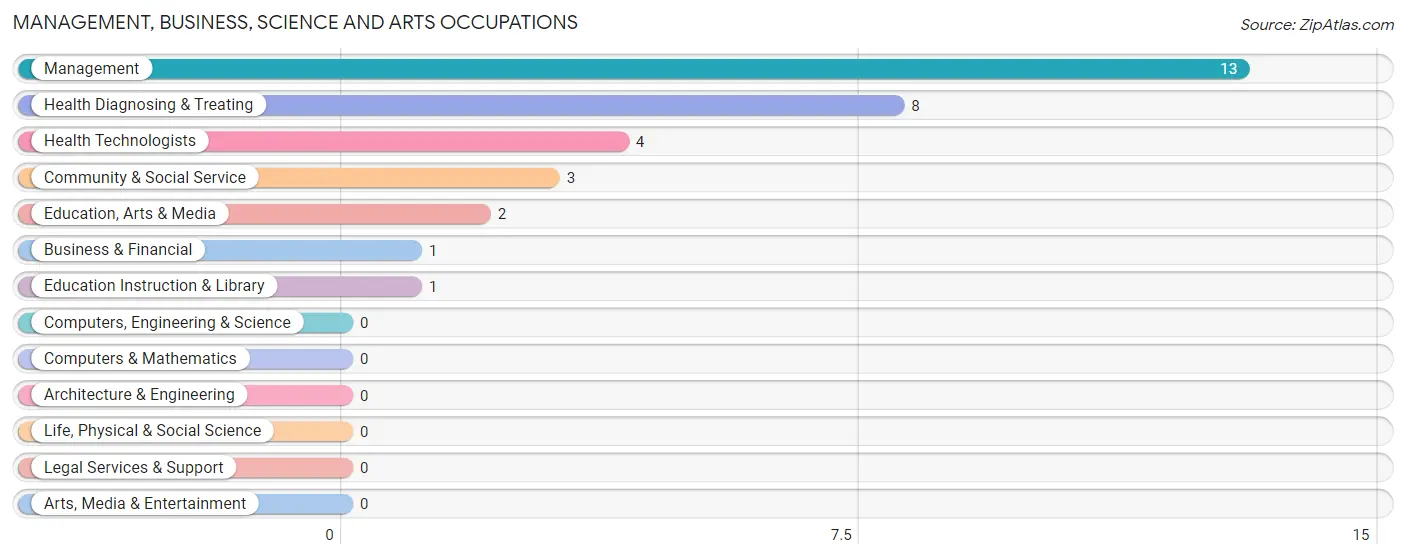
Management, Business, Science and Arts Occupations
The most common Management, Business, Science and Arts occupations in Worley are Management (13 | 11.3%), Health Diagnosing & Treating (8 | 7.0%), Health Technologists (4 | 3.5%), Community & Social Service (3 | 2.6%), and Education, Arts & Media (2 | 1.7%).
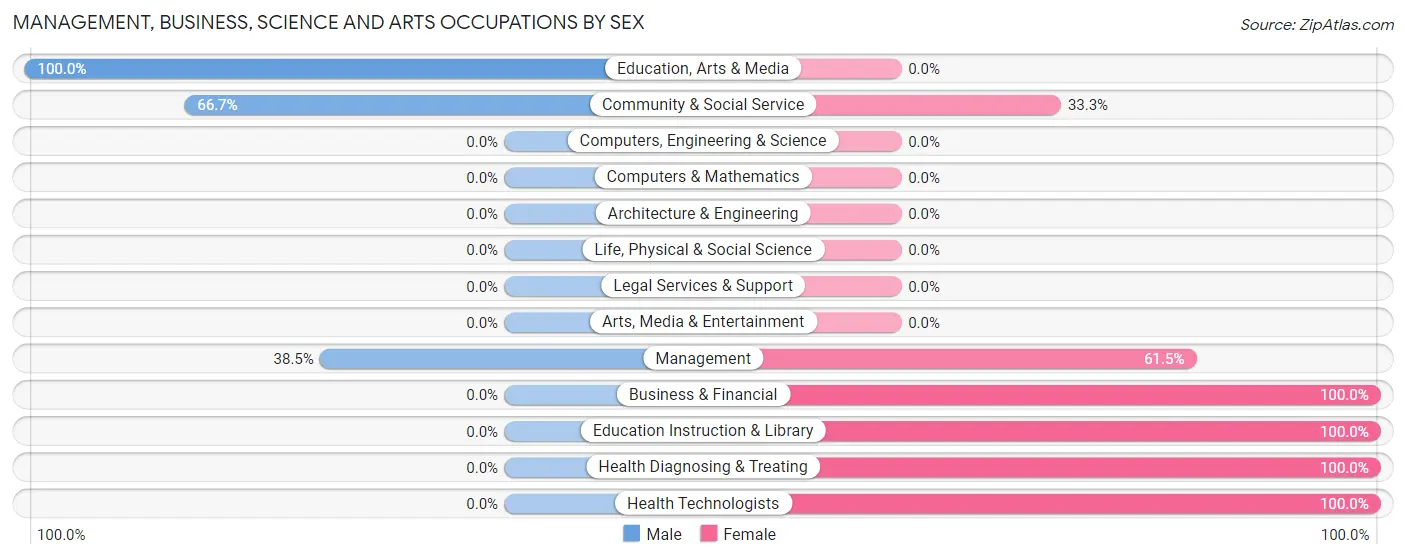
Management, Business, Science and Arts Occupations by Sex
Within the Management, Business, Science and Arts occupations in Worley, the most male-oriented occupations are Education, Arts & Media (100.0%), Community & Social Service (66.7%), and Management (38.5%), while the most female-oriented occupations are Business & Financial (100.0%), Education Instruction & Library (100.0%), and Health Diagnosing & Treating (100.0%).
| Occupation | Male | Female |
| Management | 5 (38.5%) | 8 (61.5%) |
| Business & Financial | 0 (0.0%) | 1 (100.0%) |
| Computers, Engineering & Science | 0 (0.0%) | 0 (0.0%) |
| Computers & Mathematics | 0 (0.0%) | 0 (0.0%) |
| Architecture & Engineering | 0 (0.0%) | 0 (0.0%) |
| Life, Physical & Social Science | 0 (0.0%) | 0 (0.0%) |
| Community & Social Service | 2 (66.7%) | 1 (33.3%) |
| Education, Arts & Media | 2 (100.0%) | 0 (0.0%) |
| Legal Services & Support | 0 (0.0%) | 0 (0.0%) |
| Education Instruction & Library | 0 (0.0%) | 1 (100.0%) |
| Arts, Media & Entertainment | 0 (0.0%) | 0 (0.0%) |
| Health Diagnosing & Treating | 0 (0.0%) | 8 (100.0%) |
| Health Technologists | 0 (0.0%) | 4 (100.0%) |
| Total (Category) | 7 (28.0%) | 18 (72.0%) |
| Total (Overall) | 57 (49.6%) | 58 (50.4%) |
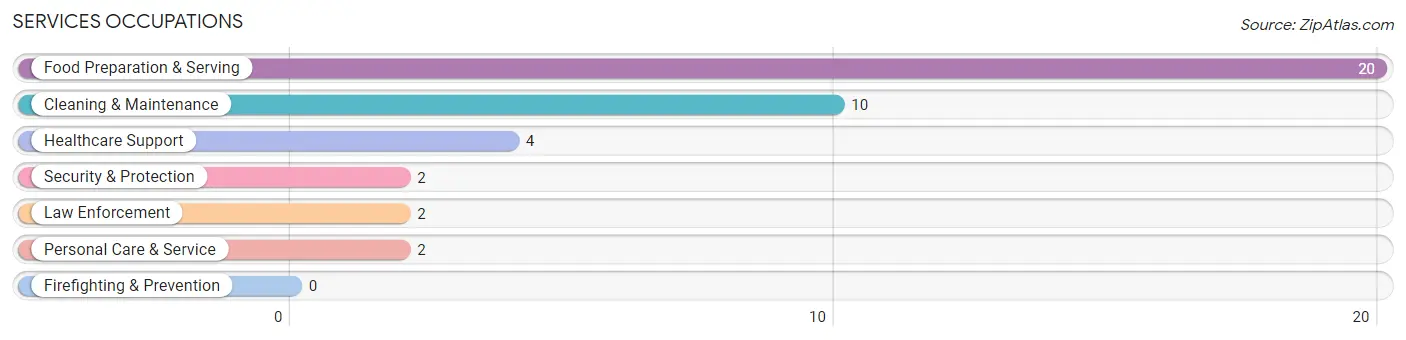
Services Occupations
The most common Services occupations in Worley are Food Preparation & Serving (20 | 17.4%), Cleaning & Maintenance (10 | 8.7%), Healthcare Support (4 | 3.5%), Security & Protection (2 | 1.7%), and Law Enforcement (2 | 1.7%).
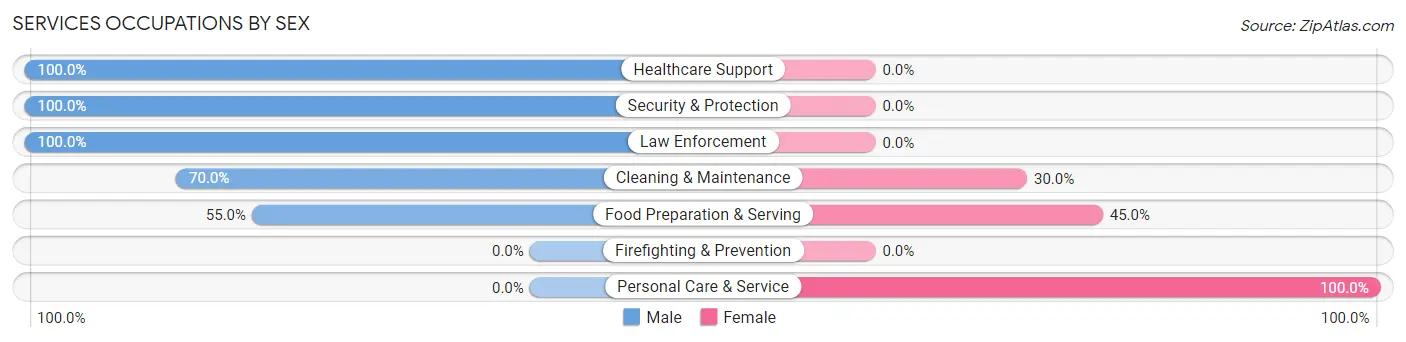
Services Occupations by Sex
Within the Services occupations in Worley, the most male-oriented occupations are Healthcare Support (100.0%), Security & Protection (100.0%), and Law Enforcement (100.0%), while the most female-oriented occupations are Personal Care & Service (100.0%), Food Preparation & Serving (45.0%), and Cleaning & Maintenance (30.0%).
| Occupation | Male | Female |
| Healthcare Support | 4 (100.0%) | 0 (0.0%) |
| Security & Protection | 2 (100.0%) | 0 (0.0%) |
| Firefighting & Prevention | 0 (0.0%) | 0 (0.0%) |
| Law Enforcement | 2 (100.0%) | 0 (0.0%) |
| Food Preparation & Serving | 11 (55.0%) | 9 (45.0%) |
| Cleaning & Maintenance | 7 (70.0%) | 3 (30.0%) |
| Personal Care & Service | 0 (0.0%) | 2 (100.0%) |
| Total (Category) | 24 (63.2%) | 14 (36.8%) |
| Total (Overall) | 57 (49.6%) | 58 (50.4%) |
Sales and Office Occupations
The most common Sales and Office occupations in Worley are Office & Administration (16 | 13.9%), and Sales & Related (7 | 6.1%).
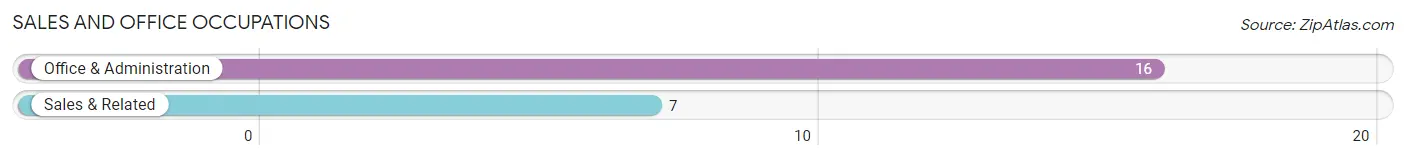
Sales and Office Occupations by Sex
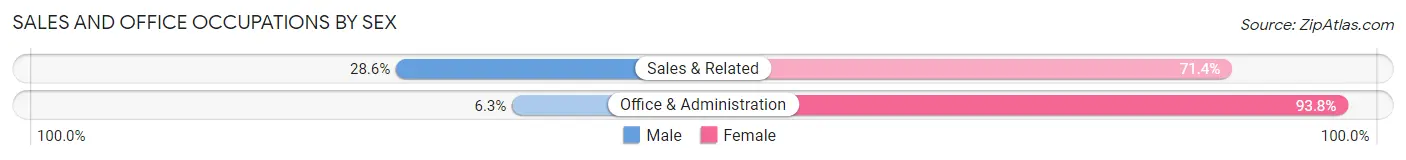
| Occupation | Male | Female |
| Sales & Related | 2 (28.6%) | 5 (71.4%) |
| Office & Administration | 1 (6.2%) | 15 (93.8%) |
| Total (Category) | 3 (13.0%) | 20 (87.0%) |
| Total (Overall) | 57 (49.6%) | 58 (50.4%) |
Natural Resources, Construction and Maintenance Occupations
The most common Natural Resources, Construction and Maintenance occupations in Worley are Installation, Maintenance & Repair (10 | 8.7%), Construction & Extraction (8 | 7.0%), and Farming, Fishing & Forestry (5 | 4.3%).
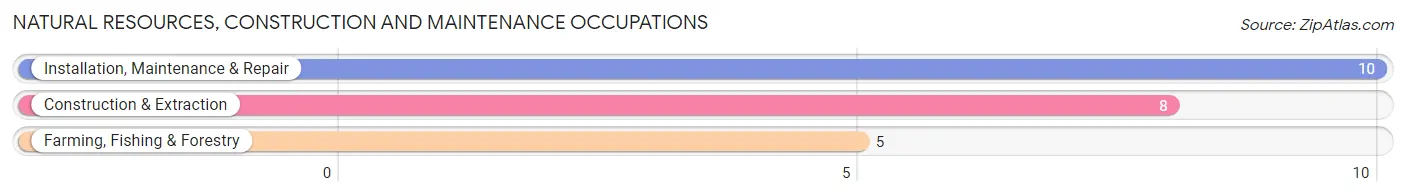
Natural Resources, Construction and Maintenance Occupations by Sex
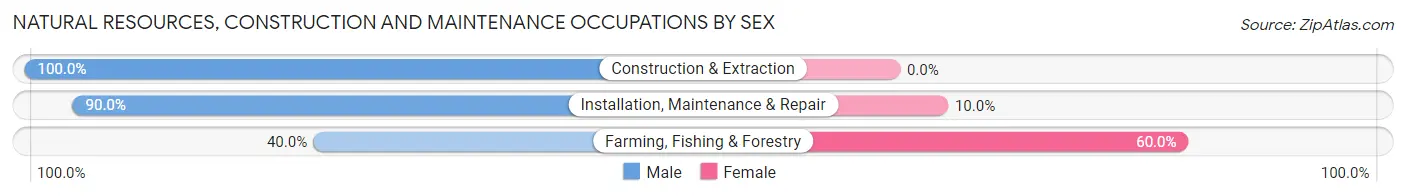
| Occupation | Male | Female |
| Farming, Fishing & Forestry | 2 (40.0%) | 3 (60.0%) |
| Construction & Extraction | 8 (100.0%) | 0 (0.0%) |
| Installation, Maintenance & Repair | 9 (90.0%) | 1 (10.0%) |
| Total (Category) | 19 (82.6%) | 4 (17.4%) |
| Total (Overall) | 57 (49.6%) | 58 (50.4%) |
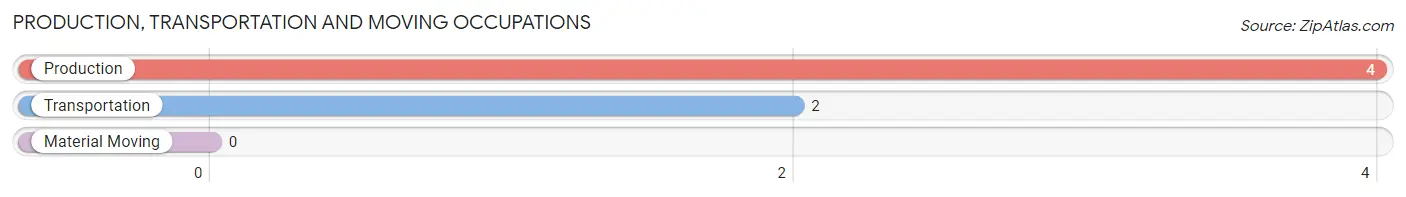
Production, Transportation and Moving Occupations
The most common Production, Transportation and Moving occupations in Worley are Production (4 | 3.5%), and Transportation (2 | 1.7%).
Production, Transportation and Moving Occupations by Sex
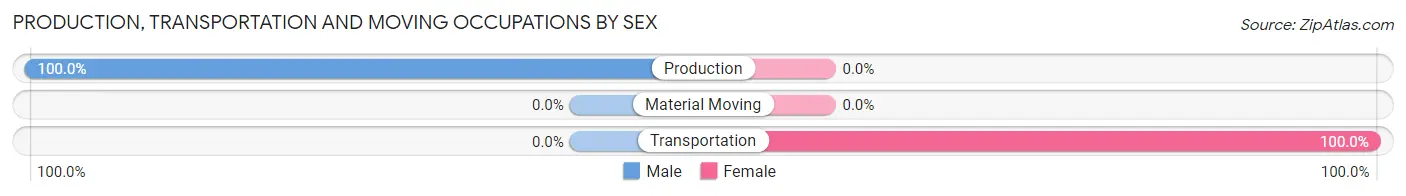
| Occupation | Male | Female |
| Production | 4 (100.0%) | 0 (0.0%) |
| Transportation | 0 (0.0%) | 2 (100.0%) |
| Material Moving | 0 (0.0%) | 0 (0.0%) |
| Total (Category) | 4 (66.7%) | 2 (33.3%) |
| Total (Overall) | 57 (49.6%) | 58 (50.4%) |
Employment Industries by Sex in Worley
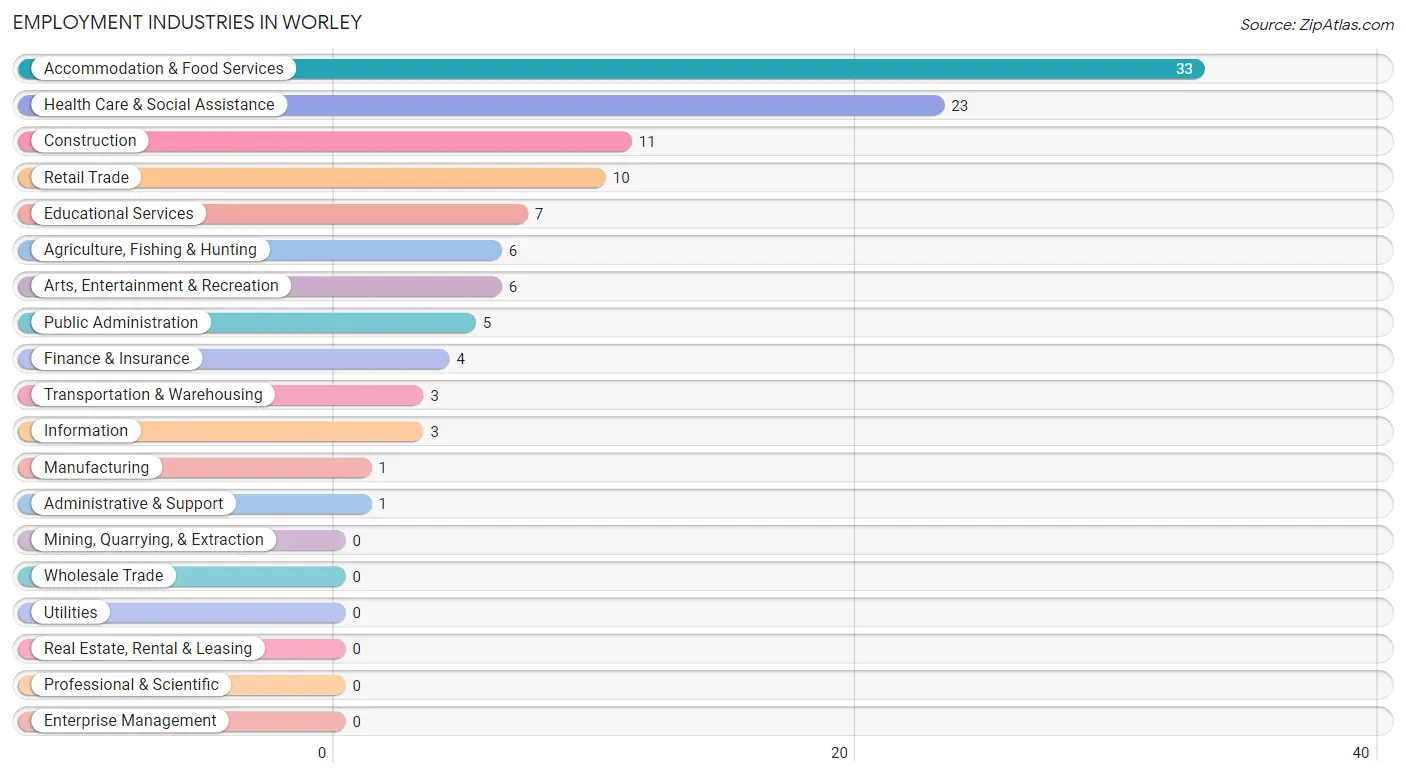
Employment Industries in Worley
The major employment industries in Worley include Accommodation & Food Services (33 | 28.7%), Health Care & Social Assistance (23 | 20.0%), Construction (11 | 9.6%), Retail Trade (10 | 8.7%), and Educational Services (7 | 6.1%).
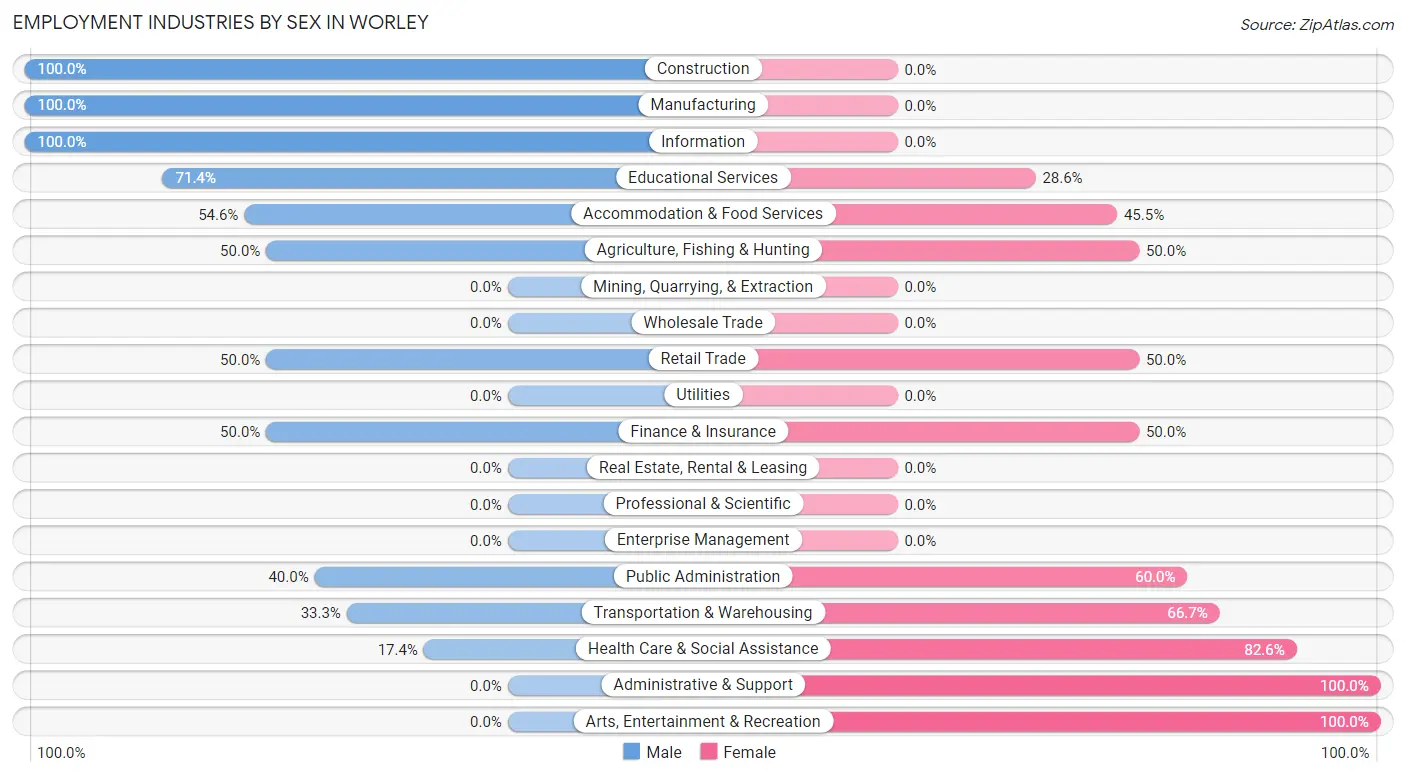
Employment Industries by Sex in Worley
The Worley industries that see more men than women are Construction (100.0%), Manufacturing (100.0%), and Information (100.0%), whereas the industries that tend to have a higher number of women are Administrative & Support (100.0%), Arts, Entertainment & Recreation (100.0%), and Health Care & Social Assistance (82.6%).
| Industry | Male | Female |
| Agriculture, Fishing & Hunting | 3 (50.0%) | 3 (50.0%) |
| Mining, Quarrying, & Extraction | 0 (0.0%) | 0 (0.0%) |
| Construction | 11 (100.0%) | 0 (0.0%) |
| Manufacturing | 1 (100.0%) | 0 (0.0%) |
| Wholesale Trade | 0 (0.0%) | 0 (0.0%) |
| Retail Trade | 5 (50.0%) | 5 (50.0%) |
| Transportation & Warehousing | 1 (33.3%) | 2 (66.7%) |
| Utilities | 0 (0.0%) | 0 (0.0%) |
| Information | 3 (100.0%) | 0 (0.0%) |
| Finance & Insurance | 2 (50.0%) | 2 (50.0%) |
| Real Estate, Rental & Leasing | 0 (0.0%) | 0 (0.0%) |
| Professional & Scientific | 0 (0.0%) | 0 (0.0%) |
| Enterprise Management | 0 (0.0%) | 0 (0.0%) |
| Administrative & Support | 0 (0.0%) | 1 (100.0%) |
| Educational Services | 5 (71.4%) | 2 (28.6%) |
| Health Care & Social Assistance | 4 (17.4%) | 19 (82.6%) |
| Arts, Entertainment & Recreation | 0 (0.0%) | 6 (100.0%) |
| Accommodation & Food Services | 18 (54.5%) | 15 (45.5%) |
| Public Administration | 2 (40.0%) | 3 (60.0%) |
| Total | 57 (49.6%) | 58 (50.4%) |
Education in Worley
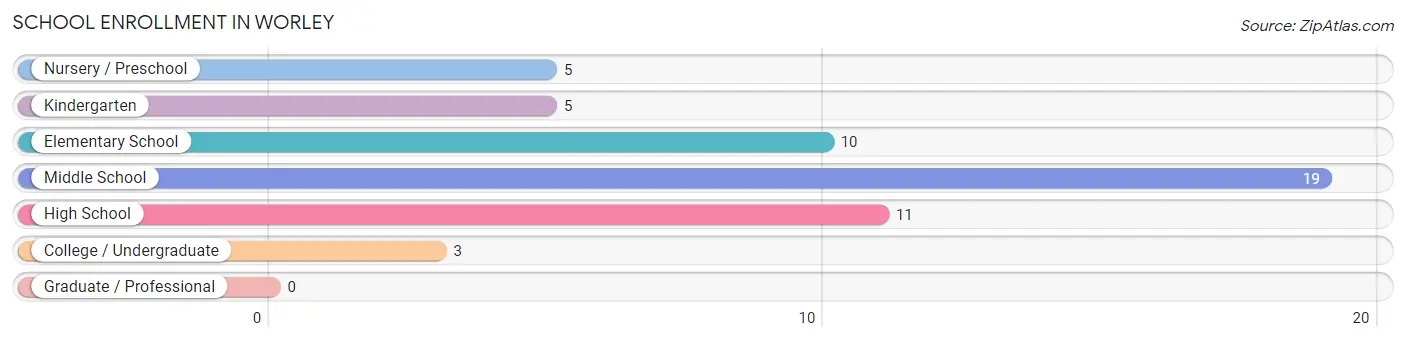
School Enrollment in Worley
The most common levels of schooling among the 53 students in Worley are middle school (19 | 35.8%), high school (11 | 20.7%), and elementary school (10 | 18.9%).
| School Level | # Students | % Students |
| Nursery / Preschool | 5 | 9.4% |
| Kindergarten | 5 | 9.4% |
| Elementary School | 10 | 18.9% |
| Middle School | 19 | 35.8% |
| High School | 11 | 20.7% |
| College / Undergraduate | 3 | 5.7% |
| Graduate / Professional | 0 | 0.0% |
| Total | 53 | 100.0% |
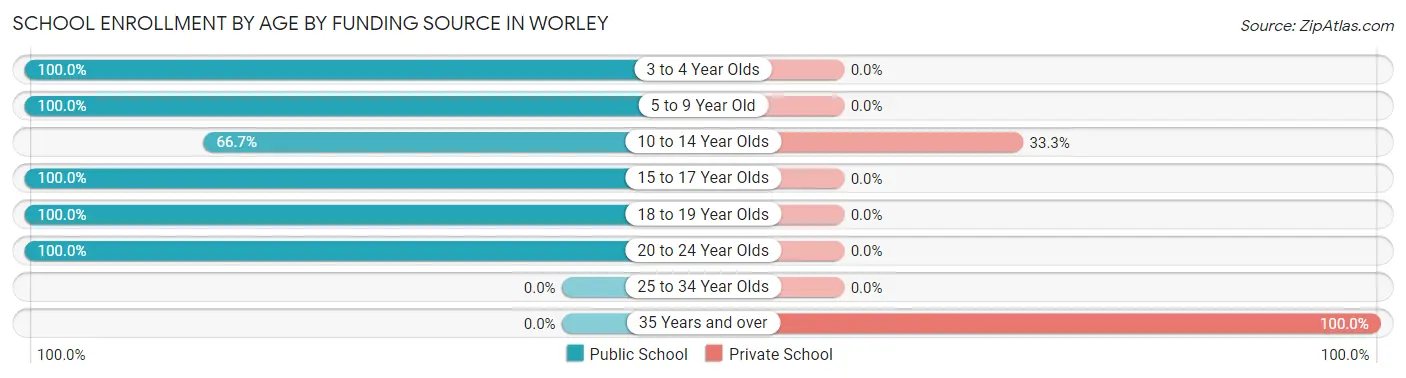
School Enrollment by Age by Funding Source in Worley
Out of a total of 53 students who are enrolled in schools in Worley, 8 (15.1%) attend a private institution, while the remaining 45 (84.9%) are enrolled in public schools. The age group of 35 years and over has the highest likelihood of being enrolled in private schools, with 1 (100.0% in the age bracket) enrolled. Conversely, the age group of 3 to 4 year olds has the lowest likelihood of being enrolled in a private school, with 5 (100.0% in the age bracket) attending a public institution.
| Age Bracket | Public School | Private School |
| 3 to 4 Year Olds | 5 (100.0%) | 0 (0.0%) |
| 5 to 9 Year Old | 13 (100.0%) | 0 (0.0%) |
| 10 to 14 Year Olds | 14 (66.7%) | 7 (33.3%) |
| 15 to 17 Year Olds | 9 (100.0%) | 0 (0.0%) |
| 18 to 19 Year Olds | 2 (100.0%) | 0 (0.0%) |
| 20 to 24 Year Olds | 2 (100.0%) | 0 (0.0%) |
| 25 to 34 Year Olds | 0 (0.0%) | 0 (0.0%) |
| 35 Years and over | 0 (0.0%) | 1 (100.0%) |
| Total | 45 (84.9%) | 8 (15.1%) |
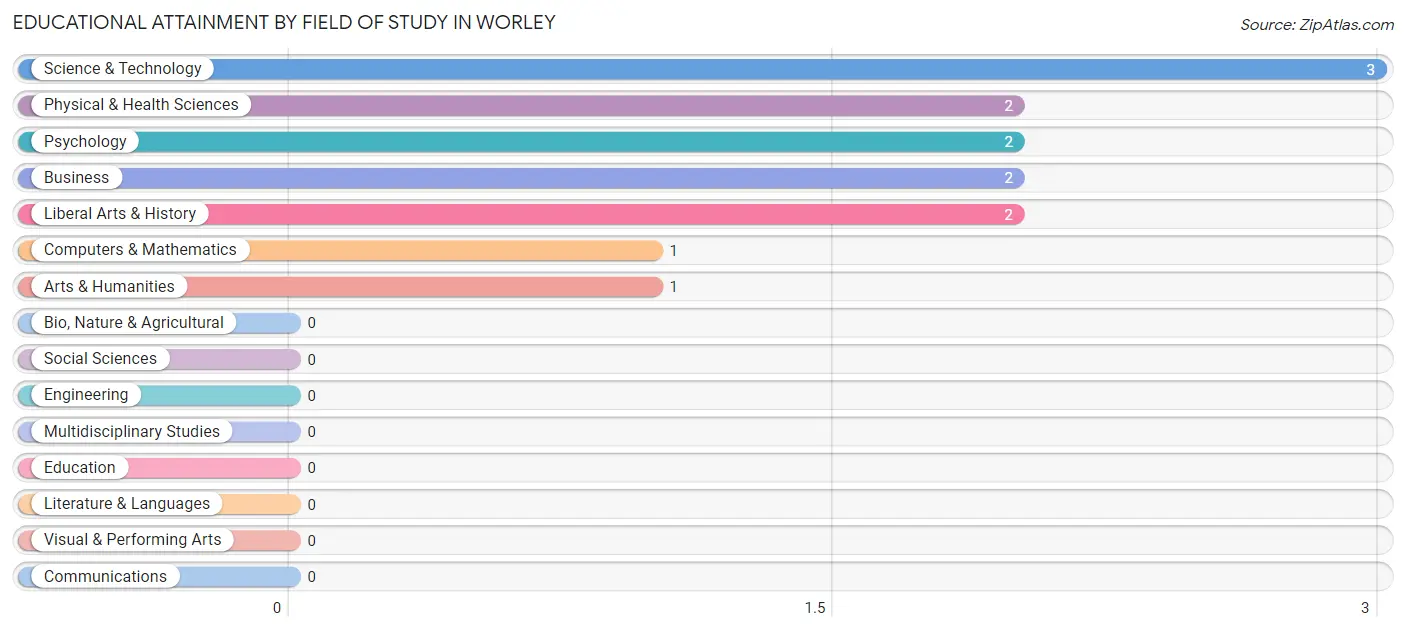
Educational Attainment by Field of Study in Worley
Science & technology (3 | 23.1%), physical & health sciences (2 | 15.4%), psychology (2 | 15.4%), business (2 | 15.4%), and liberal arts & history (2 | 15.4%) are the most common fields of study among 13 individuals in Worley who have obtained a bachelor's degree or higher.
| Field of Study | # Graduates | % Graduates |
| Computers & Mathematics | 1 | 7.7% |
| Bio, Nature & Agricultural | 0 | 0.0% |
| Physical & Health Sciences | 2 | 15.4% |
| Psychology | 2 | 15.4% |
| Social Sciences | 0 | 0.0% |
| Engineering | 0 | 0.0% |
| Multidisciplinary Studies | 0 | 0.0% |
| Science & Technology | 3 | 23.1% |
| Business | 2 | 15.4% |
| Education | 0 | 0.0% |
| Literature & Languages | 0 | 0.0% |
| Liberal Arts & History | 2 | 15.4% |
| Visual & Performing Arts | 0 | 0.0% |
| Communications | 0 | 0.0% |
| Arts & Humanities | 1 | 7.7% |
| Total | 13 | 100.0% |
Transportation & Commute in Worley
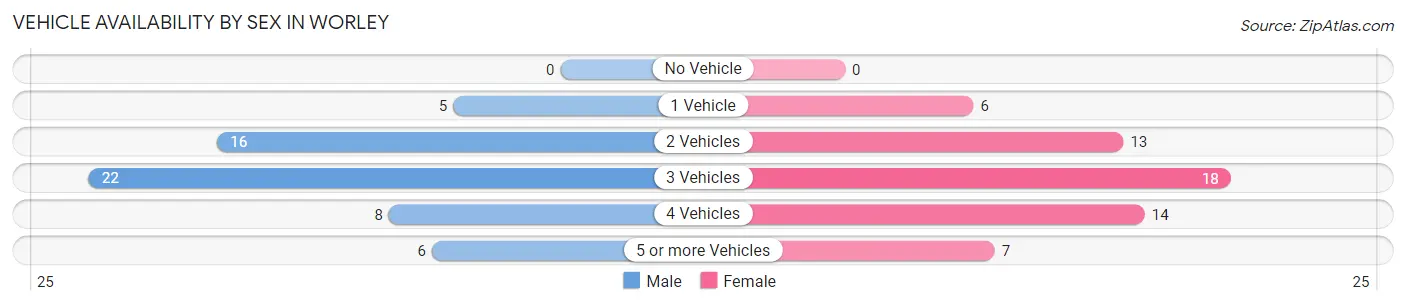
Vehicle Availability by Sex in Worley
The most prevalent vehicle ownership categories in Worley are males with 3 vehicles (22, accounting for 38.6%) and females with 3 vehicles (18, making up 37.9%).
| Vehicles Available | Male | Female |
| No Vehicle | 0 (0.0%) | 0 (0.0%) |
| 1 Vehicle | 5 (8.8%) | 6 (10.3%) |
| 2 Vehicles | 16 (28.1%) | 13 (22.4%) |
| 3 Vehicles | 22 (38.6%) | 18 (31.0%) |
| 4 Vehicles | 8 (14.0%) | 14 (24.1%) |
| 5 or more Vehicles | 6 (10.5%) | 7 (12.1%) |
| Total | 57 (100.0%) | 58 (100.0%) |
Commute Time in Worley
The most frequently occuring commute durations in Worley are 5 to 9 minutes (25 commuters, 22.5%), 10 to 14 minutes (25 commuters, 22.5%), and 15 to 19 minutes (16 commuters, 14.4%).
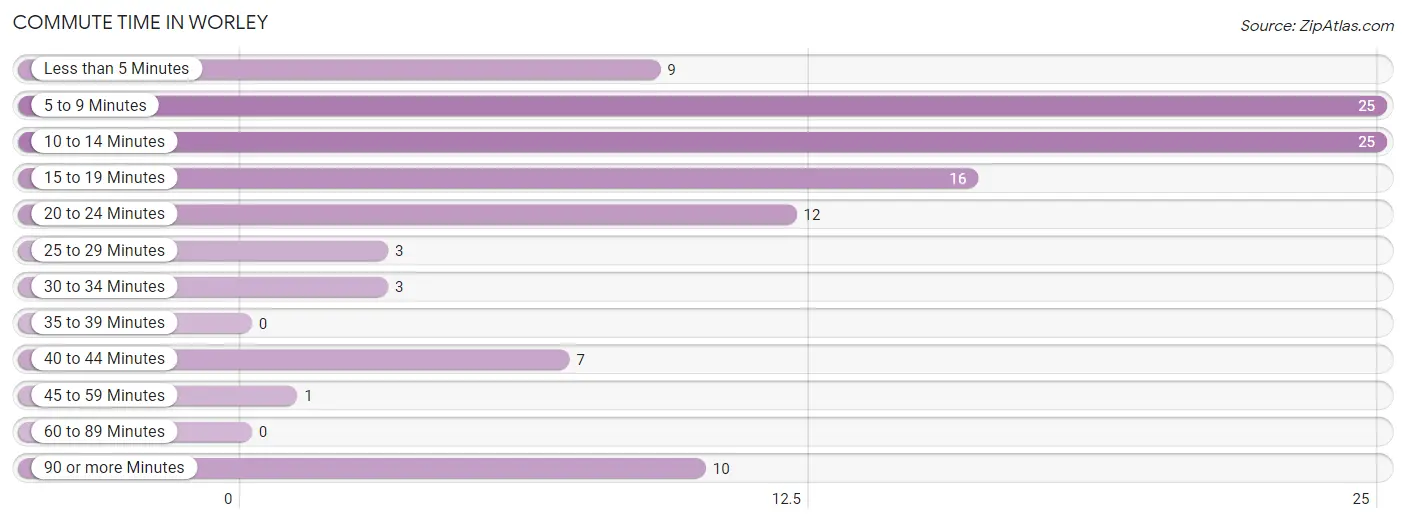
| Commute Time | # Commuters | % Commuters |
| Less than 5 Minutes | 9 | 8.1% |
| 5 to 9 Minutes | 25 | 22.5% |
| 10 to 14 Minutes | 25 | 22.5% |
| 15 to 19 Minutes | 16 | 14.4% |
| 20 to 24 Minutes | 12 | 10.8% |
| 25 to 29 Minutes | 3 | 2.7% |
| 30 to 34 Minutes | 3 | 2.7% |
| 35 to 39 Minutes | 0 | 0.0% |
| 40 to 44 Minutes | 7 | 6.3% |
| 45 to 59 Minutes | 1 | 0.9% |
| 60 to 89 Minutes | 0 | 0.0% |
| 90 or more Minutes | 10 | 9.0% |
Commute Time by Sex in Worley
The most common commute times in Worley are 5 to 9 minutes (14 commuters, 25.9%) for males and 10 to 14 minutes (14 commuters, 24.6%) for females.
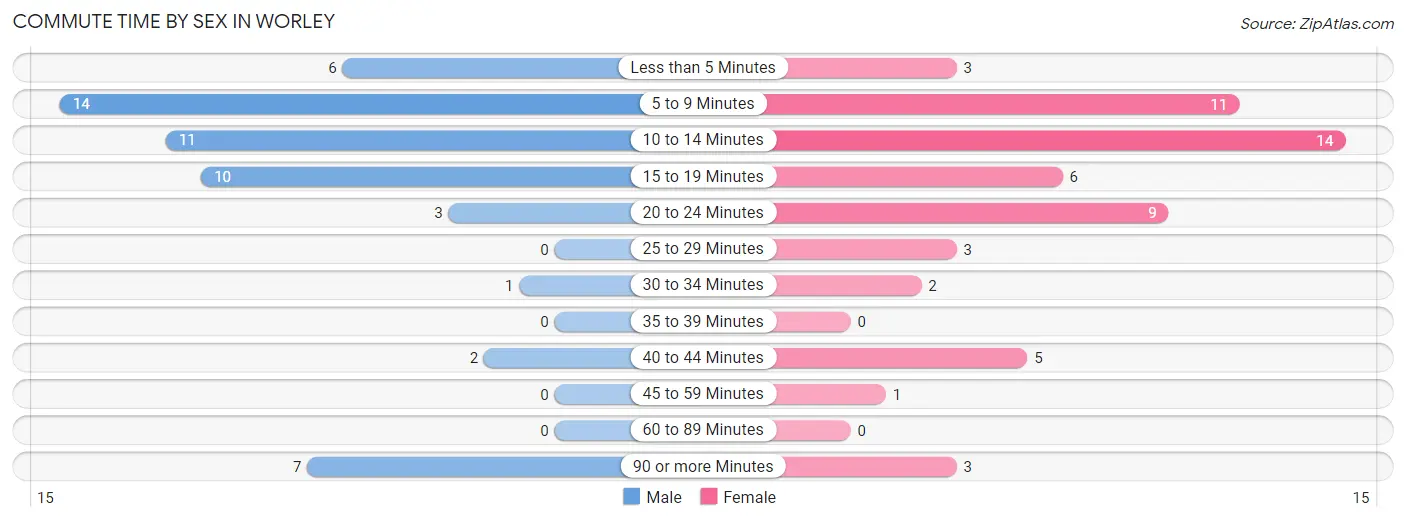
| Commute Time | Male | Female |
| Less than 5 Minutes | 6 (11.1%) | 3 (5.3%) |
| 5 to 9 Minutes | 14 (25.9%) | 11 (19.3%) |
| 10 to 14 Minutes | 11 (20.4%) | 14 (24.6%) |
| 15 to 19 Minutes | 10 (18.5%) | 6 (10.5%) |
| 20 to 24 Minutes | 3 (5.6%) | 9 (15.8%) |
| 25 to 29 Minutes | 0 (0.0%) | 3 (5.3%) |
| 30 to 34 Minutes | 1 (1.8%) | 2 (3.5%) |
| 35 to 39 Minutes | 0 (0.0%) | 0 (0.0%) |
| 40 to 44 Minutes | 2 (3.7%) | 5 (8.8%) |
| 45 to 59 Minutes | 0 (0.0%) | 1 (1.8%) |
| 60 to 89 Minutes | 0 (0.0%) | 0 (0.0%) |
| 90 or more Minutes | 7 (13.0%) | 3 (5.3%) |
Time of Departure to Work by Sex in Worley
The most frequent times of departure to work in Worley are 12:00 AM to 4:59 AM (14, 25.9%) for males and 7:00 AM to 7:29 AM (14, 24.6%) for females.
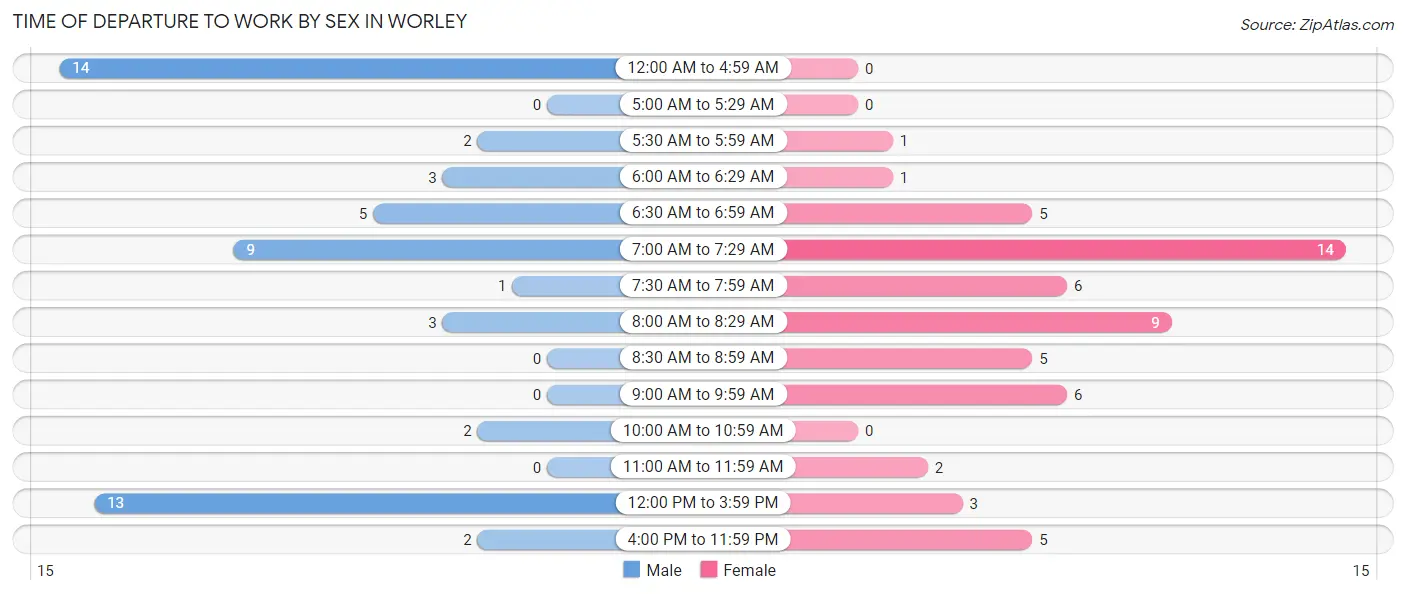
| Time of Departure | Male | Female |
| 12:00 AM to 4:59 AM | 14 (25.9%) | 0 (0.0%) |
| 5:00 AM to 5:29 AM | 0 (0.0%) | 0 (0.0%) |
| 5:30 AM to 5:59 AM | 2 (3.7%) | 1 (1.8%) |
| 6:00 AM to 6:29 AM | 3 (5.6%) | 1 (1.8%) |
| 6:30 AM to 6:59 AM | 5 (9.3%) | 5 (8.8%) |
| 7:00 AM to 7:29 AM | 9 (16.7%) | 14 (24.6%) |
| 7:30 AM to 7:59 AM | 1 (1.8%) | 6 (10.5%) |
| 8:00 AM to 8:29 AM | 3 (5.6%) | 9 (15.8%) |
| 8:30 AM to 8:59 AM | 0 (0.0%) | 5 (8.8%) |
| 9:00 AM to 9:59 AM | 0 (0.0%) | 6 (10.5%) |
| 10:00 AM to 10:59 AM | 2 (3.7%) | 0 (0.0%) |
| 11:00 AM to 11:59 AM | 0 (0.0%) | 2 (3.5%) |
| 12:00 PM to 3:59 PM | 13 (24.1%) | 3 (5.3%) |
| 4:00 PM to 11:59 PM | 2 (3.7%) | 5 (8.8%) |
| Total | 54 (100.0%) | 57 (100.0%) |
Housing Occupancy in Worley
Occupancy by Ownership in Worley
Of the total 91 dwellings in Worley, owner-occupied units account for 55 (60.4%), while renter-occupied units make up 36 (39.6%).
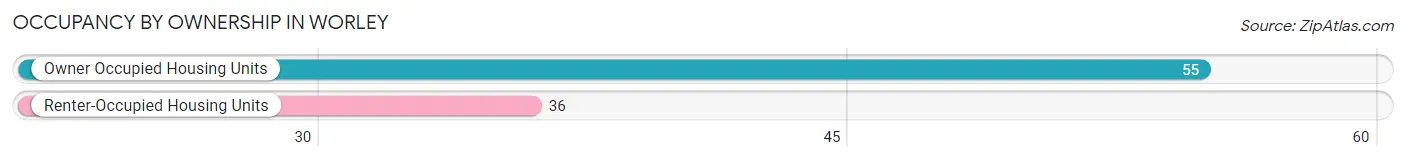
| Occupancy | # Housing Units | % Housing Units |
| Owner Occupied Housing Units | 55 | 60.4% |
| Renter-Occupied Housing Units | 36 | 39.6% |
| Total Occupied Housing Units | 91 | 100.0% |
Occupancy by Household Size in Worley
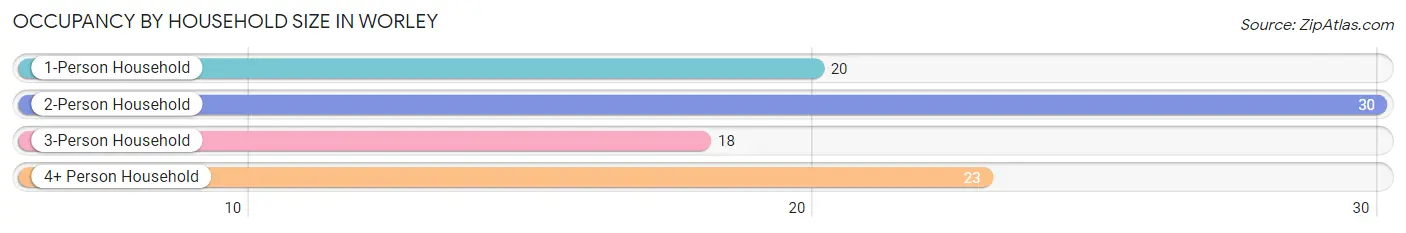
| Household Size | # Housing Units | % Housing Units |
| 1-Person Household | 20 | 22.0% |
| 2-Person Household | 30 | 33.0% |
| 3-Person Household | 18 | 19.8% |
| 4+ Person Household | 23 | 25.3% |
| Total Housing Units | 91 | 100.0% |
Occupancy by Ownership by Household Size in Worley
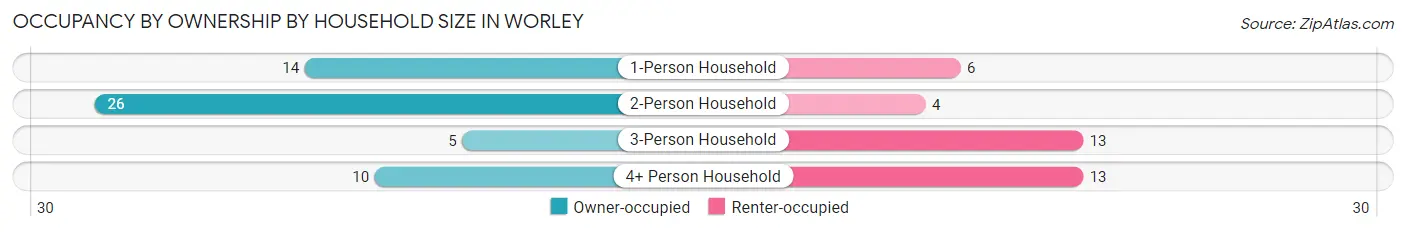
| Household Size | Owner-occupied | Renter-occupied |
| 1-Person Household | 14 (70.0%) | 6 (30.0%) |
| 2-Person Household | 26 (86.7%) | 4 (13.3%) |
| 3-Person Household | 5 (27.8%) | 13 (72.2%) |
| 4+ Person Household | 10 (43.5%) | 13 (56.5%) |
| Total Housing Units | 55 (60.4%) | 36 (39.6%) |
Occupancy by Educational Attainment in Worley
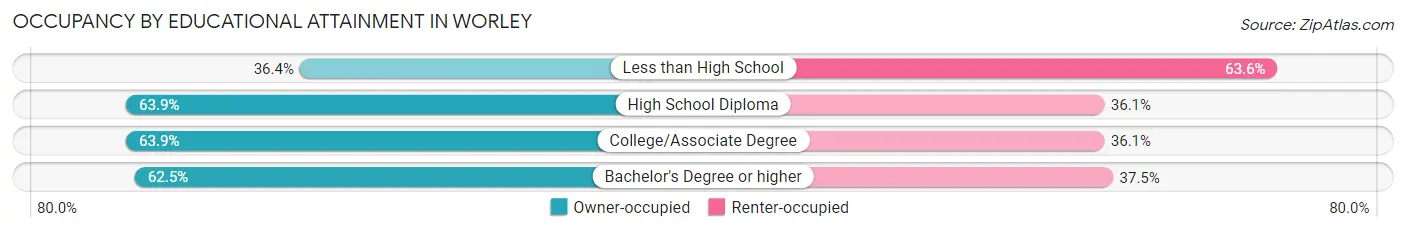
| Household Size | Owner-occupied | Renter-occupied |
| Less than High School | 4 (36.4%) | 7 (63.6%) |
| High School Diploma | 23 (63.9%) | 13 (36.1%) |
| College/Associate Degree | 23 (63.9%) | 13 (36.1%) |
| Bachelor's Degree or higher | 5 (62.5%) | 3 (37.5%) |
Occupancy by Age of Householder in Worley
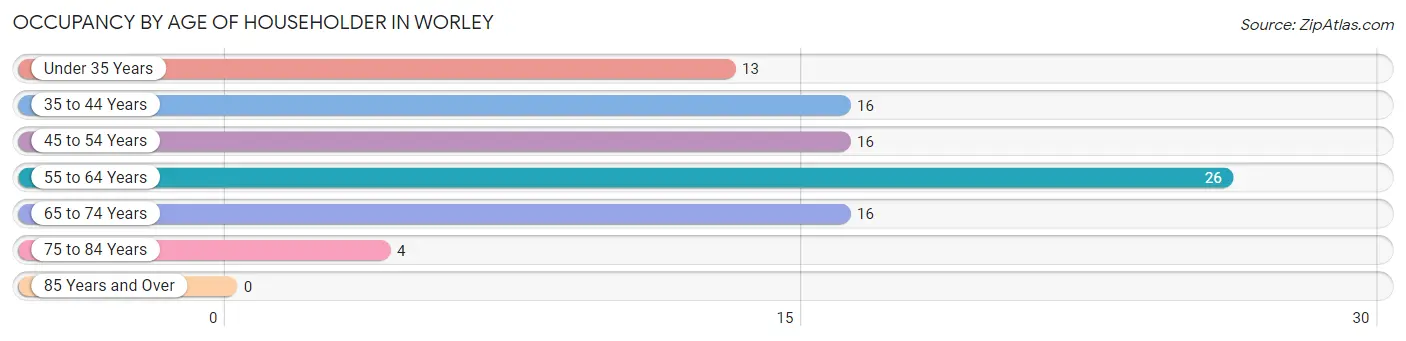
| Age Bracket | # Households | % Households |
| Under 35 Years | 13 | 14.3% |
| 35 to 44 Years | 16 | 17.6% |
| 45 to 54 Years | 16 | 17.6% |
| 55 to 64 Years | 26 | 28.6% |
| 65 to 74 Years | 16 | 17.6% |
| 75 to 84 Years | 4 | 4.4% |
| 85 Years and Over | 0 | 0.0% |
| Total | 91 | 100.0% |
Housing Finances in Worley
Median Income by Occupancy in Worley
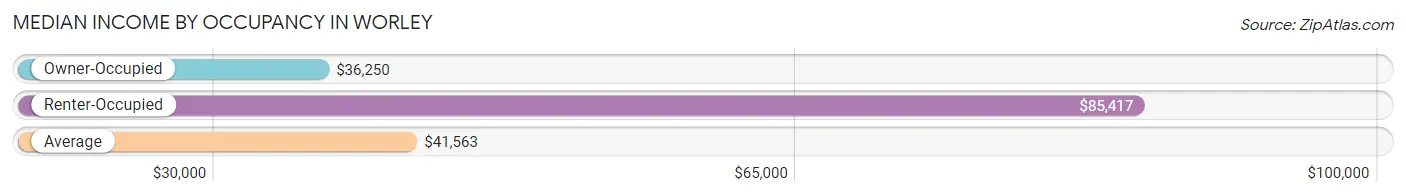
| Occupancy Type | # Households | Median Income |
| Owner-Occupied | 55 (60.4%) | $36,250 |
| Renter-Occupied | 36 (39.6%) | $85,417 |
| Average | 91 (100.0%) | $41,563 |
Occupancy by Householder Income Bracket in Worley
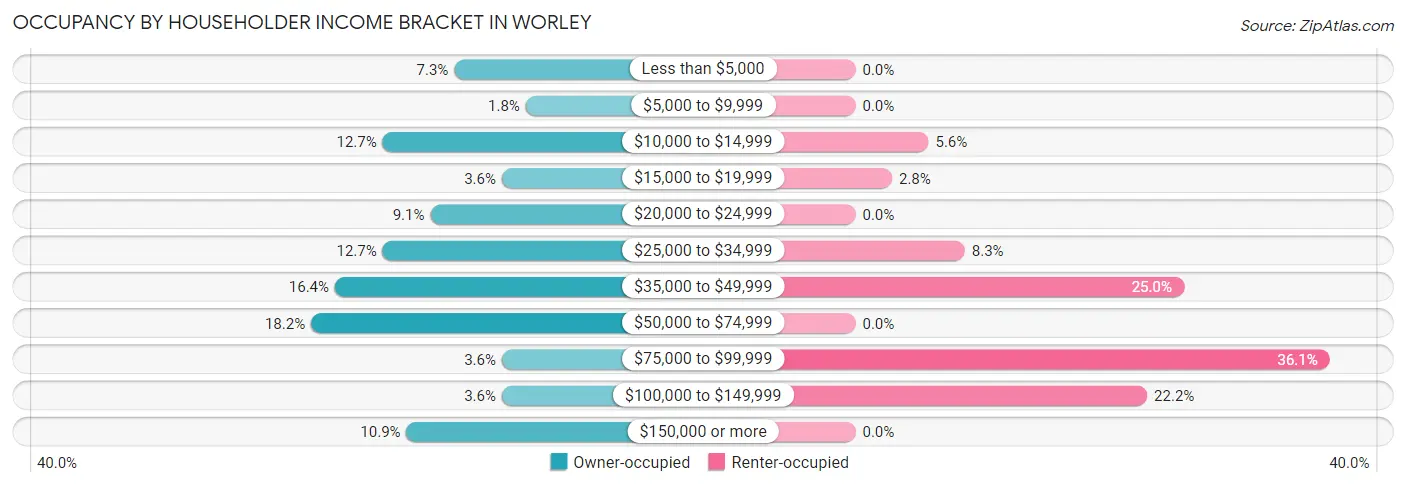
| Income Bracket | Owner-occupied | Renter-occupied |
| Less than $5,000 | 4 (7.3%) | 0 (0.0%) |
| $5,000 to $9,999 | 1 (1.8%) | 0 (0.0%) |
| $10,000 to $14,999 | 7 (12.7%) | 2 (5.6%) |
| $15,000 to $19,999 | 2 (3.6%) | 1 (2.8%) |
| $20,000 to $24,999 | 5 (9.1%) | 0 (0.0%) |
| $25,000 to $34,999 | 7 (12.7%) | 3 (8.3%) |
| $35,000 to $49,999 | 9 (16.4%) | 9 (25.0%) |
| $50,000 to $74,999 | 10 (18.2%) | 0 (0.0%) |
| $75,000 to $99,999 | 2 (3.6%) | 13 (36.1%) |
| $100,000 to $149,999 | 2 (3.6%) | 8 (22.2%) |
| $150,000 or more | 6 (10.9%) | 0 (0.0%) |
| Total | 55 (100.0%) | 36 (100.0%) |
Monthly Housing Cost Tiers in Worley
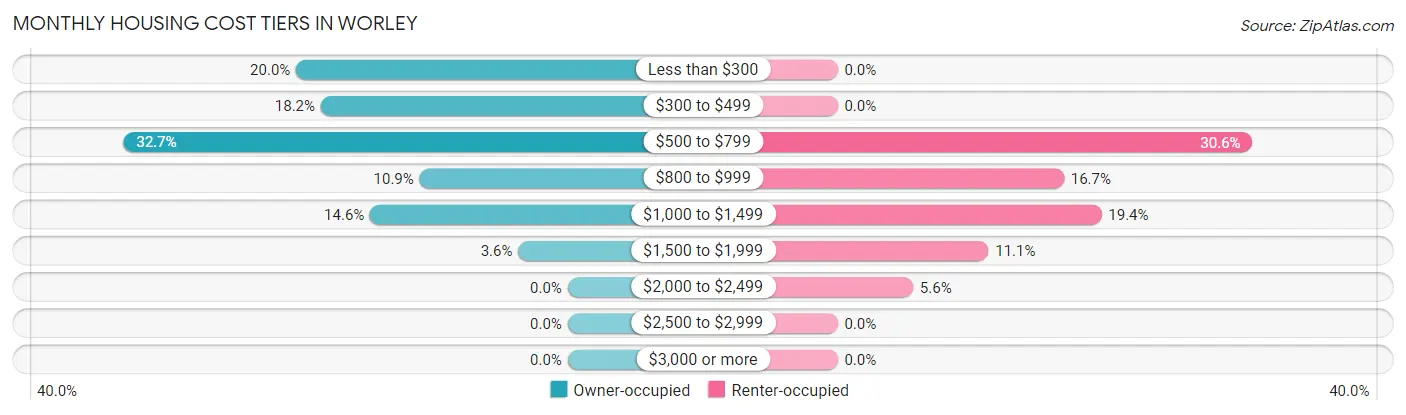
| Monthly Cost | Owner-occupied | Renter-occupied |
| Less than $300 | 11 (20.0%) | 0 (0.0%) |
| $300 to $499 | 10 (18.2%) | 0 (0.0%) |
| $500 to $799 | 18 (32.7%) | 11 (30.6%) |
| $800 to $999 | 6 (10.9%) | 6 (16.7%) |
| $1,000 to $1,499 | 8 (14.5%) | 7 (19.4%) |
| $1,500 to $1,999 | 2 (3.6%) | 4 (11.1%) |
| $2,000 to $2,499 | 0 (0.0%) | 2 (5.6%) |
| $2,500 to $2,999 | 0 (0.0%) | 0 (0.0%) |
| $3,000 or more | 0 (0.0%) | 0 (0.0%) |
| Total | 55 (100.0%) | 36 (100.0%) |
Physical Housing Characteristics in Worley
Housing Structures in Worley
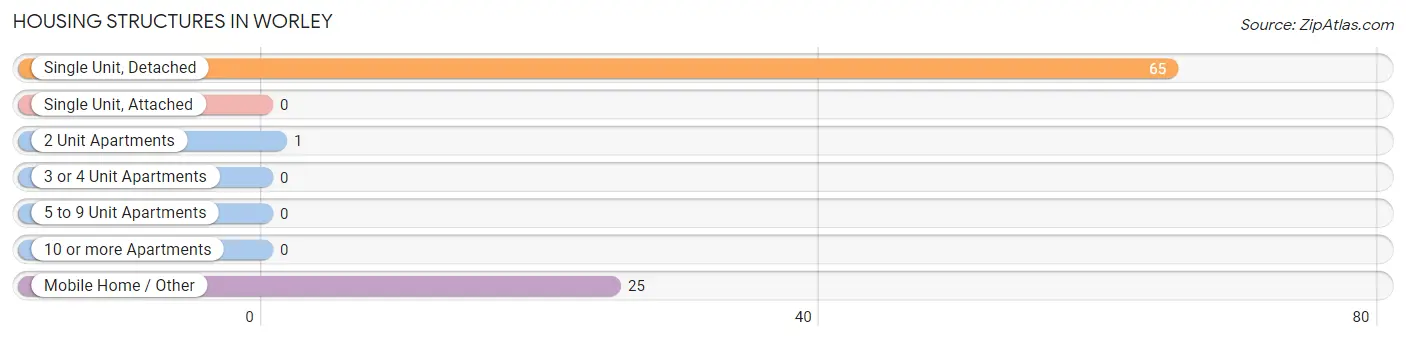
| Structure Type | # Housing Units | % Housing Units |
| Single Unit, Detached | 65 | 71.4% |
| Single Unit, Attached | 0 | 0.0% |
| 2 Unit Apartments | 1 | 1.1% |
| 3 or 4 Unit Apartments | 0 | 0.0% |
| 5 to 9 Unit Apartments | 0 | 0.0% |
| 10 or more Apartments | 0 | 0.0% |
| Mobile Home / Other | 25 | 27.5% |
| Total | 91 | 100.0% |
Housing Structures by Occupancy in Worley
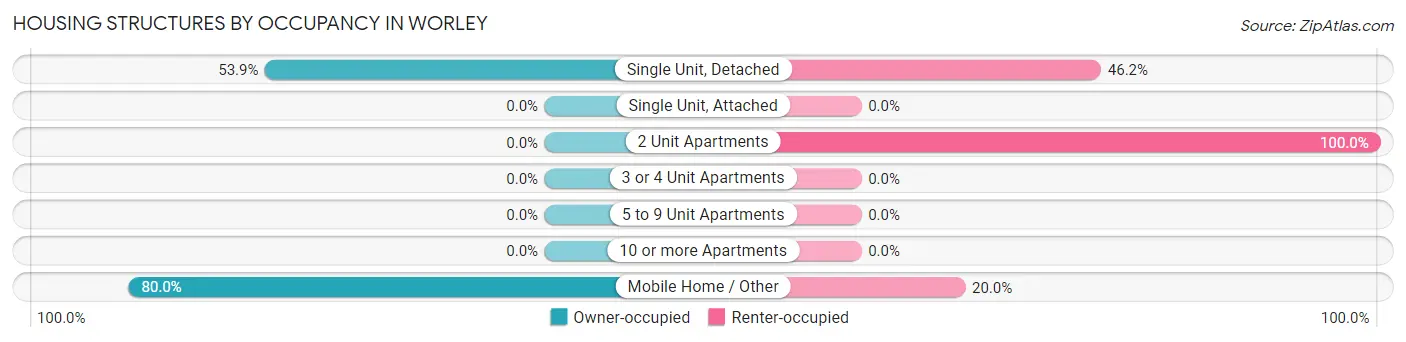
| Structure Type | Owner-occupied | Renter-occupied |
| Single Unit, Detached | 35 (53.8%) | 30 (46.2%) |
| Single Unit, Attached | 0 (0.0%) | 0 (0.0%) |
| 2 Unit Apartments | 0 (0.0%) | 1 (100.0%) |
| 3 or 4 Unit Apartments | 0 (0.0%) | 0 (0.0%) |
| 5 to 9 Unit Apartments | 0 (0.0%) | 0 (0.0%) |
| 10 or more Apartments | 0 (0.0%) | 0 (0.0%) |
| Mobile Home / Other | 20 (80.0%) | 5 (20.0%) |
| Total | 55 (60.4%) | 36 (39.6%) |
Housing Structures by Number of Rooms in Worley
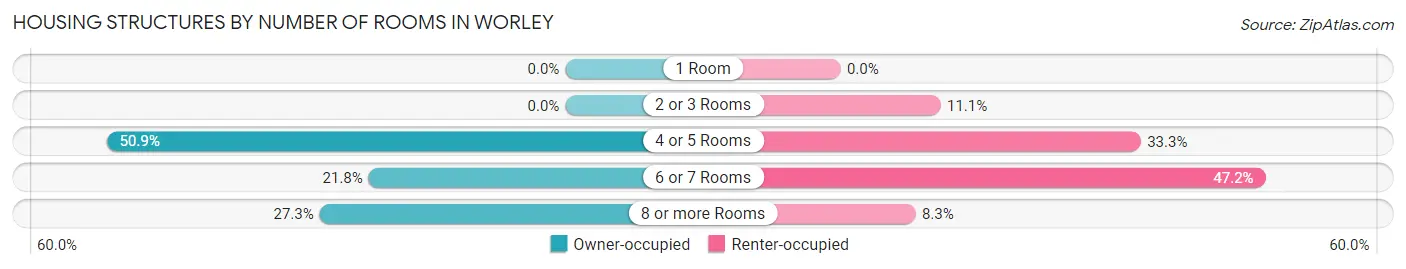
| Number of Rooms | Owner-occupied | Renter-occupied |
| 1 Room | 0 (0.0%) | 0 (0.0%) |
| 2 or 3 Rooms | 0 (0.0%) | 4 (11.1%) |
| 4 or 5 Rooms | 28 (50.9%) | 12 (33.3%) |
| 6 or 7 Rooms | 12 (21.8%) | 17 (47.2%) |
| 8 or more Rooms | 15 (27.3%) | 3 (8.3%) |
| Total | 55 (100.0%) | 36 (100.0%) |
Housing Structure by Heating Type in Worley
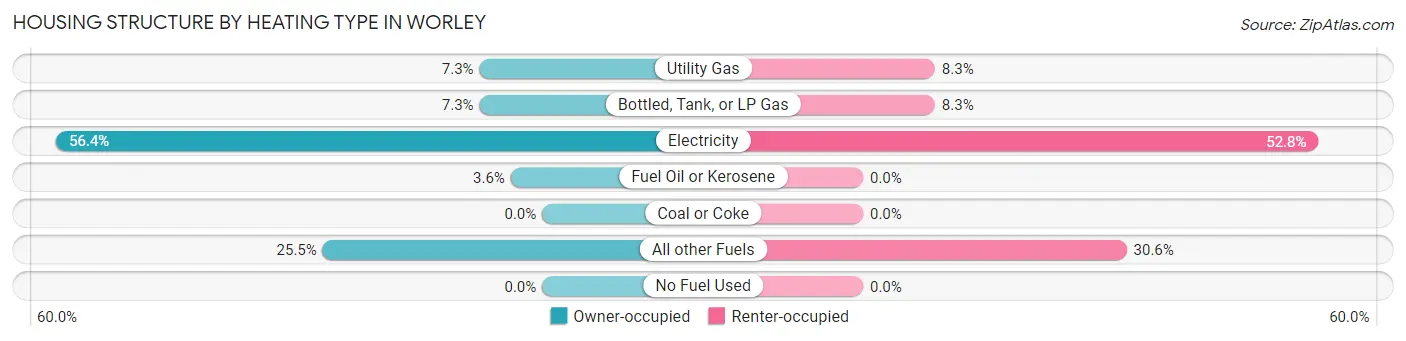
| Heating Type | Owner-occupied | Renter-occupied |
| Utility Gas | 4 (7.3%) | 3 (8.3%) |
| Bottled, Tank, or LP Gas | 4 (7.3%) | 3 (8.3%) |
| Electricity | 31 (56.4%) | 19 (52.8%) |
| Fuel Oil or Kerosene | 2 (3.6%) | 0 (0.0%) |
| Coal or Coke | 0 (0.0%) | 0 (0.0%) |
| All other Fuels | 14 (25.5%) | 11 (30.6%) |
| No Fuel Used | 0 (0.0%) | 0 (0.0%) |
| Total | 55 (100.0%) | 36 (100.0%) |
Household Vehicle Usage in Worley
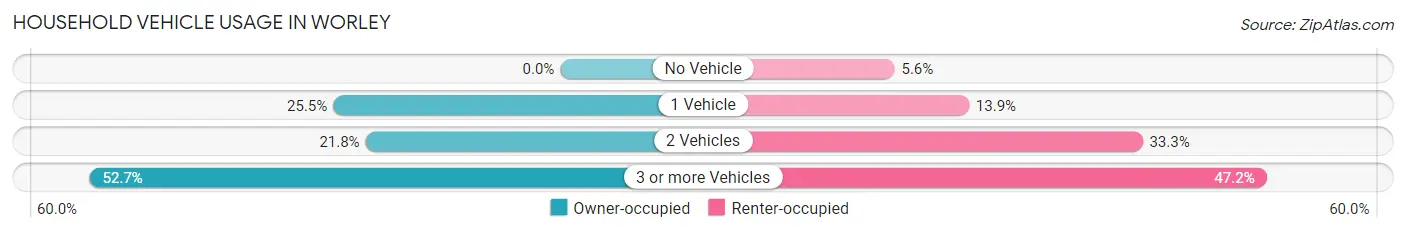
| Vehicles per Household | Owner-occupied | Renter-occupied |
| No Vehicle | 0 (0.0%) | 2 (5.6%) |
| 1 Vehicle | 14 (25.5%) | 5 (13.9%) |
| 2 Vehicles | 12 (21.8%) | 12 (33.3%) |
| 3 or more Vehicles | 29 (52.7%) | 17 (47.2%) |
| Total | 55 (100.0%) | 36 (100.0%) |
Real Estate & Mortgages in Worley
Real Estate and Mortgage Overview in Worley
| Characteristic | Without Mortgage | With Mortgage |
| Housing Units | 35 | 20 |
| Median Property Value | $142,500 | $120,000 |
| Median Household Income | $32,250 | $0 |
| Monthly Housing Costs | $465 | $0 |
| Real Estate Taxes | $1,125 | $2 |
Property Value by Mortgage Status in Worley
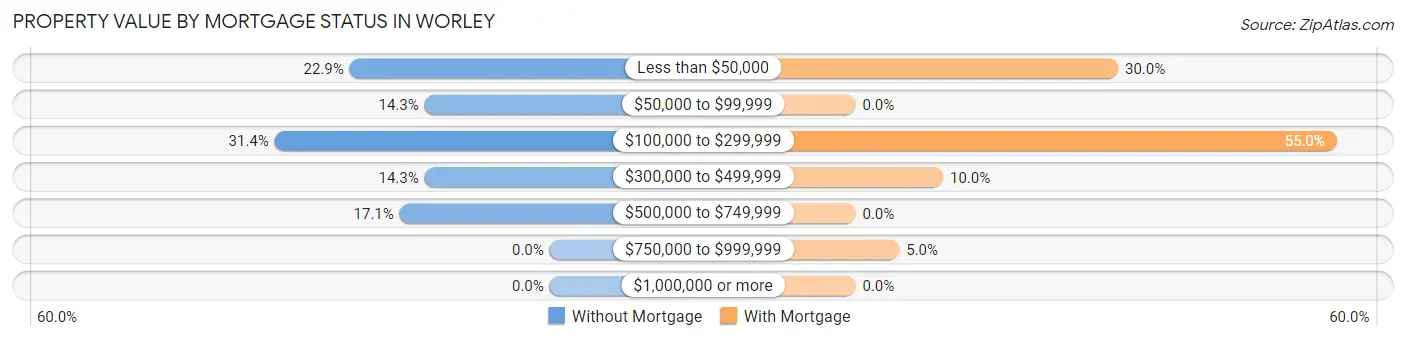
| Property Value | Without Mortgage | With Mortgage |
| Less than $50,000 | 8 (22.9%) | 6 (30.0%) |
| $50,000 to $99,999 | 5 (14.3%) | 0 (0.0%) |
| $100,000 to $299,999 | 11 (31.4%) | 11 (55.0%) |
| $300,000 to $499,999 | 5 (14.3%) | 2 (10.0%) |
| $500,000 to $749,999 | 6 (17.1%) | 0 (0.0%) |
| $750,000 to $999,999 | 0 (0.0%) | 1 (5.0%) |
| $1,000,000 or more | 0 (0.0%) | 0 (0.0%) |
| Total | 35 (100.0%) | 20 (100.0%) |
Household Income by Mortgage Status in Worley
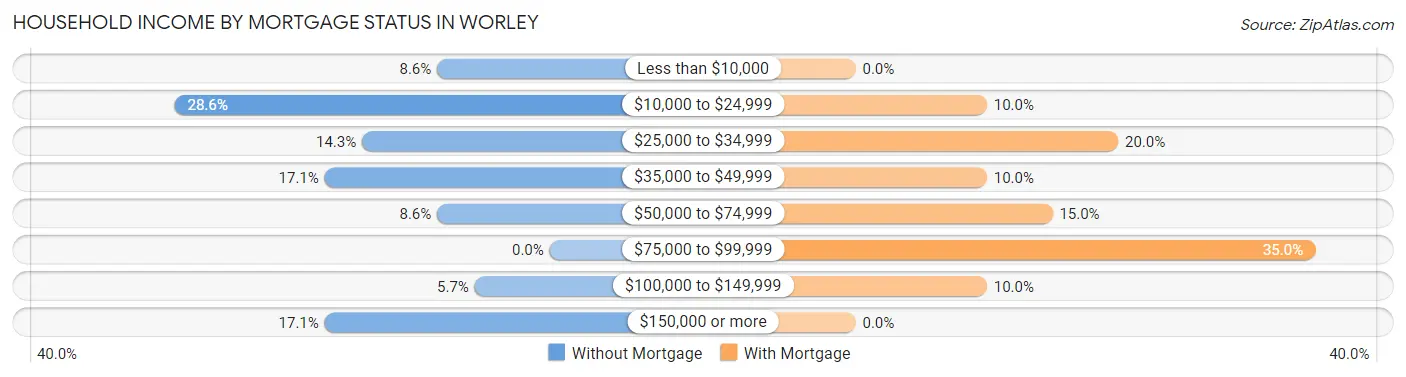
| Household Income | Without Mortgage | With Mortgage |
| Less than $10,000 | 3 (8.6%) | 0 (0.0%) |
| $10,000 to $24,999 | 10 (28.6%) | 2 (10.0%) |
| $25,000 to $34,999 | 5 (14.3%) | 4 (20.0%) |
| $35,000 to $49,999 | 6 (17.1%) | 2 (10.0%) |
| $50,000 to $74,999 | 3 (8.6%) | 3 (15.0%) |
| $75,000 to $99,999 | 0 (0.0%) | 7 (35.0%) |
| $100,000 to $149,999 | 2 (5.7%) | 2 (10.0%) |
| $150,000 or more | 6 (17.1%) | 0 (0.0%) |
| Total | 35 (100.0%) | 20 (100.0%) |
Property Value to Household Income Ratio in Worley
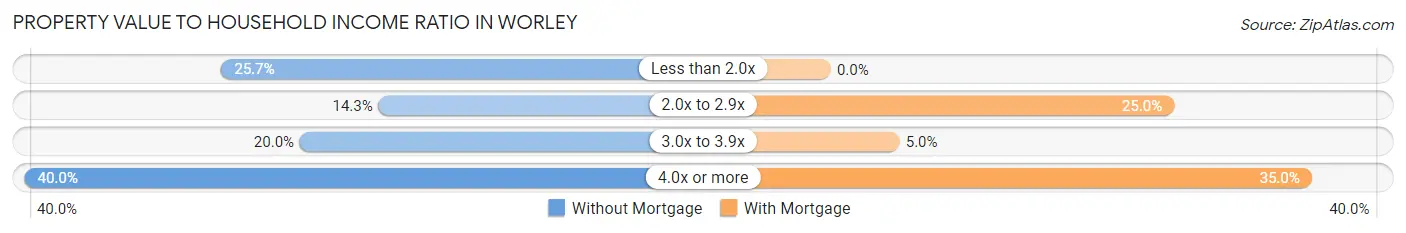
| Value-to-Income Ratio | Without Mortgage | With Mortgage |
| Less than 2.0x | 9 (25.7%) | 0 (0.0%) |
| 2.0x to 2.9x | 5 (14.3%) | 5 (25.0%) |
| 3.0x to 3.9x | 7 (20.0%) | 1 (5.0%) |
| 4.0x or more | 14 (40.0%) | 7 (35.0%) |
| Total | 35 (100.0%) | 20 (100.0%) |
Real Estate Taxes by Mortgage Status in Worley
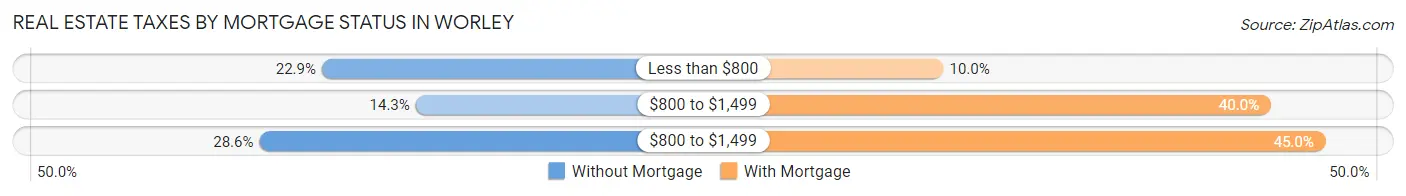
| Property Taxes | Without Mortgage | With Mortgage |
| Less than $800 | 8 (22.9%) | 2 (10.0%) |
| $800 to $1,499 | 5 (14.3%) | 8 (40.0%) |
| $800 to $1,499 | 10 (28.6%) | 9 (45.0%) |
| Total | 35 (100.0%) | 20 (100.0%) |
Health & Disability in Worley
Health Insurance Coverage by Age in Worley
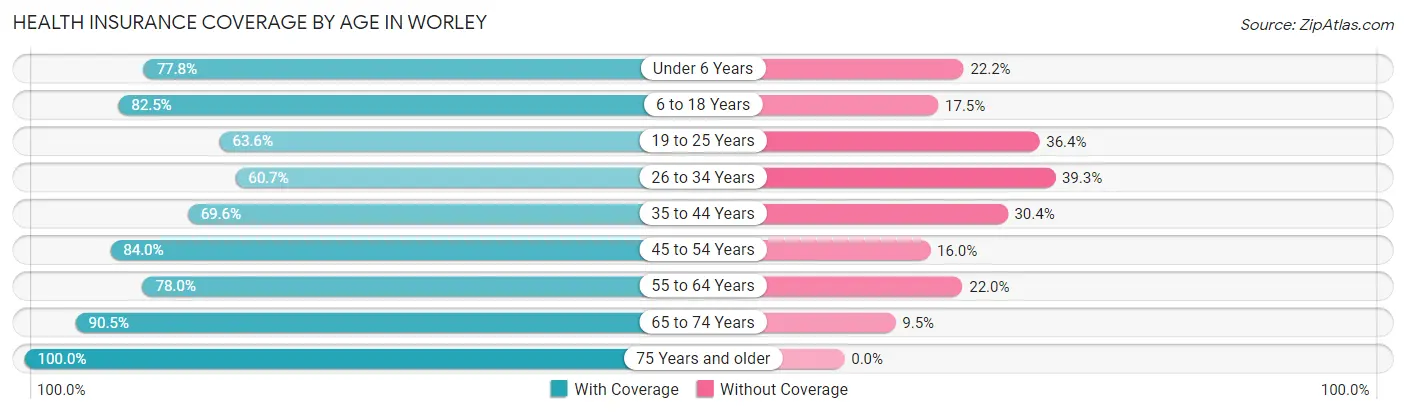
| Age Bracket | With Coverage | Without Coverage |
| Under 6 Years | 21 (77.8%) | 6 (22.2%) |
| 6 to 18 Years | 33 (82.5%) | 7 (17.5%) |
| 19 to 25 Years | 21 (63.6%) | 12 (36.4%) |
| 26 to 34 Years | 17 (60.7%) | 11 (39.3%) |
| 35 to 44 Years | 16 (69.6%) | 7 (30.4%) |
| 45 to 54 Years | 21 (84.0%) | 4 (16.0%) |
| 55 to 64 Years | 39 (78.0%) | 11 (22.0%) |
| 65 to 74 Years | 19 (90.5%) | 2 (9.5%) |
| 75 Years and older | 11 (100.0%) | 0 (0.0%) |
| Total | 198 (76.7%) | 60 (23.3%) |
Health Insurance Coverage by Citizenship Status in Worley
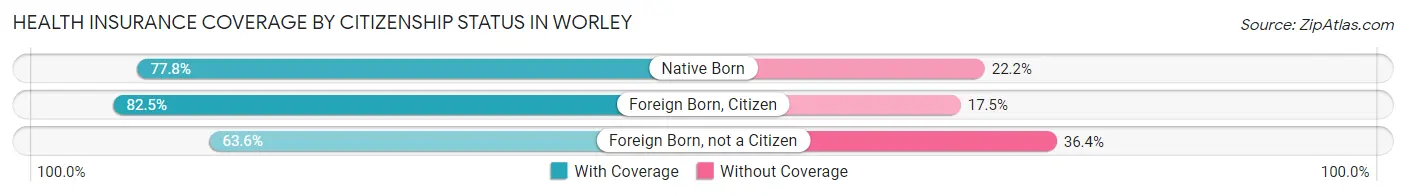
| Citizenship Status | With Coverage | Without Coverage |
| Native Born | 21 (77.8%) | 6 (22.2%) |
| Foreign Born, Citizen | 33 (82.5%) | 7 (17.5%) |
| Foreign Born, not a Citizen | 21 (63.6%) | 12 (36.4%) |
Health Insurance Coverage by Household Income in Worley
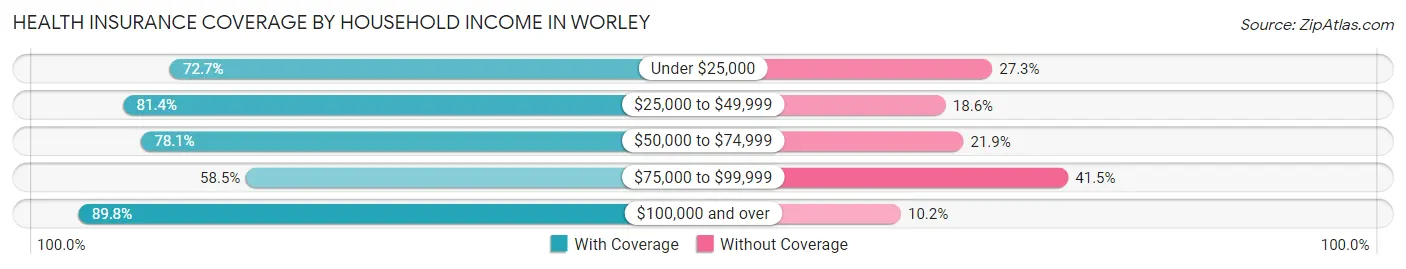
| Household Income | With Coverage | Without Coverage |
| Under $25,000 | 32 (72.7%) | 12 (27.3%) |
| $25,000 to $49,999 | 57 (81.4%) | 13 (18.6%) |
| $50,000 to $74,999 | 25 (78.1%) | 7 (21.9%) |
| $75,000 to $99,999 | 31 (58.5%) | 22 (41.5%) |
| $100,000 and over | 53 (89.8%) | 6 (10.2%) |
Public vs Private Health Insurance Coverage by Age in Worley
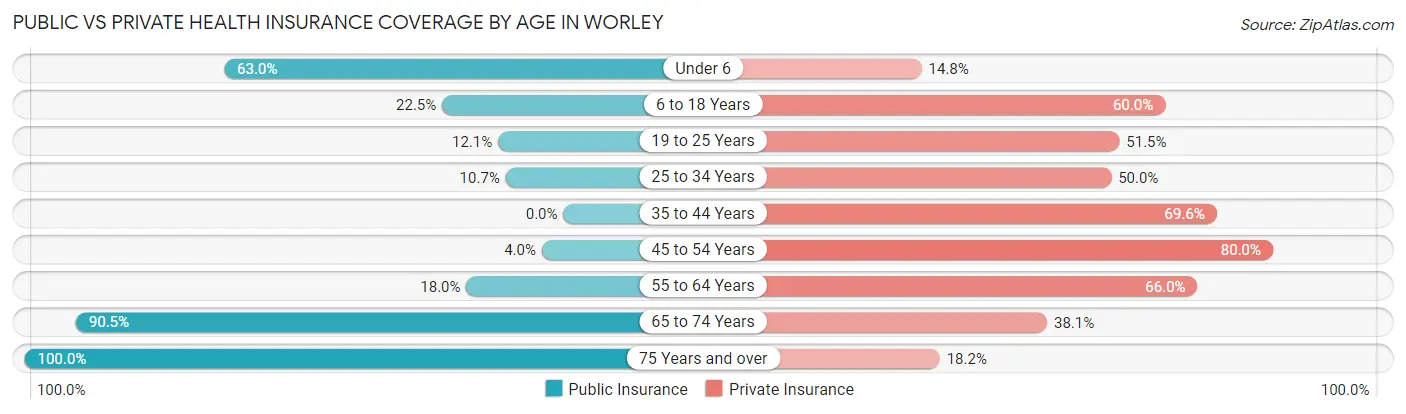
| Age Bracket | Public Insurance | Private Insurance |
| Under 6 | 17 (63.0%) | 4 (14.8%) |
| 6 to 18 Years | 9 (22.5%) | 24 (60.0%) |
| 19 to 25 Years | 4 (12.1%) | 17 (51.5%) |
| 25 to 34 Years | 3 (10.7%) | 14 (50.0%) |
| 35 to 44 Years | 0 (0.0%) | 16 (69.6%) |
| 45 to 54 Years | 1 (4.0%) | 20 (80.0%) |
| 55 to 64 Years | 9 (18.0%) | 33 (66.0%) |
| 65 to 74 Years | 19 (90.5%) | 8 (38.1%) |
| 75 Years and over | 11 (100.0%) | 2 (18.2%) |
| Total | 73 (28.3%) | 138 (53.5%) |
Disability Status by Sex by Age in Worley
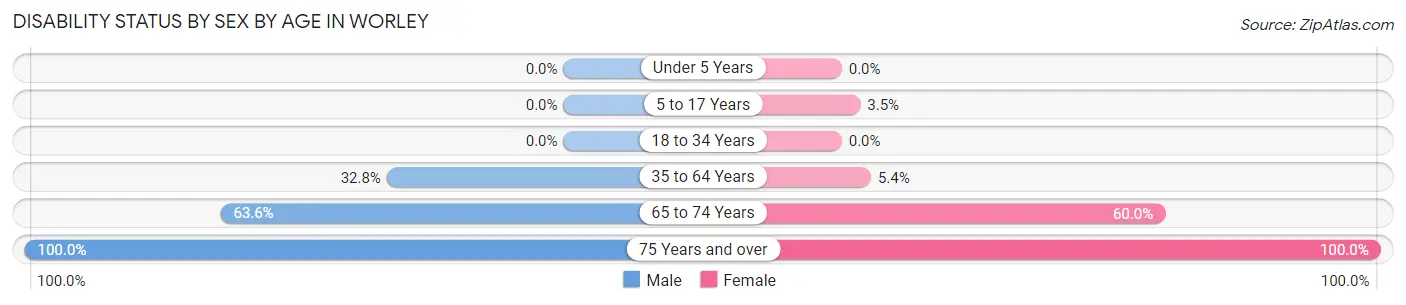
| Age Bracket | Male | Female |
| Under 5 Years | 0 (0.0%) | 0 (0.0%) |
| 5 to 17 Years | 0 (0.0%) | 1 (3.5%) |
| 18 to 34 Years | 0 (0.0%) | 0 (0.0%) |
| 35 to 64 Years | 20 (32.8%) | 2 (5.4%) |
| 65 to 74 Years | 7 (63.6%) | 6 (60.0%) |
| 75 Years and over | 8 (100.0%) | 3 (100.0%) |
Disability Class by Sex by Age in Worley
Disability Class: Hearing Difficulty
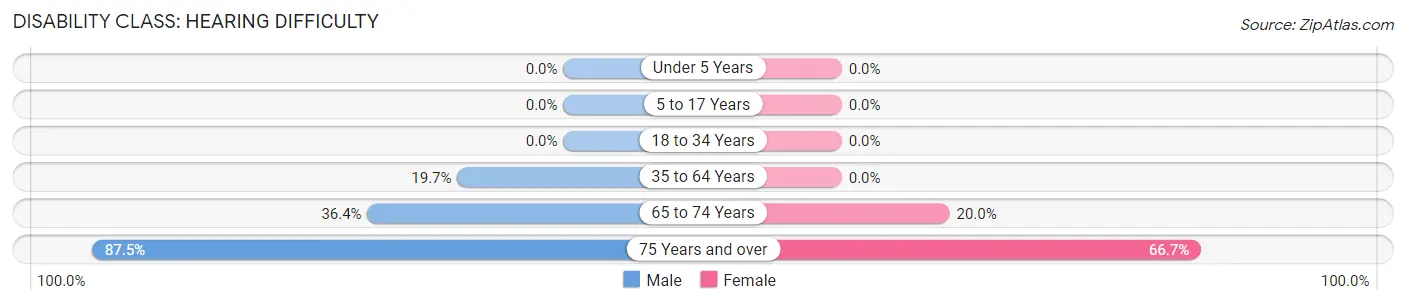
| Age Bracket | Male | Female |
| Under 5 Years | 0 (0.0%) | 0 (0.0%) |
| 5 to 17 Years | 0 (0.0%) | 0 (0.0%) |
| 18 to 34 Years | 0 (0.0%) | 0 (0.0%) |
| 35 to 64 Years | 12 (19.7%) | 0 (0.0%) |
| 65 to 74 Years | 4 (36.4%) | 2 (20.0%) |
| 75 Years and over | 7 (87.5%) | 2 (66.7%) |
Disability Class: Vision Difficulty
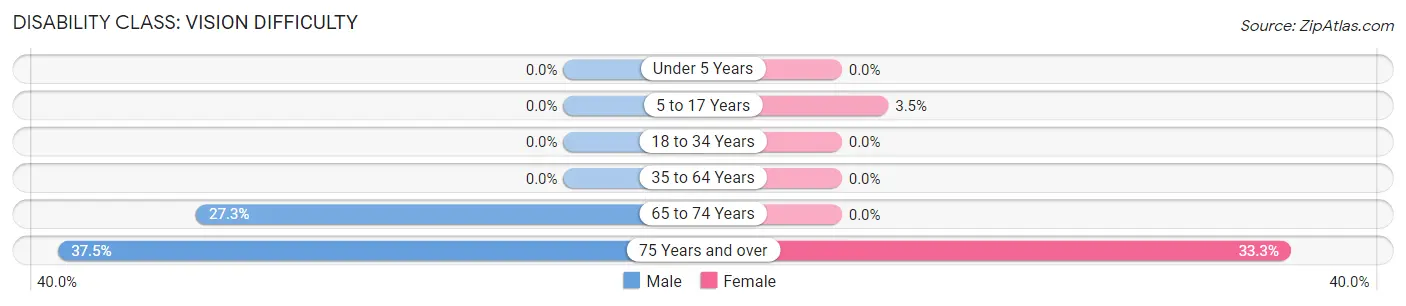
| Age Bracket | Male | Female |
| Under 5 Years | 0 (0.0%) | 0 (0.0%) |
| 5 to 17 Years | 0 (0.0%) | 1 (3.5%) |
| 18 to 34 Years | 0 (0.0%) | 0 (0.0%) |
| 35 to 64 Years | 0 (0.0%) | 0 (0.0%) |
| 65 to 74 Years | 3 (27.3%) | 0 (0.0%) |
| 75 Years and over | 3 (37.5%) | 1 (33.3%) |
Disability Class: Cognitive Difficulty
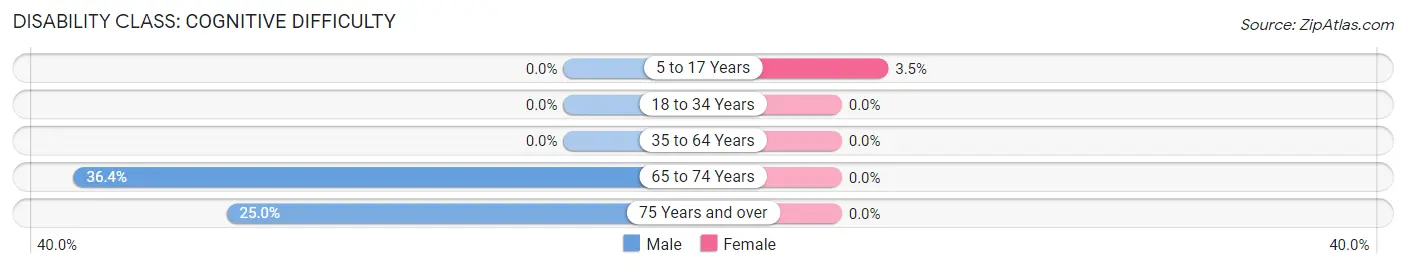
| Age Bracket | Male | Female |
| 5 to 17 Years | 0 (0.0%) | 1 (3.5%) |
| 18 to 34 Years | 0 (0.0%) | 0 (0.0%) |
| 35 to 64 Years | 0 (0.0%) | 0 (0.0%) |
| 65 to 74 Years | 4 (36.4%) | 0 (0.0%) |
| 75 Years and over | 2 (25.0%) | 0 (0.0%) |
Disability Class: Ambulatory Difficulty
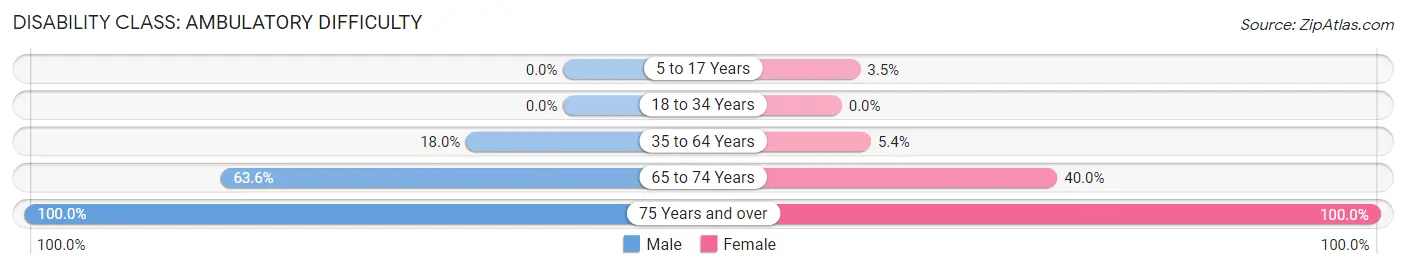
| Age Bracket | Male | Female |
| 5 to 17 Years | 0 (0.0%) | 1 (3.5%) |
| 18 to 34 Years | 0 (0.0%) | 0 (0.0%) |
| 35 to 64 Years | 11 (18.0%) | 2 (5.4%) |
| 65 to 74 Years | 7 (63.6%) | 4 (40.0%) |
| 75 Years and over | 8 (100.0%) | 3 (100.0%) |
Disability Class: Self-Care Difficulty
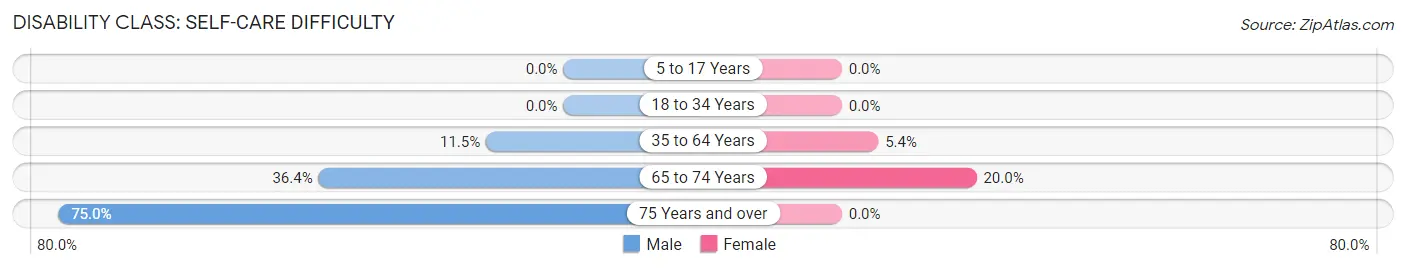
| Age Bracket | Male | Female |
| 5 to 17 Years | 0 (0.0%) | 0 (0.0%) |
| 18 to 34 Years | 0 (0.0%) | 0 (0.0%) |
| 35 to 64 Years | 7 (11.5%) | 2 (5.4%) |
| 65 to 74 Years | 4 (36.4%) | 2 (20.0%) |
| 75 Years and over | 6 (75.0%) | 0 (0.0%) |
Technology Access in Worley
Computing Device Access in Worley
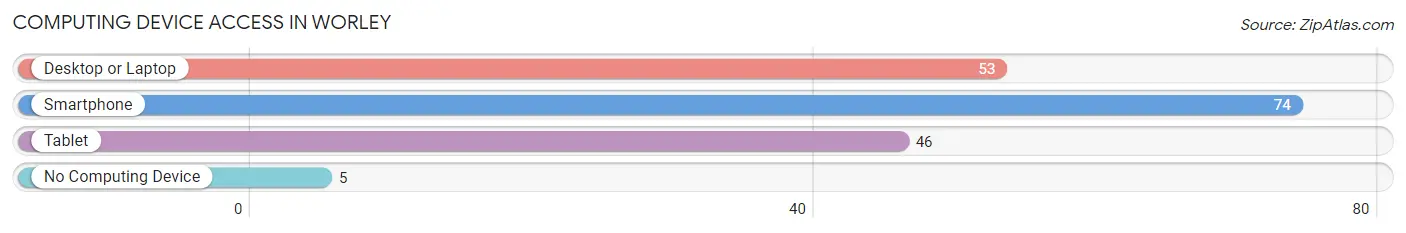
| Device Type | # Households | % Households |
| Desktop or Laptop | 53 | 58.2% |
| Smartphone | 74 | 81.3% |
| Tablet | 46 | 50.5% |
| No Computing Device | 5 | 5.5% |
| Total | 91 | 100.0% |
Internet Access in Worley
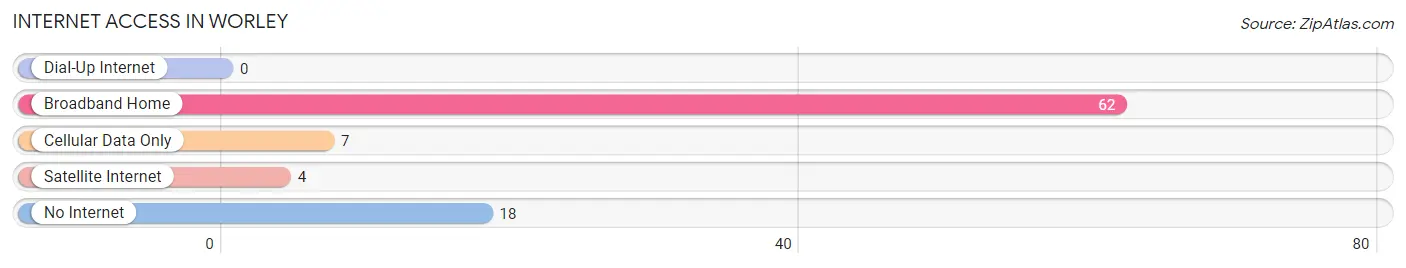
| Internet Type | # Households | % Households |
| Dial-Up Internet | 0 | 0.0% |
| Broadband Home | 62 | 68.1% |
| Cellular Data Only | 7 | 7.7% |
| Satellite Internet | 4 | 4.4% |
| No Internet | 18 | 19.8% |
| Total | 91 | 100.0% |
Worley Summary
Worley is a small city located in Kootenai County, Idaho. It is situated in the northern part of the state, about 25 miles south of Coeur d'Alene. The city has a population of 1,845 people, according to the 2010 census.
History
The area that is now Worley was first settled in the late 1800s by homesteaders. The town was originally called "Horse Prairie" due to the abundance of wild horses in the area. In the early 1900s, the town was renamed "Worley" after a local rancher, William Worley.
The town was officially incorporated in 1909 and has since grown to become a small city. The city has a rich history of mining, logging, and agriculture. In the early 1900s, the area was home to several large lumber mills and mining operations.
Geography
Worley is located in the northern part of Idaho, about 25 miles south of Coeur d'Alene. The city is situated in the foothills of the Rocky Mountains and is surrounded by forests and rolling hills. The city is located at an elevation of 2,743 feet above sea level.
The climate in Worley is generally mild, with hot summers and cold winters. The average high temperature in the summer is around 85 degrees Fahrenheit, while the average low temperature in the winter is around 20 degrees Fahrenheit.
Economy
The economy of Worley is largely based on agriculture and tourism. The city is home to several farms and ranches, as well as a number of tourist attractions. The city is also home to several small businesses, including restaurants, retail stores, and service providers.
The city is also home to a number of manufacturing companies, including a paper mill and a wood products plant. The city is also home to a number of government offices, including the Kootenai County Courthouse and the Kootenai County Sheriff's Office.
Demographics
According to the 2010 census, the population of Worley was 1,845 people. The racial makeup of the city was 94.3% White, 0.7% African American, 0.7% Native American, 0.3% Asian, 0.1% Pacific Islander, and 3.9% from other races. The median household income in Worley was $37,917, and the median family income was $45,938.
The city is home to a number of churches, including the Church of Jesus Christ of Latter-day Saints, the Catholic Church, and the United Methodist Church. The city is also home to a number of schools, including Worley Elementary School, Worley Middle School, and Worley High School.
Common Questions
What is Per Capita Income in Worley?
Per Capita income in Worley is $26,606.
What is the Median Family Income in Worley?
Median Family Income in Worley is $39,792.
What is the Median Household income in Worley?
Median Household Income in Worley is $41,563.
What is Income or Wage Gap in Worley?
Income or Wage Gap in Worley is 19.1%.
Women in Worley earn 80.9 cents for every dollar earned by a man.
What is Inequality or Gini Index in Worley?
Inequality or Gini Index in Worley is 0.47.
What is the Total Population of Worley?
Total Population of Worley is 258.
What is the Total Male Population of Worley?
Total Male Population of Worley is 134.
What is the Total Female Population of Worley?
Total Female Population of Worley is 124.
What is the Ratio of Males per 100 Females in Worley?
There are 108.06 Males per 100 Females in Worley.
What is the Ratio of Females per 100 Males in Worley?
There are 92.54 Females per 100 Males in Worley.
What is the Median Population Age in Worley?
Median Population Age in Worley is 35.2 Years.
What is the Average Family Size in Worley
Average Family Size in Worley is 3.3 People.
What is the Average Household Size in Worley
Average Household Size in Worley is 2.8 People.
How Large is the Labor Force in Worley?
There are 123 People in the Labor Forcein in Worley.
What is the Percentage of People in the Labor Force in Worley?
62.4% of People are in the Labor Force in Worley.
What is the Unemployment Rate in Worley?
Unemployment Rate in Worley is 6.5%.