Zip Codes with the Highest Percentage of Population Employed in Food Preparation & Serving in Rexburg, ID
RELATED REPORTS & OPTIONS
Food Preparation & Serving
Rexburg
Compare Zip Codes
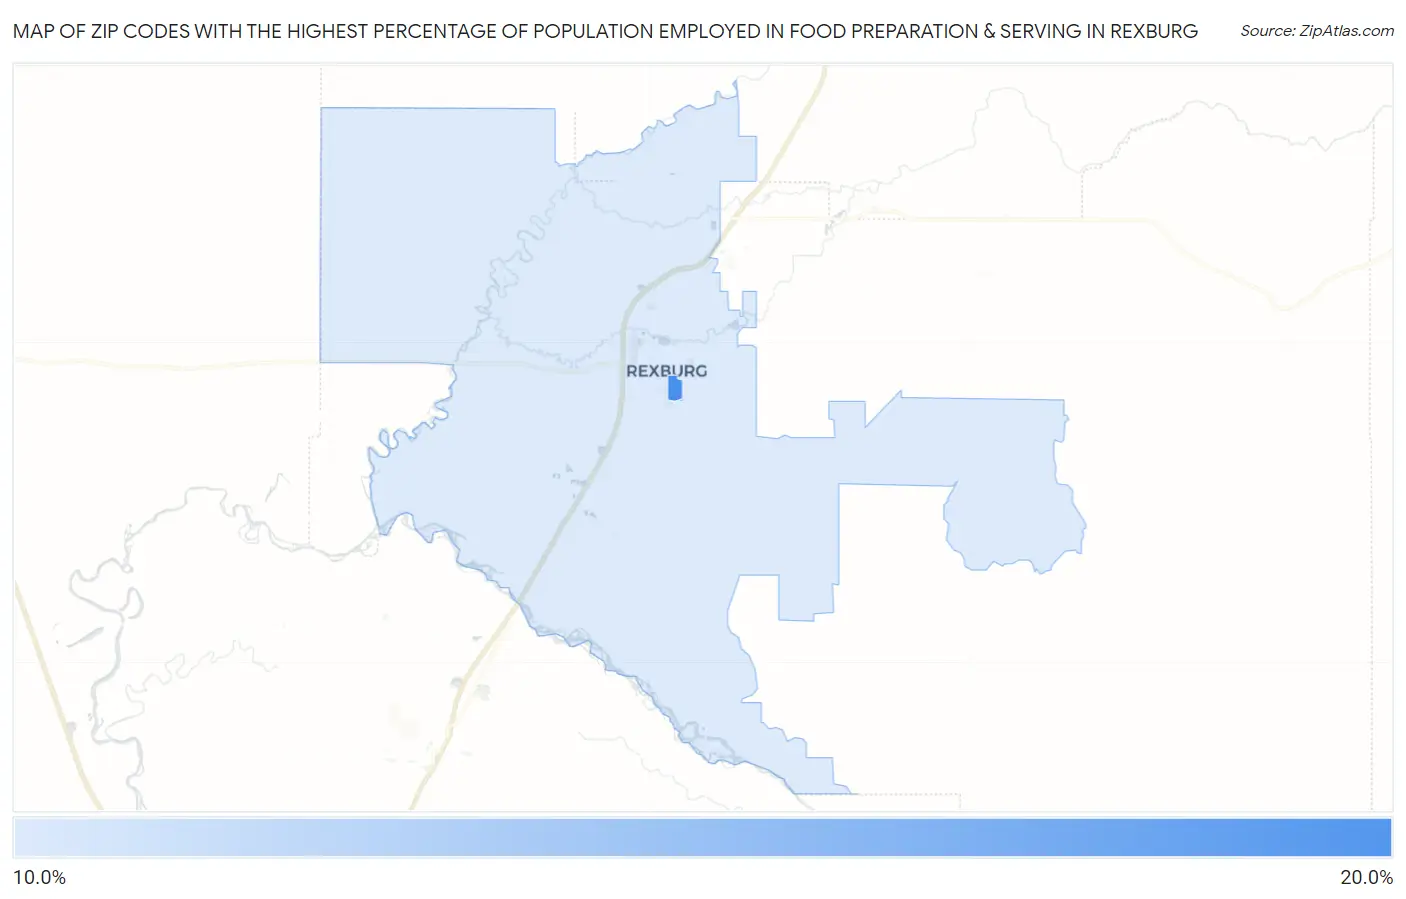
Map of Zip Codes with the Highest Percentage of Population Employed in Food Preparation & Serving in Rexburg
11.1%
20.0%
Zip Codes with the Highest Percentage of Population Employed in Food Preparation & Serving in Rexburg, ID
| Zip Code | % Employed | vs State | vs National | |
| 1. | 83460 | 20.0% | 5.7%(+14.3)#9 | 5.3%(+14.7)#508 |
| 2. | 83440 | 11.1% | 5.7%(+5.43)#20 | 5.3%(+5.82)#2,011 |
1
Common Questions
What are the Top Zip Codes with the Highest Percentage of Population Employed in Food Preparation & Serving in Rexburg, ID?
Top Zip Codes with the Highest Percentage of Population Employed in Food Preparation & Serving in Rexburg, ID are:
What zip code has the Highest Percentage of Population Employed in Food Preparation & Serving in Rexburg, ID?
83460 has the Highest Percentage of Population Employed in Food Preparation & Serving in Rexburg, ID with 20.0%.
What is the Percentage of Population Employed in Food Preparation & Serving in Rexburg, ID?
Percentage of Population Employed in Food Preparation & Serving in Rexburg is 12.4%.
What is the Percentage of Population Employed in Food Preparation & Serving in Idaho?
Percentage of Population Employed in Food Preparation & Serving in Idaho is 5.7%.
What is the Percentage of Population Employed in Food Preparation & Serving in the United States?
Percentage of Population Employed in Food Preparation & Serving in the United States is 5.3%.