Zip Codes with the Highest Percentage of Population Employed in Food Preparation & Serving in Idaho
RELATED REPORTS & OPTIONS
Food Preparation & Serving
Idaho
Compare Zip Codes
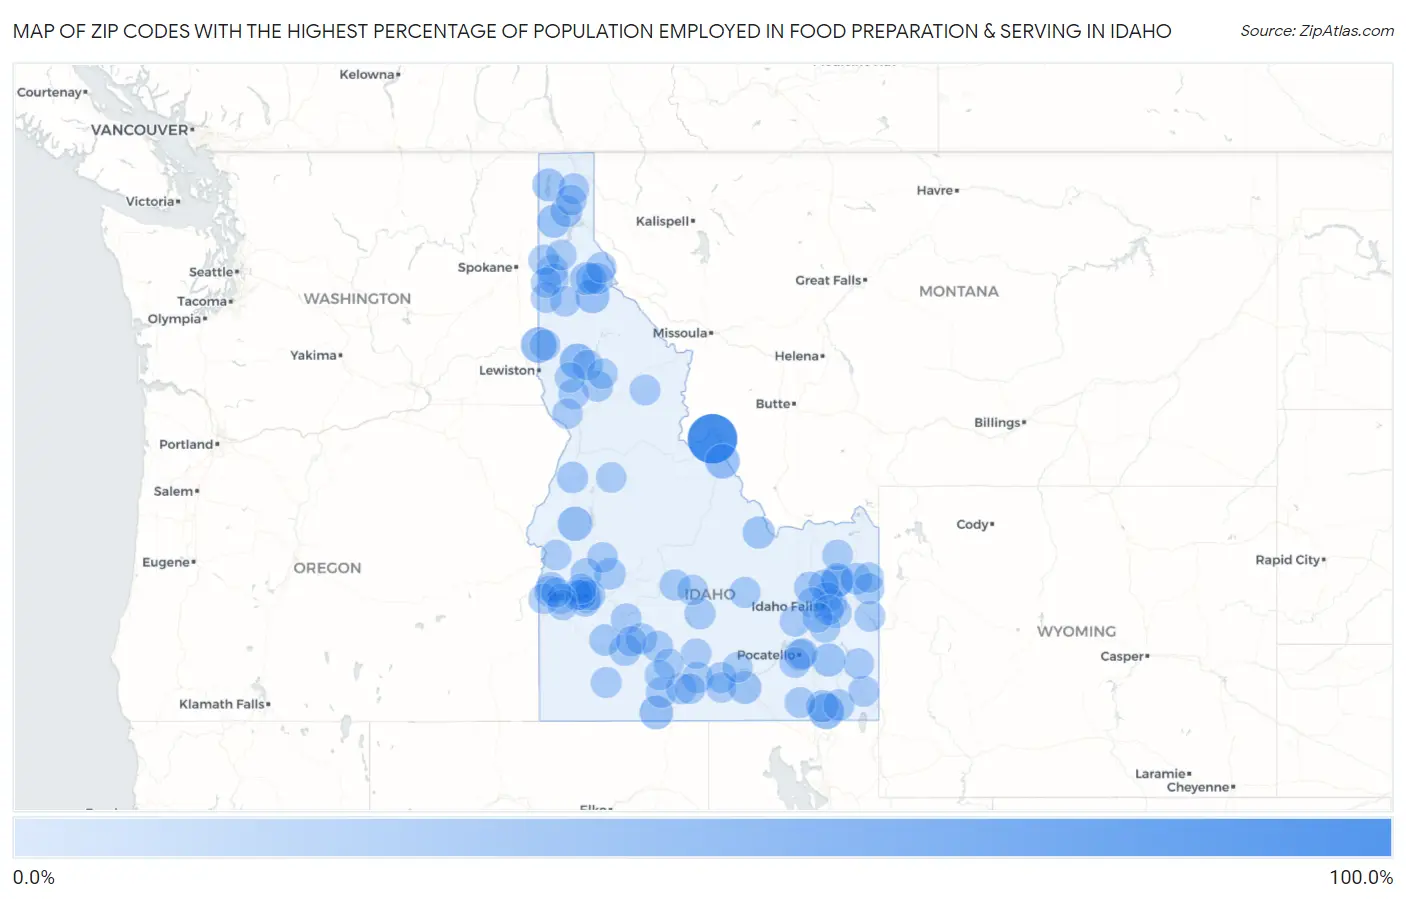
Map of Zip Codes with the Highest Percentage of Population Employed in Food Preparation & Serving in Idaho
0.0%
100.0%
Zip Codes with the Highest Percentage of Population Employed in Food Preparation & Serving in Idaho
| Zip Code | % Employed | vs State | vs National | |
| 1. | 83463 | 100.0% | 5.7%(+94.3)#1 | 5.3%(+94.7)#11 |
| 2. | 83844 | 30.8% | 5.7%(+25.1)#2 | 5.3%(+25.5)#197 |
| 3. | 83232 | 30.3% | 5.7%(+24.6)#3 | 5.3%(+25.0)#204 |
| 4. | 83520 | 29.0% | 5.7%(+23.4)#4 | 5.3%(+23.7)#231 |
| 5. | 83462 | 25.6% | 5.7%(+20.0)#5 | 5.3%(+20.4)#297 |
| 6. | 83632 | 24.0% | 5.7%(+18.3)#6 | 5.3%(+18.7)#340 |
| 7. | 83808 | 22.6% | 5.7%(+16.9)#7 | 5.3%(+17.3)#398 |
| 8. | 83302 | 21.5% | 5.7%(+15.8)#8 | 5.3%(+16.2)#437 |
| 9. | 83460 | 20.0% | 5.7%(+14.3)#9 | 5.3%(+14.7)#508 |
| 10. | 83217 | 18.9% | 5.7%(+13.2)#10 | 5.3%(+13.6)#577 |
| 11. | 83841 | 17.7% | 5.7%(+12.0)#11 | 5.3%(+12.4)#682 |
| 12. | 83868 | 16.9% | 5.7%(+11.2)#12 | 5.3%(+11.6)#757 |
| 13. | 83821 | 16.5% | 5.7%(+10.8)#13 | 5.3%(+11.2)#798 |
| 14. | 83323 | 16.2% | 5.7%(+10.6)#14 | 5.3%(+10.9)#830 |
| 15. | 83464 | 14.2% | 5.7%(+8.52)#15 | 5.3%(+8.90)#1,124 |
| 16. | 83228 | 13.5% | 5.7%(+7.82)#16 | 5.3%(+8.21)#1,278 |
| 17. | 83852 | 11.9% | 5.7%(+6.24)#17 | 5.3%(+6.62)#1,702 |
| 18. | 83627 | 11.4% | 5.7%(+5.74)#18 | 5.3%(+6.13)#1,872 |
| 19. | 83444 | 11.3% | 5.7%(+5.63)#19 | 5.3%(+6.02)#1,918 |
| 20. | 83440 | 11.1% | 5.7%(+5.43)#20 | 5.3%(+5.82)#2,011 |
| 21. | 83631 | 10.8% | 5.7%(+5.13)#21 | 5.3%(+5.51)#2,157 |
| 22. | 83436 | 10.8% | 5.7%(+5.11)#22 | 5.3%(+5.50)#2,162 |
| 23. | 83654 | 10.2% | 5.7%(+4.54)#23 | 5.3%(+4.92)#2,475 |
| 24. | 83648 | 10.1% | 5.7%(+4.40)#24 | 5.3%(+4.79)#2,578 |
| 25. | 83849 | 9.7% | 5.7%(+4.05)#25 | 5.3%(+4.43)#2,870 |
| 26. | 83629 | 9.7% | 5.7%(+3.99)#26 | 5.3%(+4.38)#2,912 |
| 27. | 83633 | 9.6% | 5.7%(+3.91)#27 | 5.3%(+4.29)#2,996 |
| 28. | 83837 | 9.5% | 5.7%(+3.83)#28 | 5.3%(+4.22)#3,051 |
| 29. | 83401 | 9.3% | 5.7%(+3.64)#29 | 5.3%(+4.02)#3,227 |
| 30. | 83209 | 9.3% | 5.7%(+3.63)#30 | 5.3%(+4.01)#3,238 |
| 31. | 83263 | 8.9% | 5.7%(+3.22)#31 | 5.3%(+3.61)#3,624 |
| 32. | 83213 | 8.9% | 5.7%(+3.19)#32 | 5.3%(+3.58)#3,648 |
| 33. | 83325 | 8.7% | 5.7%(+3.00)#33 | 5.3%(+3.38)#3,894 |
| 34. | 83422 | 8.5% | 5.7%(+2.87)#34 | 5.3%(+3.26)#4,027 |
| 35. | 83340 | 8.4% | 5.7%(+2.75)#35 | 5.3%(+3.14)#4,140 |
| 36. | 83536 | 8.2% | 5.7%(+2.52)#36 | 5.3%(+2.91)#4,442 |
| 37. | 83706 | 8.1% | 5.7%(+2.41)#37 | 5.3%(+2.80)#4,596 |
| 38. | 83313 | 8.0% | 5.7%(+2.35)#38 | 5.3%(+2.74)#4,699 |
| 39. | 83254 | 7.8% | 5.7%(+2.14)#39 | 5.3%(+2.53)#5,030 |
| 40. | 83321 | 7.8% | 5.7%(+2.13)#40 | 5.3%(+2.52)#5,043 |
| 41. | 83314 | 7.8% | 5.7%(+2.11)#41 | 5.3%(+2.50)#5,086 |
| 42. | 83604 | 7.8% | 5.7%(+2.09)#42 | 5.3%(+2.48)#5,119 |
| 43. | 83427 | 7.7% | 5.7%(+2.03)#43 | 5.3%(+2.41)#5,206 |
| 44. | 83814 | 7.7% | 5.7%(+2.00)#44 | 5.3%(+2.39)#5,259 |
| 45. | 83851 | 7.6% | 5.7%(+1.90)#45 | 5.3%(+2.28)#5,434 |
| 46. | 83705 | 7.5% | 5.7%(+1.86)#46 | 5.3%(+2.25)#5,488 |
| 47. | 83847 | 7.5% | 5.7%(+1.84)#47 | 5.3%(+2.22)#5,544 |
| 48. | 83301 | 7.4% | 5.7%(+1.74)#48 | 5.3%(+2.13)#5,718 |
| 49. | 83428 | 7.4% | 5.7%(+1.68)#49 | 5.3%(+2.07)#5,838 |
| 50. | 83703 | 7.3% | 5.7%(+1.58)#50 | 5.3%(+1.97)#6,017 |
| 51. | 83626 | 7.2% | 5.7%(+1.58)#51 | 5.3%(+1.96)#6,029 |
| 52. | 83712 | 7.2% | 5.7%(+1.48)#52 | 5.3%(+1.87)#6,220 |
| 53. | 83539 | 7.1% | 5.7%(+1.44)#53 | 5.3%(+1.83)#6,310 |
| 54. | 83864 | 7.1% | 5.7%(+1.40)#54 | 5.3%(+1.79)#6,397 |
| 55. | 83201 | 7.0% | 5.7%(+1.34)#55 | 5.3%(+1.73)#6,519 |
| 56. | 83252 | 7.0% | 5.7%(+1.34)#56 | 5.3%(+1.73)#6,521 |
| 57. | 83204 | 7.0% | 5.7%(+1.32)#57 | 5.3%(+1.71)#6,569 |
| 58. | 83843 | 6.9% | 5.7%(+1.23)#58 | 5.3%(+1.62)#6,809 |
| 59. | 83873 | 6.8% | 5.7%(+1.16)#59 | 5.3%(+1.55)#6,980 |
| 60. | 83221 | 6.8% | 5.7%(+1.14)#60 | 5.3%(+1.52)#7,047 |
| 61. | 83454 | 6.8% | 5.7%(+1.09)#61 | 5.3%(+1.48)#7,154 |
| 62. | 83713 | 6.8% | 5.7%(+1.08)#62 | 5.3%(+1.47)#7,190 |
| 63. | 83622 | 6.7% | 5.7%(+1.01)#63 | 5.3%(+1.39)#7,388 |
| 64. | 83445 | 6.6% | 5.7%(+0.971)#64 | 5.3%(+1.36)#7,497 |
| 65. | 83854 | 6.6% | 5.7%(+0.970)#65 | 5.3%(+1.36)#7,498 |
| 66. | 83353 | 6.6% | 5.7%(+0.970)#66 | 5.3%(+1.36)#7,500 |
| 67. | 83833 | 6.6% | 5.7%(+0.953)#67 | 5.3%(+1.34)#7,545 |
| 68. | 83434 | 6.6% | 5.7%(+0.915)#68 | 5.3%(+1.30)#7,633 |
| 69. | 83647 | 6.6% | 5.7%(+0.913)#69 | 5.3%(+1.30)#7,641 |
| 70. | 83276 | 6.6% | 5.7%(+0.885)#70 | 5.3%(+1.27)#7,704 |
| 71. | 83336 | 6.5% | 5.7%(+0.853)#71 | 5.3%(+1.24)#7,813 |
| 72. | 83656 | 6.4% | 5.7%(+0.768)#72 | 5.3%(+1.16)#8,029 |
| 73. | 83623 | 6.4% | 5.7%(+0.760)#73 | 5.3%(+1.15)#8,053 |
| 74. | 83628 | 6.4% | 5.7%(+0.679)#74 | 5.3%(+1.07)#8,269 |
| 75. | 83526 | 6.3% | 5.7%(+0.665)#75 | 5.3%(+1.05)#8,317 |
| 76. | 83544 | 6.3% | 5.7%(+0.655)#76 | 5.3%(+1.04)#8,345 |
| 77. | 83341 | 6.2% | 5.7%(+0.534)#77 | 5.3%(+0.921)#8,707 |
| 78. | 83553 | 6.2% | 5.7%(+0.481)#78 | 5.3%(+0.868)#8,869 |
| 79. | 83861 | 6.1% | 5.7%(+0.416)#79 | 5.3%(+0.803)#9,062 |
| 80. | 83835 | 6.0% | 5.7%(+0.376)#80 | 5.3%(+0.763)#9,175 |
| 81. | 83402 | 6.0% | 5.7%(+0.334)#81 | 5.3%(+0.721)#9,324 |
| 82. | 83548 | 6.0% | 5.7%(+0.327)#82 | 5.3%(+0.714)#9,346 |
| 83. | 83876 | 6.0% | 5.7%(+0.283)#83 | 5.3%(+0.670)#9,484 |
| 84. | 83638 | 6.0% | 5.7%(+0.279)#84 | 5.3%(+0.666)#9,496 |
| 85. | 83661 | 5.9% | 5.7%(+0.202)#85 | 5.3%(+0.589)#9,767 |
| 86. | 83704 | 5.9% | 5.7%(+0.201)#86 | 5.3%(+0.588)#9,773 |
| 87. | 83324 | 5.9% | 5.7%(+0.190)#87 | 5.3%(+0.577)#9,805 |
| 88. | 83236 | 5.8% | 5.7%(+0.169)#88 | 5.3%(+0.556)#9,893 |
| 89. | 83452 | 5.7% | 5.7%(+0.050)#89 | 5.3%(+0.437)#10,264 |
| 90. | 83714 | 5.6% | 5.7%(-0.043)#90 | 5.3%(+0.345)#10,601 |
| 91. | 83406 | 5.6% | 5.7%(-0.057)#91 | 5.3%(+0.330)#10,652 |
| 92. | 83318 | 5.6% | 5.7%(-0.079)#92 | 5.3%(+0.308)#10,732 |
| 93. | 83651 | 5.6% | 5.7%(-0.084)#93 | 5.3%(+0.303)#10,747 |
| 94. | 83355 | 5.5% | 5.7%(-0.154)#94 | 5.3%(+0.234)#11,001 |
| 95. | 83522 | 5.5% | 5.7%(-0.180)#95 | 5.3%(+0.207)#11,086 |
| 96. | 83316 | 5.5% | 5.7%(-0.218)#96 | 5.3%(+0.169)#11,202 |
| 97. | 83686 | 5.4% | 5.7%(-0.309)#97 | 5.3%(+0.079)#11,523 |
| 98. | 83350 | 5.3% | 5.7%(-0.413)#98 | 5.3%(-0.026)#11,922 |
| 99. | 83274 | 5.1% | 5.7%(-0.563)#99 | 5.3%(-0.176)#12,506 |
| 100. | 83607 | 5.1% | 5.7%(-0.613)#100 | 5.3%(-0.226)#12,688 |
Common Questions
What are the Top 10 Zip Codes with the Highest Percentage of Population Employed in Food Preparation & Serving in Idaho?
Top 10 Zip Codes with the Highest Percentage of Population Employed in Food Preparation & Serving in Idaho are:
What zip code has the Highest Percentage of Population Employed in Food Preparation & Serving in Idaho?
83463 has the Highest Percentage of Population Employed in Food Preparation & Serving in Idaho with 100.0%.
What is the Percentage of Population Employed in Food Preparation & Serving in the State of Idaho?
Percentage of Population Employed in Food Preparation & Serving in Idaho is 5.7%.
What is the Percentage of Population Employed in Food Preparation & Serving in the United States?
Percentage of Population Employed in Food Preparation & Serving in the United States is 5.3%.