Shelley, ID Map & Demographics
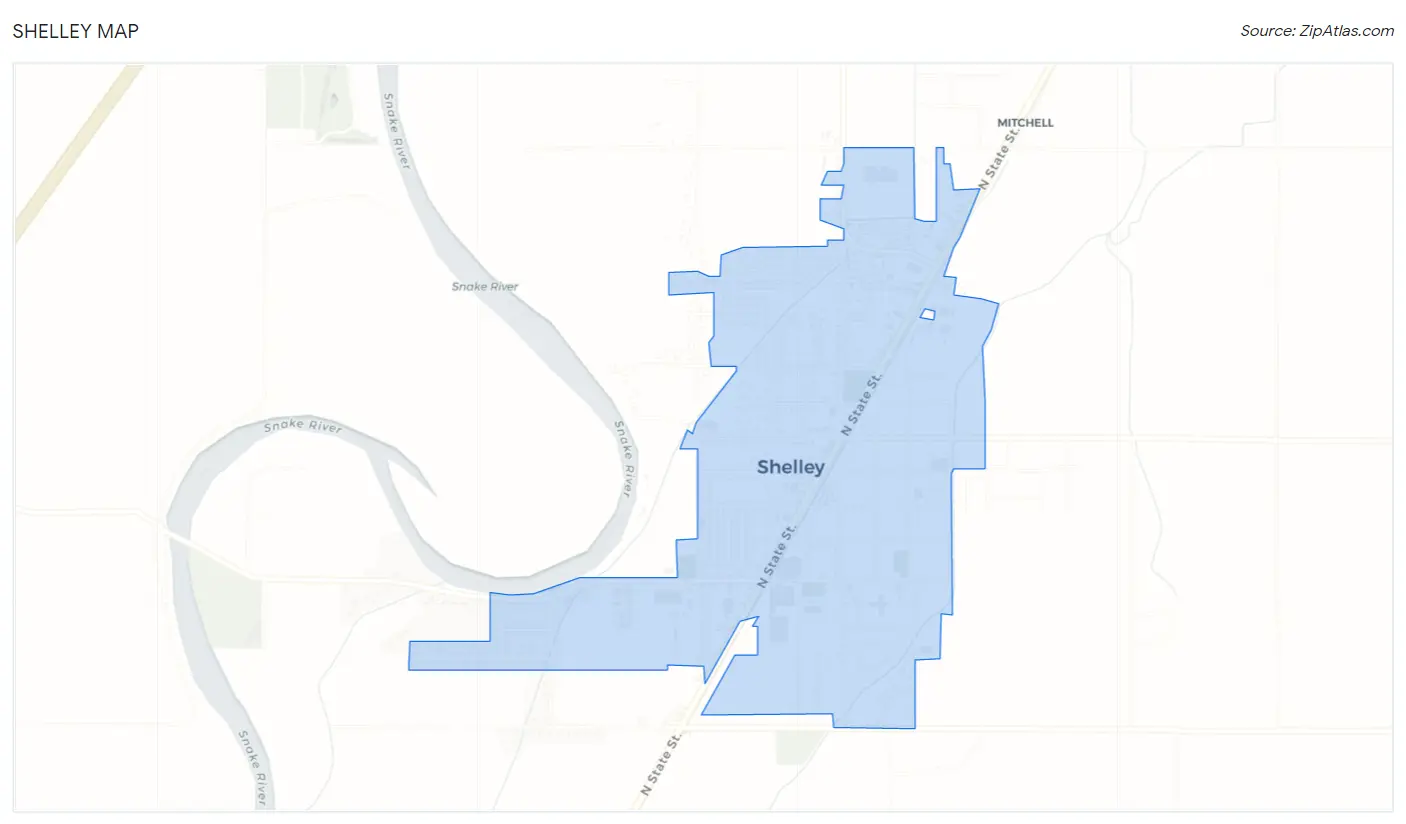
Shelley Map
Shelley Overview
$31,180
PER CAPITA INCOME
$76,179
AVG FAMILY INCOME
$64,783
AVG HOUSEHOLD INCOME
22.8%
WAGE / INCOME GAP [ % ]
77.2¢/ $1
WAGE / INCOME GAP [ $ ]
0.45
INEQUALITY / GINI INDEX
4,878
TOTAL POPULATION
2,459
MALE POPULATION
2,419
FEMALE POPULATION
101.65
MALES / 100 FEMALES
98.37
FEMALES / 100 MALES
29.9
MEDIAN AGE
3.9
AVG FAMILY SIZE
3.1
AVG HOUSEHOLD SIZE
2,675
LABOR FORCE [ PEOPLE ]
75.3%
PERCENT IN LABOR FORCE
9.4%
UNEMPLOYMENT RATE
Shelley Zip Codes
Shelley Area Codes
Income in Shelley
Income Overview in Shelley
Per Capita Income in Shelley is $31,180, while median incomes of families and households are $76,179 and $64,783 respectively.
| Characteristic | Number | Measure |
| Per Capita Income | 4,878 | $31,180 |
| Median Family Income | 1,129 | $76,179 |
| Mean Family Income | 1,129 | $109,839 |
| Median Household Income | 1,590 | $64,783 |
| Mean Household Income | 1,590 | $92,730 |
| Income Deficit | 1,129 | $0 |
| Wage / Income Gap (%) | 4,878 | 22.75% |
| Wage / Income Gap ($) | 4,878 | 77.25¢ per $1 |
| Gini / Inequality Index | 4,878 | 0.45 |
Earnings by Sex in Shelley
Average Earnings in Shelley are $29,360, $34,412 for men and $26,583 for women, a difference of 22.8%.
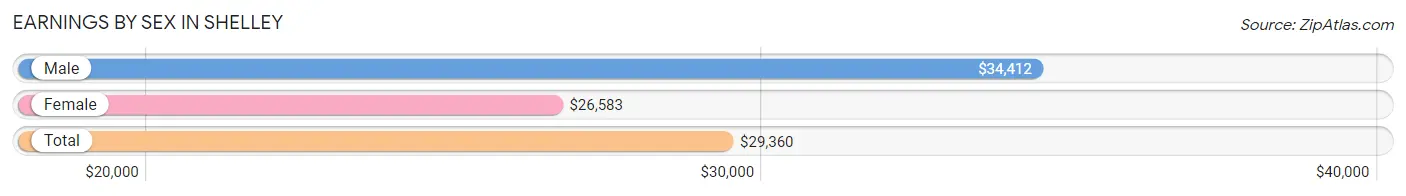
| Sex | Number | Average Earnings |
| Male | 1,372 (50.3%) | $34,412 |
| Female | 1,357 (49.7%) | $26,583 |
| Total | 2,729 (100.0%) | $29,360 |
Earnings by Sex by Income Bracket in Shelley
The most common earnings brackets in Shelley are $20,000 to $22,499 for men (236 | 17.2%) and $45,000 to $49,999 for women (158 | 11.6%).
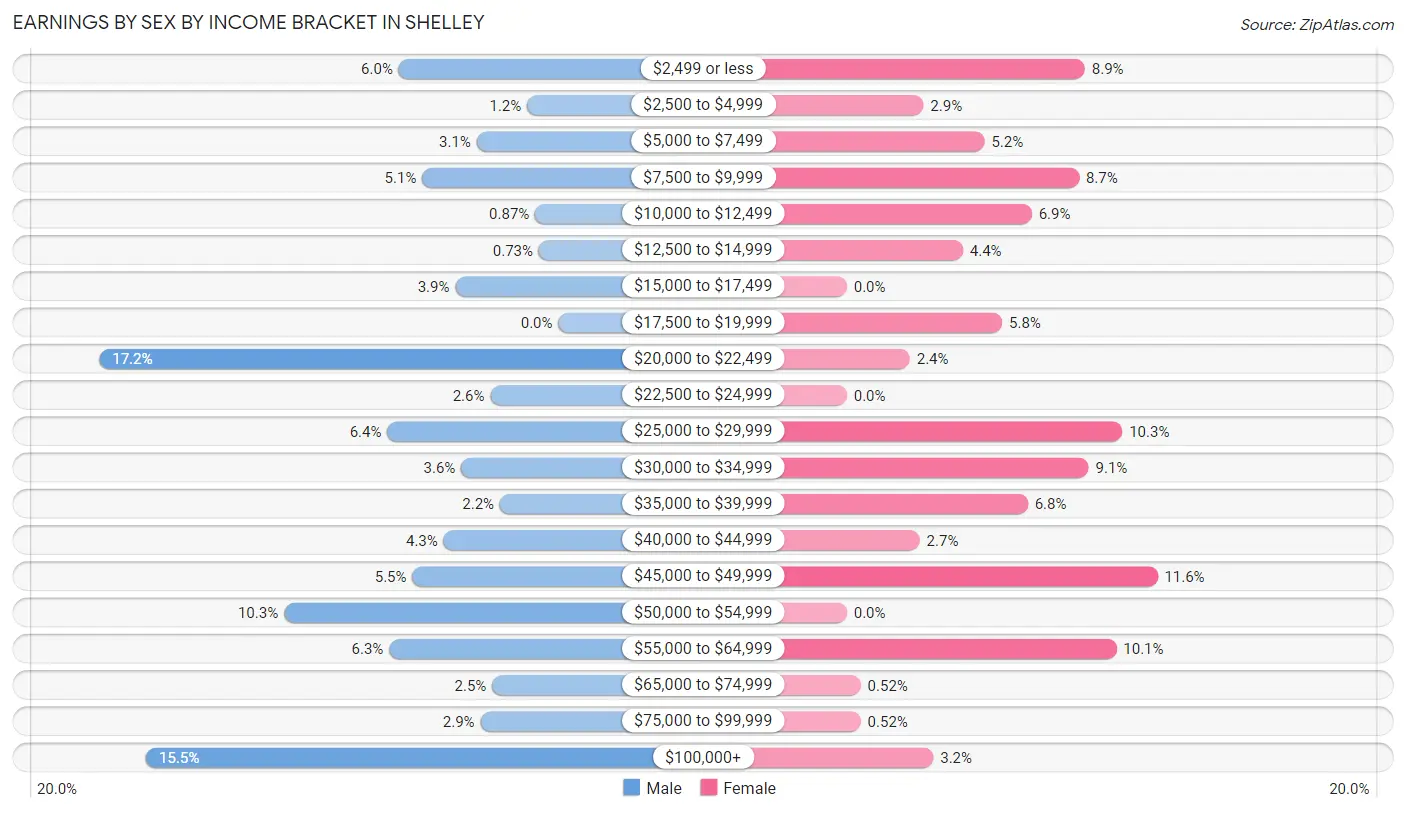
| Income | Male | Female |
| $2,499 or less | 82 (6.0%) | 121 (8.9%) |
| $2,500 to $4,999 | 16 (1.2%) | 39 (2.9%) |
| $5,000 to $7,499 | 42 (3.1%) | 70 (5.2%) |
| $7,500 to $9,999 | 70 (5.1%) | 118 (8.7%) |
| $10,000 to $12,499 | 12 (0.9%) | 94 (6.9%) |
| $12,500 to $14,999 | 10 (0.7%) | 59 (4.3%) |
| $15,000 to $17,499 | 53 (3.9%) | 0 (0.0%) |
| $17,500 to $19,999 | 0 (0.0%) | 79 (5.8%) |
| $20,000 to $22,499 | 236 (17.2%) | 32 (2.4%) |
| $22,500 to $24,999 | 35 (2.5%) | 0 (0.0%) |
| $25,000 to $29,999 | 88 (6.4%) | 140 (10.3%) |
| $30,000 to $34,999 | 50 (3.6%) | 123 (9.1%) |
| $35,000 to $39,999 | 30 (2.2%) | 92 (6.8%) |
| $40,000 to $44,999 | 59 (4.3%) | 37 (2.7%) |
| $45,000 to $49,999 | 75 (5.5%) | 158 (11.6%) |
| $50,000 to $54,999 | 141 (10.3%) | 0 (0.0%) |
| $55,000 to $64,999 | 87 (6.3%) | 137 (10.1%) |
| $65,000 to $74,999 | 34 (2.5%) | 7 (0.5%) |
| $75,000 to $99,999 | 40 (2.9%) | 7 (0.5%) |
| $100,000+ | 212 (15.4%) | 44 (3.2%) |
| Total | 1,372 (100.0%) | 1,357 (100.0%) |
Earnings by Sex by Educational Attainment in Shelley
Average earnings in Shelley are $46,315 for men and $31,351 for women, a difference of 32.3%. Men with an educational attainment of bachelor's degree enjoy the highest average annual earnings of $125,075, while those with less than high school education earn the least with $17,219. Women with an educational attainment of graduate degree earn the most with the average annual earnings of $60,970, while those with high school diploma education have the smallest earnings of $19,082.
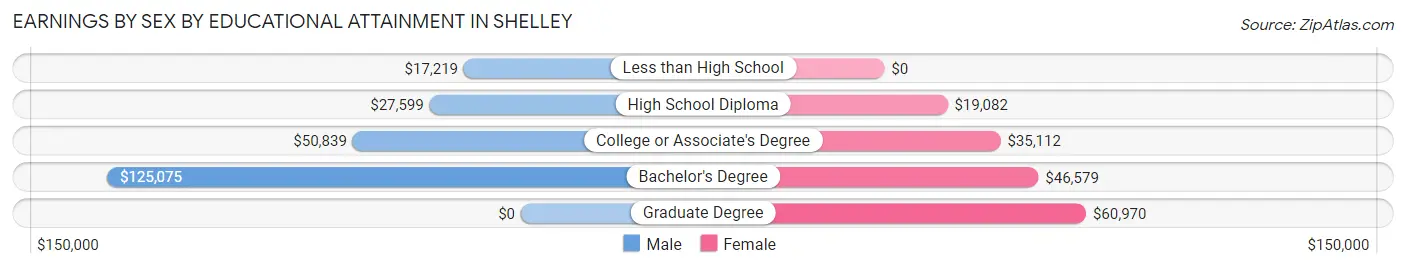
| Educational Attainment | Male Income | Female Income |
| Less than High School | $17,219 | $0 |
| High School Diploma | $27,599 | $19,082 |
| College or Associate's Degree | $50,839 | $35,112 |
| Bachelor's Degree | $125,075 | $46,579 |
| Graduate Degree | - | - |
| Total | $46,315 | $31,351 |
Family Income in Shelley
Family Income Brackets in Shelley
According to the Shelley family income data, there are 238 families falling into the $50,000 to $74,999 income range, which is the most common income bracket and makes up 21.1% of all families. Conversely, the $10,000 to $14,999 income bracket is the least frequent group with only 12 families (1.1%) belonging to this category.
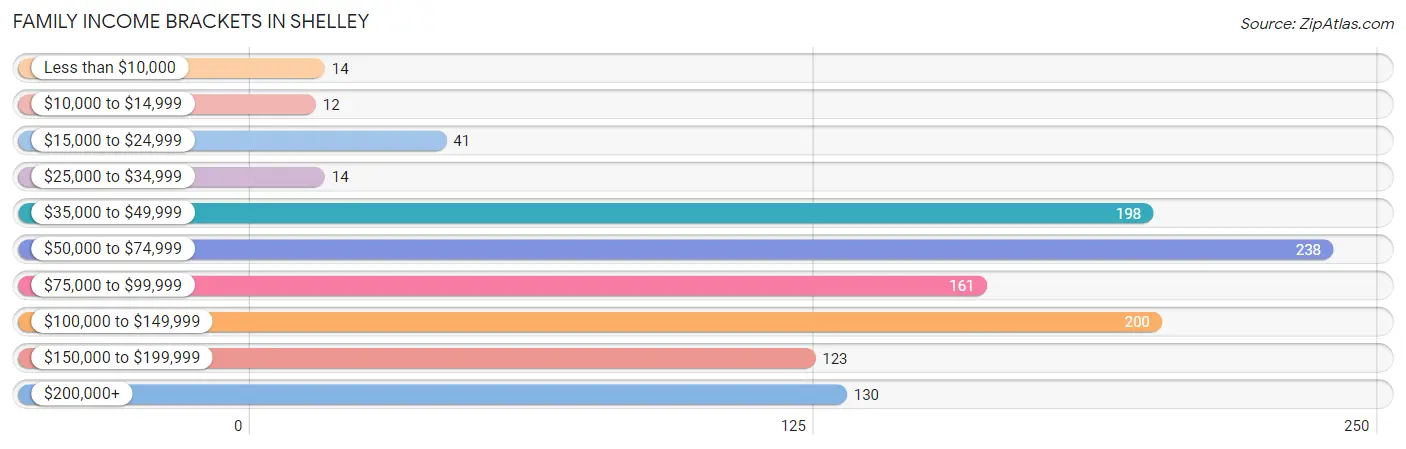
| Income Bracket | # Families | % Families |
| Less than $10,000 | 14 | 1.2% |
| $10,000 to $14,999 | 12 | 1.1% |
| $15,000 to $24,999 | 41 | 3.6% |
| $25,000 to $34,999 | 14 | 1.2% |
| $35,000 to $49,999 | 198 | 17.5% |
| $50,000 to $74,999 | 238 | 21.1% |
| $75,000 to $99,999 | 161 | 14.3% |
| $100,000 to $149,999 | 200 | 17.7% |
| $150,000 to $199,999 | 123 | 10.9% |
| $200,000+ | 130 | 11.5% |
Family Income by Famaliy Size in Shelley
4-person families (85 | 7.5%) account for the highest median family income in Shelley with $114,250 per family, while 2-person families (369 | 32.7%) have the highest median income of $29,648 per family member.
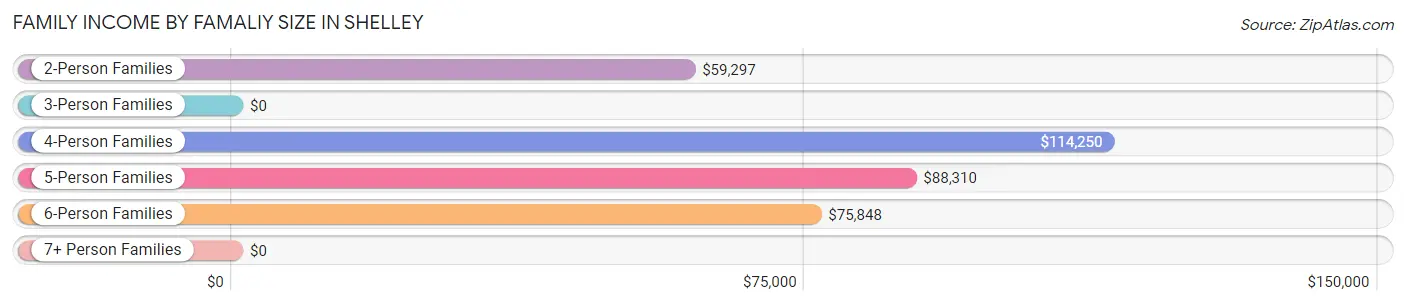
| Income Bracket | # Families | Median Income |
| 2-Person Families | 369 (32.7%) | $59,297 |
| 3-Person Families | 197 (17.4%) | $0 |
| 4-Person Families | 85 (7.5%) | $114,250 |
| 5-Person Families | 359 (31.8%) | $88,310 |
| 6-Person Families | 77 (6.8%) | $75,848 |
| 7+ Person Families | 42 (3.7%) | $0 |
| Total | 1,129 (100.0%) | $76,179 |
Family Income by Number of Earners in Shelley
The median family income in Shelley is $76,179, with families comprising 3+ earners (335) having the highest median family income of $131,477, while families with no earners (100) have the lowest median family income of $43,393, accounting for 29.7% and 8.9% of families, respectively.
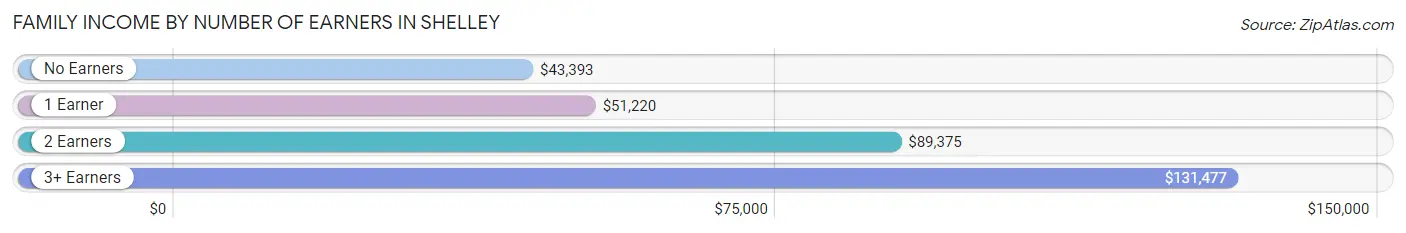
| Number of Earners | # Families | Median Income |
| No Earners | 100 (8.9%) | $43,393 |
| 1 Earner | 207 (18.3%) | $51,220 |
| 2 Earners | 487 (43.1%) | $89,375 |
| 3+ Earners | 335 (29.7%) | $131,477 |
| Total | 1,129 (100.0%) | $76,179 |
Household Income in Shelley
Household Income Brackets in Shelley
With 315 households falling in the category, the $35,000 to $49,999 income range is the most frequent in Shelley, accounting for 19.8% of all households. In contrast, only 25 households (1.6%) fall into the less than $10,000 income bracket, making it the least populous group.
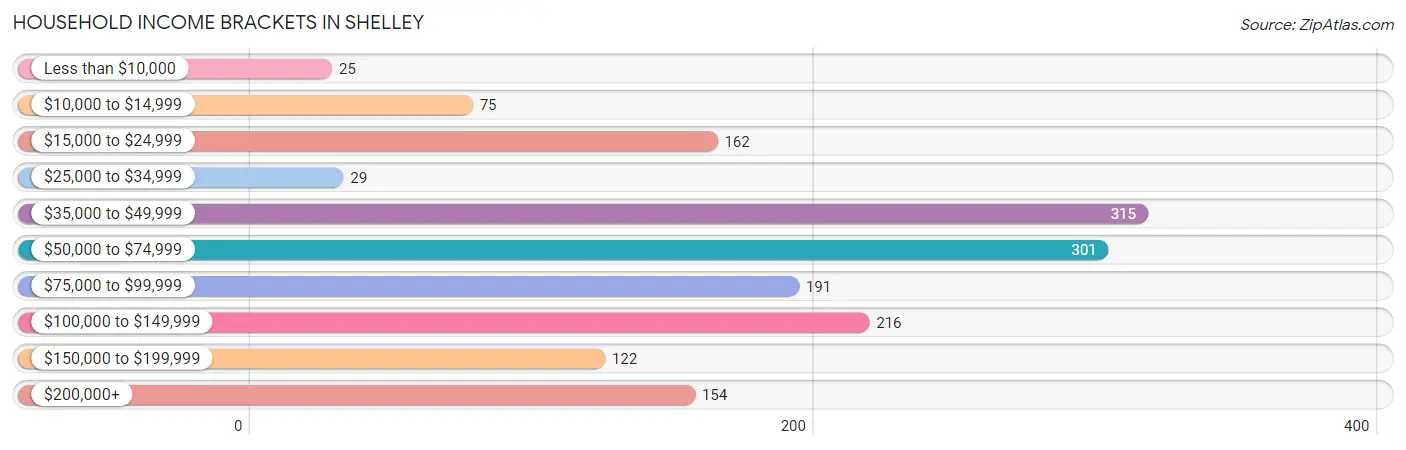
| Income Bracket | # Households | % Households |
| Less than $10,000 | 25 | 1.6% |
| $10,000 to $14,999 | 75 | 4.7% |
| $15,000 to $24,999 | 162 | 10.2% |
| $25,000 to $34,999 | 29 | 1.8% |
| $35,000 to $49,999 | 315 | 19.8% |
| $50,000 to $74,999 | 301 | 18.9% |
| $75,000 to $99,999 | 191 | 12.0% |
| $100,000 to $149,999 | 216 | 13.6% |
| $150,000 to $199,999 | 122 | 7.7% |
| $200,000+ | 154 | 9.7% |
Household Income by Householder Age in Shelley
The median household income in Shelley is $64,783, with the highest median household income of $77,145 found in the 25 to 44 years age bracket for the primary householder. A total of 633 households (39.8%) fall into this category. Meanwhile, the 15 to 24 years age bracket for the primary householder has the lowest median household income of $0, with 111 households (7.0%) in this group.
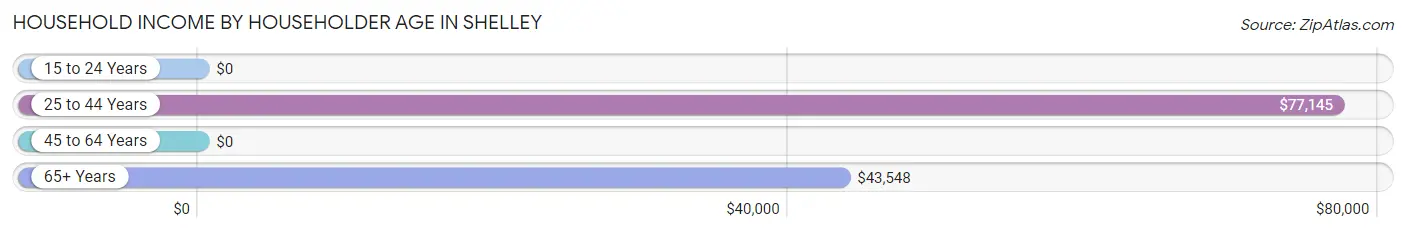
| Income Bracket | # Households | Median Income |
| 15 to 24 Years | 111 (7.0%) | $0 |
| 25 to 44 Years | 633 (39.8%) | $77,145 |
| 45 to 64 Years | 500 (31.5%) | $0 |
| 65+ Years | 346 (21.8%) | $43,548 |
| Total | 1,590 (100.0%) | $64,783 |
Poverty in Shelley
Income Below Poverty by Sex and Age in Shelley
With 10.8% poverty level for males and 3.0% for females among the residents of Shelley, 15 year old males and 75 year old and over females are the most vulnerable to poverty, with 33 males (100.0%) and 11 females (20.4%) in their respective age groups living below the poverty level.
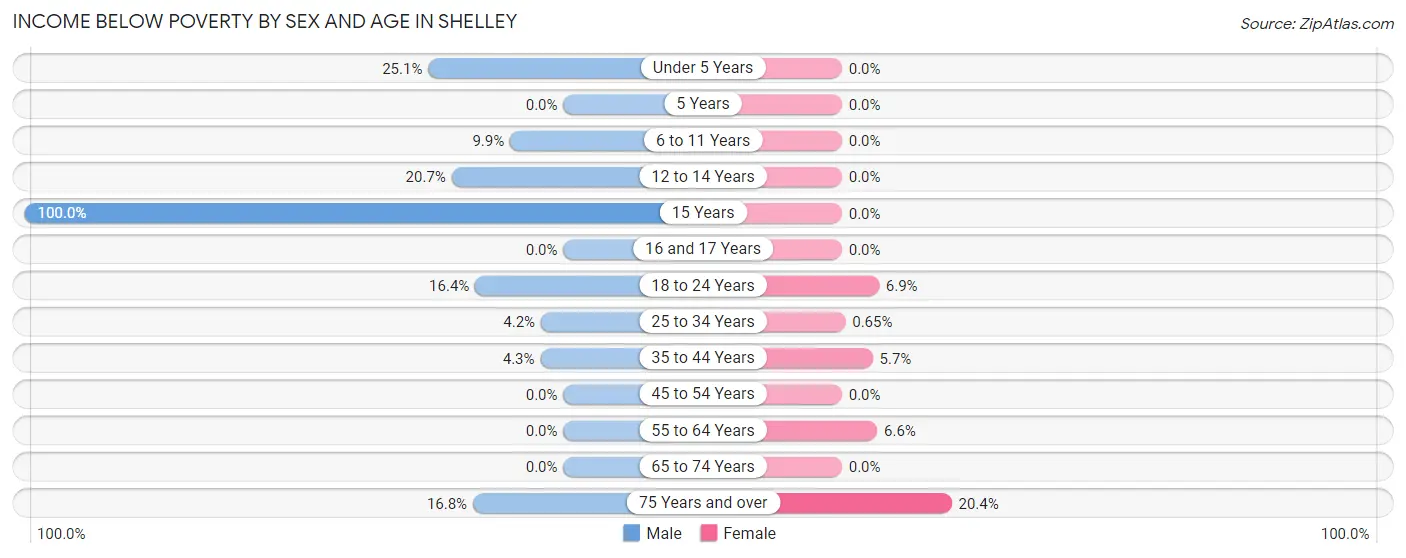
| Age Bracket | Male | Female |
| Under 5 Years | 80 (25.1%) | 0 (0.0%) |
| 5 Years | 0 (0.0%) | 0 (0.0%) |
| 6 to 11 Years | 29 (9.9%) | 0 (0.0%) |
| 12 to 14 Years | 17 (20.7%) | 0 (0.0%) |
| 15 Years | 33 (100.0%) | 0 (0.0%) |
| 16 and 17 Years | 0 (0.0%) | 0 (0.0%) |
| 18 to 24 Years | 55 (16.4%) | 18 (6.9%) |
| 25 to 34 Years | 15 (4.2%) | 2 (0.6%) |
| 35 to 44 Years | 12 (4.3%) | 23 (5.7%) |
| 45 to 54 Years | 0 (0.0%) | 0 (0.0%) |
| 55 to 64 Years | 0 (0.0%) | 19 (6.6%) |
| 65 to 74 Years | 0 (0.0%) | 0 (0.0%) |
| 75 Years and over | 25 (16.8%) | 11 (20.4%) |
| Total | 266 (10.8%) | 73 (3.0%) |
Income Above Poverty by Sex and Age in Shelley
According to the poverty statistics in Shelley, males aged 5 years and females aged under 5 years are the age groups that are most secure financially, with 100.0% of males and 100.0% of females in these age groups living above the poverty line.
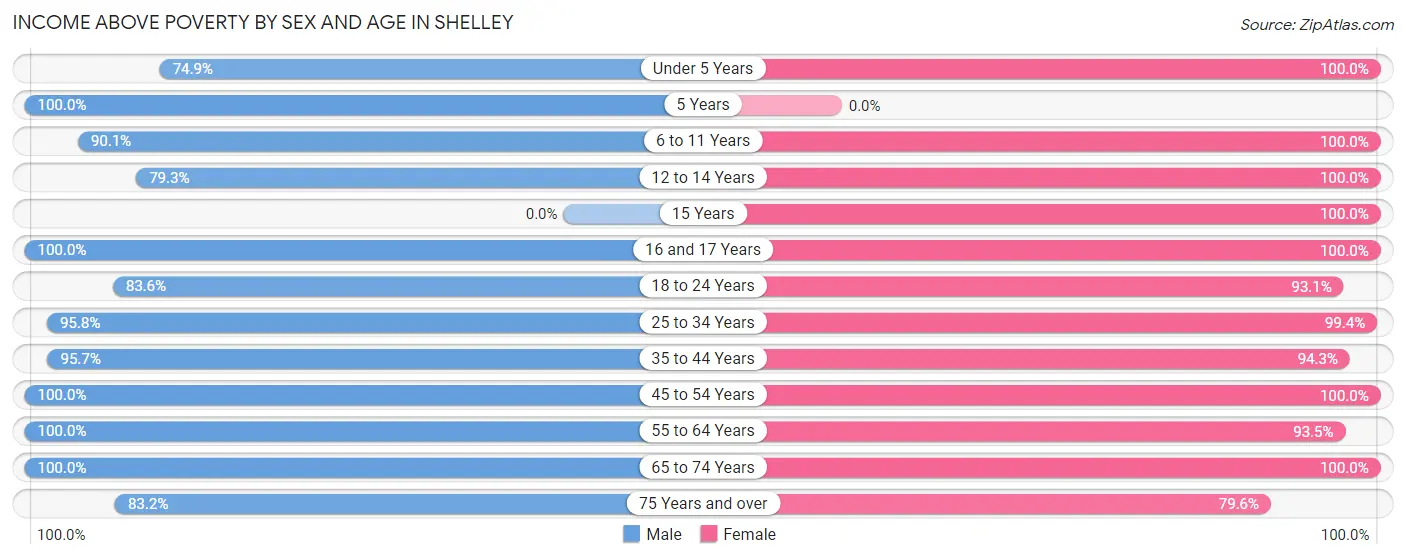
| Age Bracket | Male | Female |
| Under 5 Years | 239 (74.9%) | 244 (100.0%) |
| 5 Years | 46 (100.0%) | 0 (0.0%) |
| 6 to 11 Years | 264 (90.1%) | 188 (100.0%) |
| 12 to 14 Years | 65 (79.3%) | 111 (100.0%) |
| 15 Years | 0 (0.0%) | 10 (100.0%) |
| 16 and 17 Years | 81 (100.0%) | 72 (100.0%) |
| 18 to 24 Years | 281 (83.6%) | 244 (93.1%) |
| 25 to 34 Years | 346 (95.8%) | 306 (99.4%) |
| 35 to 44 Years | 269 (95.7%) | 380 (94.3%) |
| 45 to 54 Years | 253 (100.0%) | 301 (100.0%) |
| 55 to 64 Years | 126 (100.0%) | 271 (93.4%) |
| 65 to 74 Years | 99 (100.0%) | 169 (100.0%) |
| 75 Years and over | 124 (83.2%) | 43 (79.6%) |
| Total | 2,193 (89.2%) | 2,339 (97.0%) |
Income Below Poverty Among Married-Couple Families in Shelley
The poverty statistics for married-couple families in Shelley show that 4.0% or 35 of the total 885 families live below the poverty line. Families with 3 or 4 children have the highest poverty rate of 5.0%, comprising of 13 families. On the other hand, families with 5 or more children have the lowest poverty rate of 0.0%, which includes 0 families.
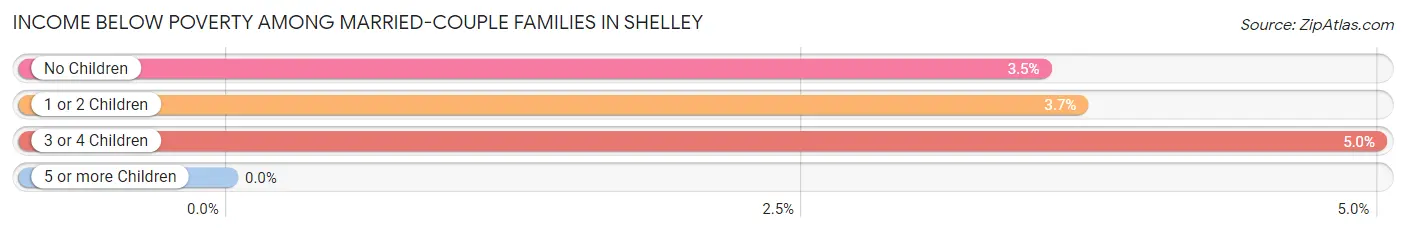
| Children | Above Poverty | Below Poverty |
| No Children | 354 (96.5%) | 13 (3.5%) |
| 1 or 2 Children | 234 (96.3%) | 9 (3.7%) |
| 3 or 4 Children | 247 (95.0%) | 13 (5.0%) |
| 5 or more Children | 15 (100.0%) | 0 (0.0%) |
| Total | 850 (96.1%) | 35 (4.0%) |
Income Below Poverty Among Single-Parent Households in Shelley
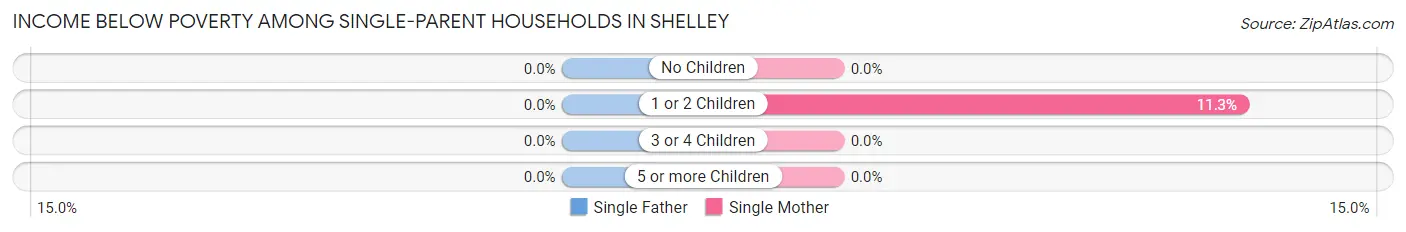
| Children | Single Father | Single Mother |
| No Children | 0 (0.0%) | 0 (0.0%) |
| 1 or 2 Children | 0 (0.0%) | 12 (11.3%) |
| 3 or 4 Children | 0 (0.0%) | 0 (0.0%) |
| 5 or more Children | 0 (0.0%) | 0 (0.0%) |
| Total | 0 (0.0%) | 12 (5.5%) |
Income Below Poverty Among Married-Couple vs Single-Parent Households in Shelley
The poverty data for Shelley shows that 35 of the married-couple family households (4.0%) and 12 of the single-parent households (4.9%) are living below the poverty level. Within the married-couple family households, those with 3 or 4 children have the highest poverty rate, with 13 households (5.0%) falling below the poverty line. Among the single-parent households, those with 1 or 2 children have the highest poverty rate, with 12 household (9.0%) living below poverty.
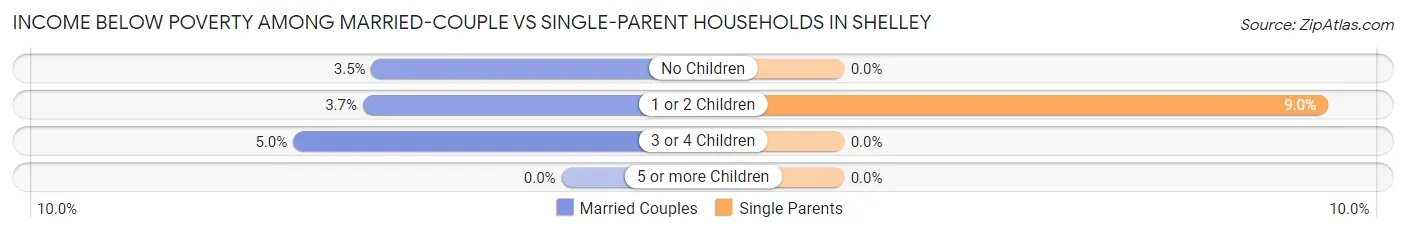
| Children | Married-Couple Families | Single-Parent Households |
| No Children | 13 (3.5%) | 0 (0.0%) |
| 1 or 2 Children | 9 (3.7%) | 12 (9.0%) |
| 3 or 4 Children | 13 (5.0%) | 0 (0.0%) |
| 5 or more Children | 0 (0.0%) | 0 (0.0%) |
| Total | 35 (4.0%) | 12 (4.9%) |
Race in Shelley
The most populous races in Shelley are White / Caucasian (4,033 | 82.7%), Hispanic or Latino (597 | 12.2%), and Two or more Races (509 | 10.4%).
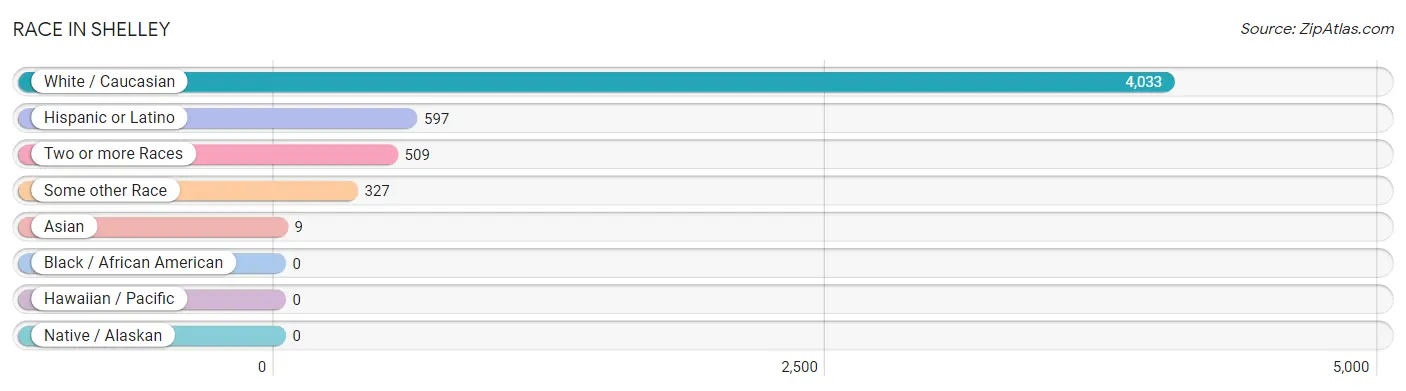
| Race | # Population | % Population |
| Asian | 9 | 0.2% |
| Black / African American | 0 | 0.0% |
| Hawaiian / Pacific | 0 | 0.0% |
| Hispanic or Latino | 597 | 12.2% |
| Native / Alaskan | 0 | 0.0% |
| White / Caucasian | 4,033 | 82.7% |
| Two or more Races | 509 | 10.4% |
| Some other Race | 327 | 6.7% |
| Total | 4,878 | 100.0% |
Ancestry in Shelley
The most populous ancestries reported in Shelley are English (1,599 | 32.8%), American (496 | 10.2%), Mexican (418 | 8.6%), German (356 | 7.3%), and Danish (282 | 5.8%), together accounting for 64.6% of all Shelley residents.
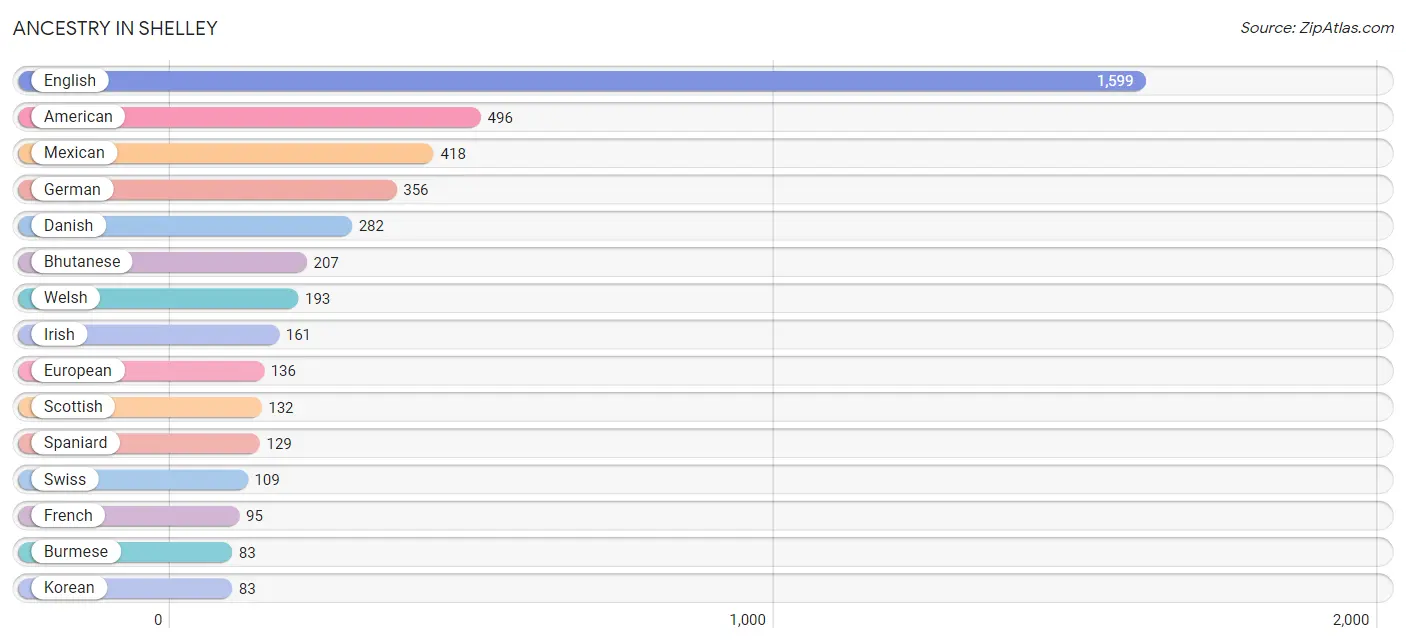
| Ancestry | # Population | % Population |
| American | 496 | 10.2% |
| Bhutanese | 207 | 4.2% |
| Burmese | 83 | 1.7% |
| Danish | 282 | 5.8% |
| Dutch | 58 | 1.2% |
| English | 1,599 | 32.8% |
| European | 136 | 2.8% |
| French | 95 | 1.9% |
| German | 356 | 7.3% |
| Indian (Asian) | 9 | 0.2% |
| Irish | 161 | 3.3% |
| Korean | 83 | 1.7% |
| Mexican | 418 | 8.6% |
| Native Hawaiian | 83 | 1.7% |
| Northern European | 15 | 0.3% |
| Norwegian | 21 | 0.4% |
| Russian | 10 | 0.2% |
| Scandinavian | 7 | 0.1% |
| Scottish | 132 | 2.7% |
| Spaniard | 129 | 2.6% |
| Swedish | 21 | 0.4% |
| Swiss | 109 | 2.2% |
| Welsh | 193 | 4.0% | View All 23 Rows |
Immigrants in Shelley
The most numerous immigrant groups reported in Shelley came from Central America (295 | 6.0%), Latin America (295 | 6.0%), Mexico (271 | 5.6%), and El Salvador (24 | 0.5%), together accounting for 18.1% of all Shelley residents.
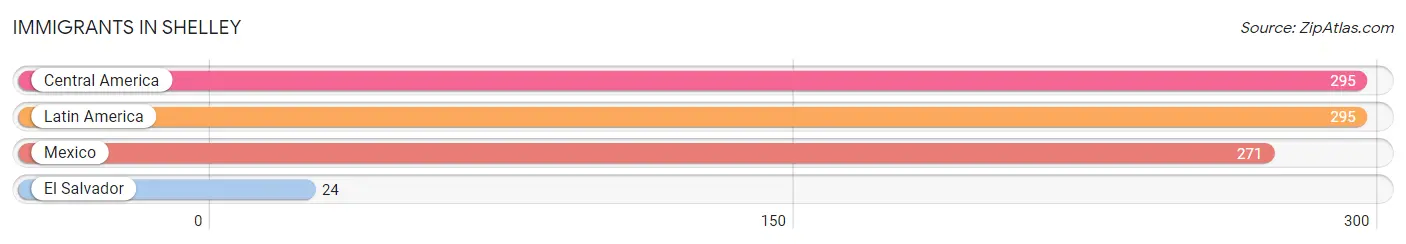
| Immigration Origin | # Population | % Population |
| Central America | 295 | 6.0% |
| El Salvador | 24 | 0.5% |
| Latin America | 295 | 6.0% |
| Mexico | 271 | 5.6% | View All 4 Rows |
Sex and Age in Shelley
Sex and Age in Shelley
The most populous age groups in Shelley are 20 to 24 Years (321 | 13.1%) for men and 40 to 44 Years (334 | 13.8%) for women.
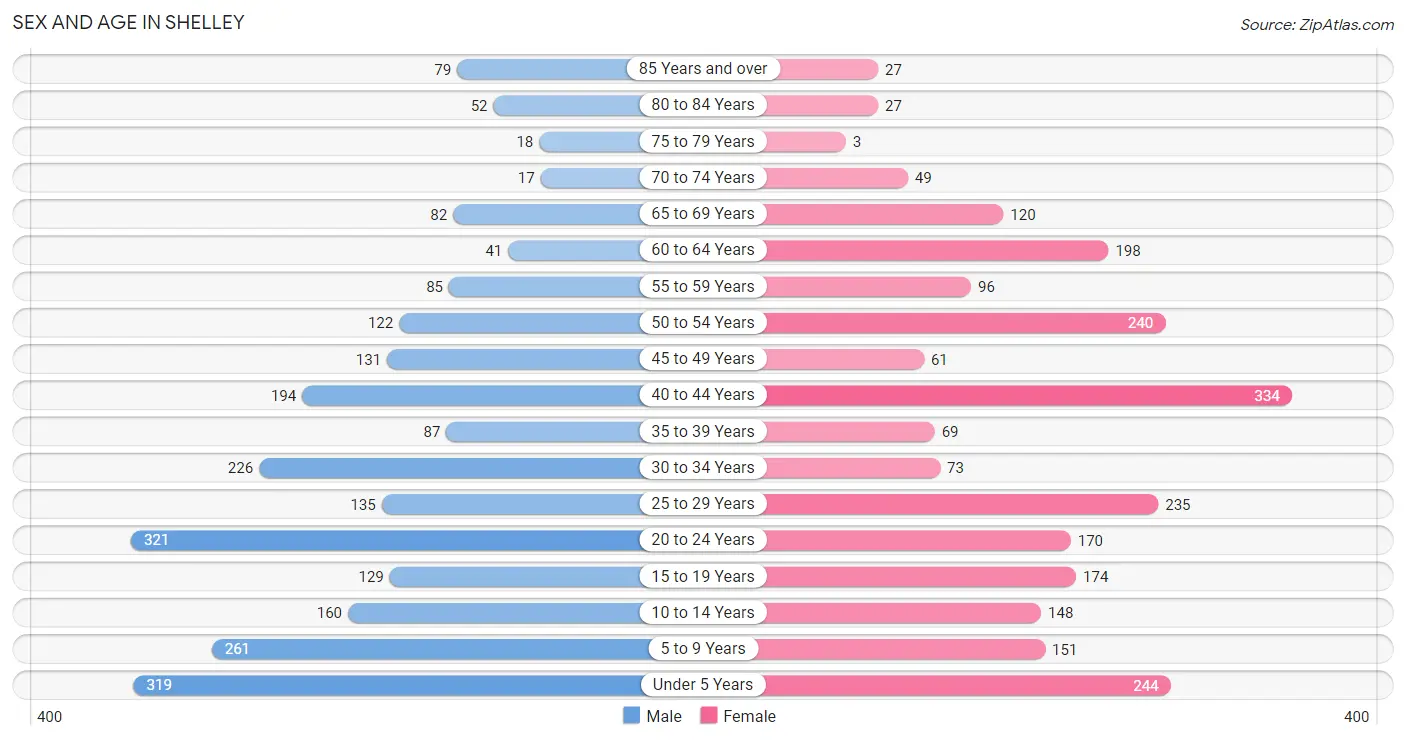
| Age Bracket | Male | Female |
| Under 5 Years | 319 (13.0%) | 244 (10.1%) |
| 5 to 9 Years | 261 (10.6%) | 151 (6.2%) |
| 10 to 14 Years | 160 (6.5%) | 148 (6.1%) |
| 15 to 19 Years | 129 (5.2%) | 174 (7.2%) |
| 20 to 24 Years | 321 (13.1%) | 170 (7.0%) |
| 25 to 29 Years | 135 (5.5%) | 235 (9.7%) |
| 30 to 34 Years | 226 (9.2%) | 73 (3.0%) |
| 35 to 39 Years | 87 (3.5%) | 69 (2.9%) |
| 40 to 44 Years | 194 (7.9%) | 334 (13.8%) |
| 45 to 49 Years | 131 (5.3%) | 61 (2.5%) |
| 50 to 54 Years | 122 (5.0%) | 240 (9.9%) |
| 55 to 59 Years | 85 (3.5%) | 96 (4.0%) |
| 60 to 64 Years | 41 (1.7%) | 198 (8.2%) |
| 65 to 69 Years | 82 (3.3%) | 120 (5.0%) |
| 70 to 74 Years | 17 (0.7%) | 49 (2.0%) |
| 75 to 79 Years | 18 (0.7%) | 3 (0.1%) |
| 80 to 84 Years | 52 (2.1%) | 27 (1.1%) |
| 85 Years and over | 79 (3.2%) | 27 (1.1%) |
| Total | 2,459 (100.0%) | 2,419 (100.0%) |
Families and Households in Shelley
Median Family Size in Shelley
The median family size in Shelley is 3.85 persons per family, with single male/father families (27 | 2.4%) accounting for the largest median family size of 4.74 persons per family. On the other hand, single female/mother families (217 | 19.2%) represent the smallest median family size with 3.32 persons per family.
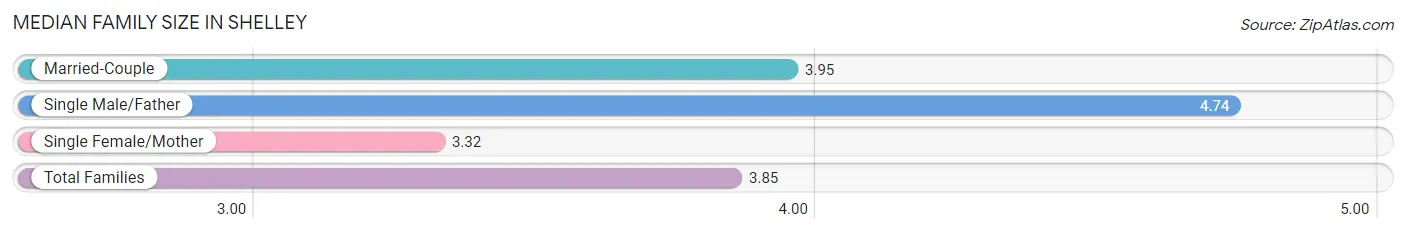
| Family Type | # Families | Family Size |
| Married-Couple | 885 (78.4%) | 3.95 |
| Single Male/Father | 27 (2.4%) | 4.74 |
| Single Female/Mother | 217 (19.2%) | 3.32 |
| Total Families | 1,129 (100.0%) | 3.85 |
Median Household Size in Shelley
The median household size in Shelley is 3.06 persons per household, with single male/father households (27 | 1.7%) accounting for the largest median household size of 4.74 persons per household. non-family households (461 | 29.0%) represent the smallest median household size with 1.13 persons per household.
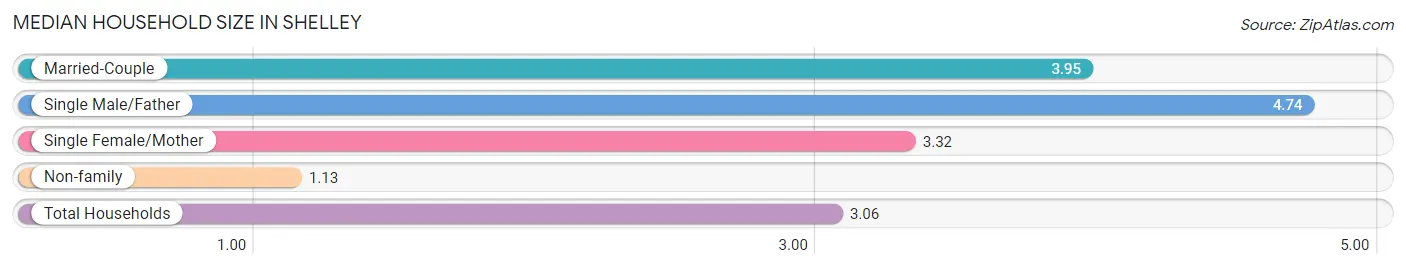
| Household Type | # Households | Household Size |
| Married-Couple | 885 (55.7%) | 3.95 |
| Single Male/Father | 27 (1.7%) | 4.74 |
| Single Female/Mother | 217 (13.7%) | 3.32 |
| Non-family | 461 (29.0%) | 1.13 |
| Total Households | 1,590 (100.0%) | 3.06 |
Household Size by Marriage Status in Shelley
Out of a total of 1,590 households in Shelley, 1,129 (71.0%) are family households, while 461 (29.0%) are nonfamily households. The most numerous type of family households are 2-person households, comprising 369, and the most common type of nonfamily households are 1-person households, comprising 421.
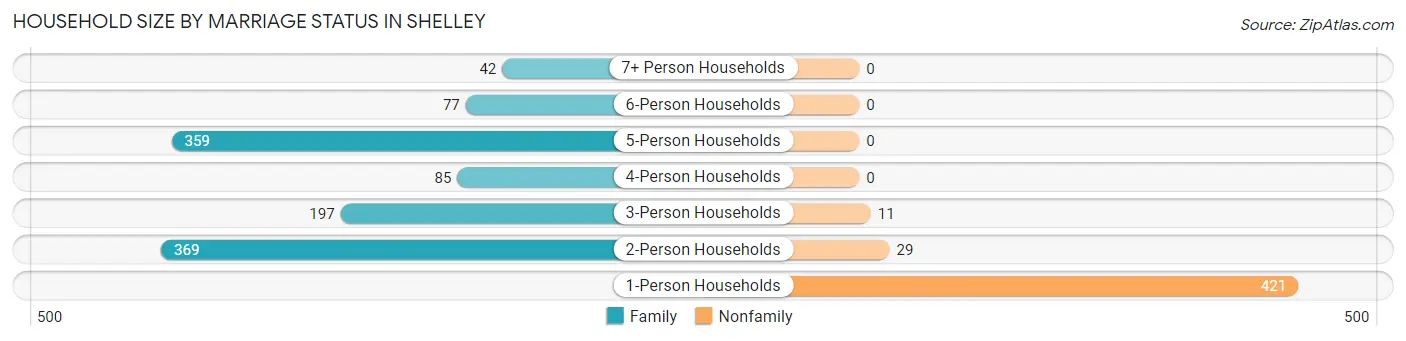
| Household Size | Family Households | Nonfamily Households |
| 1-Person Households | - | 421 (26.5%) |
| 2-Person Households | 369 (23.2%) | 29 (1.8%) |
| 3-Person Households | 197 (12.4%) | 11 (0.7%) |
| 4-Person Households | 85 (5.3%) | 0 (0.0%) |
| 5-Person Households | 359 (22.6%) | 0 (0.0%) |
| 6-Person Households | 77 (4.8%) | 0 (0.0%) |
| 7+ Person Households | 42 (2.6%) | 0 (0.0%) |
| Total | 1,129 (71.0%) | 461 (29.0%) |
Female Fertility in Shelley
Fertility by Age in Shelley
Average fertility rate in Shelley is 85.0 births per 1,000 women. Women in the age bracket of 20 to 34 years have the highest fertility rate with 165.0 births per 1,000 women. Women in the age bracket of 20 to 34 years acount for 81.4% of all women with births.
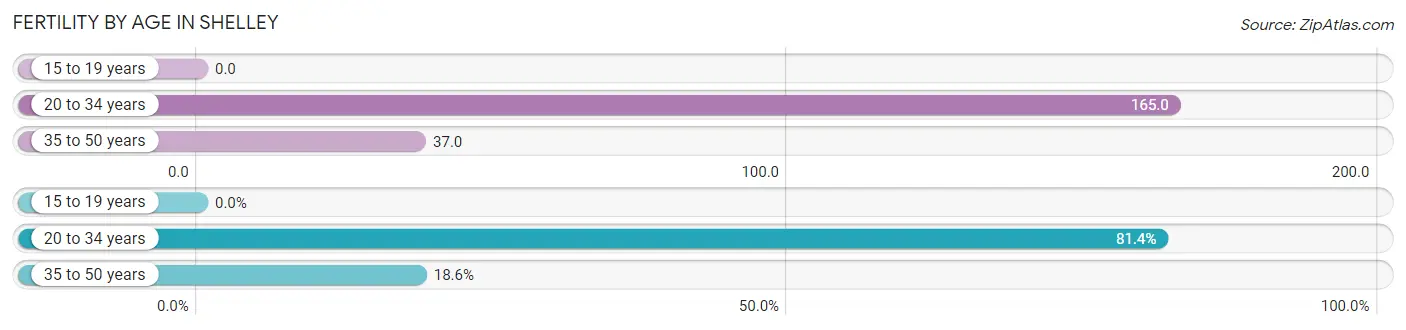
| Age Bracket | Women with Births | Births / 1,000 Women |
| 15 to 19 years | 0 (0.0%) | 0.0 |
| 20 to 34 years | 79 (81.4%) | 165.0 |
| 35 to 50 years | 18 (18.6%) | 37.0 |
| Total | 97 (100.0%) | 85.0 |
Fertility by Age by Marriage Status in Shelley
81.4% of women with births (97) in Shelley are married. The highest percentage of unmarried women with births falls into 35 to 50 years age bracket with 100.0% of them unmarried at the time of birth, while the lowest percentage of unmarried women with births belong to 20 to 34 years age bracket with 0.0% of them unmarried.
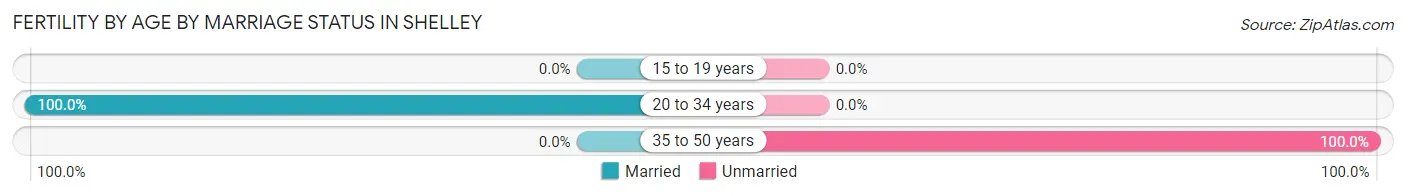
| Age Bracket | Married | Unmarried |
| 15 to 19 years | 0 (0.0%) | 0 (0.0%) |
| 20 to 34 years | 79 (100.0%) | 0 (0.0%) |
| 35 to 50 years | 0 (0.0%) | 18 (100.0%) |
| Total | 79 (81.4%) | 18 (18.6%) |
Fertility by Education in Shelley
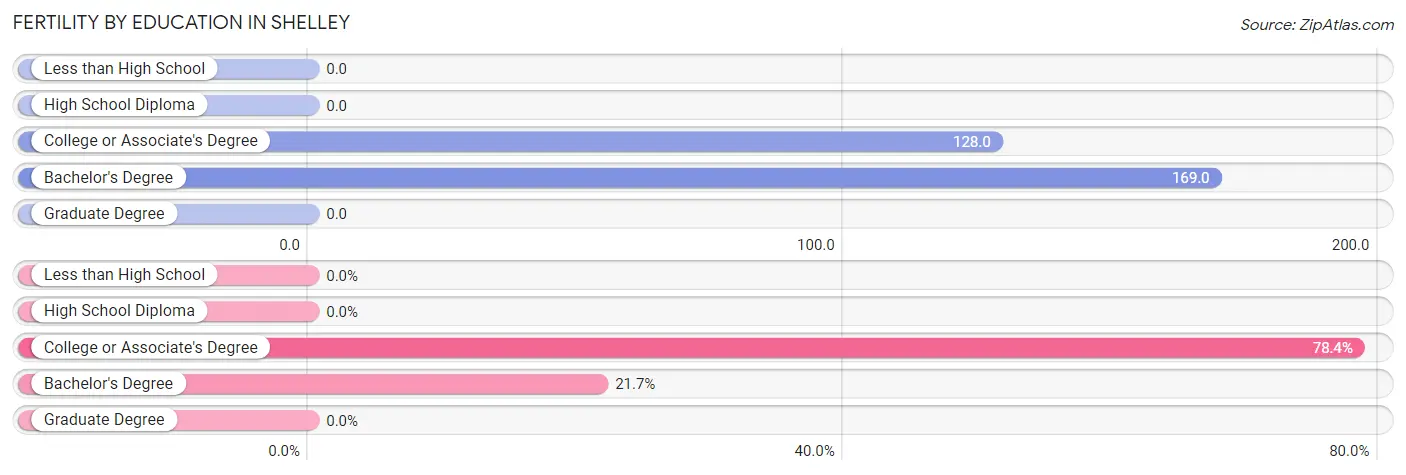
| Educational Attainment | Women with Births | Births / 1,000 Women |
| Less than High School | 0 (0.0%) | 0.0 |
| High School Diploma | 0 (0.0%) | 0.0 |
| College or Associate's Degree | 76 (78.3%) | 128.0 |
| Bachelor's Degree | 21 (21.6%) | 169.0 |
| Graduate Degree | 0 (0.0%) | 0.0 |
| Total | 97 (100.0%) | 85.0 |
Fertility by Education by Marriage Status in Shelley
18.6% of women with births in Shelley are unmarried. Women with the educational attainment of bachelor's degree are most likely to be married with 100.0% of them married at childbirth, while women with the educational attainment of college or associate's degree are least likely to be married with 23.7% of them unmarried at childbirth.
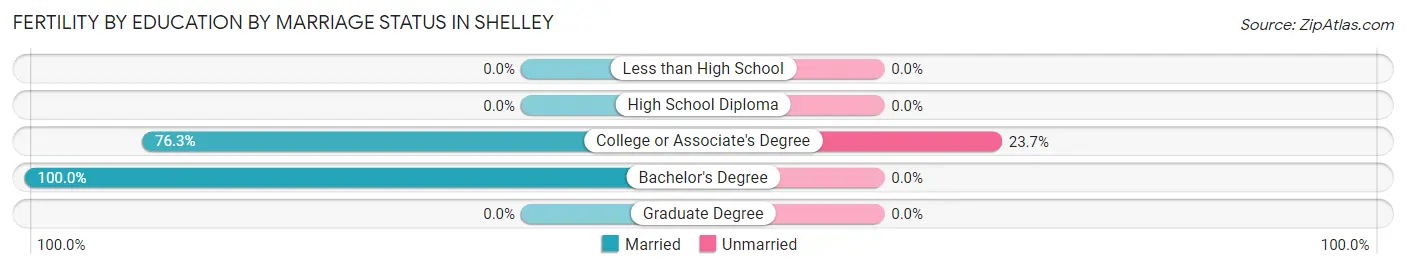
| Educational Attainment | Married | Unmarried |
| Less than High School | 0 (0.0%) | 0 (0.0%) |
| High School Diploma | 0 (0.0%) | 0 (0.0%) |
| College or Associate's Degree | 58 (76.3%) | 18 (23.7%) |
| Bachelor's Degree | 21 (100.0%) | 0 (0.0%) |
| Graduate Degree | 0 (0.0%) | 0 (0.0%) |
| Total | 79 (81.4%) | 18 (18.6%) |
Employment Characteristics in Shelley
Employment by Class of Employer in Shelley
Among the 2,342 employed individuals in Shelley, private company employees (1,893 | 80.8%), state government employees (171 | 7.3%), and local government employees (102 | 4.4%) make up the most common classes of employment.
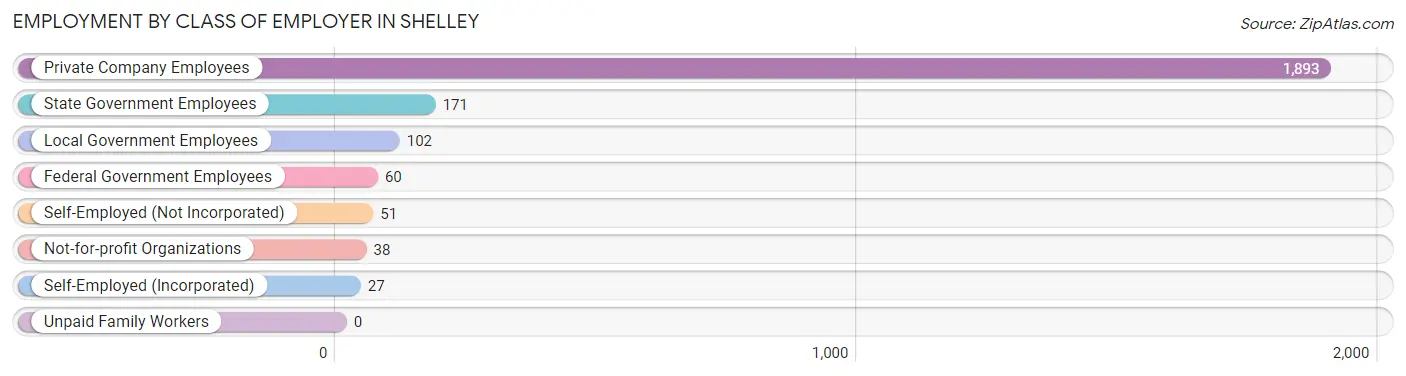
| Employer Class | # Employees | % Employees |
| Private Company Employees | 1,893 | 80.8% |
| Self-Employed (Incorporated) | 27 | 1.1% |
| Self-Employed (Not Incorporated) | 51 | 2.2% |
| Not-for-profit Organizations | 38 | 1.6% |
| Local Government Employees | 102 | 4.4% |
| State Government Employees | 171 | 7.3% |
| Federal Government Employees | 60 | 2.6% |
| Unpaid Family Workers | 0 | 0.0% |
| Total | 2,342 | 100.0% |
Employment Status by Age in Shelley
According to the labor force statistics for Shelley, out of the total population over 16 years of age (3,552), 75.3% or 2,675 individuals are in the labor force, with 9.4% or 251 of them unemployed. The age group with the highest labor force participation rate is 20 to 24 years, with 95.5% or 469 individuals in the labor force. Within the labor force, the 16 to 19 years age range has the highest percentage of unemployed individuals, with 42.5% or 57 of them being unemployed.
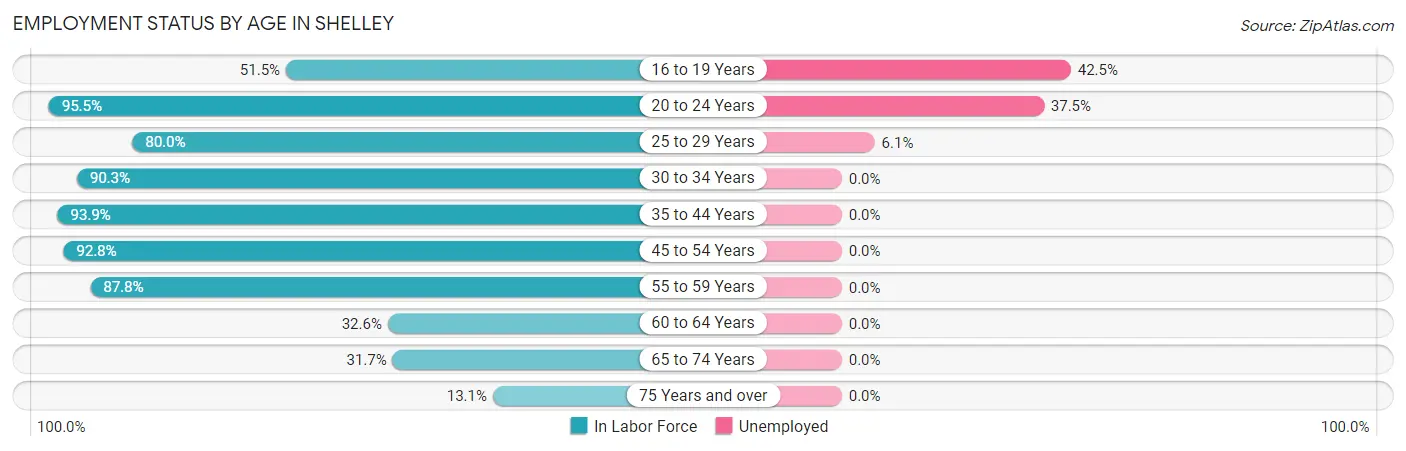
| Age Bracket | In Labor Force | Unemployed |
| 16 to 19 Years | 134 (51.5%) | 57 (42.5%) |
| 20 to 24 Years | 469 (95.5%) | 176 (37.5%) |
| 25 to 29 Years | 296 (80.0%) | 18 (6.1%) |
| 30 to 34 Years | 270 (90.3%) | 0 (0.0%) |
| 35 to 44 Years | 642 (93.9%) | 0 (0.0%) |
| 45 to 54 Years | 514 (92.8%) | 0 (0.0%) |
| 55 to 59 Years | 159 (87.8%) | 0 (0.0%) |
| 60 to 64 Years | 78 (32.6%) | 0 (0.0%) |
| 65 to 74 Years | 85 (31.7%) | 0 (0.0%) |
| 75 Years and over | 27 (13.1%) | 0 (0.0%) |
| Total | 2,675 (75.3%) | 251 (9.4%) |
Employment Status by Educational Attainment in Shelley
According to labor force statistics for Shelley, 84.2% of individuals (1,959) out of the total population between 25 and 64 years of age (2,327) are in the labor force, with 0.9% or 18 of them being unemployed. The group with the highest labor force participation rate are those with the educational attainment of less than high school, with 88.8% or 239 individuals in the labor force. Within the labor force, individuals with college / associate degree education have the highest percentage of unemployment, with 2.3% or 18 of them being unemployed.
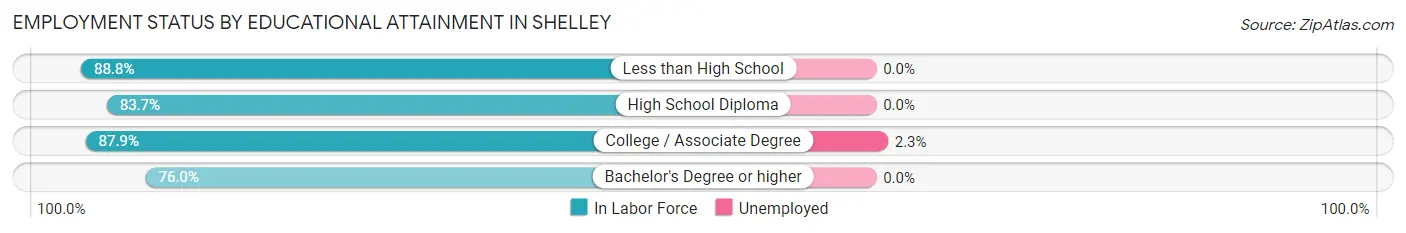
| Educational Attainment | In Labor Force | Unemployed |
| Less than High School | 239 (88.8%) | 0 (0.0%) |
| High School Diploma | 549 (83.7%) | 0 (0.0%) |
| College / Associate Degree | 781 (87.9%) | 20 (2.3%) |
| Bachelor's Degree or higher | 390 (76.0%) | 0 (0.0%) |
| Total | 1,959 (84.2%) | 21 (0.9%) |
Employment Occupations by Sex in Shelley
Management, Business, Science and Arts Occupations
The most common Management, Business, Science and Arts occupations in Shelley are Management (239 | 9.9%), Health Diagnosing & Treating (190 | 7.8%), Community & Social Service (132 | 5.4%), Education Instruction & Library (116 | 4.8%), and Computers, Engineering & Science (66 | 2.7%).
Management, Business, Science and Arts Occupations by Sex
Within the Management, Business, Science and Arts occupations in Shelley, the most male-oriented occupations are Life, Physical & Social Science (100.0%), Education, Arts & Media (100.0%), and Business & Financial (61.9%), while the most female-oriented occupations are Education Instruction & Library (100.0%), Community & Social Service (87.9%), and Management (82.4%).
| Occupation | Male | Female |
| Management | 42 (17.6%) | 197 (82.4%) |
| Business & Financial | 39 (61.9%) | 24 (38.1%) |
| Computers, Engineering & Science | 39 (59.1%) | 27 (40.9%) |
| Computers & Mathematics | 24 (47.1%) | 27 (52.9%) |
| Architecture & Engineering | 0 (0.0%) | 0 (0.0%) |
| Life, Physical & Social Science | 15 (100.0%) | 0 (0.0%) |
| Community & Social Service | 16 (12.1%) | 116 (87.9%) |
| Education, Arts & Media | 16 (100.0%) | 0 (0.0%) |
| Legal Services & Support | 0 (0.0%) | 0 (0.0%) |
| Education Instruction & Library | 0 (0.0%) | 116 (100.0%) |
| Arts, Media & Entertainment | 0 (0.0%) | 0 (0.0%) |
| Health Diagnosing & Treating | 75 (39.5%) | 115 (60.5%) |
| Health Technologists | 25 (58.1%) | 18 (41.9%) |
| Total (Category) | 211 (30.6%) | 479 (69.4%) |
| Total (Overall) | 1,215 (50.1%) | 1,208 (49.9%) |
Services Occupations
The most common Services occupations in Shelley are Food Preparation & Serving (174 | 7.2%), Healthcare Support (75 | 3.1%), Cleaning & Maintenance (57 | 2.4%), Security & Protection (52 | 2.1%), and Firefighting & Prevention (52 | 2.1%).
Services Occupations by Sex
Within the Services occupations in Shelley, the most male-oriented occupations are Security & Protection (100.0%), Firefighting & Prevention (100.0%), and Cleaning & Maintenance (43.9%), while the most female-oriented occupations are Healthcare Support (100.0%), Food Preparation & Serving (100.0%), and Cleaning & Maintenance (56.1%).
| Occupation | Male | Female |
| Healthcare Support | 0 (0.0%) | 75 (100.0%) |
| Security & Protection | 52 (100.0%) | 0 (0.0%) |
| Firefighting & Prevention | 52 (100.0%) | 0 (0.0%) |
| Law Enforcement | 0 (0.0%) | 0 (0.0%) |
| Food Preparation & Serving | 0 (0.0%) | 174 (100.0%) |
| Cleaning & Maintenance | 25 (43.9%) | 32 (56.1%) |
| Personal Care & Service | 0 (0.0%) | 0 (0.0%) |
| Total (Category) | 77 (21.5%) | 281 (78.5%) |
| Total (Overall) | 1,215 (50.1%) | 1,208 (49.9%) |
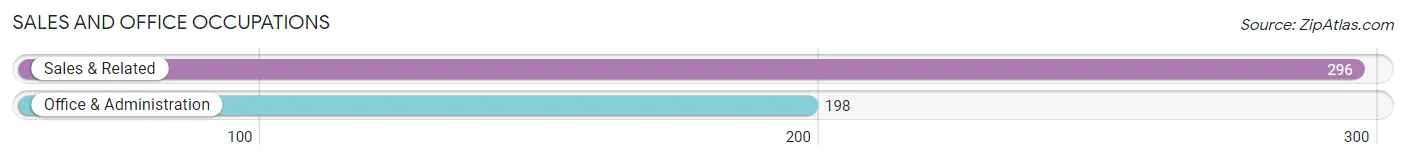
Sales and Office Occupations
The most common Sales and Office occupations in Shelley are Sales & Related (296 | 12.2%), and Office & Administration (198 | 8.2%).
Sales and Office Occupations by Sex
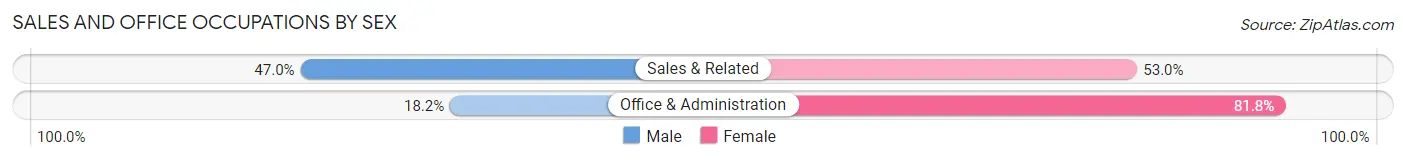
| Occupation | Male | Female |
| Sales & Related | 139 (47.0%) | 157 (53.0%) |
| Office & Administration | 36 (18.2%) | 162 (81.8%) |
| Total (Category) | 175 (35.4%) | 319 (64.6%) |
| Total (Overall) | 1,215 (50.1%) | 1,208 (49.9%) |
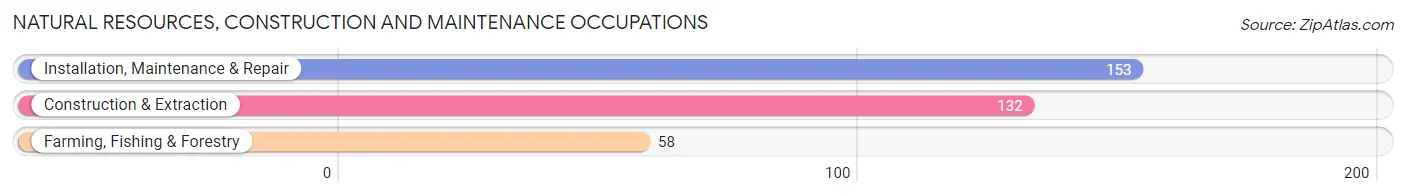
Natural Resources, Construction and Maintenance Occupations
The most common Natural Resources, Construction and Maintenance occupations in Shelley are Installation, Maintenance & Repair (153 | 6.3%), Construction & Extraction (132 | 5.4%), and Farming, Fishing & Forestry (58 | 2.4%).
Natural Resources, Construction and Maintenance Occupations by Sex
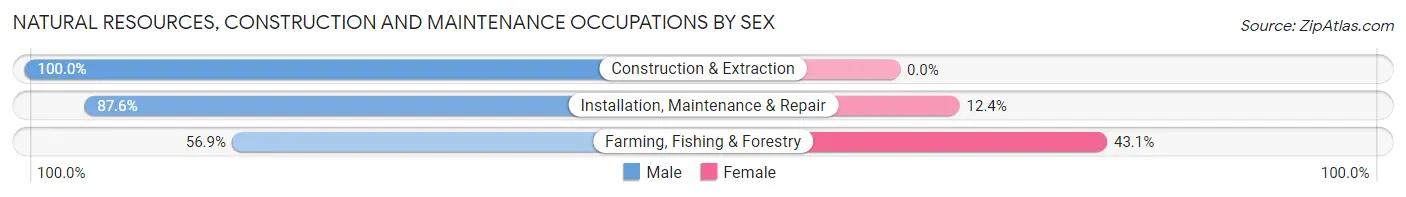
| Occupation | Male | Female |
| Farming, Fishing & Forestry | 33 (56.9%) | 25 (43.1%) |
| Construction & Extraction | 132 (100.0%) | 0 (0.0%) |
| Installation, Maintenance & Repair | 134 (87.6%) | 19 (12.4%) |
| Total (Category) | 299 (87.2%) | 44 (12.8%) |
| Total (Overall) | 1,215 (50.1%) | 1,208 (49.9%) |
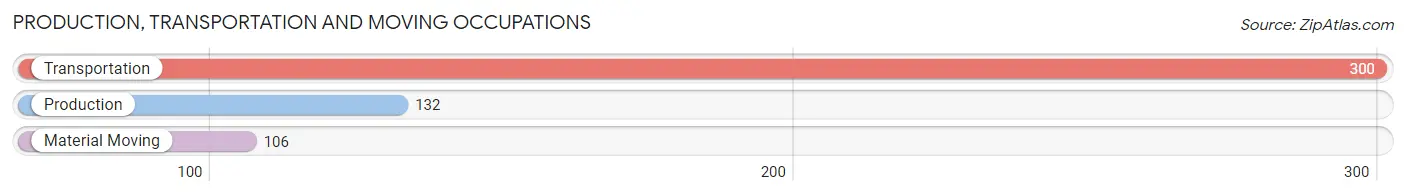
Production, Transportation and Moving Occupations
The most common Production, Transportation and Moving occupations in Shelley are Transportation (300 | 12.4%), Production (132 | 5.4%), and Material Moving (106 | 4.4%).
Production, Transportation and Moving Occupations by Sex
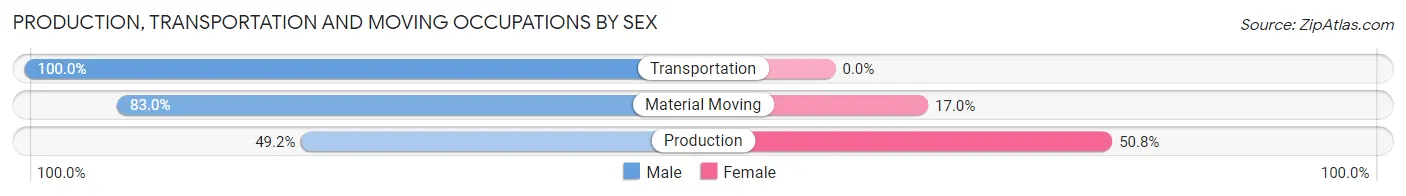
| Occupation | Male | Female |
| Production | 65 (49.2%) | 67 (50.8%) |
| Transportation | 300 (100.0%) | 0 (0.0%) |
| Material Moving | 88 (83.0%) | 18 (17.0%) |
| Total (Category) | 453 (84.2%) | 85 (15.8%) |
| Total (Overall) | 1,215 (50.1%) | 1,208 (49.9%) |
Employment Industries by Sex in Shelley
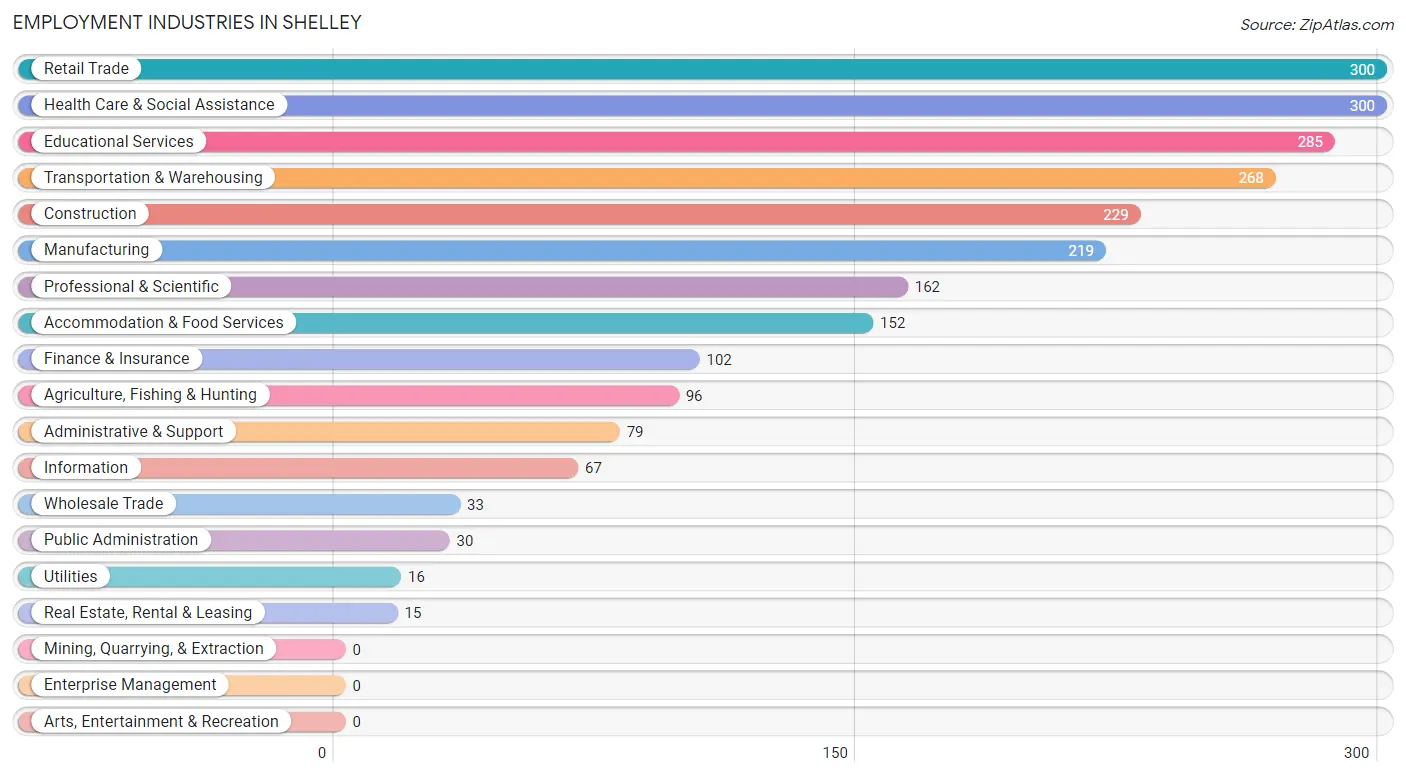
Employment Industries in Shelley
The major employment industries in Shelley include Retail Trade (300 | 12.4%), Health Care & Social Assistance (300 | 12.4%), Educational Services (285 | 11.8%), Transportation & Warehousing (268 | 11.1%), and Construction (229 | 9.5%).
Employment Industries by Sex in Shelley
The Shelley industries that see more men than women are Wholesale Trade (100.0%), Utilities (100.0%), and Information (100.0%), whereas the industries that tend to have a higher number of women are Real Estate, Rental & Leasing (100.0%), Educational Services (100.0%), and Public Administration (100.0%).
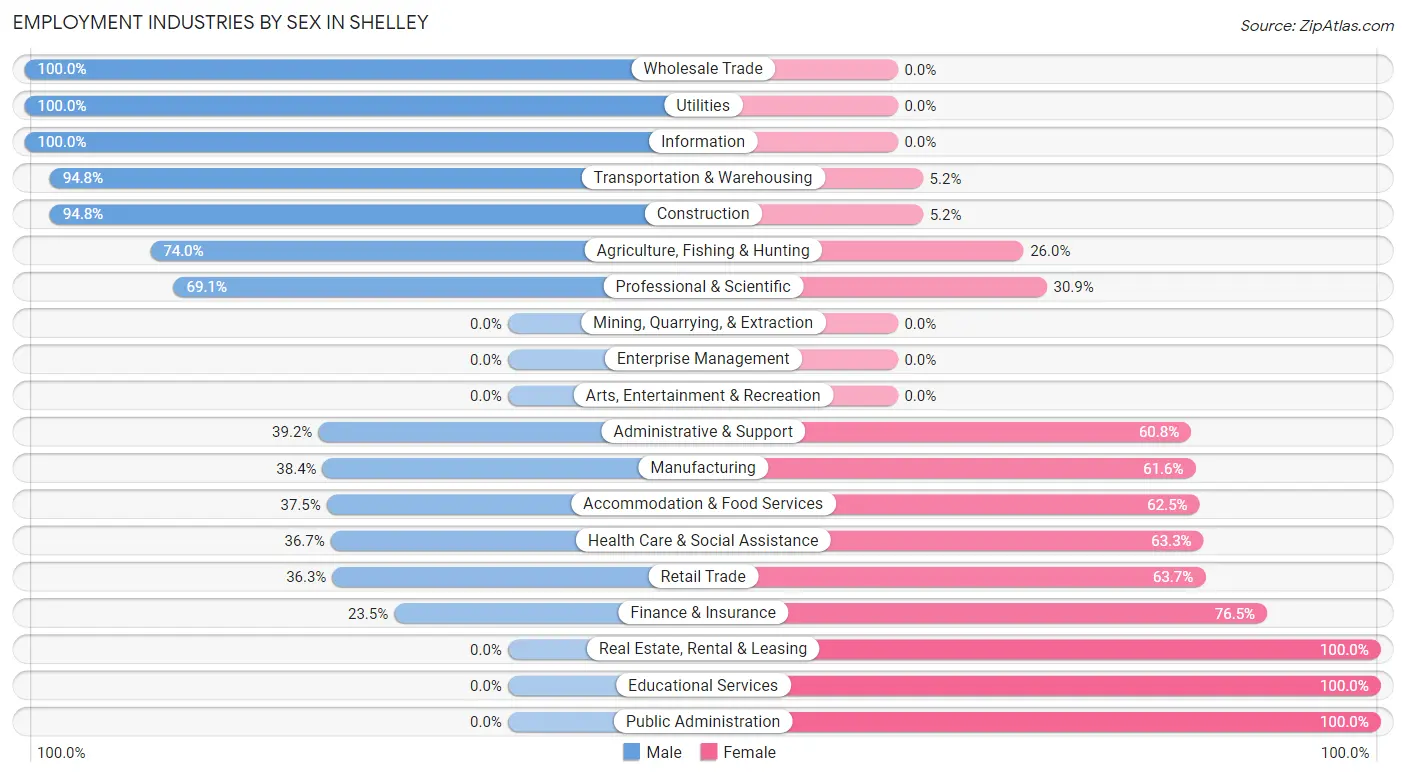
| Industry | Male | Female |
| Agriculture, Fishing & Hunting | 71 (74.0%) | 25 (26.0%) |
| Mining, Quarrying, & Extraction | 0 (0.0%) | 0 (0.0%) |
| Construction | 217 (94.8%) | 12 (5.2%) |
| Manufacturing | 84 (38.4%) | 135 (61.6%) |
| Wholesale Trade | 33 (100.0%) | 0 (0.0%) |
| Retail Trade | 109 (36.3%) | 191 (63.7%) |
| Transportation & Warehousing | 254 (94.8%) | 14 (5.2%) |
| Utilities | 16 (100.0%) | 0 (0.0%) |
| Information | 67 (100.0%) | 0 (0.0%) |
| Finance & Insurance | 24 (23.5%) | 78 (76.5%) |
| Real Estate, Rental & Leasing | 0 (0.0%) | 15 (100.0%) |
| Professional & Scientific | 112 (69.1%) | 50 (30.9%) |
| Enterprise Management | 0 (0.0%) | 0 (0.0%) |
| Administrative & Support | 31 (39.2%) | 48 (60.8%) |
| Educational Services | 0 (0.0%) | 285 (100.0%) |
| Health Care & Social Assistance | 110 (36.7%) | 190 (63.3%) |
| Arts, Entertainment & Recreation | 0 (0.0%) | 0 (0.0%) |
| Accommodation & Food Services | 57 (37.5%) | 95 (62.5%) |
| Public Administration | 0 (0.0%) | 30 (100.0%) |
| Total | 1,215 (50.1%) | 1,208 (49.9%) |
Education in Shelley
School Enrollment in Shelley
The most common levels of schooling among the 1,158 students in Shelley are elementary school (355 | 30.7%), middle school (235 | 20.3%), and college / undergraduate (219 | 18.9%).
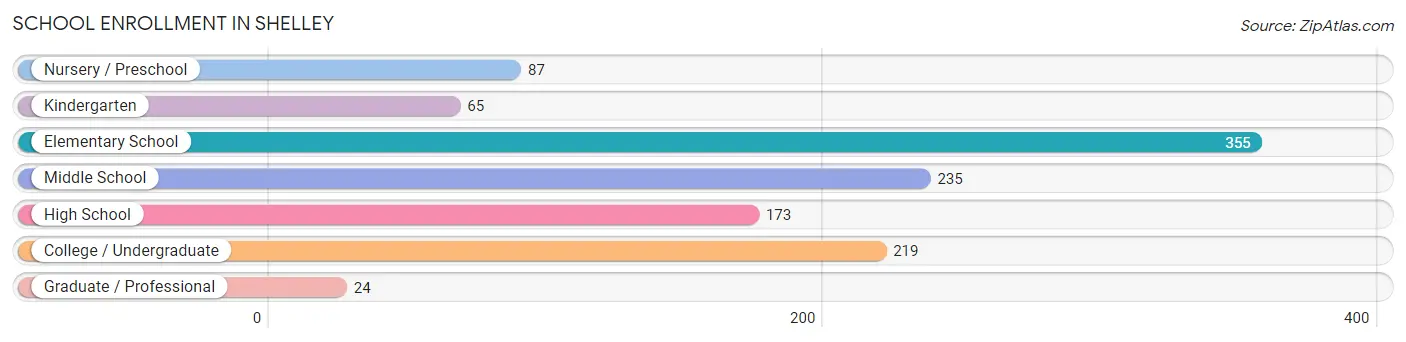
| School Level | # Students | % Students |
| Nursery / Preschool | 87 | 7.5% |
| Kindergarten | 65 | 5.6% |
| Elementary School | 355 | 30.7% |
| Middle School | 235 | 20.3% |
| High School | 173 | 14.9% |
| College / Undergraduate | 219 | 18.9% |
| Graduate / Professional | 24 | 2.1% |
| Total | 1,158 | 100.0% |
School Enrollment by Age by Funding Source in Shelley
Out of a total of 1,158 students who are enrolled in schools in Shelley, 87 (7.5%) attend a private institution, while the remaining 1,071 (92.5%) are enrolled in public schools. The age group of 3 to 4 year olds has the highest likelihood of being enrolled in private schools, with 59 (96.7% in the age bracket) enrolled. Conversely, the age group of 10 to 14 year olds has the lowest likelihood of being enrolled in a private school, with 308 (100.0% in the age bracket) attending a public institution.
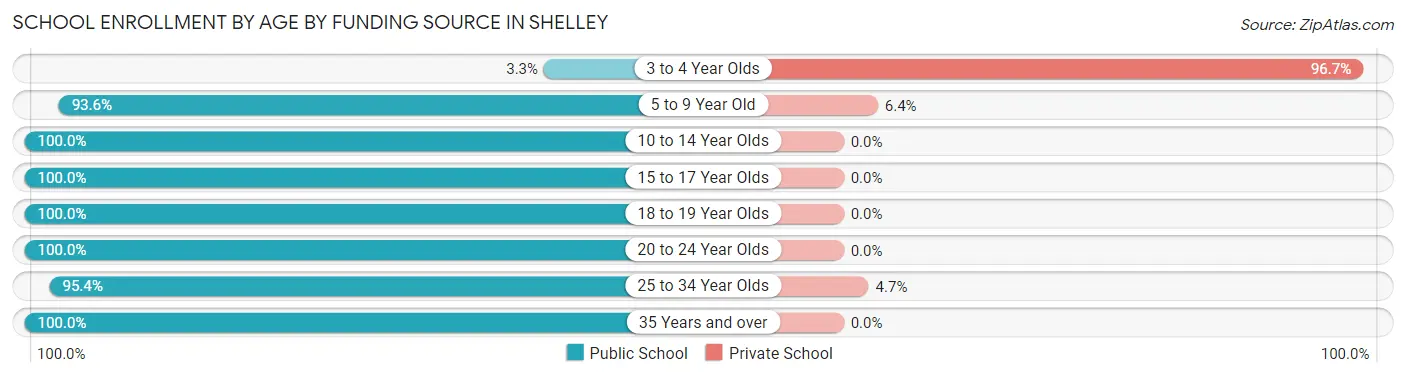
| Age Bracket | Public School | Private School |
| 3 to 4 Year Olds | 2 (3.3%) | 59 (96.7%) |
| 5 to 9 Year Old | 382 (93.6%) | 26 (6.4%) |
| 10 to 14 Year Olds | 308 (100.0%) | 0 (0.0%) |
| 15 to 17 Year Olds | 123 (100.0%) | 0 (0.0%) |
| 18 to 19 Year Olds | 69 (100.0%) | 0 (0.0%) |
| 20 to 24 Year Olds | 44 (100.0%) | 0 (0.0%) |
| 25 to 34 Year Olds | 41 (95.4%) | 2 (4.6%) |
| 35 Years and over | 102 (100.0%) | 0 (0.0%) |
| Total | 1,071 (92.5%) | 87 (7.5%) |
Educational Attainment by Field of Study in Shelley
Education (166 | 29.0%), science & technology (89 | 15.6%), bio, nature & agricultural (87 | 15.2%), engineering (59 | 10.3%), and social sciences (50 | 8.7%) are the most common fields of study among 572 individuals in Shelley who have obtained a bachelor's degree or higher.
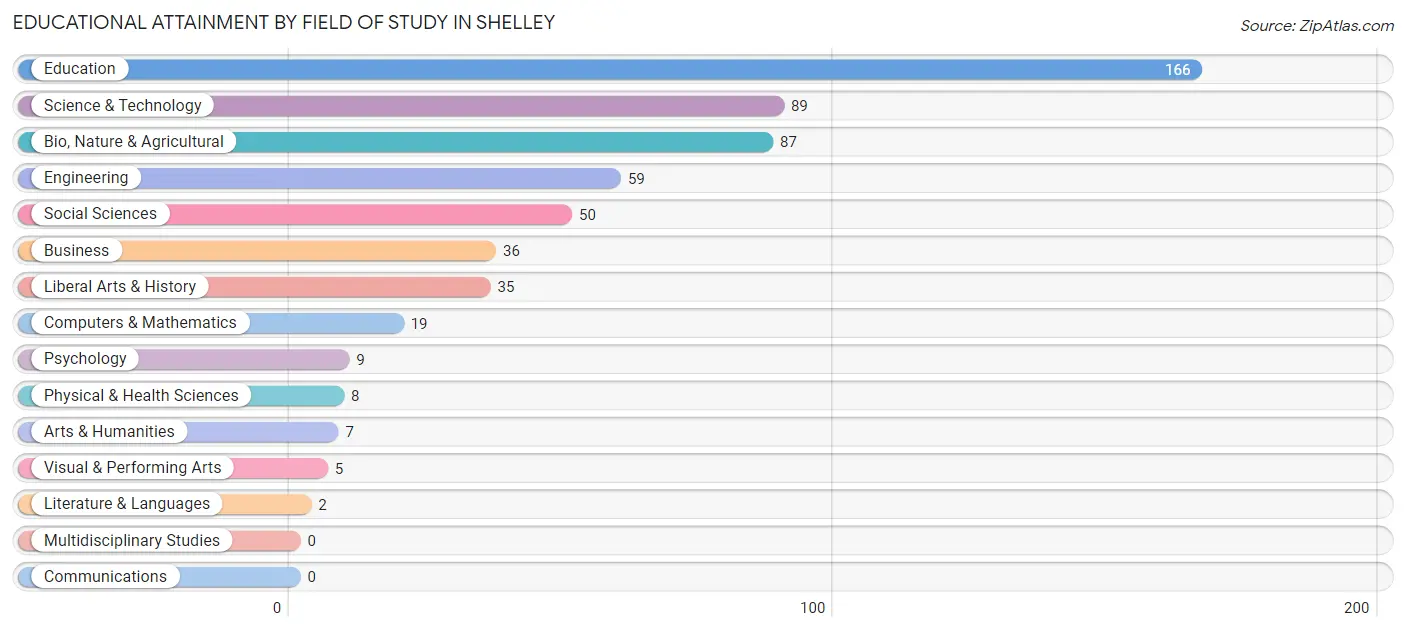
| Field of Study | # Graduates | % Graduates |
| Computers & Mathematics | 19 | 3.3% |
| Bio, Nature & Agricultural | 87 | 15.2% |
| Physical & Health Sciences | 8 | 1.4% |
| Psychology | 9 | 1.6% |
| Social Sciences | 50 | 8.7% |
| Engineering | 59 | 10.3% |
| Multidisciplinary Studies | 0 | 0.0% |
| Science & Technology | 89 | 15.6% |
| Business | 36 | 6.3% |
| Education | 166 | 29.0% |
| Literature & Languages | 2 | 0.4% |
| Liberal Arts & History | 35 | 6.1% |
| Visual & Performing Arts | 5 | 0.9% |
| Communications | 0 | 0.0% |
| Arts & Humanities | 7 | 1.2% |
| Total | 572 | 100.0% |
Transportation & Commute in Shelley
Vehicle Availability by Sex in Shelley
The most prevalent vehicle ownership categories in Shelley are males with 3 vehicles (418, accounting for 34.4%) and females with 3 vehicles (221, making up 37.1%).
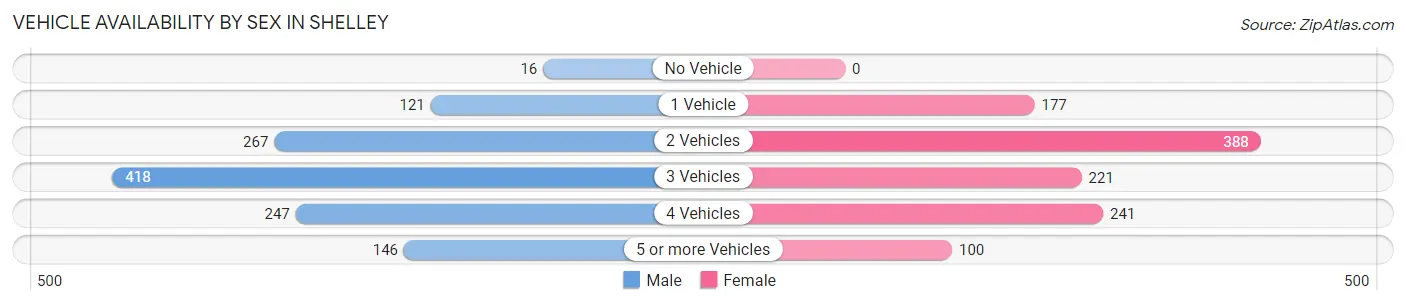
| Vehicles Available | Male | Female |
| No Vehicle | 16 (1.3%) | 0 (0.0%) |
| 1 Vehicle | 121 (10.0%) | 177 (15.7%) |
| 2 Vehicles | 267 (22.0%) | 388 (34.4%) |
| 3 Vehicles | 418 (34.4%) | 221 (19.6%) |
| 4 Vehicles | 247 (20.3%) | 241 (21.4%) |
| 5 or more Vehicles | 146 (12.0%) | 100 (8.9%) |
| Total | 1,215 (100.0%) | 1,127 (100.0%) |
Commute Time in Shelley
The most frequently occuring commute durations in Shelley are 20 to 24 minutes (615 commuters, 29.8%), 25 to 29 minutes (335 commuters, 16.3%), and 5 to 9 minutes (270 commuters, 13.1%).
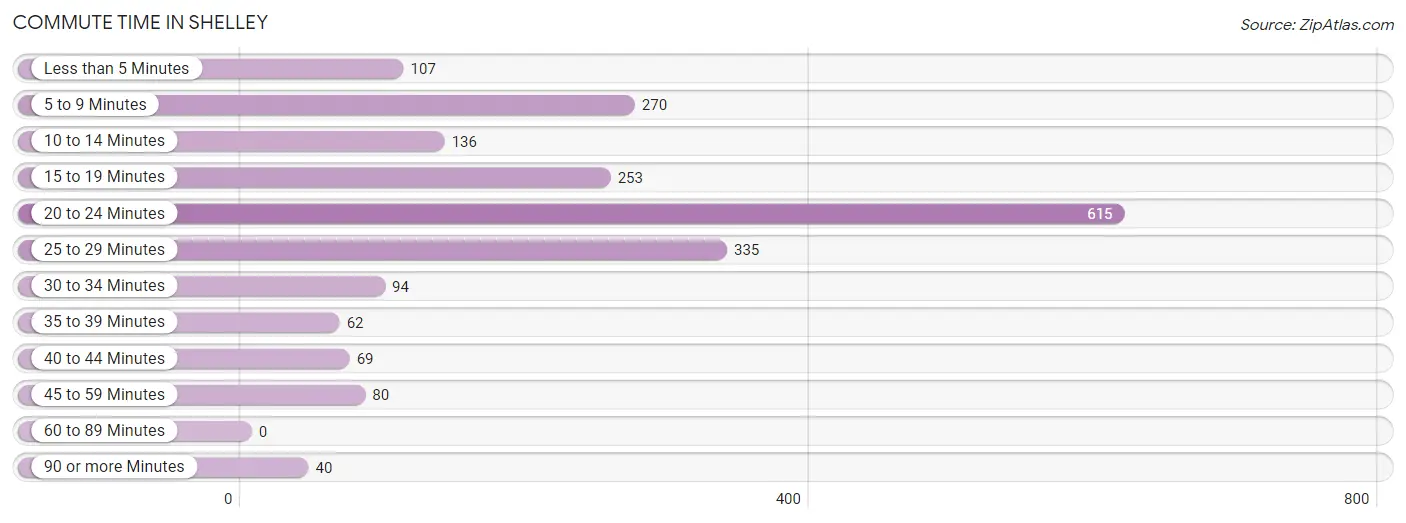
| Commute Time | # Commuters | % Commuters |
| Less than 5 Minutes | 107 | 5.2% |
| 5 to 9 Minutes | 270 | 13.1% |
| 10 to 14 Minutes | 136 | 6.6% |
| 15 to 19 Minutes | 253 | 12.3% |
| 20 to 24 Minutes | 615 | 29.8% |
| 25 to 29 Minutes | 335 | 16.3% |
| 30 to 34 Minutes | 94 | 4.6% |
| 35 to 39 Minutes | 62 | 3.0% |
| 40 to 44 Minutes | 69 | 3.4% |
| 45 to 59 Minutes | 80 | 3.9% |
| 60 to 89 Minutes | 0 | 0.0% |
| 90 or more Minutes | 40 | 1.9% |
Commute Time by Sex in Shelley
The most common commute times in Shelley are 20 to 24 minutes (213 commuters, 20.3%) for males and 20 to 24 minutes (402 commuters, 39.8%) for females.
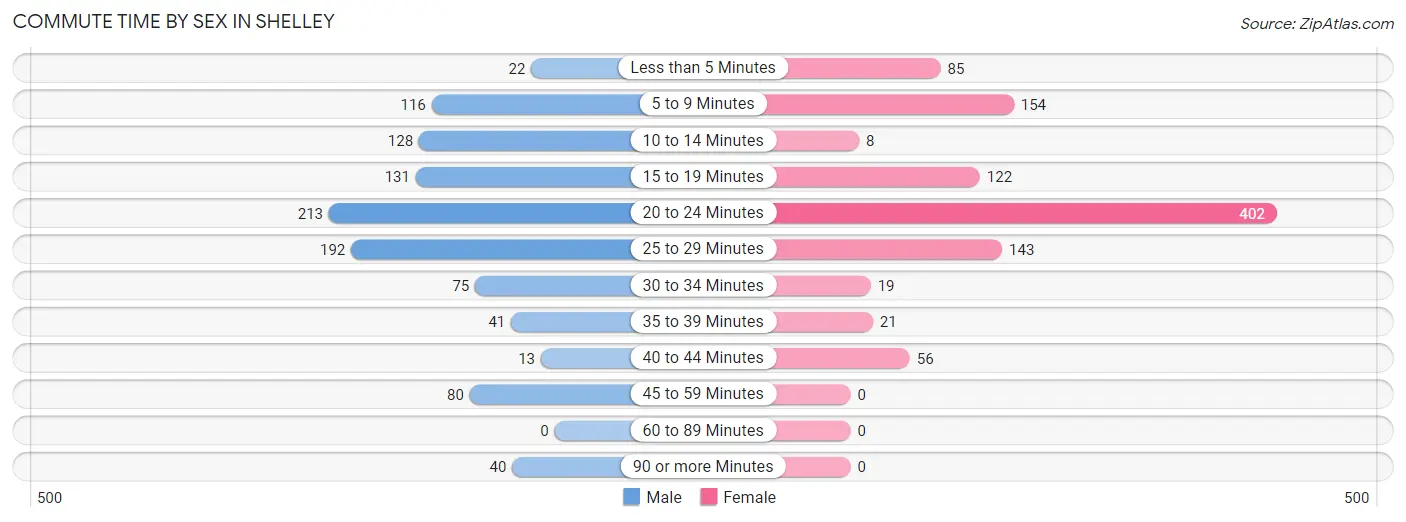
| Commute Time | Male | Female |
| Less than 5 Minutes | 22 (2.1%) | 85 (8.4%) |
| 5 to 9 Minutes | 116 (11.0%) | 154 (15.2%) |
| 10 to 14 Minutes | 128 (12.2%) | 8 (0.8%) |
| 15 to 19 Minutes | 131 (12.5%) | 122 (12.1%) |
| 20 to 24 Minutes | 213 (20.3%) | 402 (39.8%) |
| 25 to 29 Minutes | 192 (18.3%) | 143 (14.2%) |
| 30 to 34 Minutes | 75 (7.1%) | 19 (1.9%) |
| 35 to 39 Minutes | 41 (3.9%) | 21 (2.1%) |
| 40 to 44 Minutes | 13 (1.2%) | 56 (5.5%) |
| 45 to 59 Minutes | 80 (7.6%) | 0 (0.0%) |
| 60 to 89 Minutes | 0 (0.0%) | 0 (0.0%) |
| 90 or more Minutes | 40 (3.8%) | 0 (0.0%) |
Time of Departure to Work by Sex in Shelley
The most frequent times of departure to work in Shelley are 7:30 AM to 7:59 AM (281, 26.7%) for males and 7:30 AM to 7:59 AM (324, 32.1%) for females.
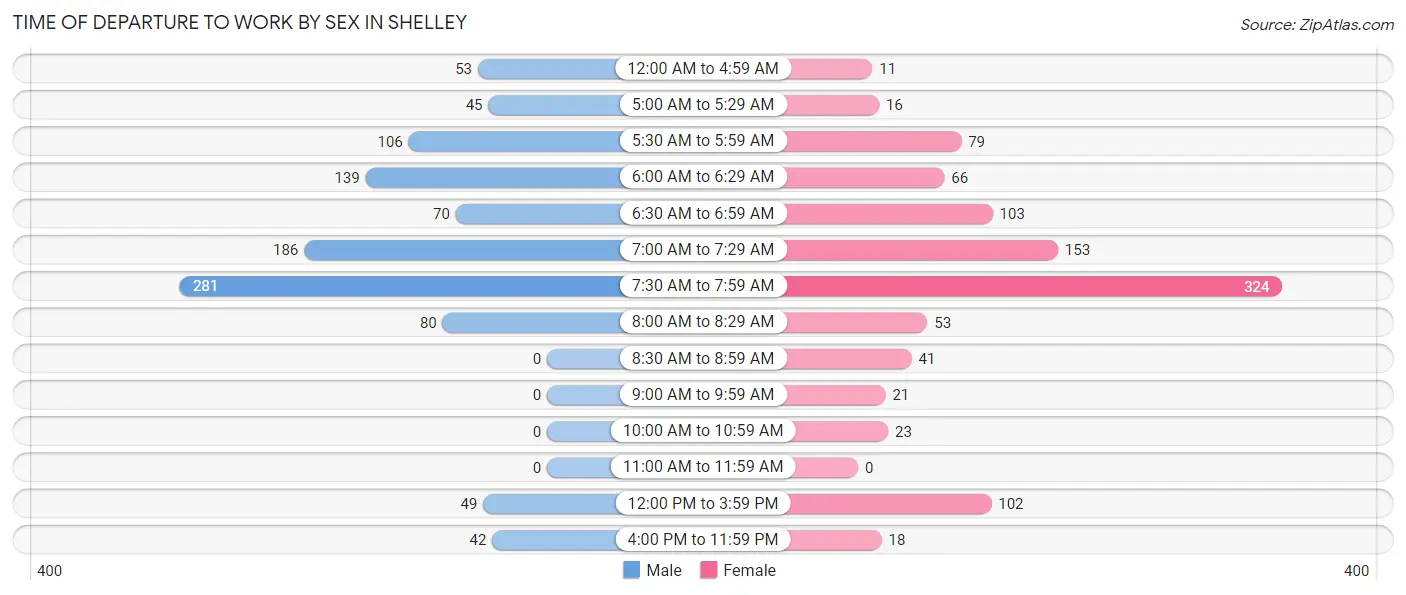
| Time of Departure | Male | Female |
| 12:00 AM to 4:59 AM | 53 (5.0%) | 11 (1.1%) |
| 5:00 AM to 5:29 AM | 45 (4.3%) | 16 (1.6%) |
| 5:30 AM to 5:59 AM | 106 (10.1%) | 79 (7.8%) |
| 6:00 AM to 6:29 AM | 139 (13.2%) | 66 (6.5%) |
| 6:30 AM to 6:59 AM | 70 (6.7%) | 103 (10.2%) |
| 7:00 AM to 7:29 AM | 186 (17.7%) | 153 (15.1%) |
| 7:30 AM to 7:59 AM | 281 (26.7%) | 324 (32.1%) |
| 8:00 AM to 8:29 AM | 80 (7.6%) | 53 (5.2%) |
| 8:30 AM to 8:59 AM | 0 (0.0%) | 41 (4.1%) |
| 9:00 AM to 9:59 AM | 0 (0.0%) | 21 (2.1%) |
| 10:00 AM to 10:59 AM | 0 (0.0%) | 23 (2.3%) |
| 11:00 AM to 11:59 AM | 0 (0.0%) | 0 (0.0%) |
| 12:00 PM to 3:59 PM | 49 (4.7%) | 102 (10.1%) |
| 4:00 PM to 11:59 PM | 42 (4.0%) | 18 (1.8%) |
| Total | 1,051 (100.0%) | 1,010 (100.0%) |
Housing Occupancy in Shelley
Occupancy by Ownership in Shelley
Of the total 1,590 dwellings in Shelley, owner-occupied units account for 1,196 (75.2%), while renter-occupied units make up 394 (24.8%).
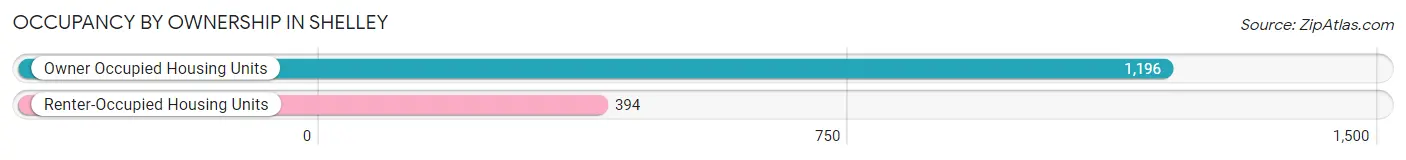
| Occupancy | # Housing Units | % Housing Units |
| Owner Occupied Housing Units | 1,196 | 75.2% |
| Renter-Occupied Housing Units | 394 | 24.8% |
| Total Occupied Housing Units | 1,590 | 100.0% |
Occupancy by Household Size in Shelley
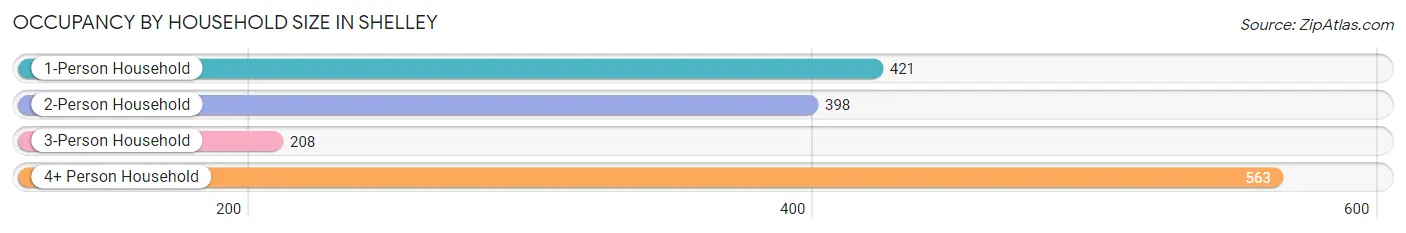
| Household Size | # Housing Units | % Housing Units |
| 1-Person Household | 421 | 26.5% |
| 2-Person Household | 398 | 25.0% |
| 3-Person Household | 208 | 13.1% |
| 4+ Person Household | 563 | 35.4% |
| Total Housing Units | 1,590 | 100.0% |
Occupancy by Ownership by Household Size in Shelley
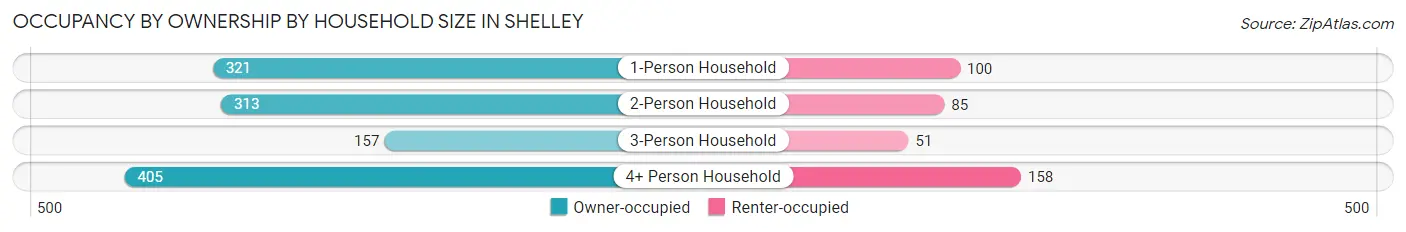
| Household Size | Owner-occupied | Renter-occupied |
| 1-Person Household | 321 (76.2%) | 100 (23.7%) |
| 2-Person Household | 313 (78.6%) | 85 (21.4%) |
| 3-Person Household | 157 (75.5%) | 51 (24.5%) |
| 4+ Person Household | 405 (71.9%) | 158 (28.1%) |
| Total Housing Units | 1,196 (75.2%) | 394 (24.8%) |
Occupancy by Educational Attainment in Shelley
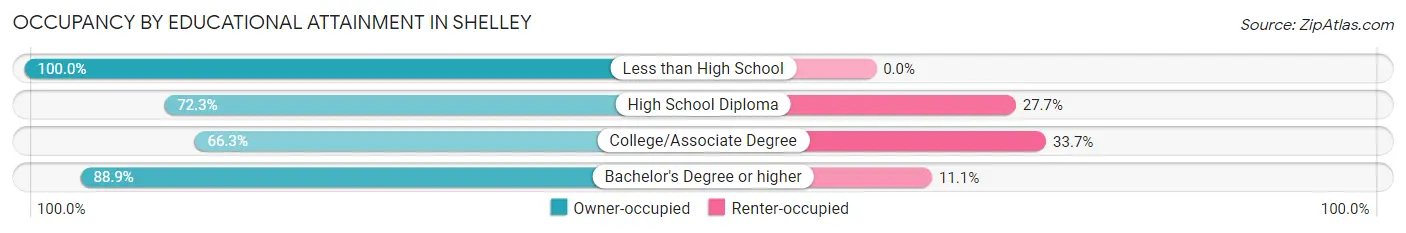
| Household Size | Owner-occupied | Renter-occupied |
| Less than High School | 91 (100.0%) | 0 (0.0%) |
| High School Diploma | 282 (72.3%) | 108 (27.7%) |
| College/Associate Degree | 478 (66.3%) | 243 (33.7%) |
| Bachelor's Degree or higher | 345 (88.9%) | 43 (11.1%) |
Occupancy by Age of Householder in Shelley
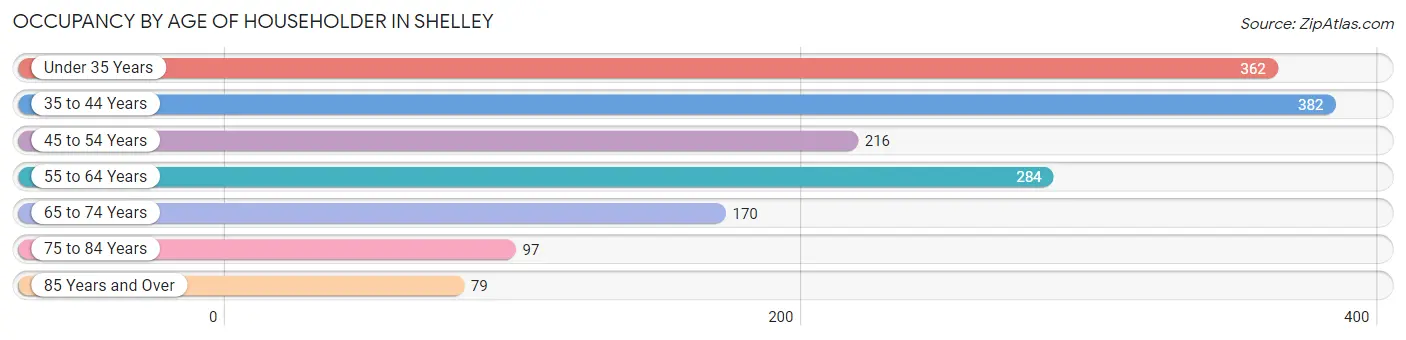
| Age Bracket | # Households | % Households |
| Under 35 Years | 362 | 22.8% |
| 35 to 44 Years | 382 | 24.0% |
| 45 to 54 Years | 216 | 13.6% |
| 55 to 64 Years | 284 | 17.9% |
| 65 to 74 Years | 170 | 10.7% |
| 75 to 84 Years | 97 | 6.1% |
| 85 Years and Over | 79 | 5.0% |
| Total | 1,590 | 100.0% |
Housing Finances in Shelley
Median Income by Occupancy in Shelley
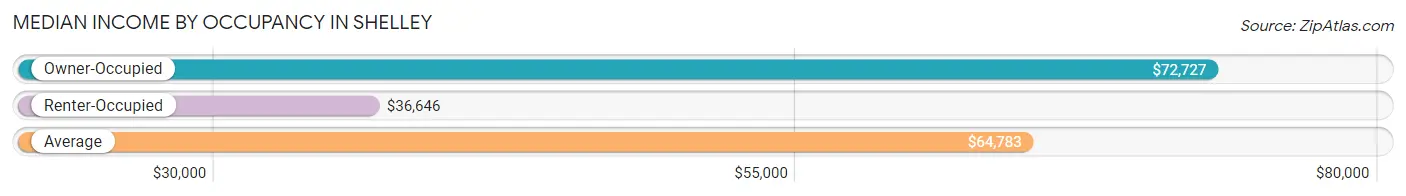
| Occupancy Type | # Households | Median Income |
| Owner-Occupied | 1,196 (75.2%) | $72,727 |
| Renter-Occupied | 394 (24.8%) | $36,646 |
| Average | 1,590 (100.0%) | $64,783 |
Occupancy by Householder Income Bracket in Shelley
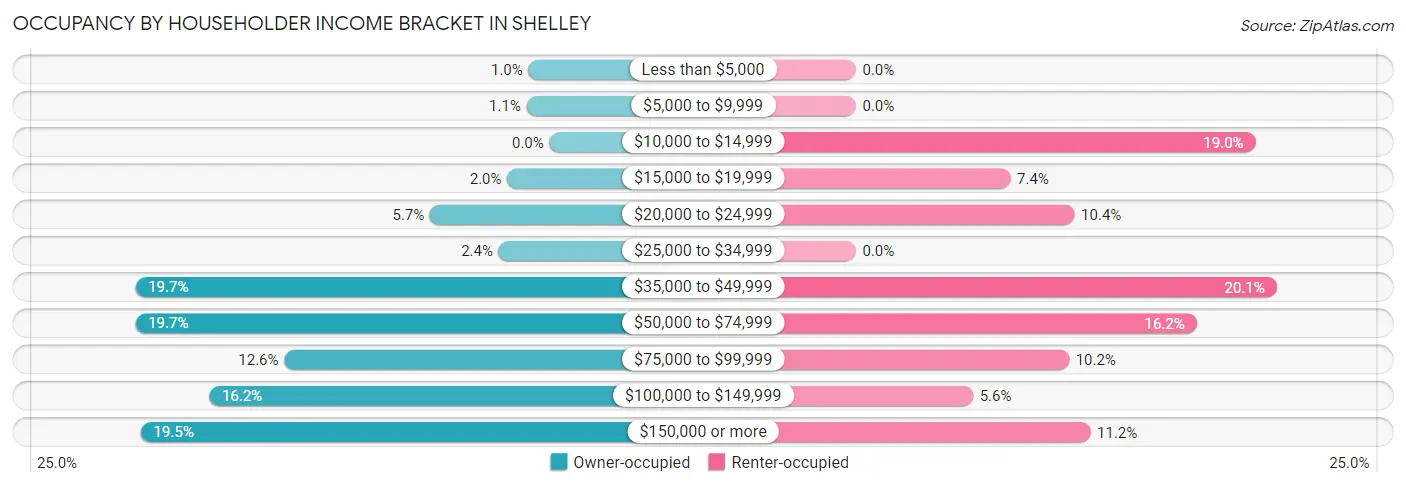
| Income Bracket | Owner-occupied | Renter-occupied |
| Less than $5,000 | 12 (1.0%) | 0 (0.0%) |
| $5,000 to $9,999 | 13 (1.1%) | 0 (0.0%) |
| $10,000 to $14,999 | 0 (0.0%) | 75 (19.0%) |
| $15,000 to $19,999 | 24 (2.0%) | 29 (7.4%) |
| $20,000 to $24,999 | 68 (5.7%) | 41 (10.4%) |
| $25,000 to $34,999 | 29 (2.4%) | 0 (0.0%) |
| $35,000 to $49,999 | 236 (19.7%) | 79 (20.1%) |
| $50,000 to $74,999 | 236 (19.7%) | 64 (16.2%) |
| $75,000 to $99,999 | 151 (12.6%) | 40 (10.2%) |
| $100,000 to $149,999 | 194 (16.2%) | 22 (5.6%) |
| $150,000 or more | 233 (19.5%) | 44 (11.2%) |
| Total | 1,196 (100.0%) | 394 (100.0%) |
Monthly Housing Cost Tiers in Shelley
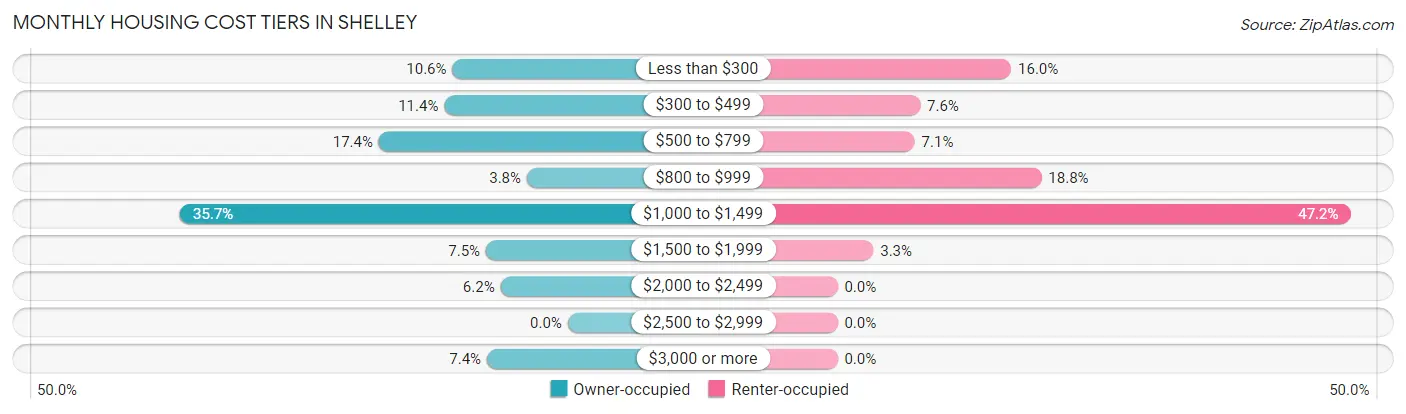
| Monthly Cost | Owner-occupied | Renter-occupied |
| Less than $300 | 127 (10.6%) | 63 (16.0%) |
| $300 to $499 | 136 (11.4%) | 30 (7.6%) |
| $500 to $799 | 208 (17.4%) | 28 (7.1%) |
| $800 to $999 | 45 (3.8%) | 74 (18.8%) |
| $1,000 to $1,499 | 427 (35.7%) | 186 (47.2%) |
| $1,500 to $1,999 | 90 (7.5%) | 13 (3.3%) |
| $2,000 to $2,499 | 74 (6.2%) | 0 (0.0%) |
| $2,500 to $2,999 | 0 (0.0%) | 0 (0.0%) |
| $3,000 or more | 89 (7.4%) | 0 (0.0%) |
| Total | 1,196 (100.0%) | 394 (100.0%) |
Physical Housing Characteristics in Shelley
Housing Structures in Shelley
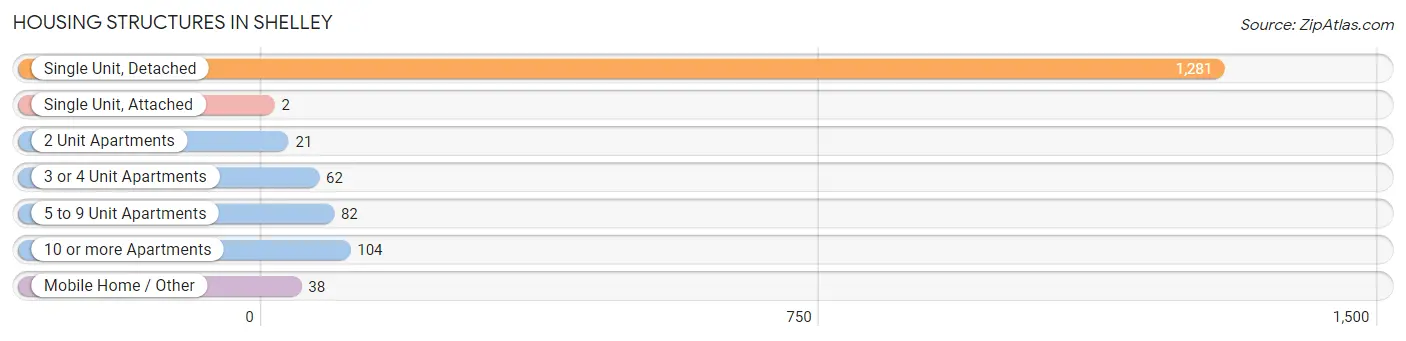
| Structure Type | # Housing Units | % Housing Units |
| Single Unit, Detached | 1,281 | 80.6% |
| Single Unit, Attached | 2 | 0.1% |
| 2 Unit Apartments | 21 | 1.3% |
| 3 or 4 Unit Apartments | 62 | 3.9% |
| 5 to 9 Unit Apartments | 82 | 5.2% |
| 10 or more Apartments | 104 | 6.5% |
| Mobile Home / Other | 38 | 2.4% |
| Total | 1,590 | 100.0% |
Housing Structures by Occupancy in Shelley
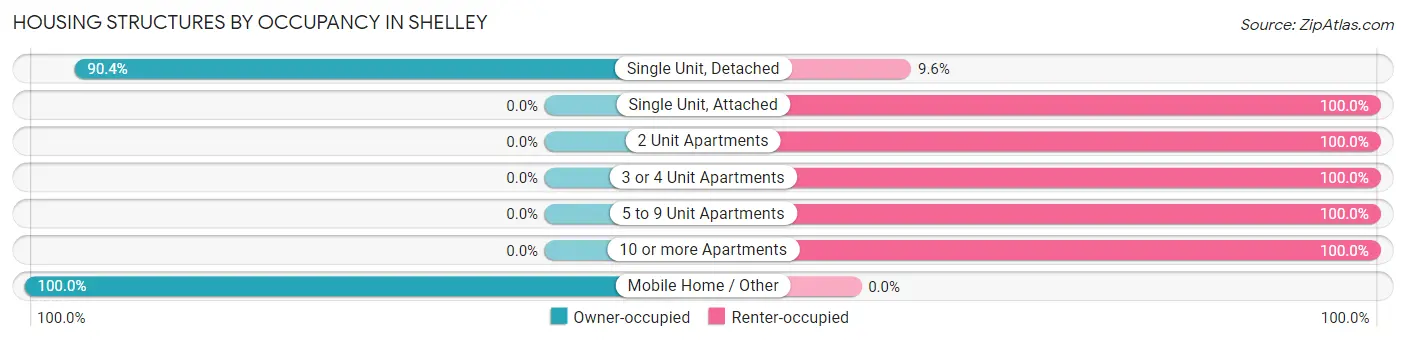
| Structure Type | Owner-occupied | Renter-occupied |
| Single Unit, Detached | 1,158 (90.4%) | 123 (9.6%) |
| Single Unit, Attached | 0 (0.0%) | 2 (100.0%) |
| 2 Unit Apartments | 0 (0.0%) | 21 (100.0%) |
| 3 or 4 Unit Apartments | 0 (0.0%) | 62 (100.0%) |
| 5 to 9 Unit Apartments | 0 (0.0%) | 82 (100.0%) |
| 10 or more Apartments | 0 (0.0%) | 104 (100.0%) |
| Mobile Home / Other | 38 (100.0%) | 0 (0.0%) |
| Total | 1,196 (75.2%) | 394 (24.8%) |
Housing Structures by Number of Rooms in Shelley
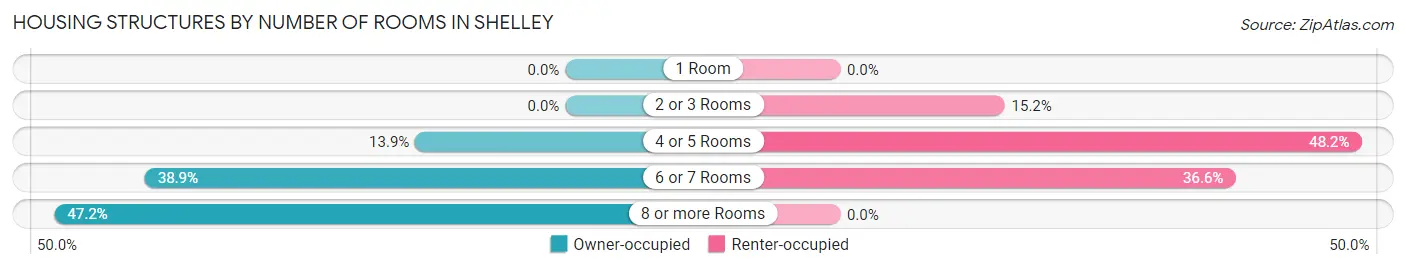
| Number of Rooms | Owner-occupied | Renter-occupied |
| 1 Room | 0 (0.0%) | 0 (0.0%) |
| 2 or 3 Rooms | 0 (0.0%) | 60 (15.2%) |
| 4 or 5 Rooms | 166 (13.9%) | 190 (48.2%) |
| 6 or 7 Rooms | 465 (38.9%) | 144 (36.5%) |
| 8 or more Rooms | 565 (47.2%) | 0 (0.0%) |
| Total | 1,196 (100.0%) | 394 (100.0%) |
Housing Structure by Heating Type in Shelley
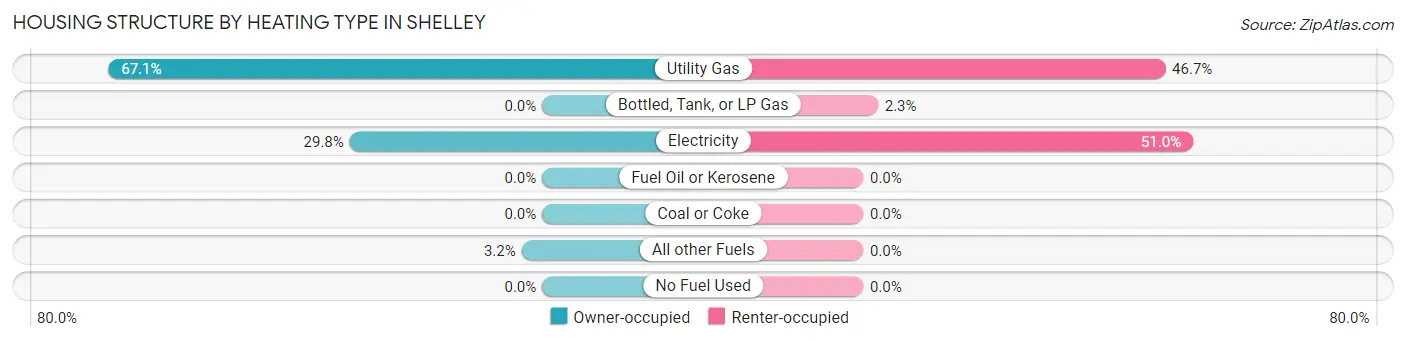
| Heating Type | Owner-occupied | Renter-occupied |
| Utility Gas | 802 (67.1%) | 184 (46.7%) |
| Bottled, Tank, or LP Gas | 0 (0.0%) | 9 (2.3%) |
| Electricity | 356 (29.8%) | 201 (51.0%) |
| Fuel Oil or Kerosene | 0 (0.0%) | 0 (0.0%) |
| Coal or Coke | 0 (0.0%) | 0 (0.0%) |
| All other Fuels | 38 (3.2%) | 0 (0.0%) |
| No Fuel Used | 0 (0.0%) | 0 (0.0%) |
| Total | 1,196 (100.0%) | 394 (100.0%) |
Household Vehicle Usage in Shelley
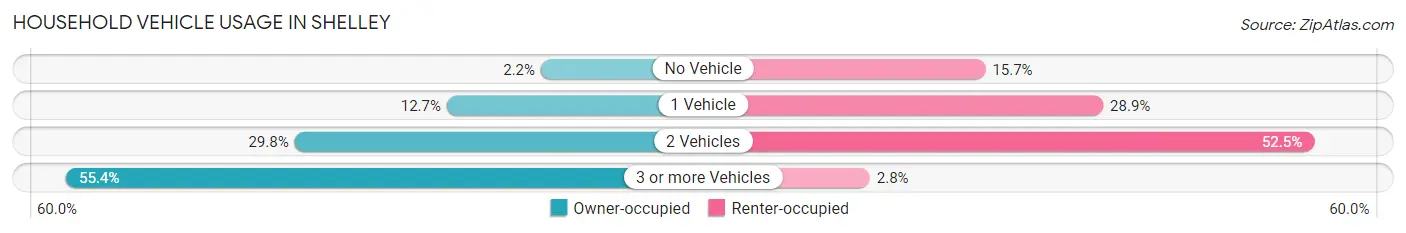
| Vehicles per Household | Owner-occupied | Renter-occupied |
| No Vehicle | 26 (2.2%) | 62 (15.7%) |
| 1 Vehicle | 152 (12.7%) | 114 (28.9%) |
| 2 Vehicles | 356 (29.8%) | 207 (52.5%) |
| 3 or more Vehicles | 662 (55.3%) | 11 (2.8%) |
| Total | 1,196 (100.0%) | 394 (100.0%) |
Real Estate & Mortgages in Shelley
Real Estate and Mortgage Overview in Shelley
| Characteristic | Without Mortgage | With Mortgage |
| Housing Units | 382 | 814 |
| Median Property Value | $222,900 | $240,000 |
| Median Household Income | $44,211 | $187 |
| Monthly Housing Costs | $377 | $89 |
| Real Estate Taxes | $841 | $0 |
Property Value by Mortgage Status in Shelley
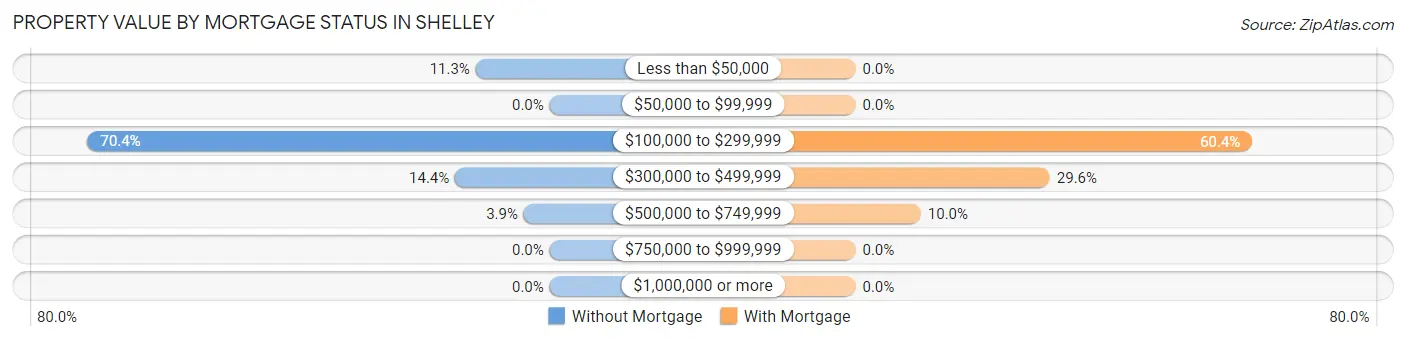
| Property Value | Without Mortgage | With Mortgage |
| Less than $50,000 | 43 (11.3%) | 0 (0.0%) |
| $50,000 to $99,999 | 0 (0.0%) | 0 (0.0%) |
| $100,000 to $299,999 | 269 (70.4%) | 492 (60.4%) |
| $300,000 to $499,999 | 55 (14.4%) | 241 (29.6%) |
| $500,000 to $749,999 | 15 (3.9%) | 81 (10.0%) |
| $750,000 to $999,999 | 0 (0.0%) | 0 (0.0%) |
| $1,000,000 or more | 0 (0.0%) | 0 (0.0%) |
| Total | 382 (100.0%) | 814 (100.0%) |
Household Income by Mortgage Status in Shelley
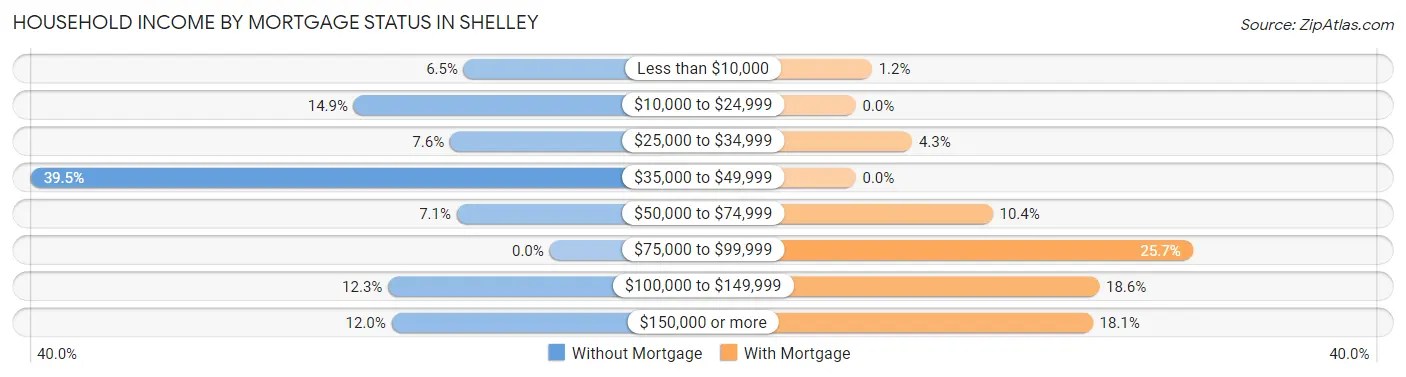
| Household Income | Without Mortgage | With Mortgage |
| Less than $10,000 | 25 (6.5%) | 10 (1.2%) |
| $10,000 to $24,999 | 57 (14.9%) | 0 (0.0%) |
| $25,000 to $34,999 | 29 (7.6%) | 35 (4.3%) |
| $35,000 to $49,999 | 151 (39.5%) | 0 (0.0%) |
| $50,000 to $74,999 | 27 (7.1%) | 85 (10.4%) |
| $75,000 to $99,999 | 0 (0.0%) | 209 (25.7%) |
| $100,000 to $149,999 | 47 (12.3%) | 151 (18.5%) |
| $150,000 or more | 46 (12.0%) | 147 (18.1%) |
| Total | 382 (100.0%) | 814 (100.0%) |
Property Value to Household Income Ratio in Shelley
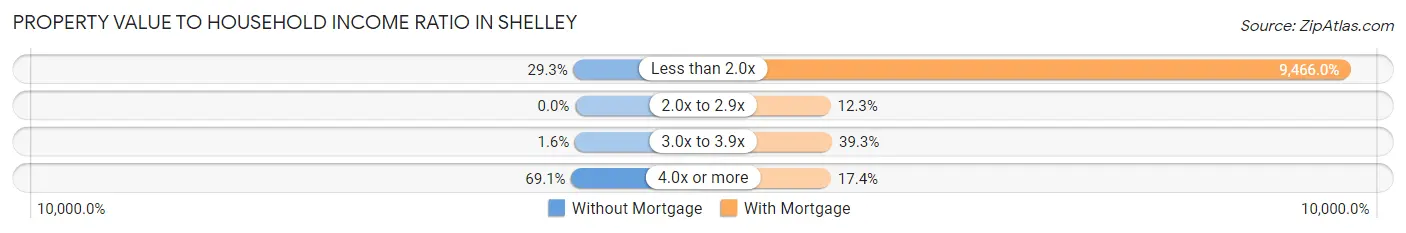
| Value-to-Income Ratio | Without Mortgage | With Mortgage |
| Less than 2.0x | 112 (29.3%) | 77,053 (9,466.0%) |
| 2.0x to 2.9x | 0 (0.0%) | 100 (12.3%) |
| 3.0x to 3.9x | 6 (1.6%) | 320 (39.3%) |
| 4.0x or more | 264 (69.1%) | 142 (17.4%) |
| Total | 382 (100.0%) | 814 (100.0%) |
Real Estate Taxes by Mortgage Status in Shelley
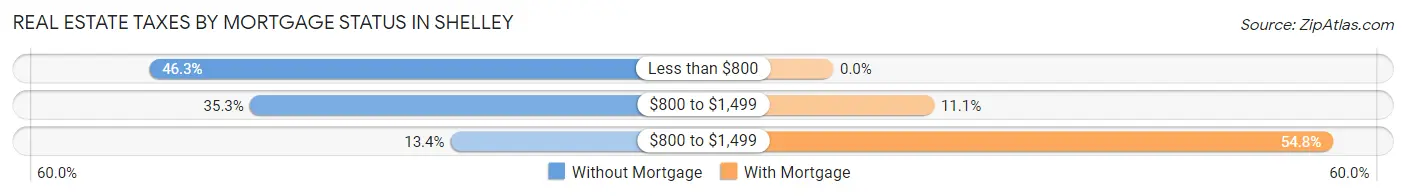
| Property Taxes | Without Mortgage | With Mortgage |
| Less than $800 | 177 (46.3%) | 0 (0.0%) |
| $800 to $1,499 | 135 (35.3%) | 90 (11.1%) |
| $800 to $1,499 | 51 (13.4%) | 446 (54.8%) |
| Total | 382 (100.0%) | 814 (100.0%) |
Health & Disability in Shelley
Health Insurance Coverage by Age in Shelley
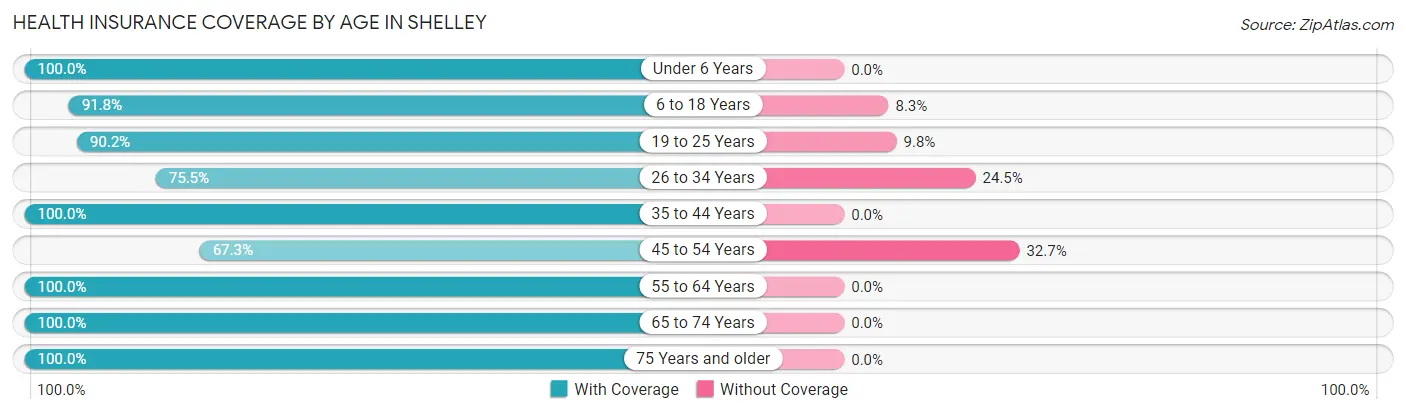
| Age Bracket | With Coverage | Without Coverage |
| Under 6 Years | 609 (100.0%) | 0 (0.0%) |
| 6 to 18 Years | 812 (91.7%) | 73 (8.3%) |
| 19 to 25 Years | 555 (90.2%) | 60 (9.8%) |
| 26 to 34 Years | 481 (75.5%) | 156 (24.5%) |
| 35 to 44 Years | 684 (100.0%) | 0 (0.0%) |
| 45 to 54 Years | 373 (67.3%) | 181 (32.7%) |
| 55 to 64 Years | 416 (100.0%) | 0 (0.0%) |
| 65 to 74 Years | 268 (100.0%) | 0 (0.0%) |
| 75 Years and older | 203 (100.0%) | 0 (0.0%) |
| Total | 4,401 (90.3%) | 470 (9.7%) |
Health Insurance Coverage by Citizenship Status in Shelley
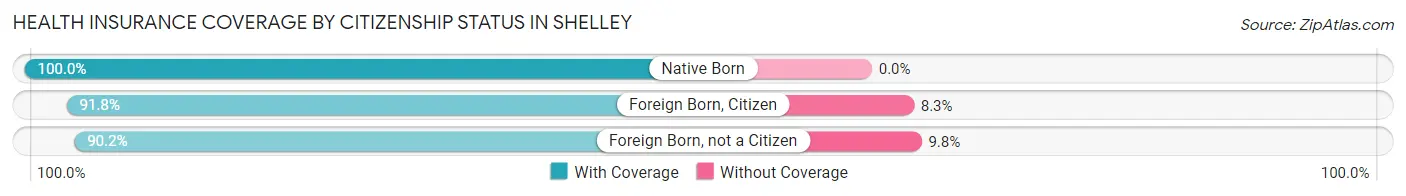
| Citizenship Status | With Coverage | Without Coverage |
| Native Born | 609 (100.0%) | 0 (0.0%) |
| Foreign Born, Citizen | 812 (91.7%) | 73 (8.3%) |
| Foreign Born, not a Citizen | 555 (90.2%) | 60 (9.8%) |
Health Insurance Coverage by Household Income in Shelley
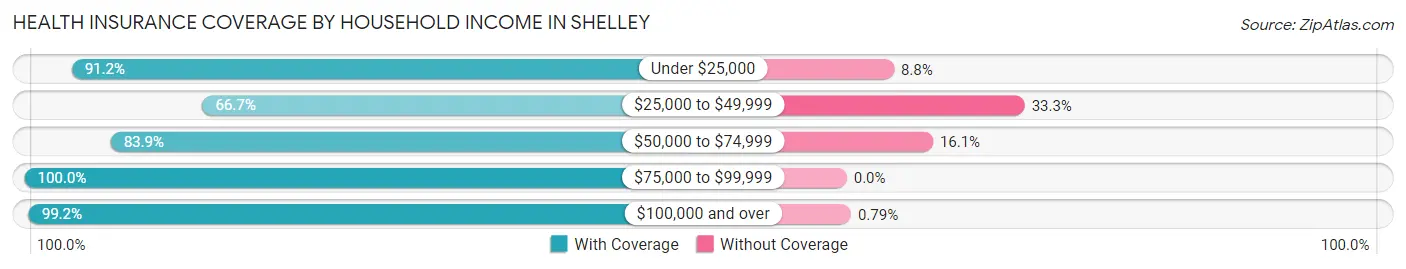
| Household Income | With Coverage | Without Coverage |
| Under $25,000 | 475 (91.2%) | 46 (8.8%) |
| $25,000 to $49,999 | 582 (66.7%) | 291 (33.3%) |
| $50,000 to $74,999 | 608 (83.9%) | 117 (16.1%) |
| $75,000 to $99,999 | 732 (100.0%) | 0 (0.0%) |
| $100,000 and over | 2,004 (99.2%) | 16 (0.8%) |
Public vs Private Health Insurance Coverage by Age in Shelley
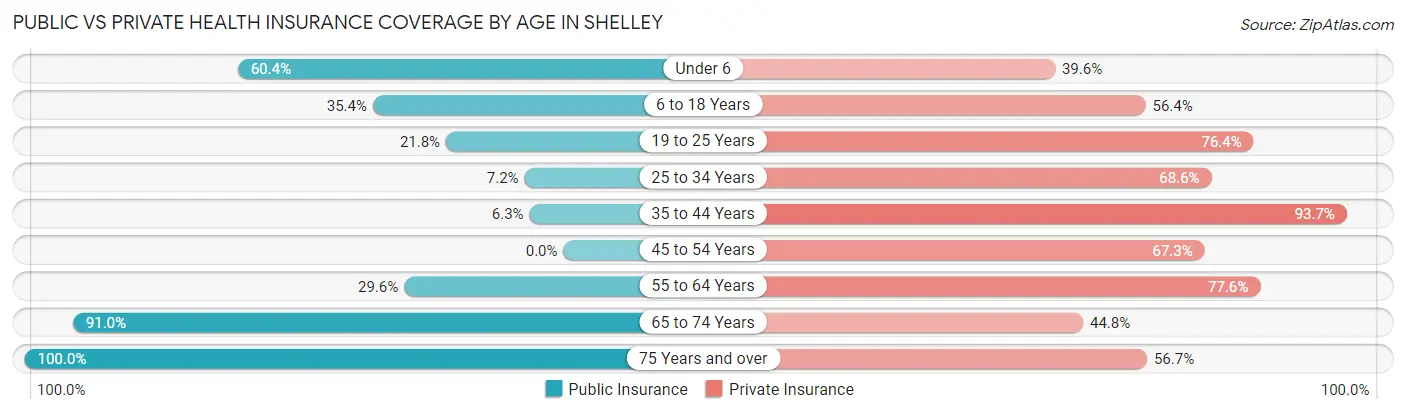
| Age Bracket | Public Insurance | Private Insurance |
| Under 6 | 368 (60.4%) | 241 (39.6%) |
| 6 to 18 Years | 313 (35.4%) | 499 (56.4%) |
| 19 to 25 Years | 134 (21.8%) | 470 (76.4%) |
| 25 to 34 Years | 46 (7.2%) | 437 (68.6%) |
| 35 to 44 Years | 43 (6.3%) | 641 (93.7%) |
| 45 to 54 Years | 0 (0.0%) | 373 (67.3%) |
| 55 to 64 Years | 123 (29.6%) | 323 (77.6%) |
| 65 to 74 Years | 244 (91.0%) | 120 (44.8%) |
| 75 Years and over | 203 (100.0%) | 115 (56.7%) |
| Total | 1,474 (30.3%) | 3,219 (66.1%) |
Disability Status by Sex by Age in Shelley
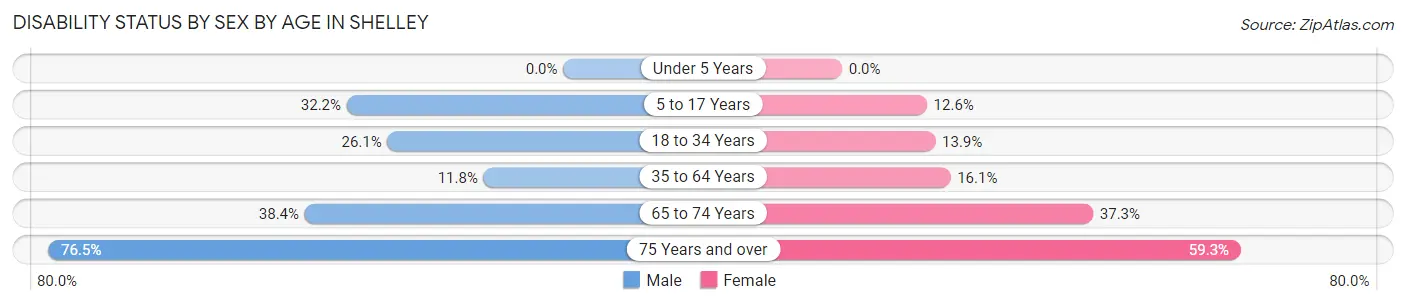
| Age Bracket | Male | Female |
| Under 5 Years | 0 (0.0%) | 0 (0.0%) |
| 5 to 17 Years | 172 (32.2%) | 48 (12.6%) |
| 18 to 34 Years | 182 (26.1%) | 79 (13.9%) |
| 35 to 64 Years | 78 (11.8%) | 160 (16.1%) |
| 65 to 74 Years | 38 (38.4%) | 63 (37.3%) |
| 75 Years and over | 114 (76.5%) | 32 (59.3%) |
Disability Class by Sex by Age in Shelley
Disability Class: Hearing Difficulty
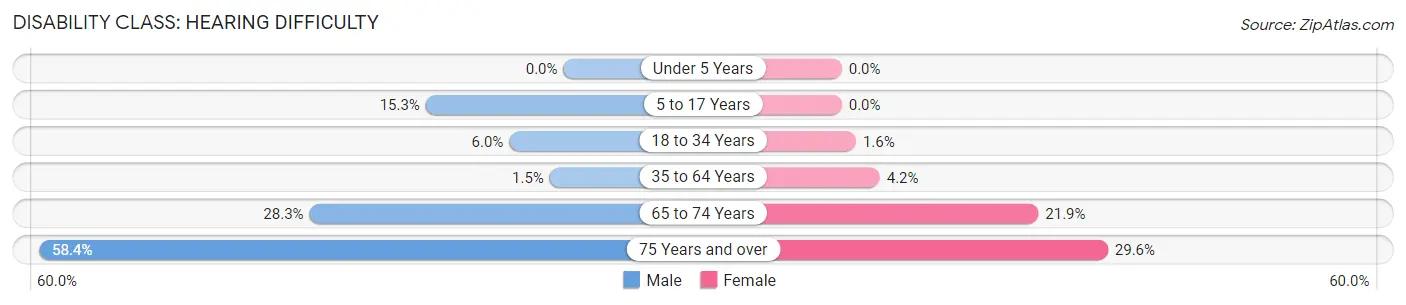
| Age Bracket | Male | Female |
| Under 5 Years | 0 (0.0%) | 0 (0.0%) |
| 5 to 17 Years | 82 (15.3%) | 0 (0.0%) |
| 18 to 34 Years | 42 (6.0%) | 9 (1.6%) |
| 35 to 64 Years | 10 (1.5%) | 42 (4.2%) |
| 65 to 74 Years | 28 (28.3%) | 37 (21.9%) |
| 75 Years and over | 87 (58.4%) | 16 (29.6%) |
Disability Class: Vision Difficulty
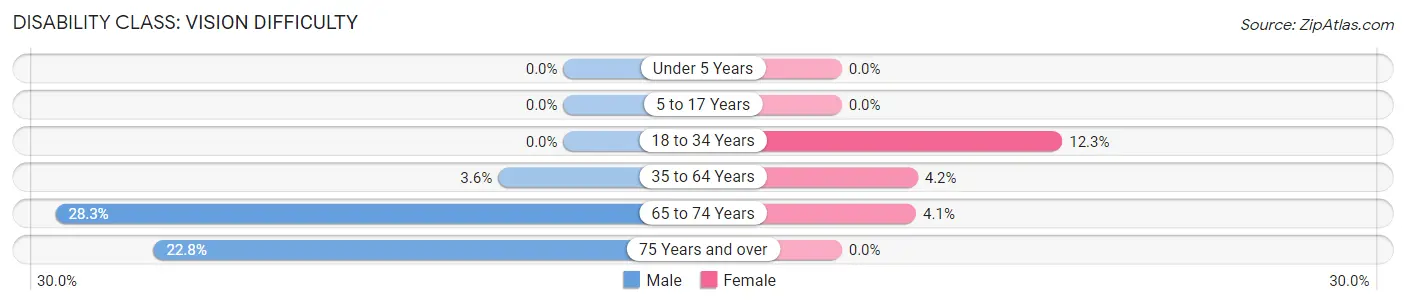
| Age Bracket | Male | Female |
| Under 5 Years | 0 (0.0%) | 0 (0.0%) |
| 5 to 17 Years | 0 (0.0%) | 0 (0.0%) |
| 18 to 34 Years | 0 (0.0%) | 70 (12.3%) |
| 35 to 64 Years | 24 (3.6%) | 42 (4.2%) |
| 65 to 74 Years | 28 (28.3%) | 7 (4.1%) |
| 75 Years and over | 34 (22.8%) | 0 (0.0%) |
Disability Class: Cognitive Difficulty
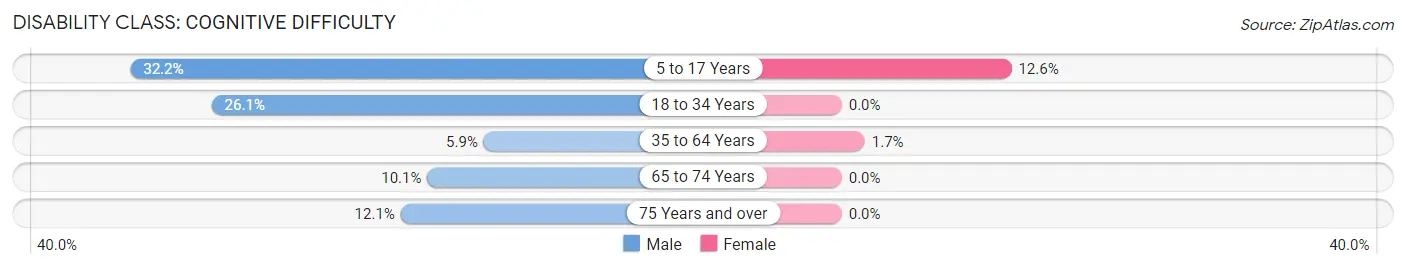
| Age Bracket | Male | Female |
| 5 to 17 Years | 172 (32.2%) | 48 (12.6%) |
| 18 to 34 Years | 182 (26.1%) | 0 (0.0%) |
| 35 to 64 Years | 39 (5.9%) | 17 (1.7%) |
| 65 to 74 Years | 10 (10.1%) | 0 (0.0%) |
| 75 Years and over | 18 (12.1%) | 0 (0.0%) |
Disability Class: Ambulatory Difficulty
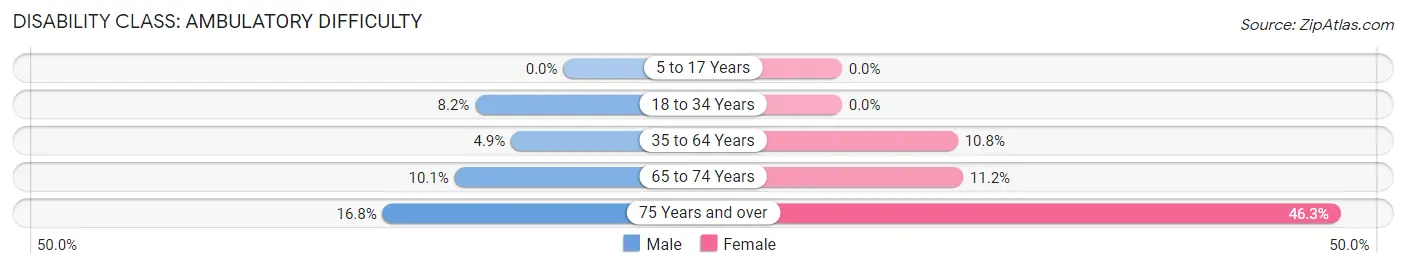
| Age Bracket | Male | Female |
| 5 to 17 Years | 0 (0.0%) | 0 (0.0%) |
| 18 to 34 Years | 57 (8.2%) | 0 (0.0%) |
| 35 to 64 Years | 32 (4.9%) | 107 (10.8%) |
| 65 to 74 Years | 10 (10.1%) | 19 (11.2%) |
| 75 Years and over | 25 (16.8%) | 25 (46.3%) |
Disability Class: Self-Care Difficulty
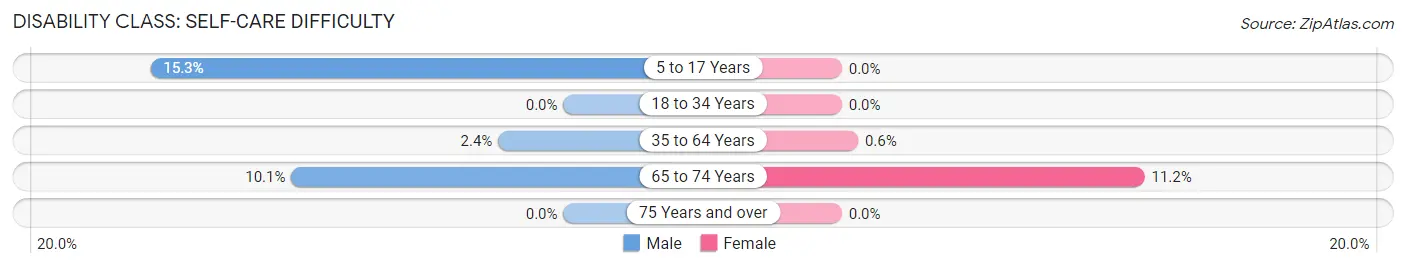
| Age Bracket | Male | Female |
| 5 to 17 Years | 82 (15.3%) | 0 (0.0%) |
| 18 to 34 Years | 0 (0.0%) | 0 (0.0%) |
| 35 to 64 Years | 16 (2.4%) | 6 (0.6%) |
| 65 to 74 Years | 10 (10.1%) | 19 (11.2%) |
| 75 Years and over | 0 (0.0%) | 0 (0.0%) |
Technology Access in Shelley
Computing Device Access in Shelley
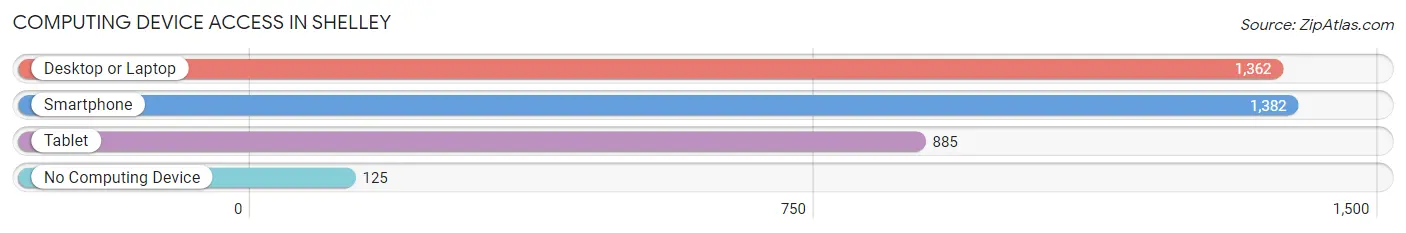
| Device Type | # Households | % Households |
| Desktop or Laptop | 1,362 | 85.7% |
| Smartphone | 1,382 | 86.9% |
| Tablet | 885 | 55.7% |
| No Computing Device | 125 | 7.9% |
| Total | 1,590 | 100.0% |
Internet Access in Shelley
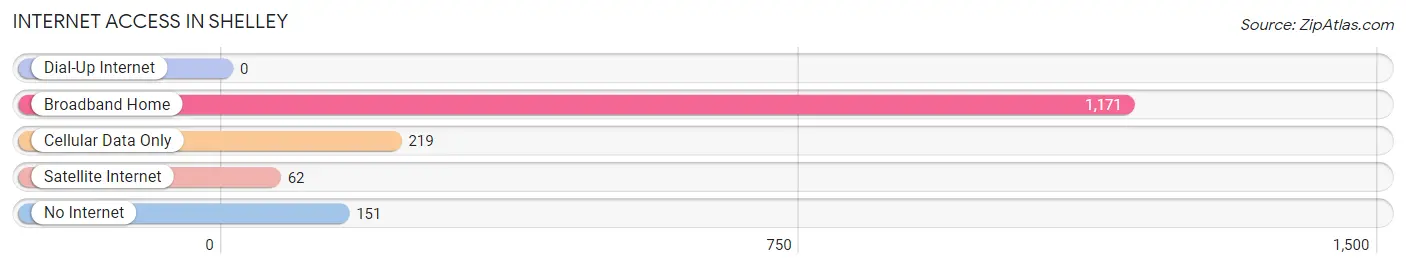
| Internet Type | # Households | % Households |
| Dial-Up Internet | 0 | 0.0% |
| Broadband Home | 1,171 | 73.7% |
| Cellular Data Only | 219 | 13.8% |
| Satellite Internet | 62 | 3.9% |
| No Internet | 151 | 9.5% |
| Total | 1,590 | 100.0% |
Shelley Summary
Shelley, Idaho is a small city located in Bingham County in the southeastern part of the state. It is situated along the Snake River, about 20 miles south of Idaho Falls. The city has a population of approximately 5,000 people and is part of the Idaho Falls Metropolitan Statistical Area.
History
Shelley was founded in 1883 by a group of Mormon settlers led by William H. Shelley. The settlers were looking for a place to build a new community and chose the area along the Snake River. The city was named after William Shelley and was incorporated in 1891.
The city grew rapidly in the early 1900s, with the construction of the Oregon Short Line Railroad in 1906. This allowed for the transportation of goods and services to and from the city. The railroad also helped to bring in new settlers and businesses.
In the 1920s, the city experienced a period of growth and prosperity. The population increased from 1,000 to over 4,000 people. The city also saw the construction of several new businesses, including a flour mill, a creamery, and a cannery.
Geography
Shelley is located in the southeastern part of Idaho, along the Snake River. The city is situated at an elevation of 4,717 feet above sea level. The city is surrounded by rolling hills and farmland. The nearby Snake River provides a source of recreation for the city's residents.
The climate in Shelley is semi-arid, with hot summers and cold winters. The average annual temperature is around 50 degrees Fahrenheit. The average annual precipitation is around 12 inches.
Economy
Shelley's economy is largely based on agriculture. The city is home to several large farms and ranches, which produce a variety of crops, including potatoes, wheat, corn, and hay. The city also has several food processing plants, which process and package the crops for sale.
The city also has a number of small businesses, including restaurants, retail stores, and service providers. The city is also home to several manufacturing companies, which produce a variety of products, including furniture, clothing, and electronics.
Demographics
As of the 2010 census, the population of Shelley was 5,000 people. The racial makeup of the city was 95.3% White, 0.7% African American, 0.3% Native American, 0.3% Asian, 0.1% Pacific Islander, and 2.3% from other races. The median household income was $41,000, and the median family income was $48,000.
Shelley is a predominantly Mormon city, with over 70% of the population identifying as members of the Church of Jesus Christ of Latter-day Saints. The city also has a small Catholic population. The city is served by several churches, including the Church of Jesus Christ of Latter-day Saints, the Catholic Church, and the United Methodist Church.
Common Questions
What is Per Capita Income in Shelley?
Per Capita income in Shelley is $31,180.
What is the Median Family Income in Shelley?
Median Family Income in Shelley is $76,179.
What is the Median Household income in Shelley?
Median Household Income in Shelley is $64,783.
What is Income or Wage Gap in Shelley?
Income or Wage Gap in Shelley is 22.8%.
Women in Shelley earn 77.2 cents for every dollar earned by a man.
What is Inequality or Gini Index in Shelley?
Inequality or Gini Index in Shelley is 0.45.
What is the Total Population of Shelley?
Total Population of Shelley is 4,878.
What is the Total Male Population of Shelley?
Total Male Population of Shelley is 2,459.
What is the Total Female Population of Shelley?
Total Female Population of Shelley is 2,419.
What is the Ratio of Males per 100 Females in Shelley?
There are 101.65 Males per 100 Females in Shelley.
What is the Ratio of Females per 100 Males in Shelley?
There are 98.37 Females per 100 Males in Shelley.
What is the Median Population Age in Shelley?
Median Population Age in Shelley is 29.9 Years.
What is the Average Family Size in Shelley
Average Family Size in Shelley is 3.9 People.
What is the Average Household Size in Shelley
Average Household Size in Shelley is 3.1 People.
How Large is the Labor Force in Shelley?
There are 2,675 People in the Labor Forcein in Shelley.
What is the Percentage of People in the Labor Force in Shelley?
75.3% of People are in the Labor Force in Shelley.
What is the Unemployment Rate in Shelley?
Unemployment Rate in Shelley is 9.4%.