Zip Codes with the Highest Percentage of Population Employed in Food Preparation & Serving in Coeur D Alene, ID
RELATED REPORTS & OPTIONS
Food Preparation & Serving
Coeur D Alene
Compare Zip Codes
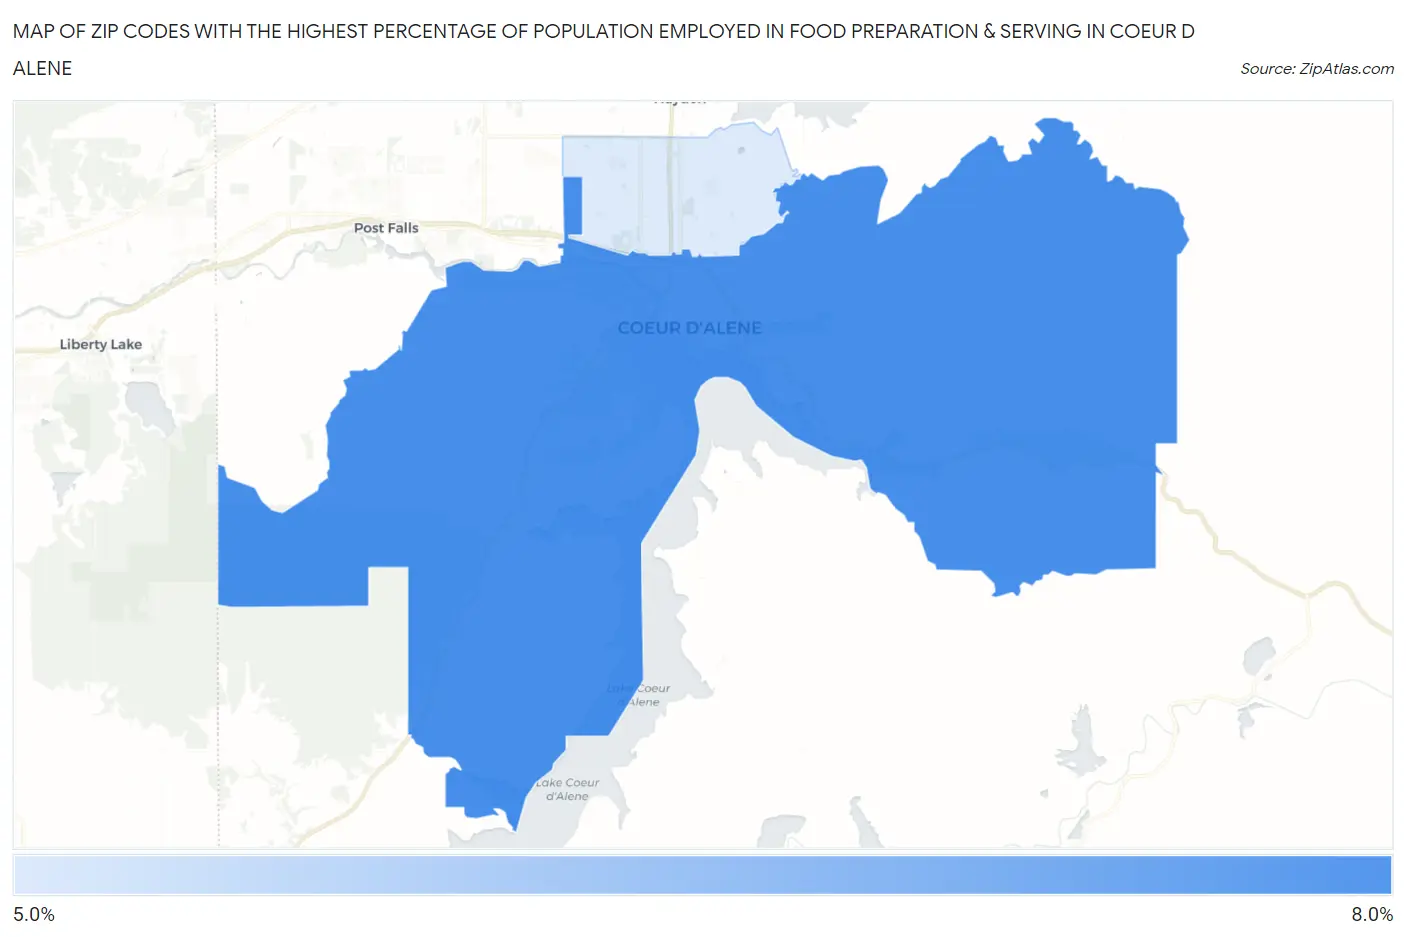
Map of Zip Codes with the Highest Percentage of Population Employed in Food Preparation & Serving in Coeur D Alene
5.0%
7.7%
Zip Codes with the Highest Percentage of Population Employed in Food Preparation & Serving in Coeur D Alene, ID
| Zip Code | % Employed | vs State | vs National | |
| 1. | 83814 | 7.7% | 5.7%(+2.00)#44 | 5.3%(+2.39)#5,259 |
| 2. | 83815 | 5.0% | 5.7%(-0.644)#101 | 5.3%(-0.257)#12,827 |
1
Common Questions
What are the Top Zip Codes with the Highest Percentage of Population Employed in Food Preparation & Serving in Coeur D Alene, ID?
Top Zip Codes with the Highest Percentage of Population Employed in Food Preparation & Serving in Coeur D Alene, ID are:
What zip code has the Highest Percentage of Population Employed in Food Preparation & Serving in Coeur D Alene, ID?
83814 has the Highest Percentage of Population Employed in Food Preparation & Serving in Coeur D Alene, ID with 7.7%.
What is the Percentage of Population Employed in Food Preparation & Serving in Coeur D Alene, ID?
Percentage of Population Employed in Food Preparation & Serving in Coeur D Alene is 6.3%.
What is the Percentage of Population Employed in Food Preparation & Serving in Idaho?
Percentage of Population Employed in Food Preparation & Serving in Idaho is 5.7%.
What is the Percentage of Population Employed in Food Preparation & Serving in the United States?
Percentage of Population Employed in Food Preparation & Serving in the United States is 5.3%.