Zip Codes with the Highest Percentage of Population Employed in Food Preparation & Serving in Pocatello, ID
RELATED REPORTS & OPTIONS
Food Preparation & Serving
Pocatello
Compare Zip Codes
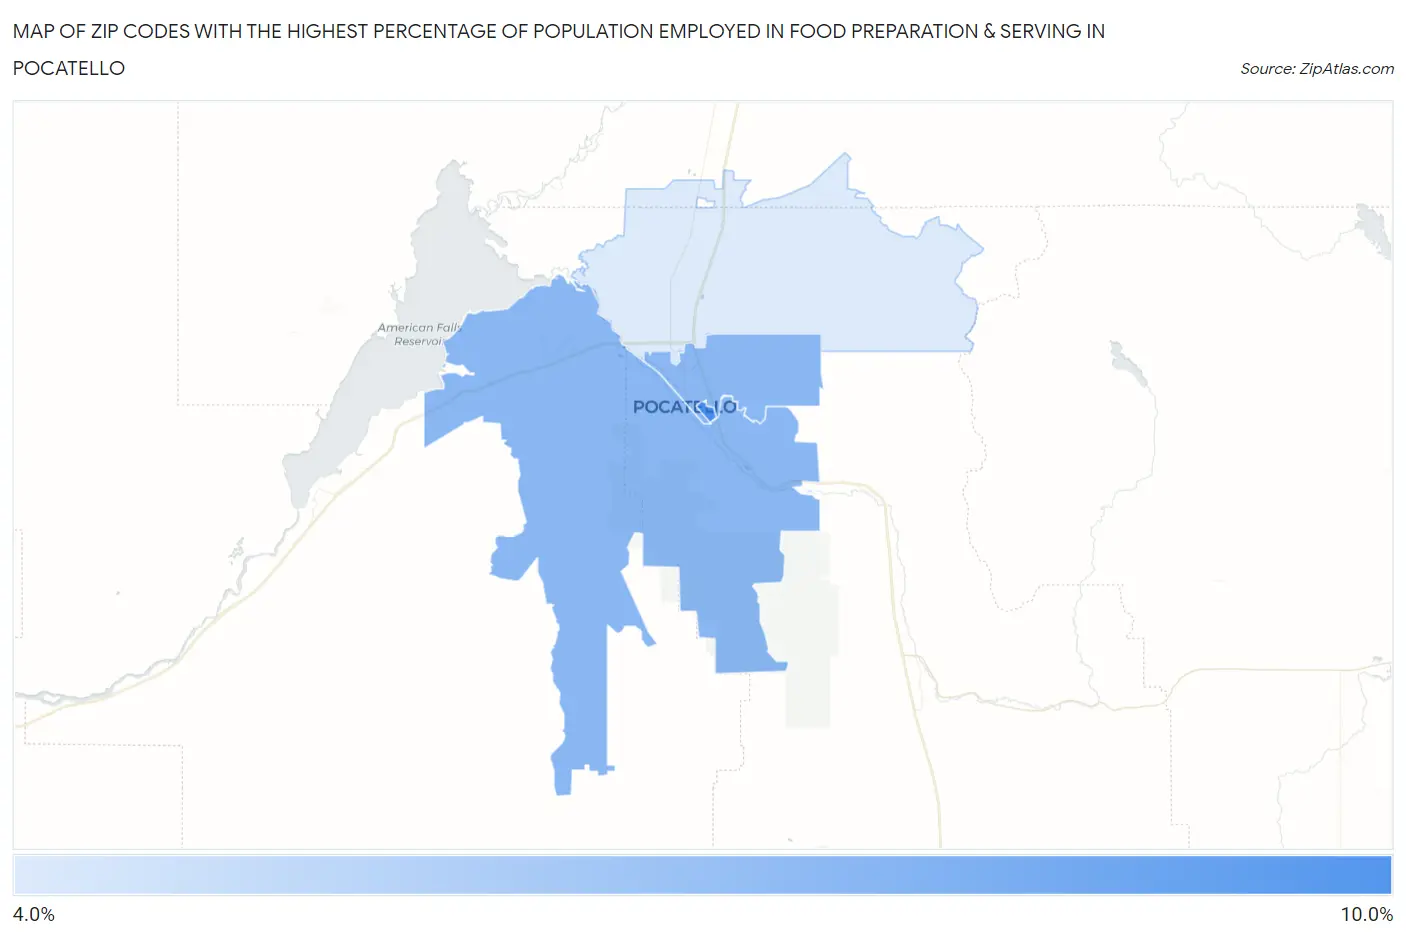
Map of Zip Codes with the Highest Percentage of Population Employed in Food Preparation & Serving in Pocatello
4.3%
9.3%
Zip Codes with the Highest Percentage of Population Employed in Food Preparation & Serving in Pocatello, ID
| Zip Code | % Employed | vs State | vs National | |
| 1. | 83209 | 9.3% | 5.7%(+3.63)#30 | 5.3%(+4.01)#3,238 |
| 2. | 83201 | 7.0% | 5.7%(+1.34)#55 | 5.3%(+1.73)#6,519 |
| 3. | 83204 | 7.0% | 5.7%(+1.32)#57 | 5.3%(+1.71)#6,569 |
| 4. | 83202 | 4.3% | 5.7%(-1.40)#133 | 5.3%(-1.01)#15,984 |
1
Common Questions
What are the Top 3 Zip Codes with the Highest Percentage of Population Employed in Food Preparation & Serving in Pocatello, ID?
Top 3 Zip Codes with the Highest Percentage of Population Employed in Food Preparation & Serving in Pocatello, ID are:
What zip code has the Highest Percentage of Population Employed in Food Preparation & Serving in Pocatello, ID?
83209 has the Highest Percentage of Population Employed in Food Preparation & Serving in Pocatello, ID with 9.3%.
What is the Percentage of Population Employed in Food Preparation & Serving in Pocatello, ID?
Percentage of Population Employed in Food Preparation & Serving in Pocatello is 7.2%.
What is the Percentage of Population Employed in Food Preparation & Serving in Idaho?
Percentage of Population Employed in Food Preparation & Serving in Idaho is 5.7%.
What is the Percentage of Population Employed in Food Preparation & Serving in the United States?
Percentage of Population Employed in Food Preparation & Serving in the United States is 5.3%.