Dubois, ID Map & Demographics
Dubois Map
Dubois Overview
$24,424
PER CAPITA INCOME
$59,044
AVG FAMILY INCOME
$52,625
AVG HOUSEHOLD INCOME
12.4%
WAGE / INCOME GAP [ % ]
87.6¢/ $1
WAGE / INCOME GAP [ $ ]
0.31
INEQUALITY / GINI INDEX
530
TOTAL POPULATION
224
MALE POPULATION
306
FEMALE POPULATION
73.20
MALES / 100 FEMALES
136.61
FEMALES / 100 MALES
41.9
MEDIAN AGE
3.5
AVG FAMILY SIZE
2.5
AVG HOUSEHOLD SIZE
290
LABOR FORCE [ PEOPLE ]
65.8%
PERCENT IN LABOR FORCE
1.0%
UNEMPLOYMENT RATE
Dubois Zip Codes
Dubois Area Codes
Income in Dubois
Income Overview in Dubois
Per Capita Income in Dubois is $24,424, while median incomes of families and households are $59,044 and $52,625 respectively.
| Characteristic | Number | Measure |
| Per Capita Income | 530 | $24,424 |
| Median Family Income | 123 | $59,044 |
| Mean Family Income | 123 | $68,513 |
| Median Household Income | 203 | $52,625 |
| Mean Household Income | 203 | $55,640 |
| Income Deficit | 123 | $0 |
| Wage / Income Gap (%) | 530 | 12.38% |
| Wage / Income Gap ($) | 530 | 87.62¢ per $1 |
| Gini / Inequality Index | 530 | 0.31 |
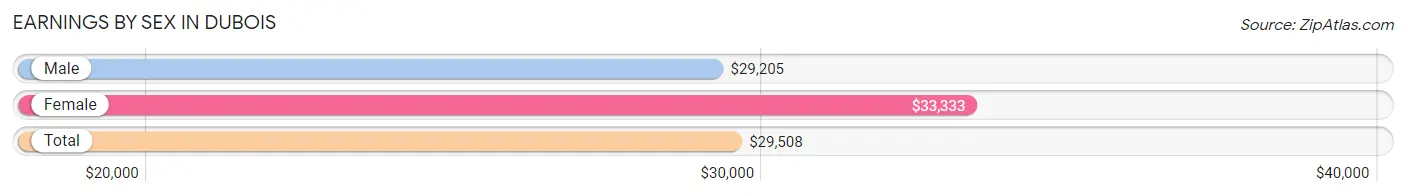
Earnings by Sex in Dubois
Average Earnings in Dubois are $29,508, $29,205 for men and $33,333 for women, a difference of 12.4%.
| Sex | Number | Average Earnings |
| Male | 153 (45.1%) | $29,205 |
| Female | 186 (54.9%) | $33,333 |
| Total | 339 (100.0%) | $29,508 |
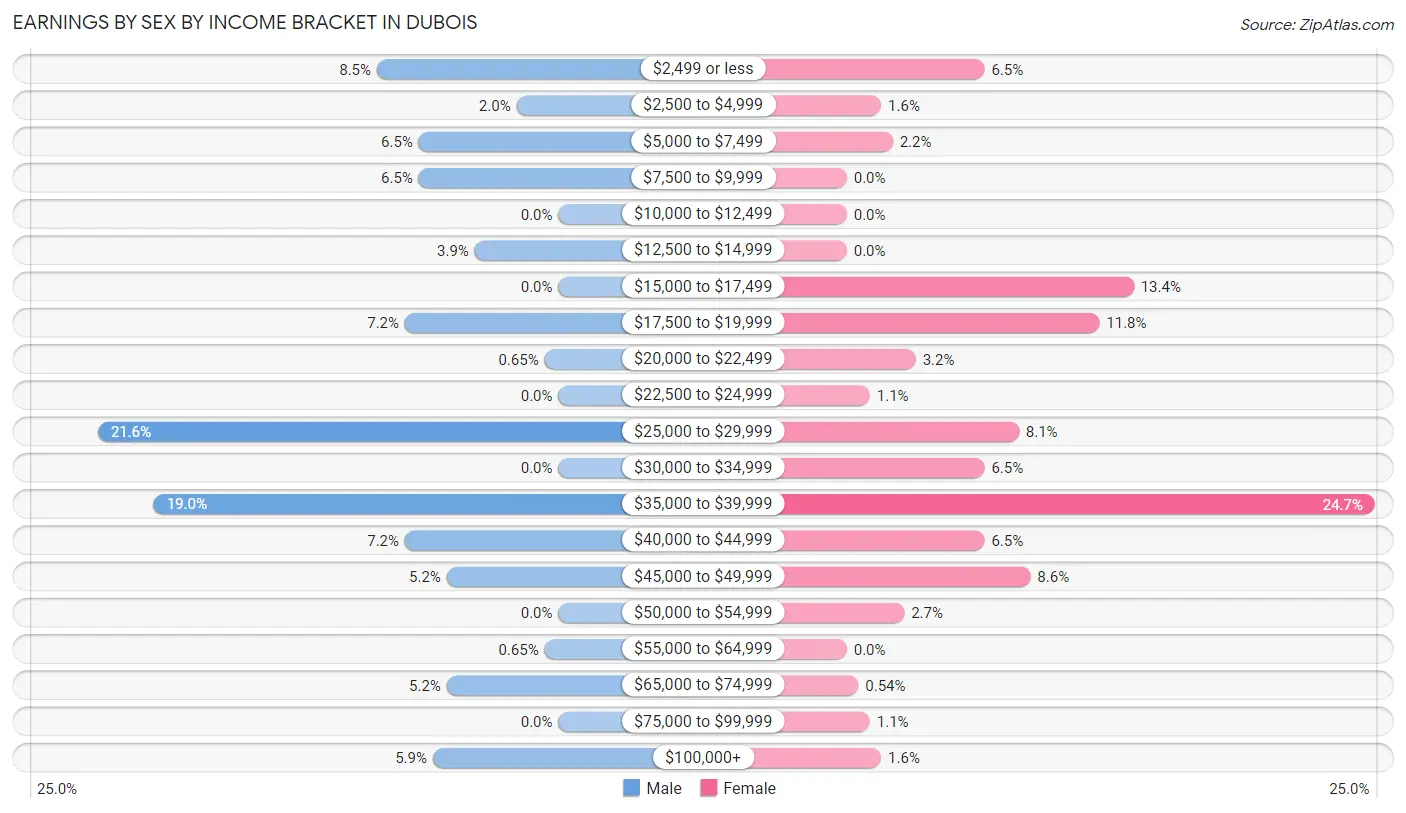
Earnings by Sex by Income Bracket in Dubois
The most common earnings brackets in Dubois are $25,000 to $29,999 for men (33 | 21.6%) and $35,000 to $39,999 for women (46 | 24.7%).
| Income | Male | Female |
| $2,499 or less | 13 (8.5%) | 12 (6.5%) |
| $2,500 to $4,999 | 3 (2.0%) | 3 (1.6%) |
| $5,000 to $7,499 | 10 (6.5%) | 4 (2.1%) |
| $7,500 to $9,999 | 10 (6.5%) | 0 (0.0%) |
| $10,000 to $12,499 | 0 (0.0%) | 0 (0.0%) |
| $12,500 to $14,999 | 6 (3.9%) | 0 (0.0%) |
| $15,000 to $17,499 | 0 (0.0%) | 25 (13.4%) |
| $17,500 to $19,999 | 11 (7.2%) | 22 (11.8%) |
| $20,000 to $22,499 | 1 (0.6%) | 6 (3.2%) |
| $22,500 to $24,999 | 0 (0.0%) | 2 (1.1%) |
| $25,000 to $29,999 | 33 (21.6%) | 15 (8.1%) |
| $30,000 to $34,999 | 0 (0.0%) | 12 (6.5%) |
| $35,000 to $39,999 | 29 (19.0%) | 46 (24.7%) |
| $40,000 to $44,999 | 11 (7.2%) | 12 (6.5%) |
| $45,000 to $49,999 | 8 (5.2%) | 16 (8.6%) |
| $50,000 to $54,999 | 0 (0.0%) | 5 (2.7%) |
| $55,000 to $64,999 | 1 (0.6%) | 0 (0.0%) |
| $65,000 to $74,999 | 8 (5.2%) | 1 (0.5%) |
| $75,000 to $99,999 | 0 (0.0%) | 2 (1.1%) |
| $100,000+ | 9 (5.9%) | 3 (1.6%) |
| Total | 153 (100.0%) | 186 (100.0%) |
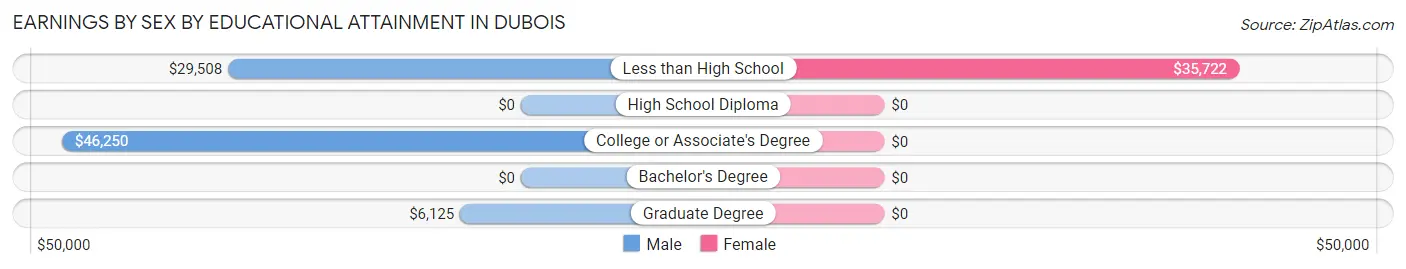
Earnings by Sex by Educational Attainment in Dubois
Average earnings in Dubois are $29,848 for men and $35,194 for women, a difference of 15.2%. Men with an educational attainment of college or associate's degree enjoy the highest average annual earnings of $46,250, while those with graduate degree education earn the least with $6,125. Women with an educational attainment of less than high school earn the most with the average annual earnings of $35,722, while those with less than high school education have the smallest earnings of $35,722.
| Educational Attainment | Male Income | Female Income |
| Less than High School | $29,508 | $35,722 |
| High School Diploma | - | - |
| College or Associate's Degree | $46,250 | $0 |
| Bachelor's Degree | - | - |
| Graduate Degree | $6,125 | $0 |
| Total | $29,848 | $35,194 |
Family Income in Dubois
Family Income Brackets in Dubois
According to the Dubois family income data, there are 67 families falling into the $50,000 to $74,999 income range, which is the most common income bracket and makes up 54.5% of all families.
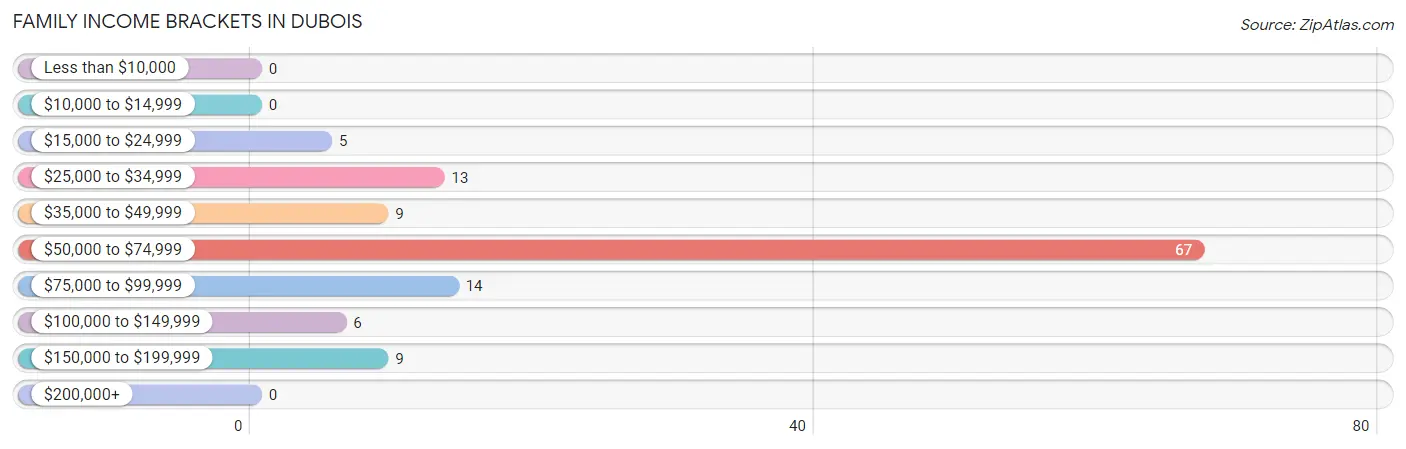
| Income Bracket | # Families | % Families |
| Less than $10,000 | 0 | 0.0% |
| $10,000 to $14,999 | 0 | 0.0% |
| $15,000 to $24,999 | 5 | 4.1% |
| $25,000 to $34,999 | 13 | 10.6% |
| $35,000 to $49,999 | 9 | 7.3% |
| $50,000 to $74,999 | 67 | 54.5% |
| $75,000 to $99,999 | 14 | 11.4% |
| $100,000 to $149,999 | 6 | 4.9% |
| $150,000 to $199,999 | 9 | 7.3% |
| $200,000+ | 0 | 0.0% |
Family Income by Famaliy Size in Dubois
3-person families (39 | 31.7%) account for the highest median family income in Dubois with $65,417 per family, while 2-person families (51 | 41.5%) have the highest median income of $28,086 per family member.
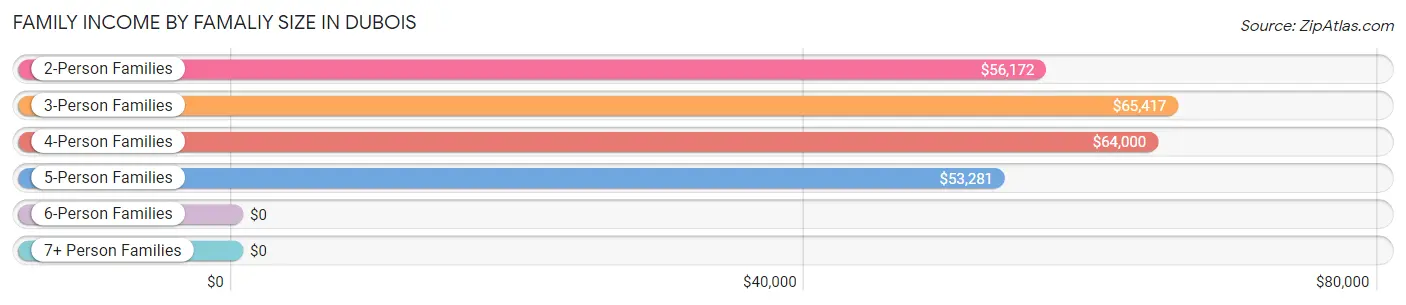
| Income Bracket | # Families | Median Income |
| 2-Person Families | 51 (41.5%) | $56,172 |
| 3-Person Families | 39 (31.7%) | $65,417 |
| 4-Person Families | 10 (8.1%) | $64,000 |
| 5-Person Families | 15 (12.2%) | $53,281 |
| 6-Person Families | 8 (6.5%) | $0 |
| 7+ Person Families | 0 (0.0%) | $0 |
| Total | 123 (100.0%) | $59,044 |
Family Income by Number of Earners in Dubois
The median family income in Dubois is $59,044, with families comprising 2 earners (39) having the highest median family income of $81,250, while families with no earners (9) have the lowest median family income of $31,250, accounting for 31.7% and 7.3% of families, respectively.
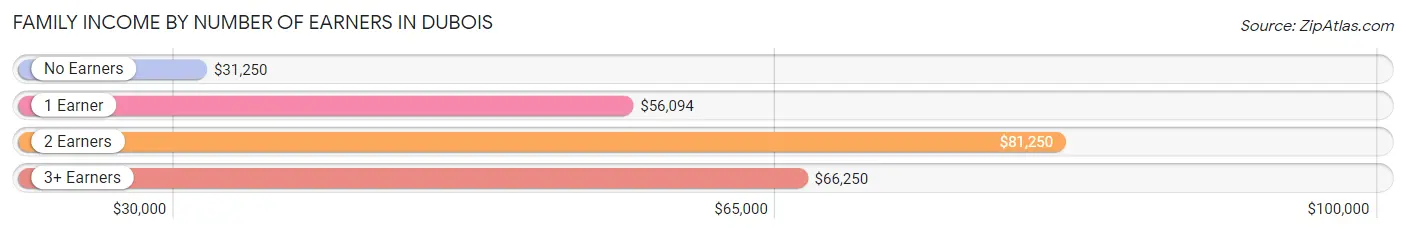
| Number of Earners | # Families | Median Income |
| No Earners | 9 (7.3%) | $31,250 |
| 1 Earner | 46 (37.4%) | $56,094 |
| 2 Earners | 39 (31.7%) | $81,250 |
| 3+ Earners | 29 (23.6%) | $66,250 |
| Total | 123 (100.0%) | $59,044 |
Household Income in Dubois
Household Income Brackets in Dubois
With 70 households falling in the category, the $50,000 to $74,999 income range is the most frequent in Dubois, accounting for 34.5% of all households.
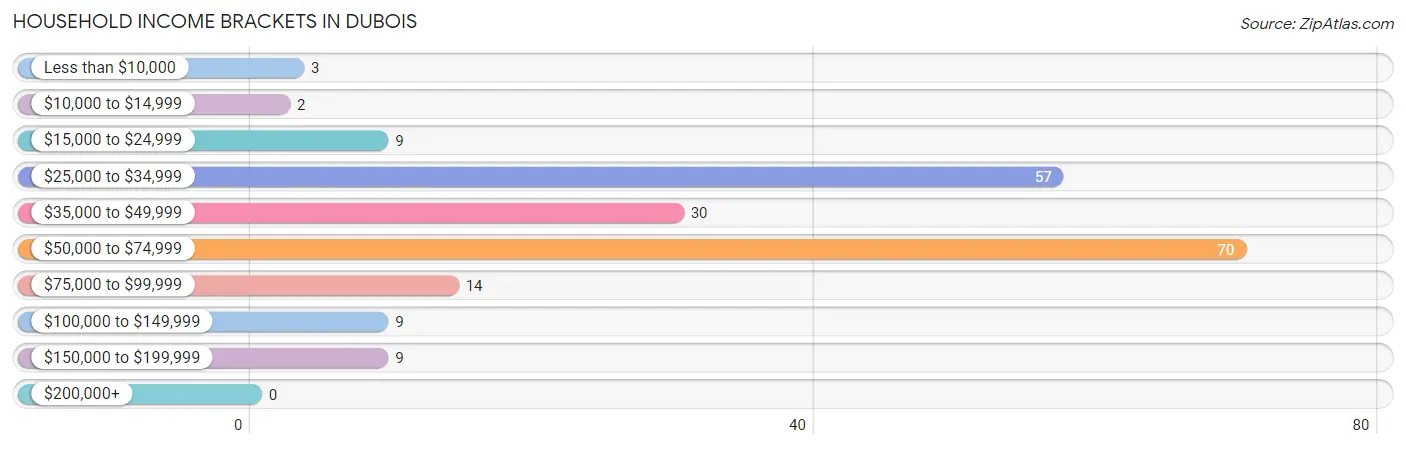
| Income Bracket | # Households | % Households |
| Less than $10,000 | 3 | 1.5% |
| $10,000 to $14,999 | 2 | 1.0% |
| $15,000 to $24,999 | 9 | 4.4% |
| $25,000 to $34,999 | 57 | 28.1% |
| $35,000 to $49,999 | 30 | 14.8% |
| $50,000 to $74,999 | 70 | 34.5% |
| $75,000 to $99,999 | 14 | 6.9% |
| $100,000 to $149,999 | 9 | 4.4% |
| $150,000 to $199,999 | 9 | 4.4% |
| $200,000+ | 0 | 0.0% |
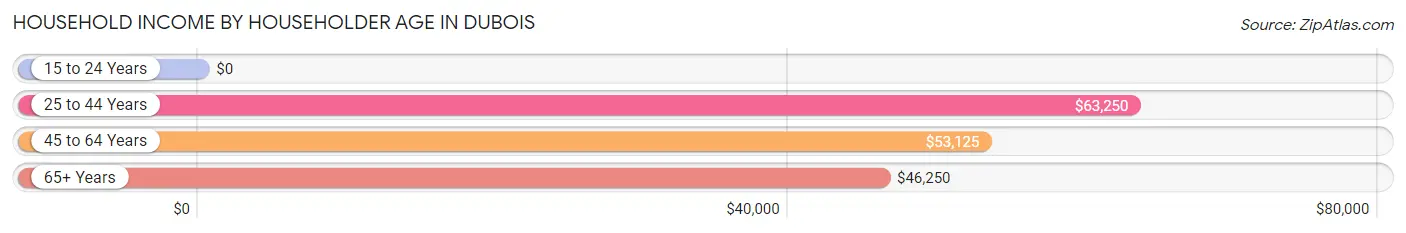
Household Income by Householder Age in Dubois
The median household income in Dubois is $52,625, with the highest median household income of $63,250 found in the 25 to 44 years age bracket for the primary householder. A total of 67 households (33.0%) fall into this category. Meanwhile, the 15 to 24 years age bracket for the primary householder has the lowest median household income of $0, with 2 households (1.0%) in this group.
| Income Bracket | # Households | Median Income |
| 15 to 24 Years | 2 (1.0%) | $0 |
| 25 to 44 Years | 67 (33.0%) | $63,250 |
| 45 to 64 Years | 77 (37.9%) | $53,125 |
| 65+ Years | 57 (28.1%) | $46,250 |
| Total | 203 (100.0%) | $52,625 |
Poverty in Dubois
Income Below Poverty by Sex and Age in Dubois
With 11.7% poverty level for males and 6.6% for females among the residents of Dubois, 12 to 14 year old males and 35 to 44 year old females are the most vulnerable to poverty, with 3 males (60.0%) and 11 females (30.6%) in their respective age groups living below the poverty level.
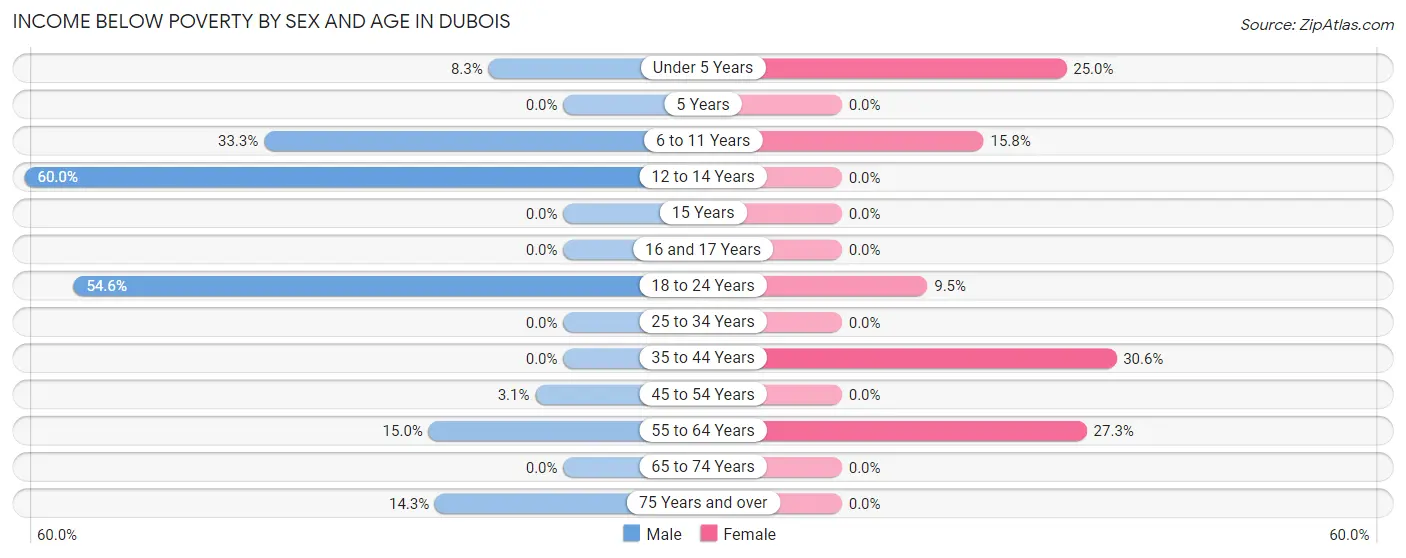
| Age Bracket | Male | Female |
| Under 5 Years | 3 (8.3%) | 1 (25.0%) |
| 5 Years | 0 (0.0%) | 0 (0.0%) |
| 6 to 11 Years | 2 (33.3%) | 3 (15.8%) |
| 12 to 14 Years | 3 (60.0%) | 0 (0.0%) |
| 15 Years | 0 (0.0%) | 0 (0.0%) |
| 16 and 17 Years | 0 (0.0%) | 0 (0.0%) |
| 18 to 24 Years | 12 (54.5%) | 2 (9.5%) |
| 25 to 34 Years | 0 (0.0%) | 0 (0.0%) |
| 35 to 44 Years | 0 (0.0%) | 11 (30.6%) |
| 45 to 54 Years | 1 (3.1%) | 0 (0.0%) |
| 55 to 64 Years | 3 (15.0%) | 3 (27.3%) |
| 65 to 74 Years | 0 (0.0%) | 0 (0.0%) |
| 75 Years and over | 2 (14.3%) | 0 (0.0%) |
| Total | 26 (11.7%) | 20 (6.6%) |
Income Above Poverty by Sex and Age in Dubois
According to the poverty statistics in Dubois, males aged 5 years and females aged 5 years are the age groups that are most secure financially, with 100.0% of males and 100.0% of females in these age groups living above the poverty line.
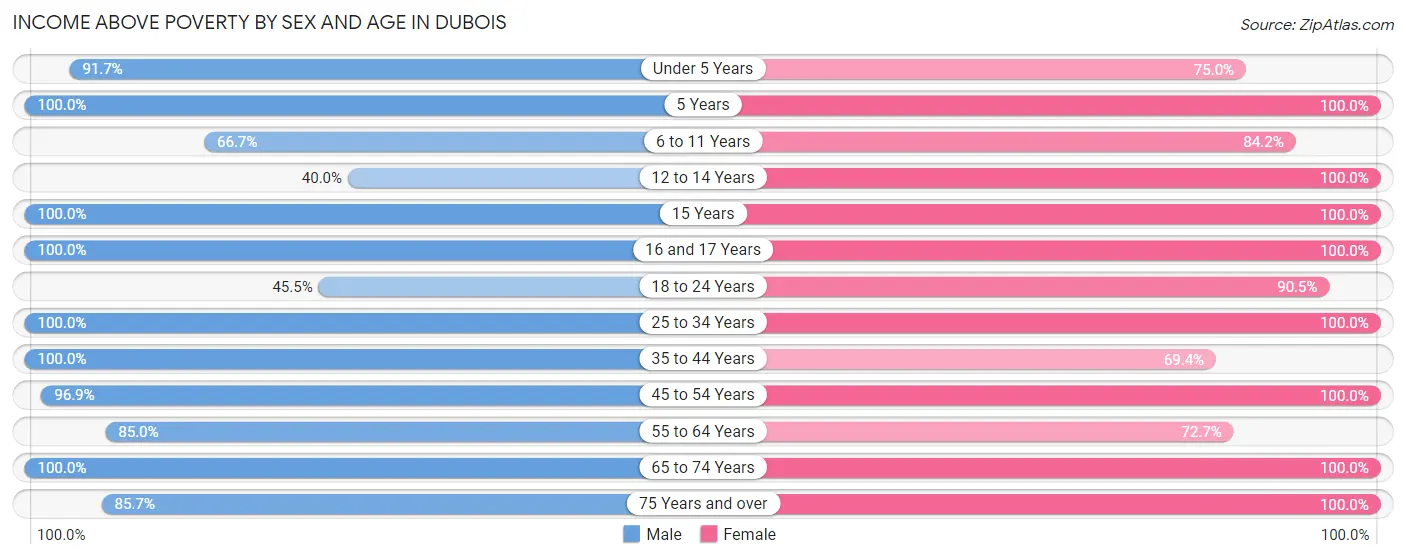
| Age Bracket | Male | Female |
| Under 5 Years | 33 (91.7%) | 3 (75.0%) |
| 5 Years | 2 (100.0%) | 10 (100.0%) |
| 6 to 11 Years | 4 (66.7%) | 16 (84.2%) |
| 12 to 14 Years | 2 (40.0%) | 3 (100.0%) |
| 15 Years | 1 (100.0%) | 3 (100.0%) |
| 16 and 17 Years | 1 (100.0%) | 2 (100.0%) |
| 18 to 24 Years | 10 (45.5%) | 19 (90.5%) |
| 25 to 34 Years | 6 (100.0%) | 57 (100.0%) |
| 35 to 44 Years | 40 (100.0%) | 25 (69.4%) |
| 45 to 54 Years | 31 (96.9%) | 93 (100.0%) |
| 55 to 64 Years | 17 (85.0%) | 8 (72.7%) |
| 65 to 74 Years | 37 (100.0%) | 37 (100.0%) |
| 75 Years and over | 12 (85.7%) | 9 (100.0%) |
| Total | 196 (88.3%) | 285 (93.4%) |
Income Below Poverty Among Married-Couple Families in Dubois
The poverty statistics for married-couple families in Dubois show that 2.9% or 3 of the total 102 families live below the poverty line. Families with 3 or 4 children have the highest poverty rate of 20.0%, comprising of 3 families. On the other hand, families with no children have the lowest poverty rate of 0.0%, which includes 0 families.
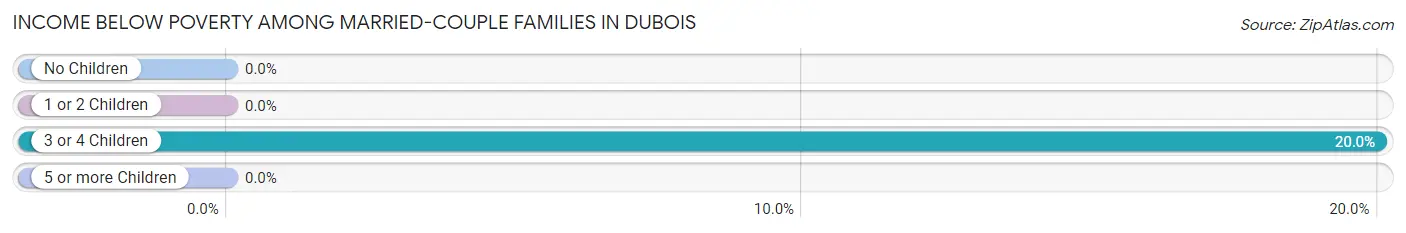
| Children | Above Poverty | Below Poverty |
| No Children | 63 (100.0%) | 0 (0.0%) |
| 1 or 2 Children | 24 (100.0%) | 0 (0.0%) |
| 3 or 4 Children | 12 (80.0%) | 3 (20.0%) |
| 5 or more Children | 0 (0.0%) | 0 (0.0%) |
| Total | 99 (97.1%) | 3 (2.9%) |
Income Below Poverty Among Single-Parent Households in Dubois
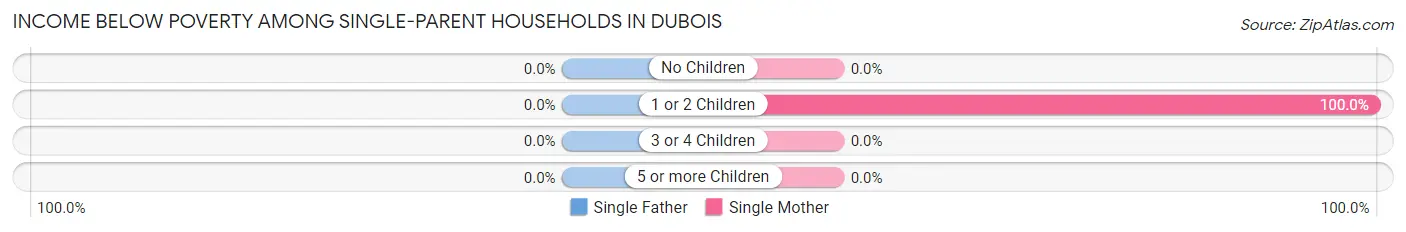
| Children | Single Father | Single Mother |
| No Children | 0 (0.0%) | 0 (0.0%) |
| 1 or 2 Children | 0 (0.0%) | 2 (100.0%) |
| 3 or 4 Children | 0 (0.0%) | 0 (0.0%) |
| 5 or more Children | 0 (0.0%) | 0 (0.0%) |
| Total | 0 (0.0%) | 2 (66.7%) |
Income Below Poverty Among Married-Couple vs Single-Parent Households in Dubois
The poverty data for Dubois shows that 3 of the married-couple family households (2.9%) and 2 of the single-parent households (9.5%) are living below the poverty level. Within the married-couple family households, those with 3 or 4 children have the highest poverty rate, with 3 households (20.0%) falling below the poverty line. Among the single-parent households, those with 1 or 2 children have the highest poverty rate, with 2 household (20.0%) living below poverty.
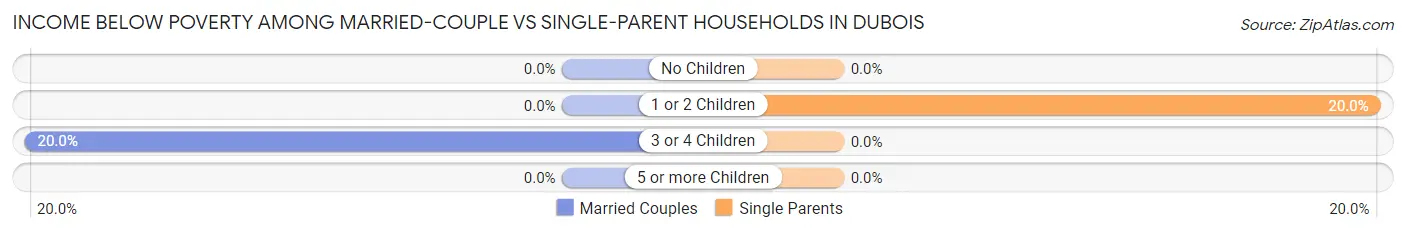
| Children | Married-Couple Families | Single-Parent Households |
| No Children | 0 (0.0%) | 0 (0.0%) |
| 1 or 2 Children | 0 (0.0%) | 2 (20.0%) |
| 3 or 4 Children | 3 (20.0%) | 0 (0.0%) |
| 5 or more Children | 0 (0.0%) | 0 (0.0%) |
| Total | 3 (2.9%) | 2 (9.5%) |
Race in Dubois
The most populous races in Dubois are White / Caucasian (366 | 69.1%), Hispanic or Latino (260 | 49.1%), and Some other Race (94 | 17.7%).
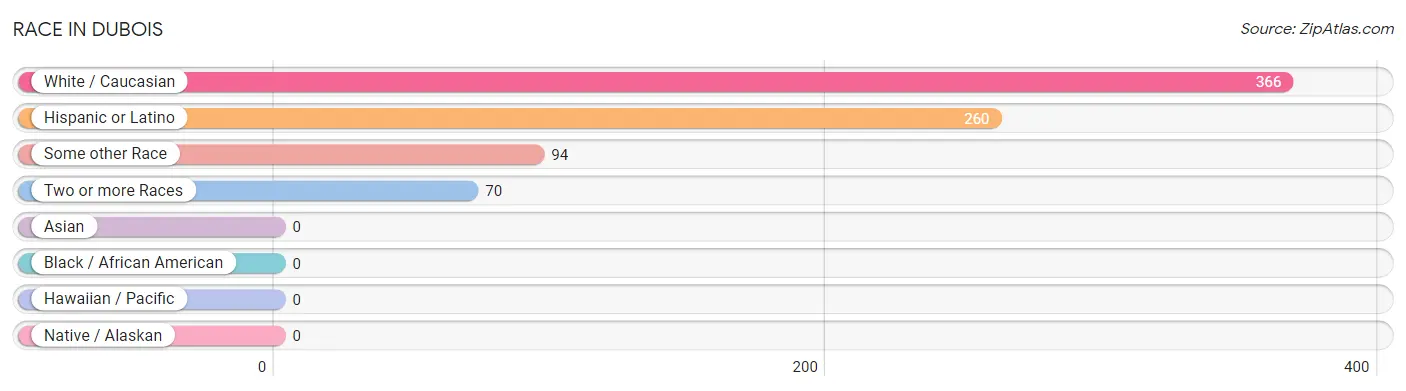
| Race | # Population | % Population |
| Asian | 0 | 0.0% |
| Black / African American | 0 | 0.0% |
| Hawaiian / Pacific | 0 | 0.0% |
| Hispanic or Latino | 260 | 49.1% |
| Native / Alaskan | 0 | 0.0% |
| White / Caucasian | 366 | 69.1% |
| Two or more Races | 70 | 13.2% |
| Some other Race | 94 | 17.7% |
| Total | 530 | 100.0% |
Ancestry in Dubois
The most populous ancestries reported in Dubois are Mexican (248 | 46.8%), English (83 | 15.7%), American (79 | 14.9%), Canadian (55 | 10.4%), and German (25 | 4.7%), together accounting for 92.5% of all Dubois residents.
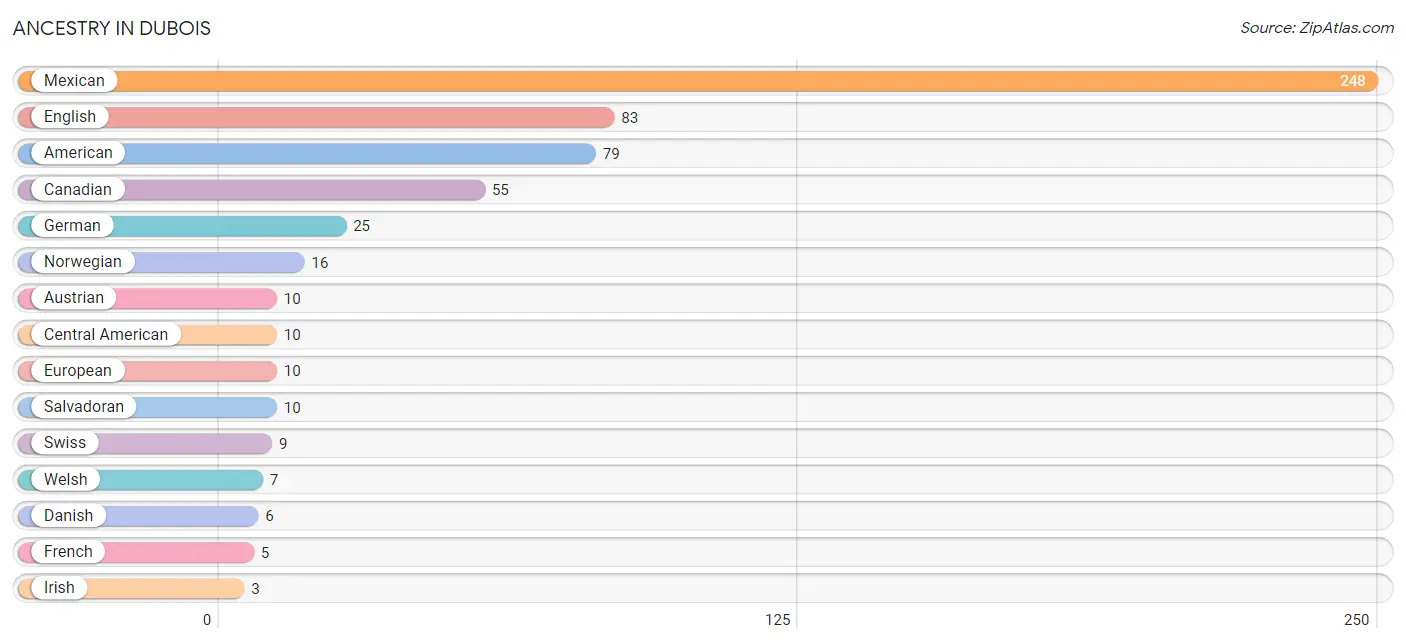
| Ancestry | # Population | % Population |
| American | 79 | 14.9% |
| Austrian | 10 | 1.9% |
| Canadian | 55 | 10.4% |
| Central American | 10 | 1.9% |
| Danish | 6 | 1.1% |
| English | 83 | 15.7% |
| European | 10 | 1.9% |
| French | 5 | 0.9% |
| German | 25 | 4.7% |
| Irish | 3 | 0.6% |
| Italian | 1 | 0.2% |
| Mexican | 248 | 46.8% |
| Norwegian | 16 | 3.0% |
| Salvadoran | 10 | 1.9% |
| Scottish | 1 | 0.2% |
| Spaniard | 2 | 0.4% |
| Swiss | 9 | 1.7% |
| Welsh | 7 | 1.3% | View All 18 Rows |
Immigrants in Dubois
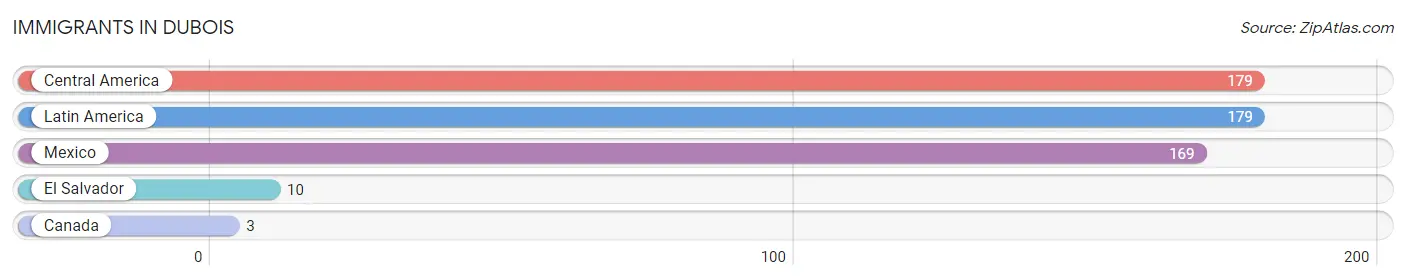
The most numerous immigrant groups reported in Dubois came from Central America (179 | 33.8%), Latin America (179 | 33.8%), Mexico (169 | 31.9%), El Salvador (10 | 1.9%), and Canada (3 | 0.6%), together accounting for 101.9% of all Dubois residents.
| Immigration Origin | # Population | % Population |
| Canada | 3 | 0.6% |
| Central America | 179 | 33.8% |
| El Salvador | 10 | 1.9% |
| Latin America | 179 | 33.8% |
| Mexico | 169 | 31.9% | View All 5 Rows |
Sex and Age in Dubois
Sex and Age in Dubois
The most populous age groups in Dubois are Under 5 Years (36 | 16.1%) for men and 50 to 54 Years (79 | 25.8%) for women.
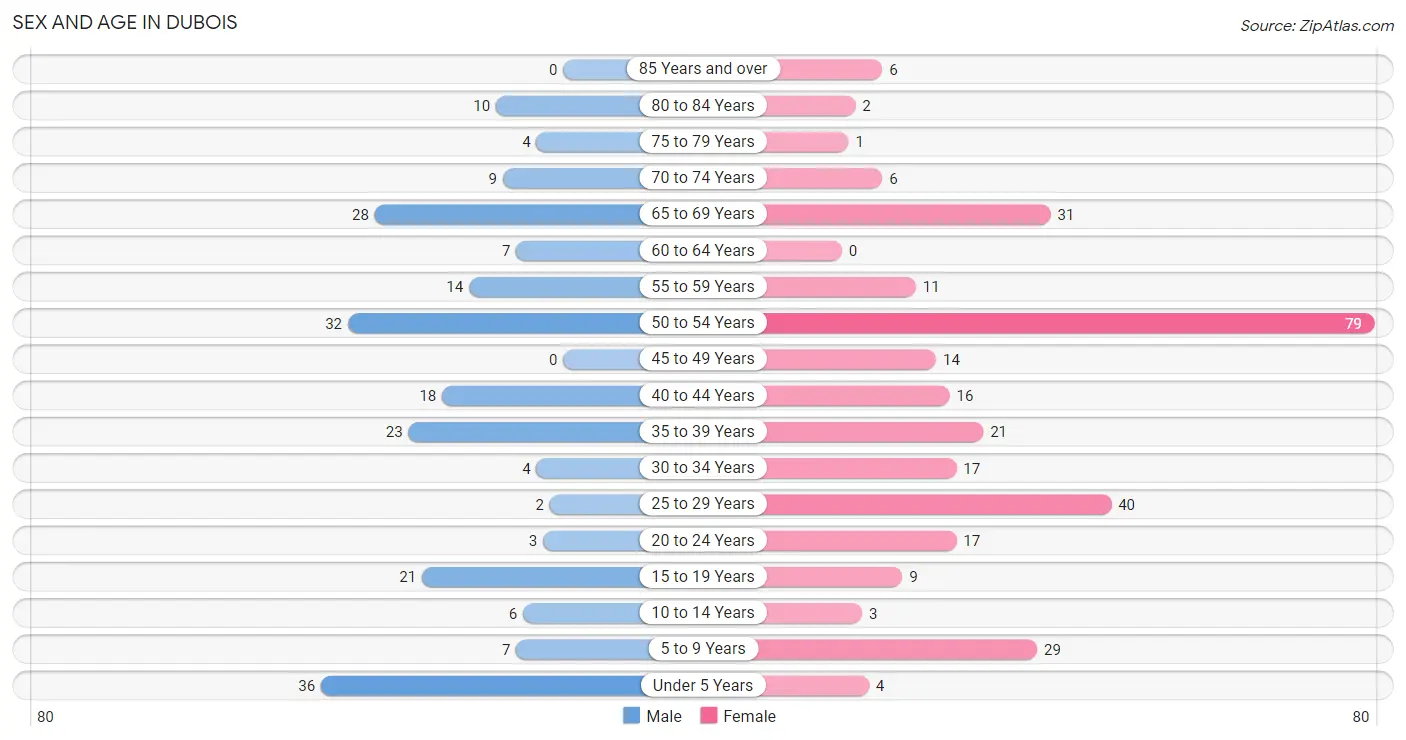
| Age Bracket | Male | Female |
| Under 5 Years | 36 (16.1%) | 4 (1.3%) |
| 5 to 9 Years | 7 (3.1%) | 29 (9.5%) |
| 10 to 14 Years | 6 (2.7%) | 3 (1.0%) |
| 15 to 19 Years | 21 (9.4%) | 9 (2.9%) |
| 20 to 24 Years | 3 (1.3%) | 17 (5.6%) |
| 25 to 29 Years | 2 (0.9%) | 40 (13.1%) |
| 30 to 34 Years | 4 (1.8%) | 17 (5.6%) |
| 35 to 39 Years | 23 (10.3%) | 21 (6.9%) |
| 40 to 44 Years | 18 (8.0%) | 16 (5.2%) |
| 45 to 49 Years | 0 (0.0%) | 14 (4.6%) |
| 50 to 54 Years | 32 (14.3%) | 79 (25.8%) |
| 55 to 59 Years | 14 (6.2%) | 11 (3.6%) |
| 60 to 64 Years | 7 (3.1%) | 0 (0.0%) |
| 65 to 69 Years | 28 (12.5%) | 31 (10.1%) |
| 70 to 74 Years | 9 (4.0%) | 6 (2.0%) |
| 75 to 79 Years | 4 (1.8%) | 1 (0.3%) |
| 80 to 84 Years | 10 (4.5%) | 2 (0.6%) |
| 85 Years and over | 0 (0.0%) | 6 (2.0%) |
| Total | 224 (100.0%) | 306 (100.0%) |
Families and Households in Dubois
Median Family Size in Dubois
The median family size in Dubois is 3.46 persons per family, with single female/mother families (3 | 2.4%) accounting for the largest median family size of 6.67 persons per family. On the other hand, married-couple families (102 | 82.9%) represent the smallest median family size with 3.19 persons per family.
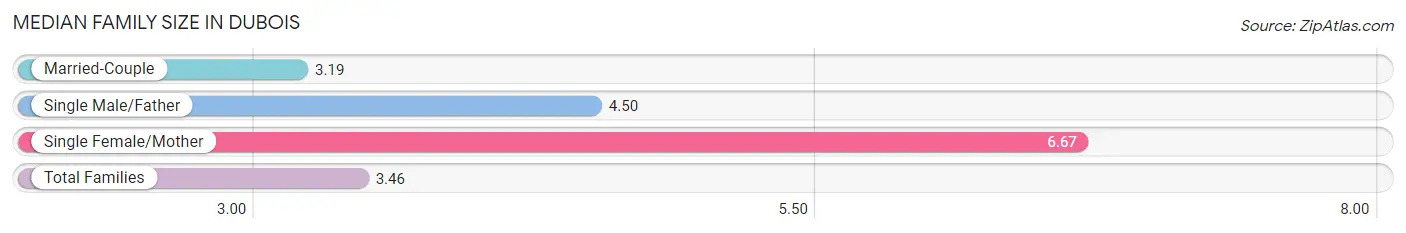
| Family Type | # Families | Family Size |
| Married-Couple | 102 (82.9%) | 3.19 |
| Single Male/Father | 18 (14.6%) | 4.50 |
| Single Female/Mother | 3 (2.4%) | 6.67 |
| Total Families | 123 (100.0%) | 3.46 |
Median Household Size in Dubois
The median household size in Dubois is 2.54 persons per household, with single female/mother households (3 | 1.5%) accounting for the largest median household size of 6.67 persons per household. non-family households (80 | 39.4%) represent the smallest median household size with 1.01 persons per household.
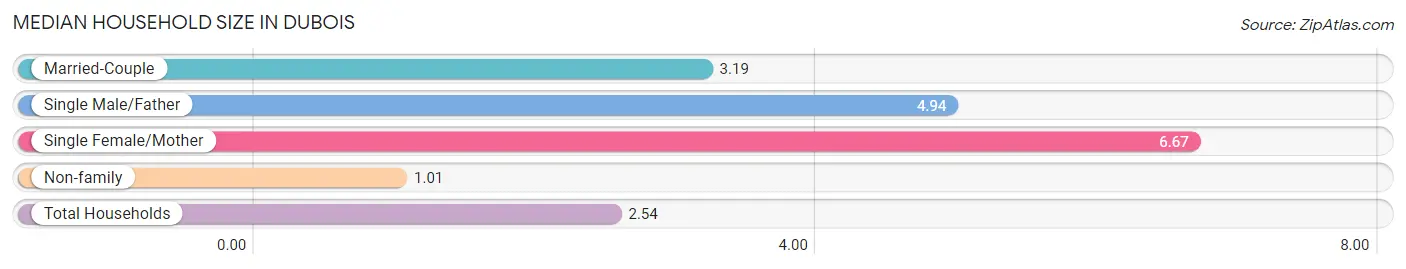
| Household Type | # Households | Household Size |
| Married-Couple | 102 (50.2%) | 3.19 |
| Single Male/Father | 18 (8.9%) | 4.94 |
| Single Female/Mother | 3 (1.5%) | 6.67 |
| Non-family | 80 (39.4%) | 1.01 |
| Total Households | 203 (100.0%) | 2.54 |
Household Size by Marriage Status in Dubois
Out of a total of 203 households in Dubois, 123 (60.6%) are family households, while 80 (39.4%) are nonfamily households. The most numerous type of family households are 3-person households, comprising 46, and the most common type of nonfamily households are 1-person households, comprising 78.
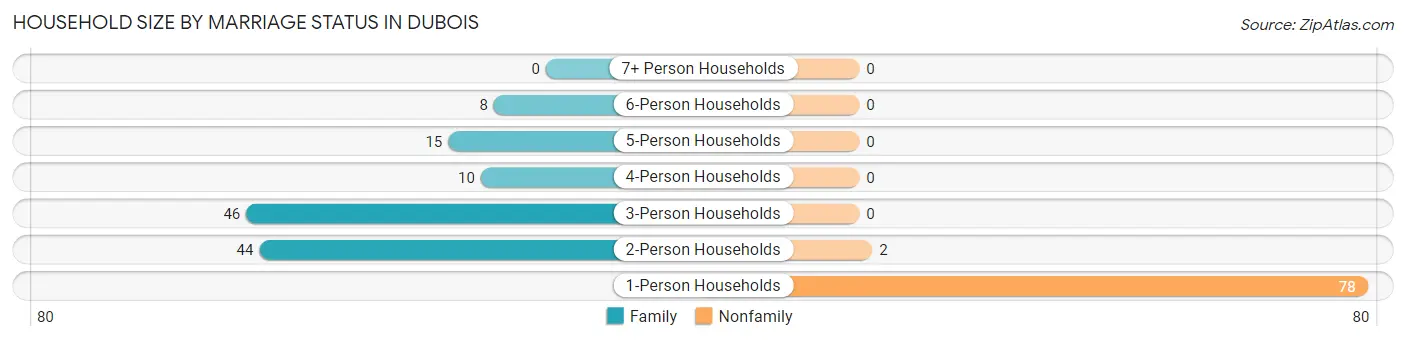
| Household Size | Family Households | Nonfamily Households |
| 1-Person Households | - | 78 (38.4%) |
| 2-Person Households | 44 (21.7%) | 2 (1.0%) |
| 3-Person Households | 46 (22.7%) | 0 (0.0%) |
| 4-Person Households | 10 (4.9%) | 0 (0.0%) |
| 5-Person Households | 15 (7.4%) | 0 (0.0%) |
| 6-Person Households | 8 (3.9%) | 0 (0.0%) |
| 7+ Person Households | 0 (0.0%) | 0 (0.0%) |
| Total | 123 (60.6%) | 80 (39.4%) |
Female Fertility in Dubois
Fertility by Age in Dubois
Average fertility rate in Dubois is 89.0 births per 1,000 women. Women in the age bracket of 35 to 50 years have the highest fertility rate with 115.0 births per 1,000 women. Women in the age bracket of 20 to 34 years acount for 50.0% of all women with births.
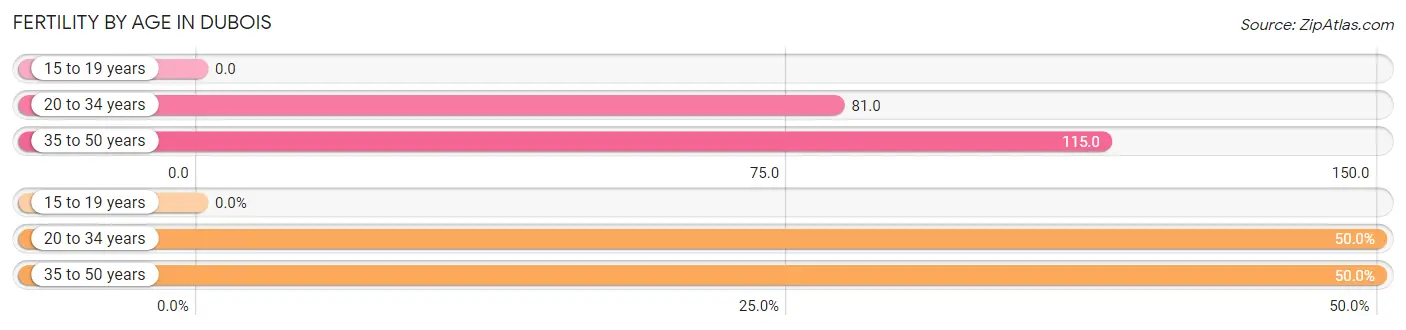
| Age Bracket | Women with Births | Births / 1,000 Women |
| 15 to 19 years | 0 (0.0%) | 0.0 |
| 20 to 34 years | 6 (50.0%) | 81.0 |
| 35 to 50 years | 6 (50.0%) | 115.0 |
| Total | 12 (100.0%) | 89.0 |
Fertility by Age by Marriage Status in Dubois
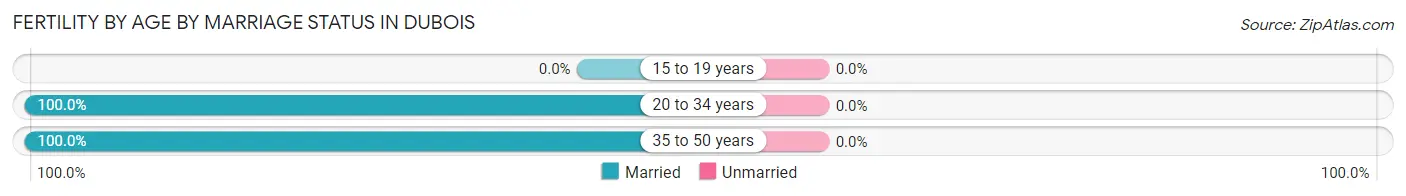
| Age Bracket | Married | Unmarried |
| 15 to 19 years | 0 (0.0%) | 0 (0.0%) |
| 20 to 34 years | 6 (100.0%) | 0 (0.0%) |
| 35 to 50 years | 6 (100.0%) | 0 (0.0%) |
| Total | 12 (100.0%) | 0 (0.0%) |
Fertility by Education in Dubois
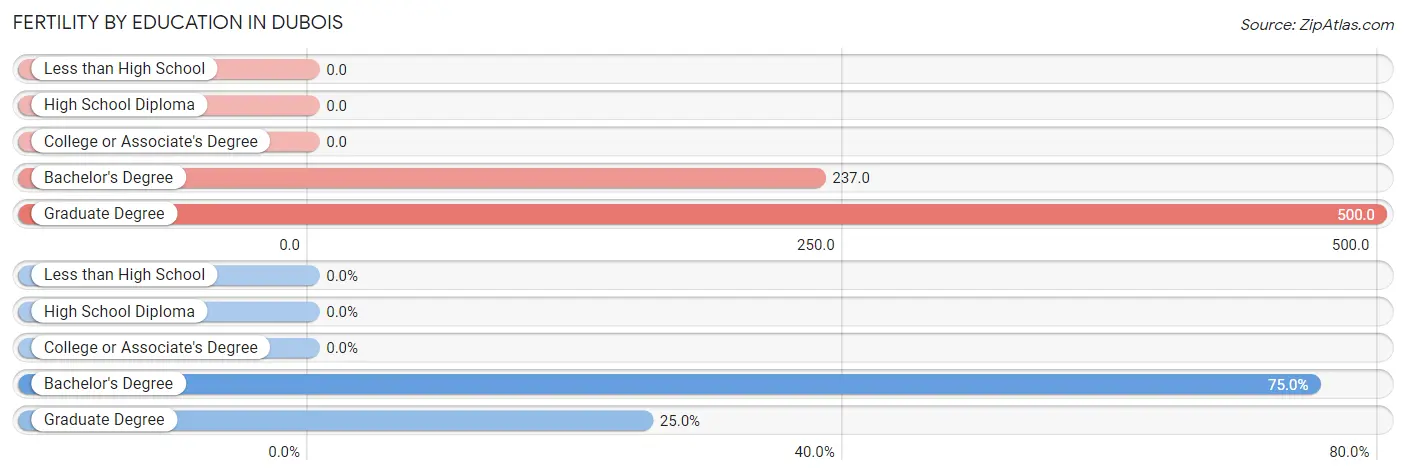
| Educational Attainment | Women with Births | Births / 1,000 Women |
| Less than High School | 0 (0.0%) | 0.0 |
| High School Diploma | 0 (0.0%) | 0.0 |
| College or Associate's Degree | 0 (0.0%) | 0.0 |
| Bachelor's Degree | 9 (75.0%) | 237.0 |
| Graduate Degree | 3 (25.0%) | 500.0 |
| Total | 12 (100.0%) | 89.0 |
Fertility by Education by Marriage Status in Dubois
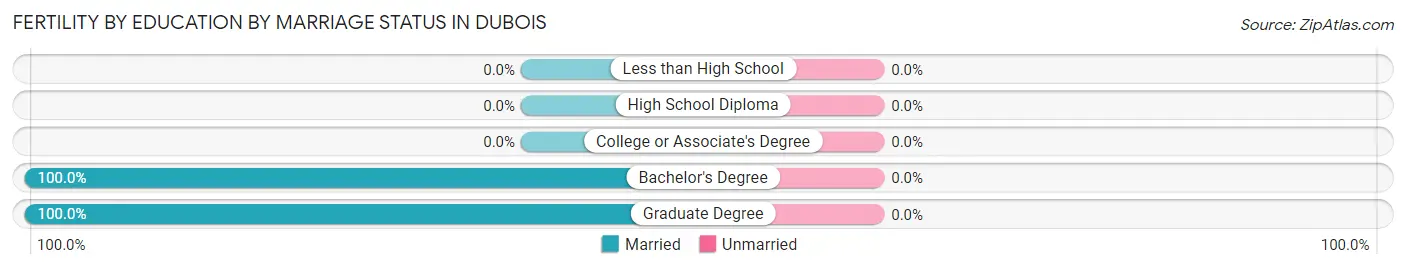
| Educational Attainment | Married | Unmarried |
| Less than High School | 0 (0.0%) | 0 (0.0%) |
| High School Diploma | 0 (0.0%) | 0 (0.0%) |
| College or Associate's Degree | 0 (0.0%) | 0 (0.0%) |
| Bachelor's Degree | 9 (100.0%) | 0 (0.0%) |
| Graduate Degree | 3 (100.0%) | 0 (0.0%) |
| Total | 12 (100.0%) | 0 (0.0%) |
Employment Characteristics in Dubois
Employment by Class of Employer in Dubois
Among the 284 employed individuals in Dubois, private company employees (133 | 46.8%), local government employees (54 | 19.0%), and not-for-profit organizations (47 | 16.6%) make up the most common classes of employment.
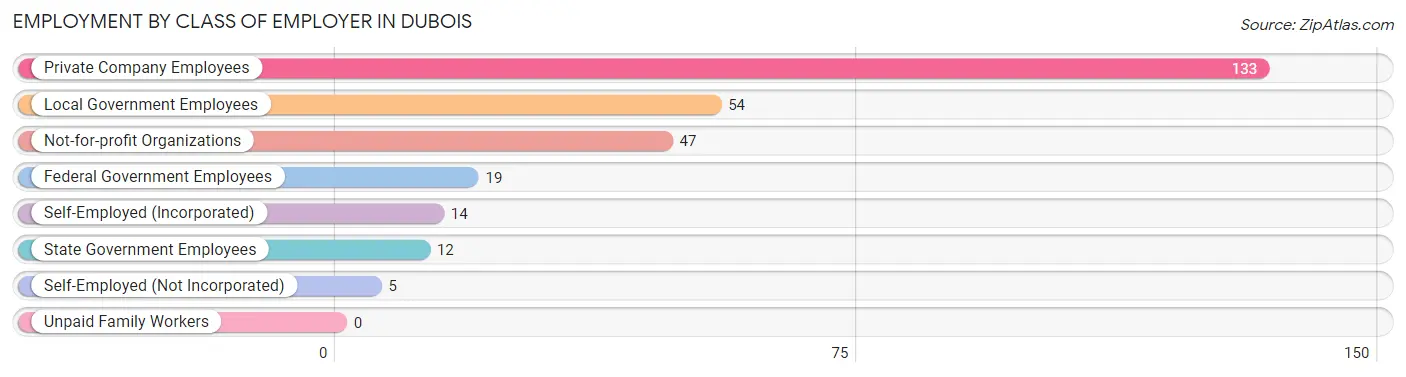
| Employer Class | # Employees | % Employees |
| Private Company Employees | 133 | 46.8% |
| Self-Employed (Incorporated) | 14 | 4.9% |
| Self-Employed (Not Incorporated) | 5 | 1.8% |
| Not-for-profit Organizations | 47 | 16.6% |
| Local Government Employees | 54 | 19.0% |
| State Government Employees | 12 | 4.2% |
| Federal Government Employees | 19 | 6.7% |
| Unpaid Family Workers | 0 | 0.0% |
| Total | 284 | 100.0% |
Employment Status by Age in Dubois
According to the labor force statistics for Dubois, out of the total population over 16 years of age (441), 65.8% or 290 individuals are in the labor force, with 1.0% or 3 of them unemployed. The age group with the highest labor force participation rate is 20 to 24 years, with 100.0% or 20 individuals in the labor force. Within the labor force, the 45 to 54 years age range has the highest percentage of unemployed individuals, with 4.4% or 3 of them being unemployed.
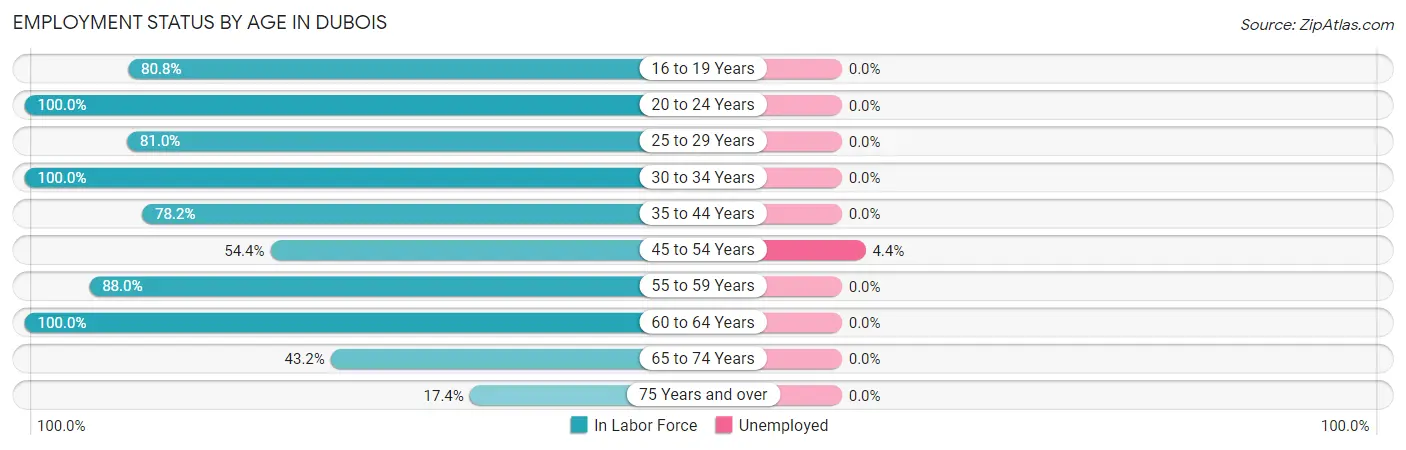
| Age Bracket | In Labor Force | Unemployed |
| 16 to 19 Years | 21 (80.8%) | 0 (0.0%) |
| 20 to 24 Years | 20 (100.0%) | 0 (0.0%) |
| 25 to 29 Years | 34 (81.0%) | 0 (0.0%) |
| 30 to 34 Years | 21 (100.0%) | 0 (0.0%) |
| 35 to 44 Years | 61 (78.2%) | 0 (0.0%) |
| 45 to 54 Years | 68 (54.4%) | 3 (4.4%) |
| 55 to 59 Years | 22 (88.0%) | 0 (0.0%) |
| 60 to 64 Years | 7 (100.0%) | 0 (0.0%) |
| 65 to 74 Years | 32 (43.2%) | 0 (0.0%) |
| 75 Years and over | 4 (17.4%) | 0 (0.0%) |
| Total | 290 (65.8%) | 3 (1.0%) |
Employment Status by Educational Attainment in Dubois
According to labor force statistics for Dubois, 71.5% of individuals (213) out of the total population between 25 and 64 years of age (298) are in the labor force, with 1.4% or 3 of them being unemployed. The group with the highest labor force participation rate are those with the educational attainment of bachelor's degree or higher, with 98.5% or 67 individuals in the labor force. Within the labor force, individuals with less than high school education have the highest percentage of unemployment, with 3.4% or 3 of them being unemployed.
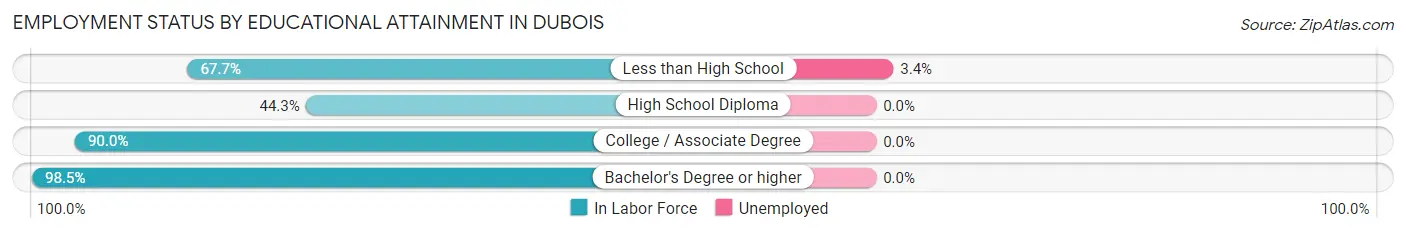
| Educational Attainment | In Labor Force | Unemployed |
| Less than High School | 88 (67.7%) | 4 (3.4%) |
| High School Diploma | 31 (44.3%) | 0 (0.0%) |
| College / Associate Degree | 27 (90.0%) | 0 (0.0%) |
| Bachelor's Degree or higher | 67 (98.5%) | 0 (0.0%) |
| Total | 213 (71.5%) | 4 (1.4%) |
Employment Occupations by Sex in Dubois
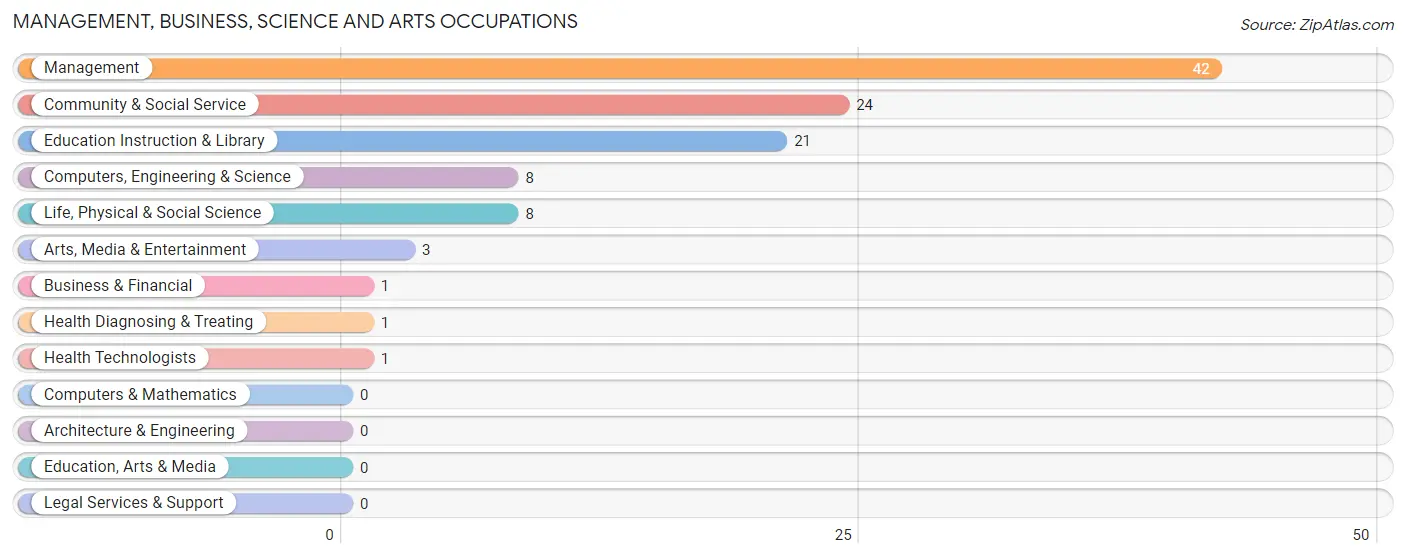
Management, Business, Science and Arts Occupations
The most common Management, Business, Science and Arts occupations in Dubois are Management (42 | 14.6%), Community & Social Service (24 | 8.4%), Education Instruction & Library (21 | 7.3%), Computers, Engineering & Science (8 | 2.8%), and Life, Physical & Social Science (8 | 2.8%).
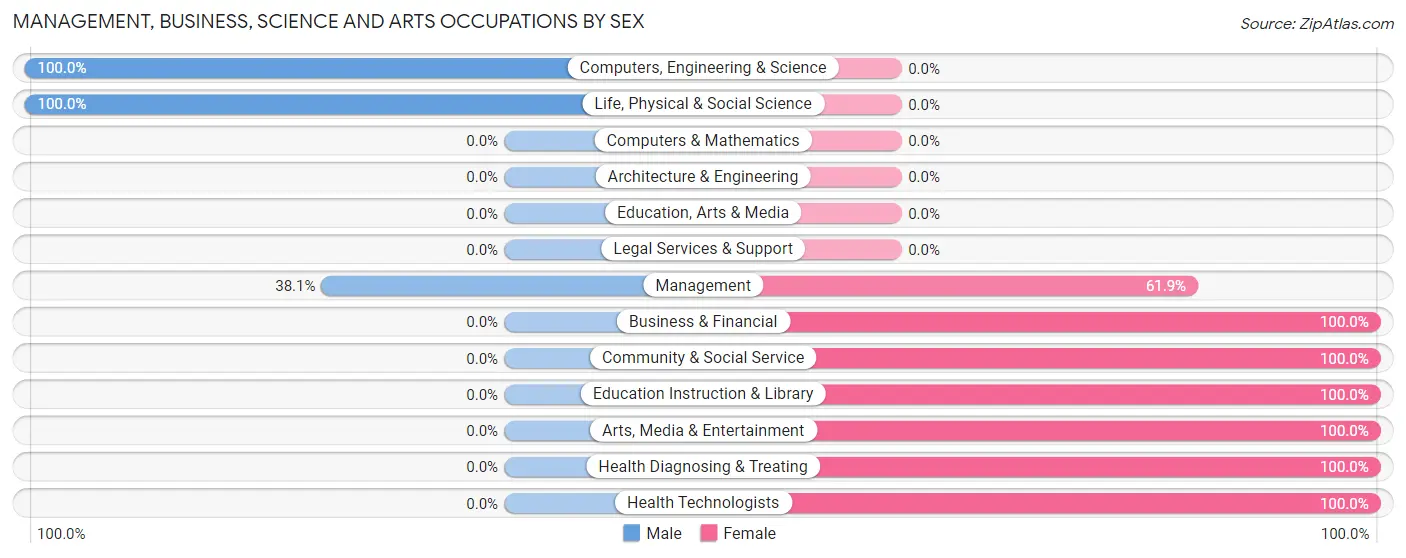
Management, Business, Science and Arts Occupations by Sex
Within the Management, Business, Science and Arts occupations in Dubois, the most male-oriented occupations are Computers, Engineering & Science (100.0%), Life, Physical & Social Science (100.0%), and Management (38.1%), while the most female-oriented occupations are Business & Financial (100.0%), Community & Social Service (100.0%), and Education Instruction & Library (100.0%).
| Occupation | Male | Female |
| Management | 16 (38.1%) | 26 (61.9%) |
| Business & Financial | 0 (0.0%) | 1 (100.0%) |
| Computers, Engineering & Science | 8 (100.0%) | 0 (0.0%) |
| Computers & Mathematics | 0 (0.0%) | 0 (0.0%) |
| Architecture & Engineering | 0 (0.0%) | 0 (0.0%) |
| Life, Physical & Social Science | 8 (100.0%) | 0 (0.0%) |
| Community & Social Service | 0 (0.0%) | 24 (100.0%) |
| Education, Arts & Media | 0 (0.0%) | 0 (0.0%) |
| Legal Services & Support | 0 (0.0%) | 0 (0.0%) |
| Education Instruction & Library | 0 (0.0%) | 21 (100.0%) |
| Arts, Media & Entertainment | 0 (0.0%) | 3 (100.0%) |
| Health Diagnosing & Treating | 0 (0.0%) | 1 (100.0%) |
| Health Technologists | 0 (0.0%) | 1 (100.0%) |
| Total (Category) | 24 (31.6%) | 52 (68.4%) |
| Total (Overall) | 122 (42.5%) | 165 (57.5%) |
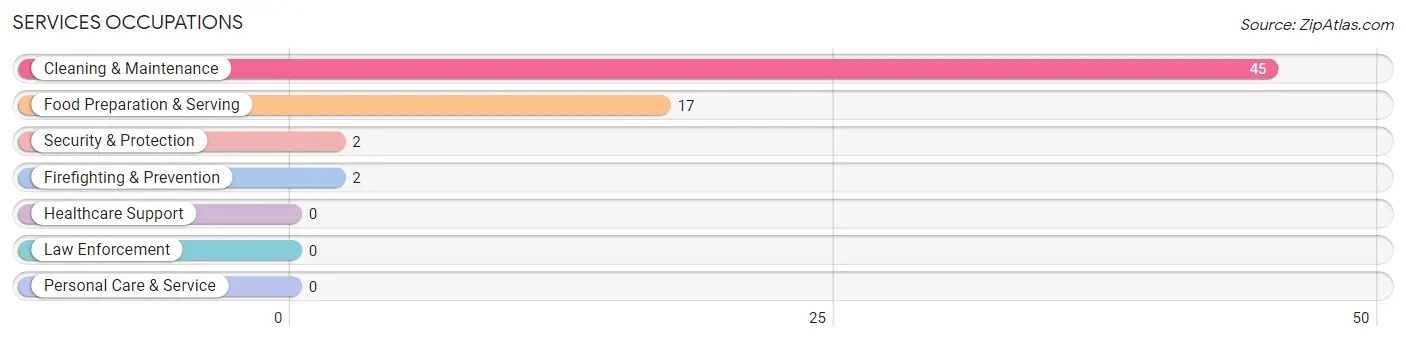
Services Occupations
The most common Services occupations in Dubois are Cleaning & Maintenance (45 | 15.7%), Food Preparation & Serving (17 | 5.9%), Security & Protection (2 | 0.7%), and Firefighting & Prevention (2 | 0.7%).
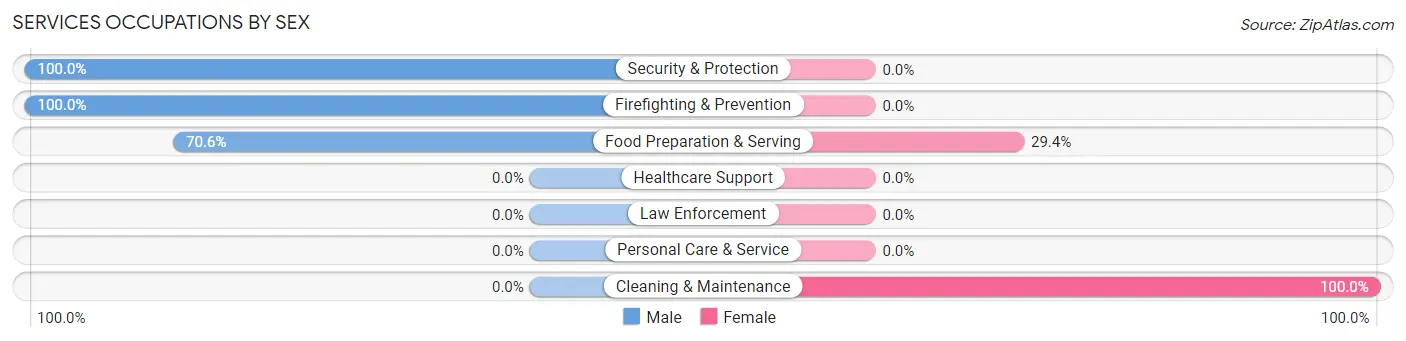
Services Occupations by Sex
Within the Services occupations in Dubois, the most male-oriented occupations are Security & Protection (100.0%), Firefighting & Prevention (100.0%), and Food Preparation & Serving (70.6%), while the most female-oriented occupations are Cleaning & Maintenance (100.0%), and Food Preparation & Serving (29.4%).
| Occupation | Male | Female |
| Healthcare Support | 0 (0.0%) | 0 (0.0%) |
| Security & Protection | 2 (100.0%) | 0 (0.0%) |
| Firefighting & Prevention | 2 (100.0%) | 0 (0.0%) |
| Law Enforcement | 0 (0.0%) | 0 (0.0%) |
| Food Preparation & Serving | 12 (70.6%) | 5 (29.4%) |
| Cleaning & Maintenance | 0 (0.0%) | 45 (100.0%) |
| Personal Care & Service | 0 (0.0%) | 0 (0.0%) |
| Total (Category) | 14 (21.9%) | 50 (78.1%) |
| Total (Overall) | 122 (42.5%) | 165 (57.5%) |
Sales and Office Occupations
The most common Sales and Office occupations in Dubois are Office & Administration (39 | 13.6%), and Sales & Related (8 | 2.8%).
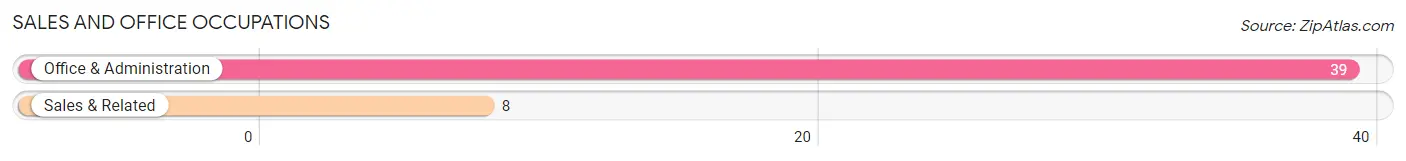
Sales and Office Occupations by Sex
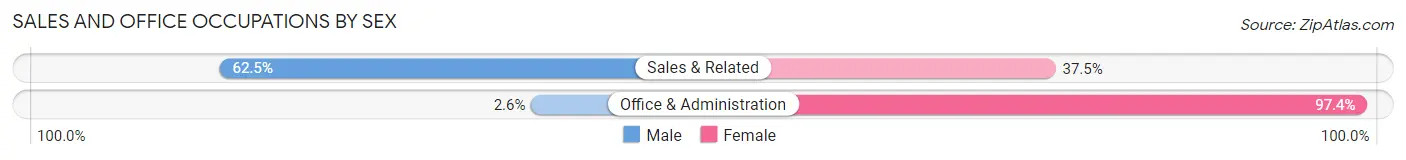
| Occupation | Male | Female |
| Sales & Related | 5 (62.5%) | 3 (37.5%) |
| Office & Administration | 1 (2.6%) | 38 (97.4%) |
| Total (Category) | 6 (12.8%) | 41 (87.2%) |
| Total (Overall) | 122 (42.5%) | 165 (57.5%) |
Natural Resources, Construction and Maintenance Occupations
The most common Natural Resources, Construction and Maintenance occupations in Dubois are Farming, Fishing & Forestry (63 | 22.0%), Installation, Maintenance & Repair (15 | 5.2%), and Construction & Extraction (5 | 1.7%).
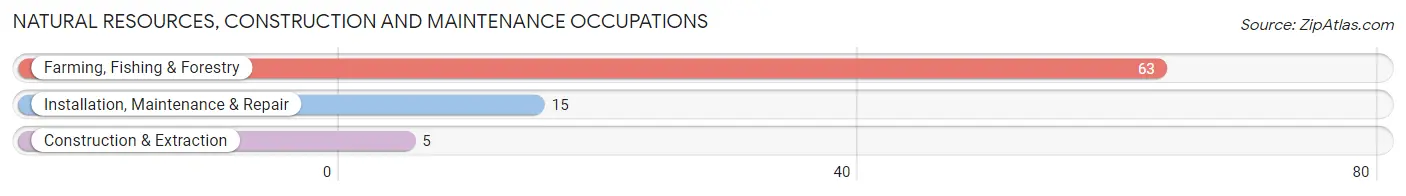
Natural Resources, Construction and Maintenance Occupations by Sex
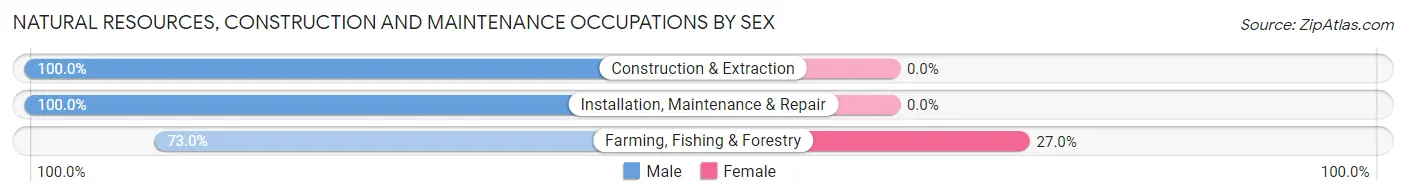
| Occupation | Male | Female |
| Farming, Fishing & Forestry | 46 (73.0%) | 17 (27.0%) |
| Construction & Extraction | 5 (100.0%) | 0 (0.0%) |
| Installation, Maintenance & Repair | 15 (100.0%) | 0 (0.0%) |
| Total (Category) | 66 (79.5%) | 17 (20.5%) |
| Total (Overall) | 122 (42.5%) | 165 (57.5%) |
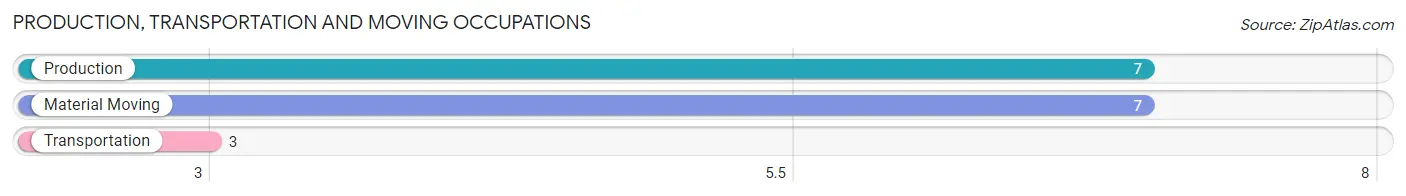
Production, Transportation and Moving Occupations
The most common Production, Transportation and Moving occupations in Dubois are Production (7 | 2.4%), Material Moving (7 | 2.4%), and Transportation (3 | 1.1%).
Production, Transportation and Moving Occupations by Sex
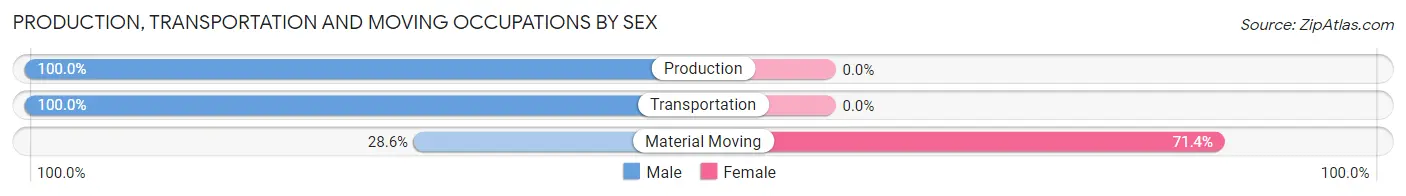
| Occupation | Male | Female |
| Production | 7 (100.0%) | 0 (0.0%) |
| Transportation | 3 (100.0%) | 0 (0.0%) |
| Material Moving | 2 (28.6%) | 5 (71.4%) |
| Total (Category) | 12 (70.6%) | 5 (29.4%) |
| Total (Overall) | 122 (42.5%) | 165 (57.5%) |
Employment Industries by Sex in Dubois
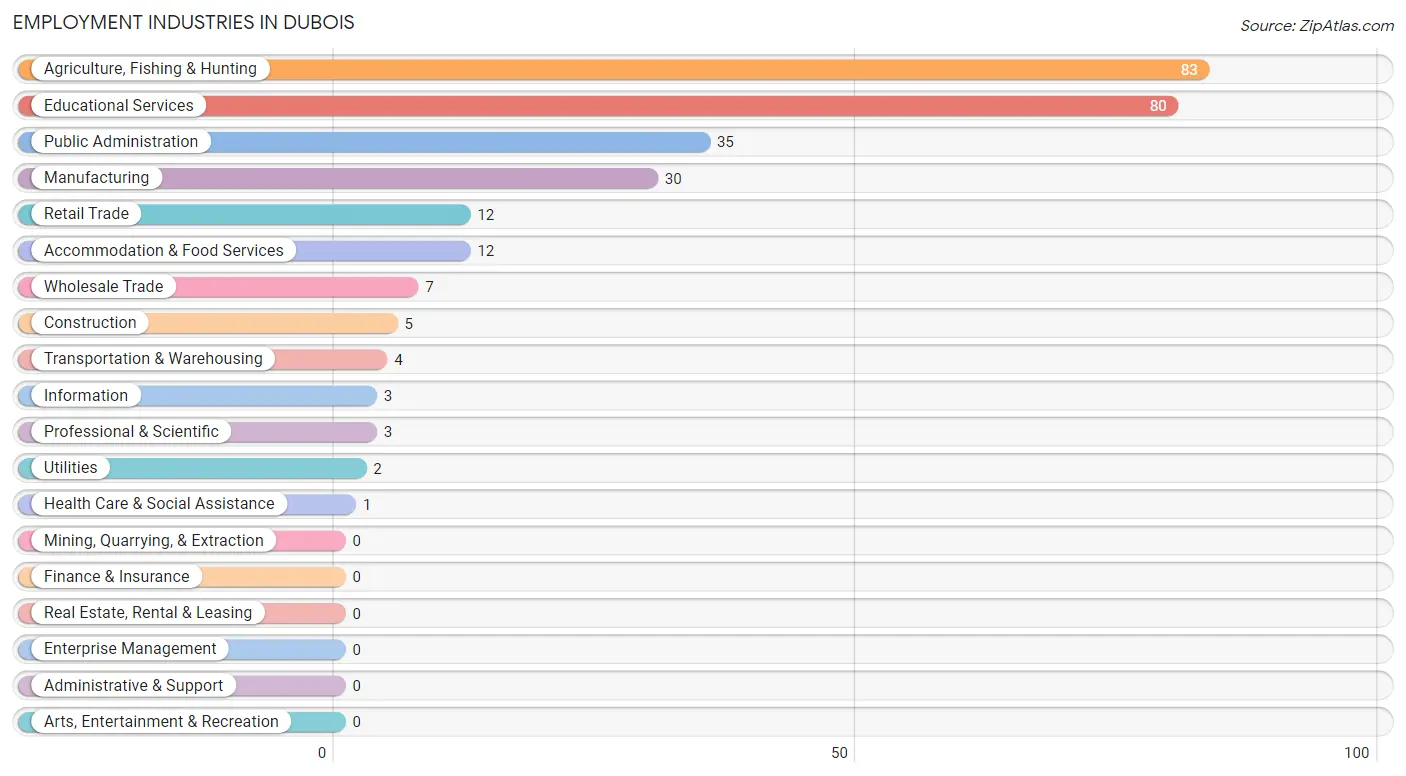
Employment Industries in Dubois
The major employment industries in Dubois include Agriculture, Fishing & Hunting (83 | 28.9%), Educational Services (80 | 27.9%), Public Administration (35 | 12.2%), Manufacturing (30 | 10.4%), and Retail Trade (12 | 4.2%).
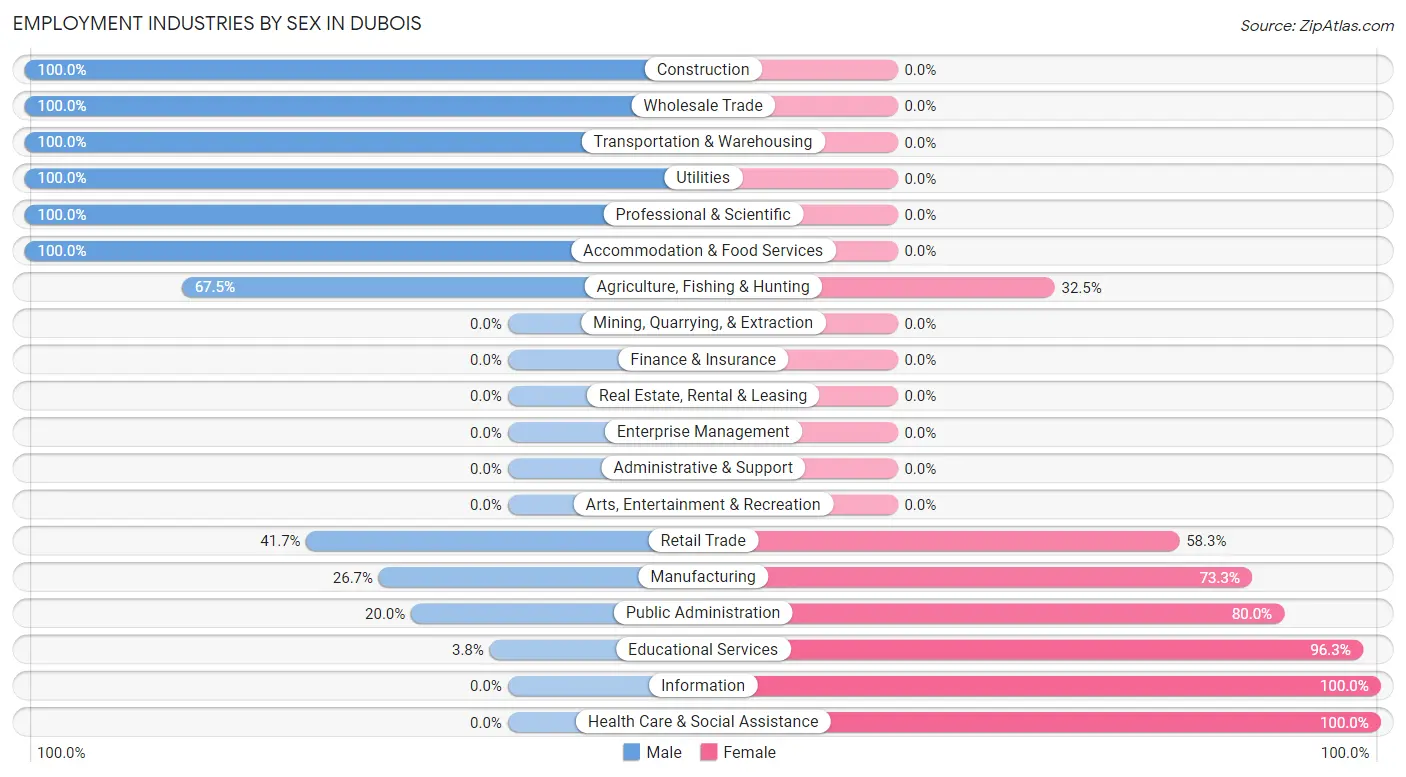
Employment Industries by Sex in Dubois
The Dubois industries that see more men than women are Construction (100.0%), Wholesale Trade (100.0%), and Transportation & Warehousing (100.0%), whereas the industries that tend to have a higher number of women are Information (100.0%), Health Care & Social Assistance (100.0%), and Educational Services (96.3%).
| Industry | Male | Female |
| Agriculture, Fishing & Hunting | 56 (67.5%) | 27 (32.5%) |
| Mining, Quarrying, & Extraction | 0 (0.0%) | 0 (0.0%) |
| Construction | 5 (100.0%) | 0 (0.0%) |
| Manufacturing | 8 (26.7%) | 22 (73.3%) |
| Wholesale Trade | 7 (100.0%) | 0 (0.0%) |
| Retail Trade | 5 (41.7%) | 7 (58.3%) |
| Transportation & Warehousing | 4 (100.0%) | 0 (0.0%) |
| Utilities | 2 (100.0%) | 0 (0.0%) |
| Information | 0 (0.0%) | 3 (100.0%) |
| Finance & Insurance | 0 (0.0%) | 0 (0.0%) |
| Real Estate, Rental & Leasing | 0 (0.0%) | 0 (0.0%) |
| Professional & Scientific | 3 (100.0%) | 0 (0.0%) |
| Enterprise Management | 0 (0.0%) | 0 (0.0%) |
| Administrative & Support | 0 (0.0%) | 0 (0.0%) |
| Educational Services | 3 (3.7%) | 77 (96.3%) |
| Health Care & Social Assistance | 0 (0.0%) | 1 (100.0%) |
| Arts, Entertainment & Recreation | 0 (0.0%) | 0 (0.0%) |
| Accommodation & Food Services | 12 (100.0%) | 0 (0.0%) |
| Public Administration | 7 (20.0%) | 28 (80.0%) |
| Total | 122 (42.5%) | 165 (57.5%) |
Education in Dubois
School Enrollment in Dubois
The most common levels of schooling among the 65 students in Dubois are elementary school (25 | 38.5%), high school (16 | 24.6%), and nursery / preschool (12 | 18.5%).
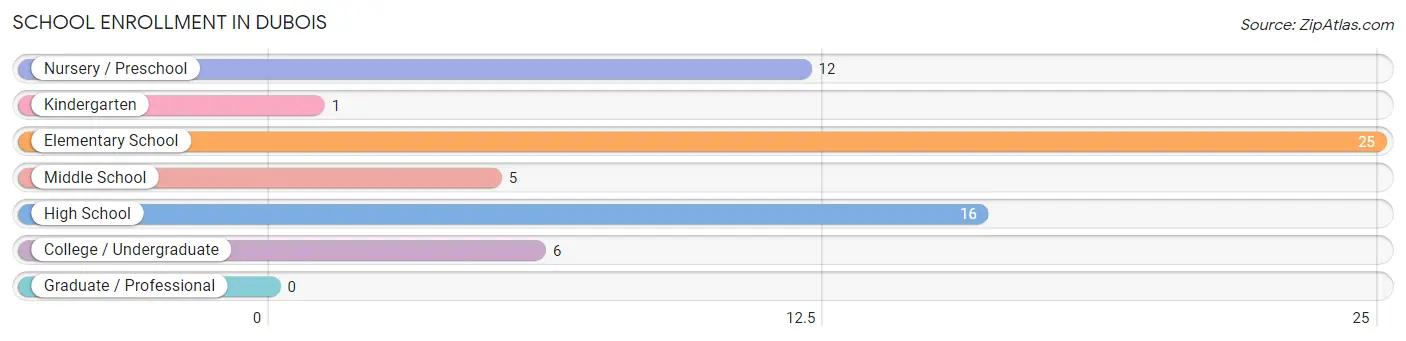
| School Level | # Students | % Students |
| Nursery / Preschool | 12 | 18.5% |
| Kindergarten | 1 | 1.5% |
| Elementary School | 25 | 38.5% |
| Middle School | 5 | 7.7% |
| High School | 16 | 24.6% |
| College / Undergraduate | 6 | 9.2% |
| Graduate / Professional | 0 | 0.0% |
| Total | 65 | 100.0% |
School Enrollment by Age by Funding Source in Dubois
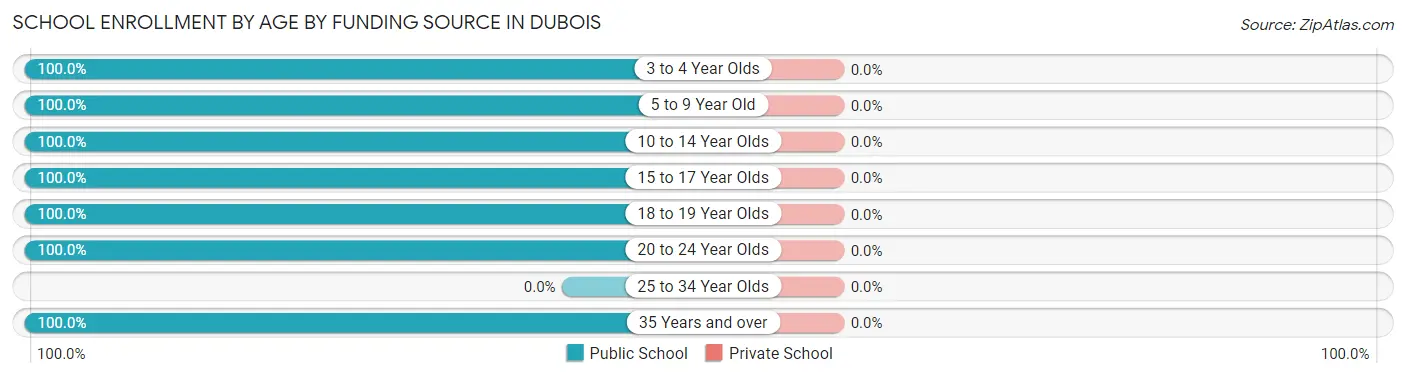
| Age Bracket | Public School | Private School |
| 3 to 4 Year Olds | 1 (100.0%) | 0 (0.0%) |
| 5 to 9 Year Old | 36 (100.0%) | 0 (0.0%) |
| 10 to 14 Year Olds | 9 (100.0%) | 0 (0.0%) |
| 15 to 17 Year Olds | 7 (100.0%) | 0 (0.0%) |
| 18 to 19 Year Olds | 4 (100.0%) | 0 (0.0%) |
| 20 to 24 Year Olds | 2 (100.0%) | 0 (0.0%) |
| 25 to 34 Year Olds | 0 (0.0%) | 0 (0.0%) |
| 35 Years and over | 6 (100.0%) | 0 (0.0%) |
| Total | 65 (100.0%) | 0 (0.0%) |
Educational Attainment by Field of Study in Dubois
Literature & languages (26 | 33.3%), business (13 | 16.7%), education (13 | 16.7%), physical & health sciences (6 | 7.7%), and liberal arts & history (6 | 7.7%) are the most common fields of study among 78 individuals in Dubois who have obtained a bachelor's degree or higher.
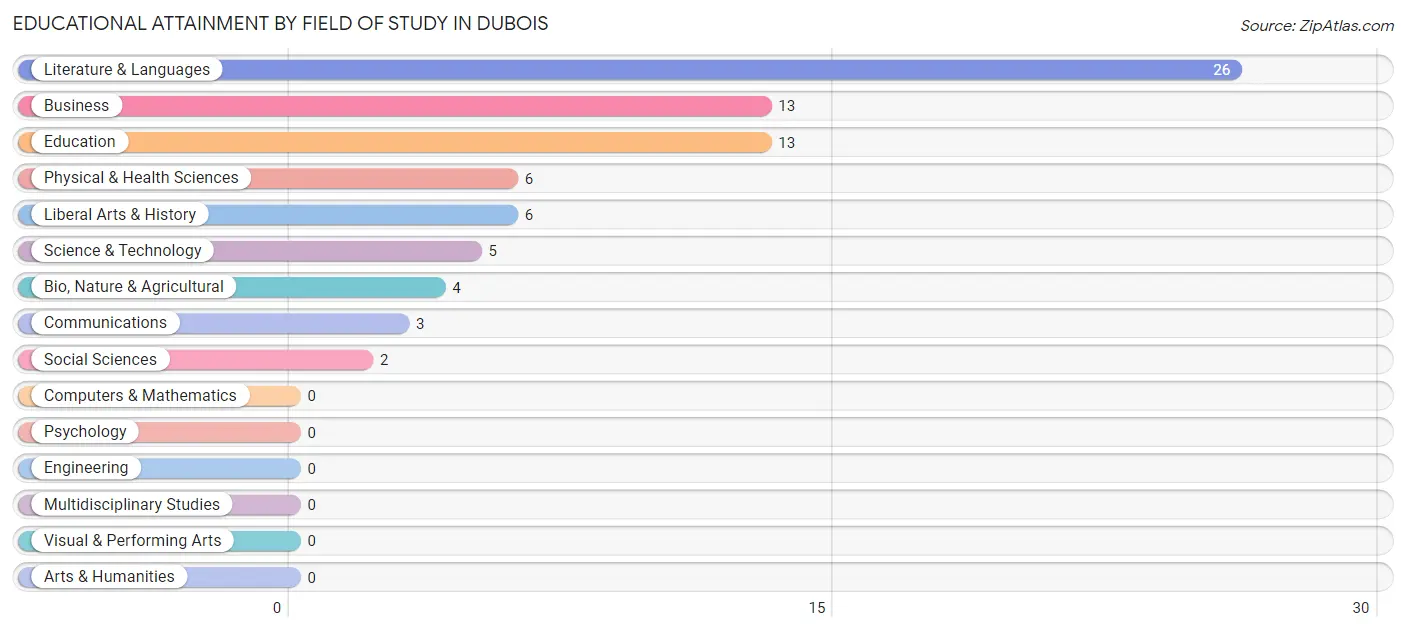
| Field of Study | # Graduates | % Graduates |
| Computers & Mathematics | 0 | 0.0% |
| Bio, Nature & Agricultural | 4 | 5.1% |
| Physical & Health Sciences | 6 | 7.7% |
| Psychology | 0 | 0.0% |
| Social Sciences | 2 | 2.6% |
| Engineering | 0 | 0.0% |
| Multidisciplinary Studies | 0 | 0.0% |
| Science & Technology | 5 | 6.4% |
| Business | 13 | 16.7% |
| Education | 13 | 16.7% |
| Literature & Languages | 26 | 33.3% |
| Liberal Arts & History | 6 | 7.7% |
| Visual & Performing Arts | 0 | 0.0% |
| Communications | 3 | 3.8% |
| Arts & Humanities | 0 | 0.0% |
| Total | 78 | 100.0% |
Transportation & Commute in Dubois
Vehicle Availability by Sex in Dubois
The most prevalent vehicle ownership categories in Dubois are males with 3 vehicles (48, accounting for 43.6%) and females with 3 vehicles (118, making up 29.6%).
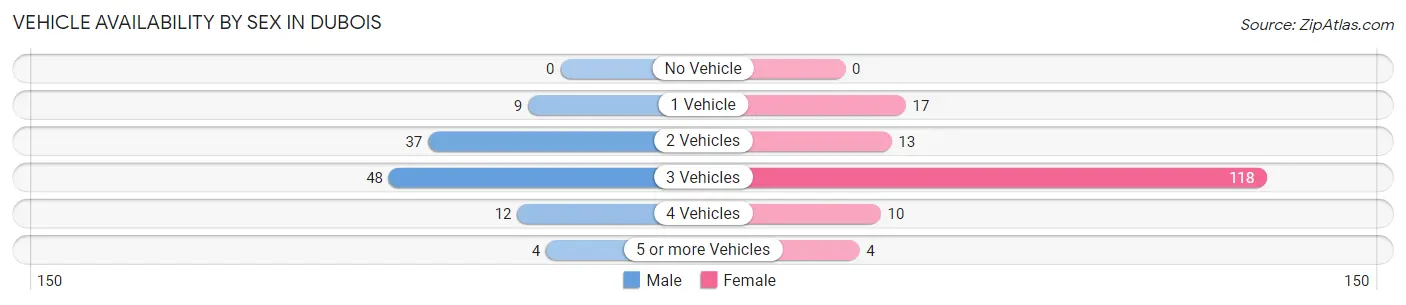
| Vehicles Available | Male | Female |
| No Vehicle | 0 (0.0%) | 0 (0.0%) |
| 1 Vehicle | 9 (8.2%) | 17 (10.5%) |
| 2 Vehicles | 37 (33.6%) | 13 (8.0%) |
| 3 Vehicles | 48 (43.6%) | 118 (72.8%) |
| 4 Vehicles | 12 (10.9%) | 10 (6.2%) |
| 5 or more Vehicles | 4 (3.6%) | 4 (2.5%) |
| Total | 110 (100.0%) | 162 (100.0%) |
Commute Time in Dubois
The most frequently occuring commute durations in Dubois are 20 to 24 minutes (64 commuters, 24.3%), 60 to 89 minutes (33 commuters, 12.6%), and less than 5 minutes (32 commuters, 12.2%).
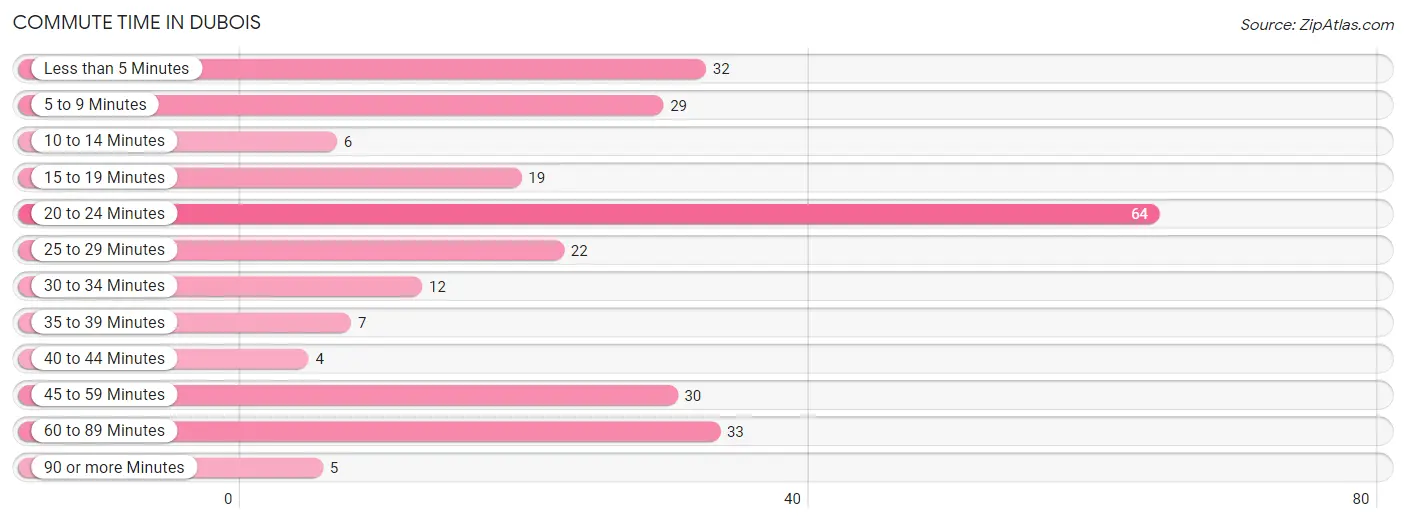
| Commute Time | # Commuters | % Commuters |
| Less than 5 Minutes | 32 | 12.2% |
| 5 to 9 Minutes | 29 | 11.0% |
| 10 to 14 Minutes | 6 | 2.3% |
| 15 to 19 Minutes | 19 | 7.2% |
| 20 to 24 Minutes | 64 | 24.3% |
| 25 to 29 Minutes | 22 | 8.4% |
| 30 to 34 Minutes | 12 | 4.6% |
| 35 to 39 Minutes | 7 | 2.7% |
| 40 to 44 Minutes | 4 | 1.5% |
| 45 to 59 Minutes | 30 | 11.4% |
| 60 to 89 Minutes | 33 | 12.6% |
| 90 or more Minutes | 5 | 1.9% |
Commute Time by Sex in Dubois
The most common commute times in Dubois are 15 to 19 minutes (19 commuters, 18.3%) for males and 20 to 24 minutes (55 commuters, 34.6%) for females.
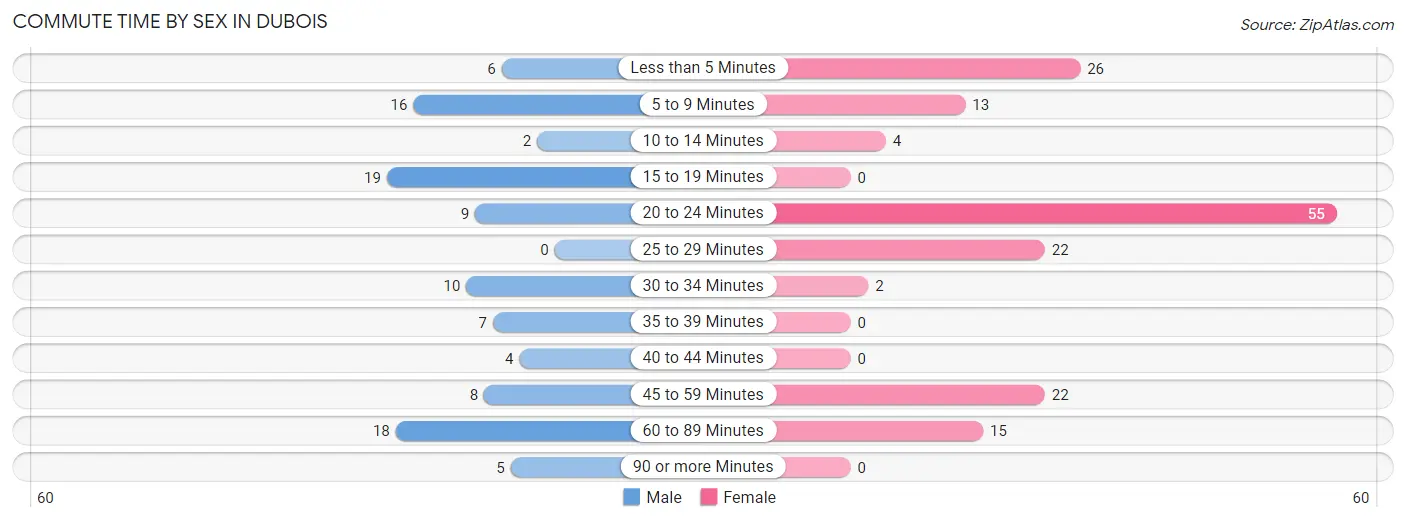
| Commute Time | Male | Female |
| Less than 5 Minutes | 6 (5.8%) | 26 (16.4%) |
| 5 to 9 Minutes | 16 (15.4%) | 13 (8.2%) |
| 10 to 14 Minutes | 2 (1.9%) | 4 (2.5%) |
| 15 to 19 Minutes | 19 (18.3%) | 0 (0.0%) |
| 20 to 24 Minutes | 9 (8.6%) | 55 (34.6%) |
| 25 to 29 Minutes | 0 (0.0%) | 22 (13.8%) |
| 30 to 34 Minutes | 10 (9.6%) | 2 (1.3%) |
| 35 to 39 Minutes | 7 (6.7%) | 0 (0.0%) |
| 40 to 44 Minutes | 4 (3.8%) | 0 (0.0%) |
| 45 to 59 Minutes | 8 (7.7%) | 22 (13.8%) |
| 60 to 89 Minutes | 18 (17.3%) | 15 (9.4%) |
| 90 or more Minutes | 5 (4.8%) | 0 (0.0%) |
Time of Departure to Work by Sex in Dubois
The most frequent times of departure to work in Dubois are 5:30 AM to 5:59 AM (22, 21.1%) for males and 5:30 AM to 5:59 AM (61, 38.4%) for females.
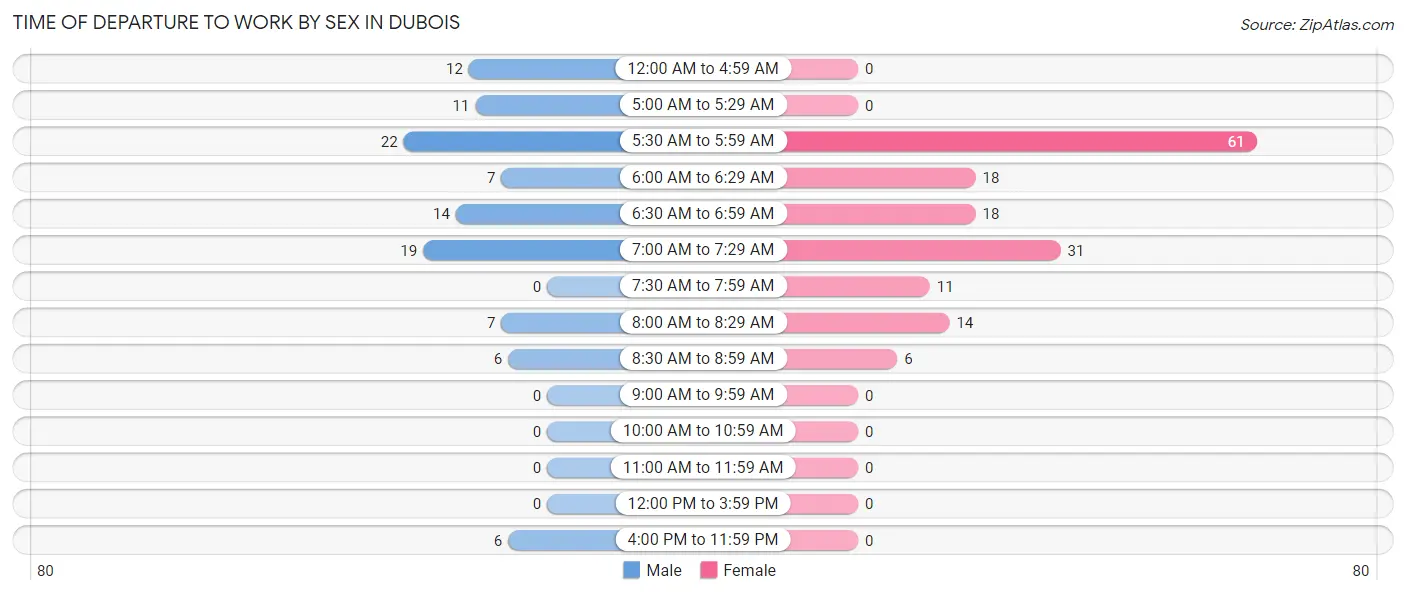
| Time of Departure | Male | Female |
| 12:00 AM to 4:59 AM | 12 (11.5%) | 0 (0.0%) |
| 5:00 AM to 5:29 AM | 11 (10.6%) | 0 (0.0%) |
| 5:30 AM to 5:59 AM | 22 (21.1%) | 61 (38.4%) |
| 6:00 AM to 6:29 AM | 7 (6.7%) | 18 (11.3%) |
| 6:30 AM to 6:59 AM | 14 (13.5%) | 18 (11.3%) |
| 7:00 AM to 7:29 AM | 19 (18.3%) | 31 (19.5%) |
| 7:30 AM to 7:59 AM | 0 (0.0%) | 11 (6.9%) |
| 8:00 AM to 8:29 AM | 7 (6.7%) | 14 (8.8%) |
| 8:30 AM to 8:59 AM | 6 (5.8%) | 6 (3.8%) |
| 9:00 AM to 9:59 AM | 0 (0.0%) | 0 (0.0%) |
| 10:00 AM to 10:59 AM | 0 (0.0%) | 0 (0.0%) |
| 11:00 AM to 11:59 AM | 0 (0.0%) | 0 (0.0%) |
| 12:00 PM to 3:59 PM | 0 (0.0%) | 0 (0.0%) |
| 4:00 PM to 11:59 PM | 6 (5.8%) | 0 (0.0%) |
| Total | 104 (100.0%) | 159 (100.0%) |
Housing Occupancy in Dubois
Occupancy by Ownership in Dubois
Of the total 203 dwellings in Dubois, owner-occupied units account for 148 (72.9%), while renter-occupied units make up 55 (27.1%).
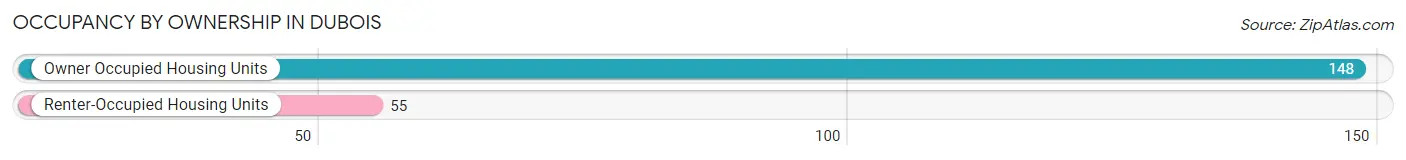
| Occupancy | # Housing Units | % Housing Units |
| Owner Occupied Housing Units | 148 | 72.9% |
| Renter-Occupied Housing Units | 55 | 27.1% |
| Total Occupied Housing Units | 203 | 100.0% |
Occupancy by Household Size in Dubois
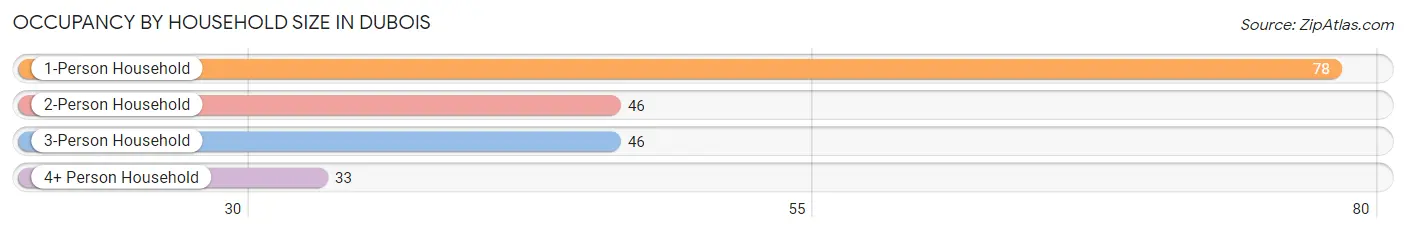
| Household Size | # Housing Units | % Housing Units |
| 1-Person Household | 78 | 38.4% |
| 2-Person Household | 46 | 22.7% |
| 3-Person Household | 46 | 22.7% |
| 4+ Person Household | 33 | 16.3% |
| Total Housing Units | 203 | 100.0% |
Occupancy by Ownership by Household Size in Dubois
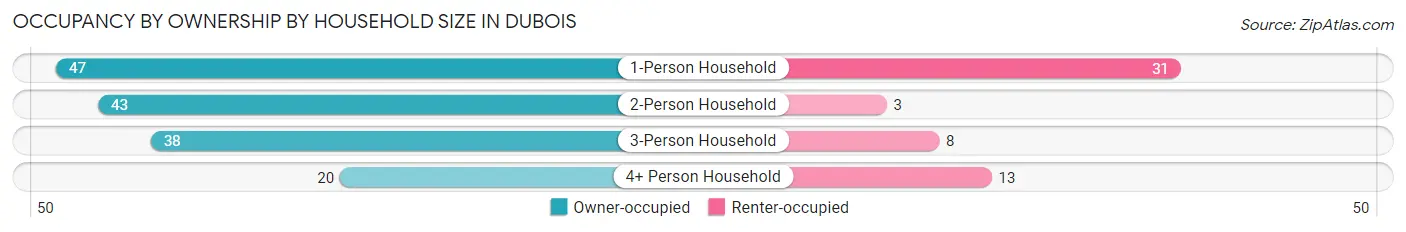
| Household Size | Owner-occupied | Renter-occupied |
| 1-Person Household | 47 (60.3%) | 31 (39.7%) |
| 2-Person Household | 43 (93.5%) | 3 (6.5%) |
| 3-Person Household | 38 (82.6%) | 8 (17.4%) |
| 4+ Person Household | 20 (60.6%) | 13 (39.4%) |
| Total Housing Units | 148 (72.9%) | 55 (27.1%) |
Occupancy by Educational Attainment in Dubois
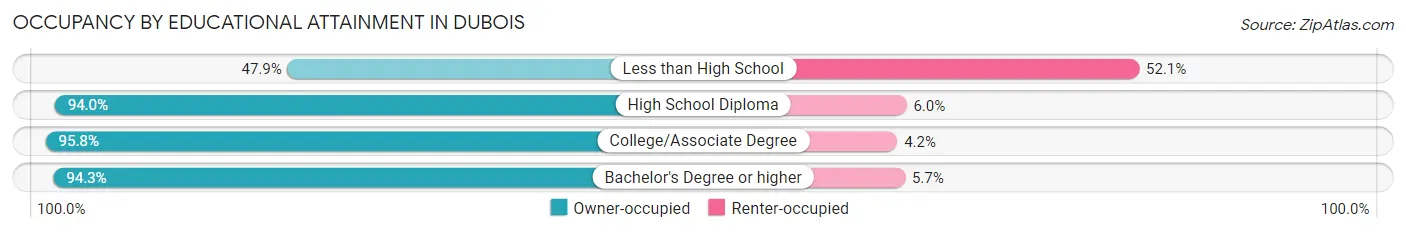
| Household Size | Owner-occupied | Renter-occupied |
| Less than High School | 45 (47.9%) | 49 (52.1%) |
| High School Diploma | 47 (94.0%) | 3 (6.0%) |
| College/Associate Degree | 23 (95.8%) | 1 (4.2%) |
| Bachelor's Degree or higher | 33 (94.3%) | 2 (5.7%) |
Occupancy by Age of Householder in Dubois
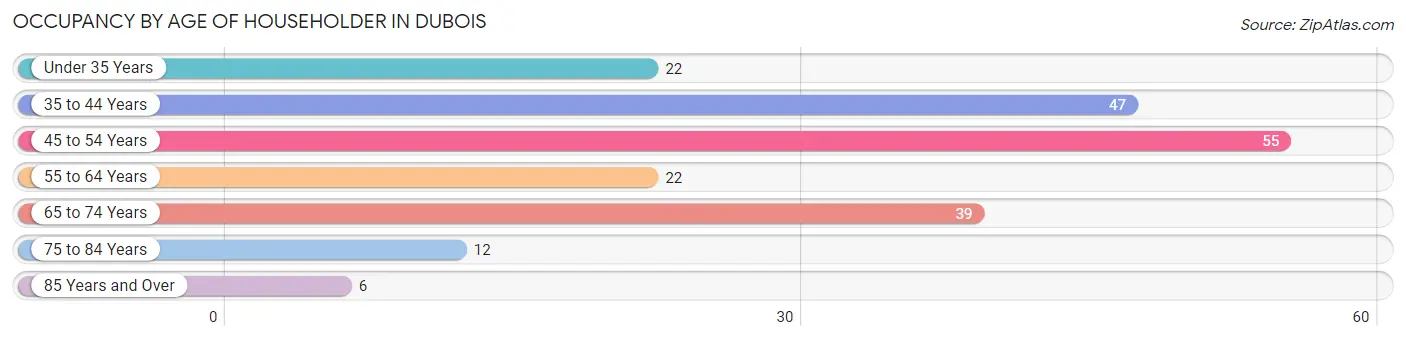
| Age Bracket | # Households | % Households |
| Under 35 Years | 22 | 10.8% |
| 35 to 44 Years | 47 | 23.2% |
| 45 to 54 Years | 55 | 27.1% |
| 55 to 64 Years | 22 | 10.8% |
| 65 to 74 Years | 39 | 19.2% |
| 75 to 84 Years | 12 | 5.9% |
| 85 Years and Over | 6 | 3.0% |
| Total | 203 | 100.0% |
Housing Finances in Dubois
Median Income by Occupancy in Dubois
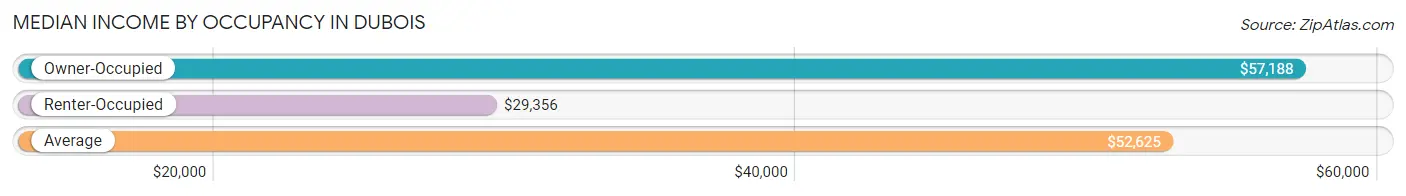
| Occupancy Type | # Households | Median Income |
| Owner-Occupied | 148 (72.9%) | $57,188 |
| Renter-Occupied | 55 (27.1%) | $29,356 |
| Average | 203 (100.0%) | $52,625 |
Occupancy by Householder Income Bracket in Dubois
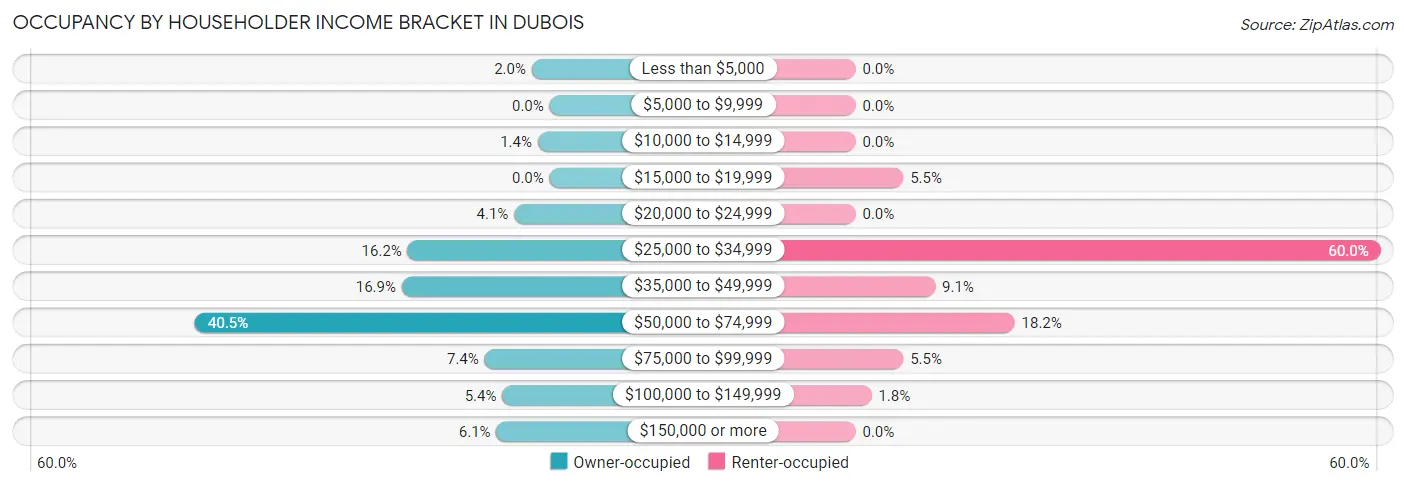
| Income Bracket | Owner-occupied | Renter-occupied |
| Less than $5,000 | 3 (2.0%) | 0 (0.0%) |
| $5,000 to $9,999 | 0 (0.0%) | 0 (0.0%) |
| $10,000 to $14,999 | 2 (1.3%) | 0 (0.0%) |
| $15,000 to $19,999 | 0 (0.0%) | 3 (5.4%) |
| $20,000 to $24,999 | 6 (4.1%) | 0 (0.0%) |
| $25,000 to $34,999 | 24 (16.2%) | 33 (60.0%) |
| $35,000 to $49,999 | 25 (16.9%) | 5 (9.1%) |
| $50,000 to $74,999 | 60 (40.5%) | 10 (18.2%) |
| $75,000 to $99,999 | 11 (7.4%) | 3 (5.4%) |
| $100,000 to $149,999 | 8 (5.4%) | 1 (1.8%) |
| $150,000 or more | 9 (6.1%) | 0 (0.0%) |
| Total | 148 (100.0%) | 55 (100.0%) |
Monthly Housing Cost Tiers in Dubois
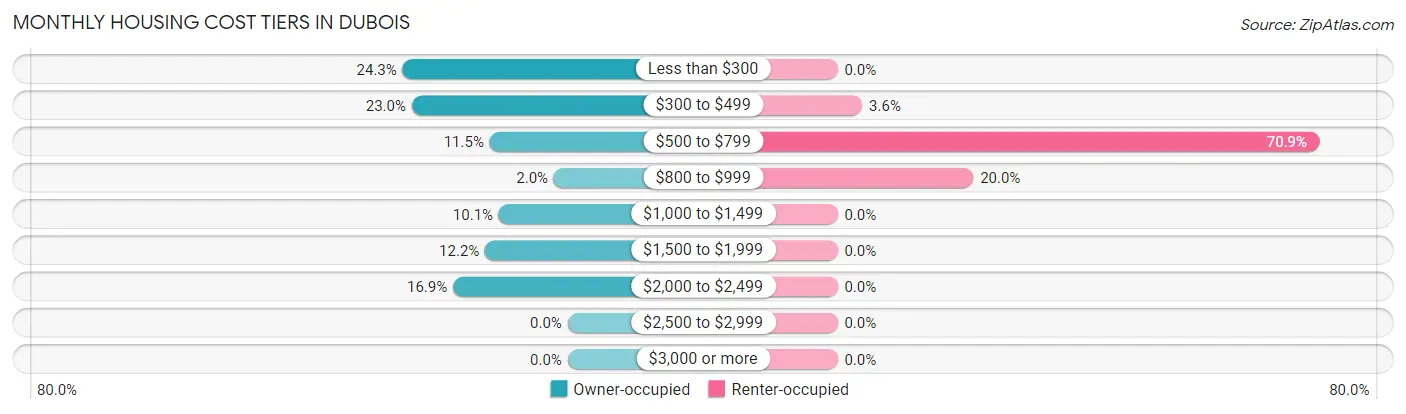
| Monthly Cost | Owner-occupied | Renter-occupied |
| Less than $300 | 36 (24.3%) | 0 (0.0%) |
| $300 to $499 | 34 (23.0%) | 2 (3.6%) |
| $500 to $799 | 17 (11.5%) | 39 (70.9%) |
| $800 to $999 | 3 (2.0%) | 11 (20.0%) |
| $1,000 to $1,499 | 15 (10.1%) | 0 (0.0%) |
| $1,500 to $1,999 | 18 (12.2%) | 0 (0.0%) |
| $2,000 to $2,499 | 25 (16.9%) | 0 (0.0%) |
| $2,500 to $2,999 | 0 (0.0%) | 0 (0.0%) |
| $3,000 or more | 0 (0.0%) | 0 (0.0%) |
| Total | 148 (100.0%) | 55 (100.0%) |
Physical Housing Characteristics in Dubois
Housing Structures in Dubois
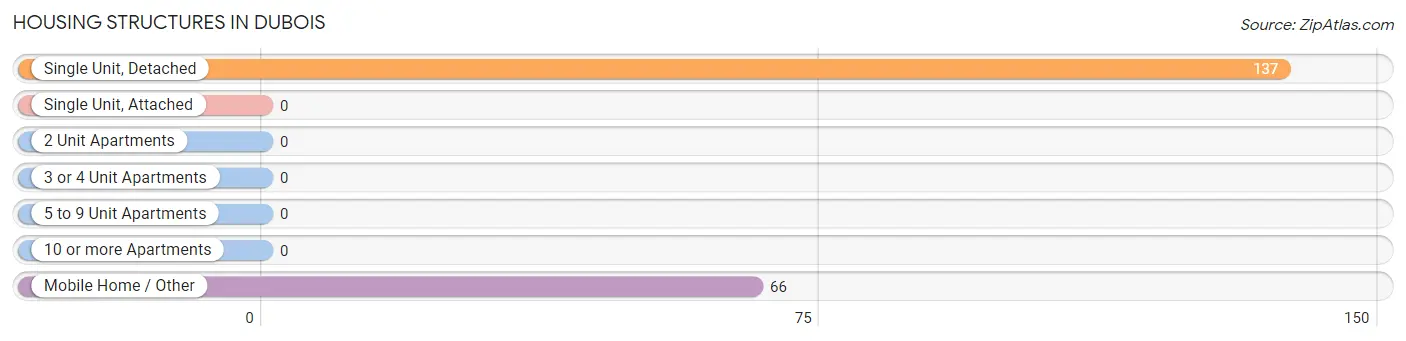
| Structure Type | # Housing Units | % Housing Units |
| Single Unit, Detached | 137 | 67.5% |
| Single Unit, Attached | 0 | 0.0% |
| 2 Unit Apartments | 0 | 0.0% |
| 3 or 4 Unit Apartments | 0 | 0.0% |
| 5 to 9 Unit Apartments | 0 | 0.0% |
| 10 or more Apartments | 0 | 0.0% |
| Mobile Home / Other | 66 | 32.5% |
| Total | 203 | 100.0% |
Housing Structures by Occupancy in Dubois
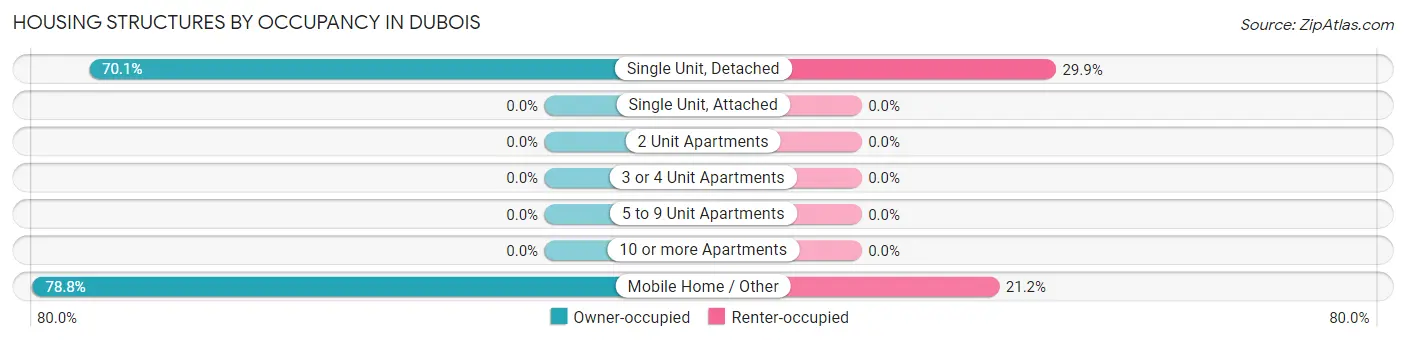
| Structure Type | Owner-occupied | Renter-occupied |
| Single Unit, Detached | 96 (70.1%) | 41 (29.9%) |
| Single Unit, Attached | 0 (0.0%) | 0 (0.0%) |
| 2 Unit Apartments | 0 (0.0%) | 0 (0.0%) |
| 3 or 4 Unit Apartments | 0 (0.0%) | 0 (0.0%) |
| 5 to 9 Unit Apartments | 0 (0.0%) | 0 (0.0%) |
| 10 or more Apartments | 0 (0.0%) | 0 (0.0%) |
| Mobile Home / Other | 52 (78.8%) | 14 (21.2%) |
| Total | 148 (72.9%) | 55 (27.1%) |
Housing Structures by Number of Rooms in Dubois
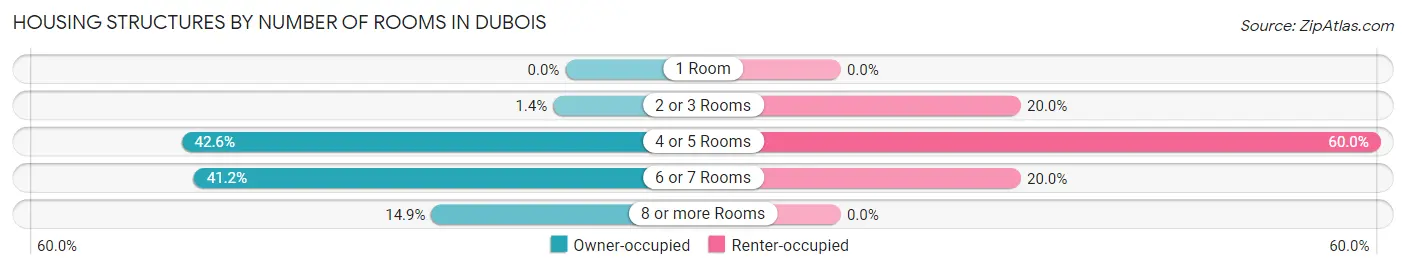
| Number of Rooms | Owner-occupied | Renter-occupied |
| 1 Room | 0 (0.0%) | 0 (0.0%) |
| 2 or 3 Rooms | 2 (1.3%) | 11 (20.0%) |
| 4 or 5 Rooms | 63 (42.6%) | 33 (60.0%) |
| 6 or 7 Rooms | 61 (41.2%) | 11 (20.0%) |
| 8 or more Rooms | 22 (14.9%) | 0 (0.0%) |
| Total | 148 (100.0%) | 55 (100.0%) |
Housing Structure by Heating Type in Dubois
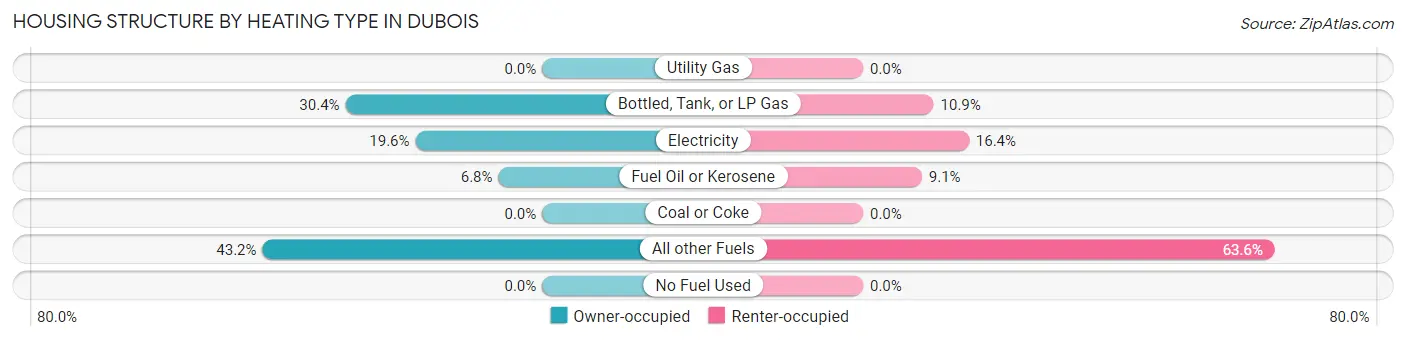
| Heating Type | Owner-occupied | Renter-occupied |
| Utility Gas | 0 (0.0%) | 0 (0.0%) |
| Bottled, Tank, or LP Gas | 45 (30.4%) | 6 (10.9%) |
| Electricity | 29 (19.6%) | 9 (16.4%) |
| Fuel Oil or Kerosene | 10 (6.8%) | 5 (9.1%) |
| Coal or Coke | 0 (0.0%) | 0 (0.0%) |
| All other Fuels | 64 (43.2%) | 35 (63.6%) |
| No Fuel Used | 0 (0.0%) | 0 (0.0%) |
| Total | 148 (100.0%) | 55 (100.0%) |
Household Vehicle Usage in Dubois
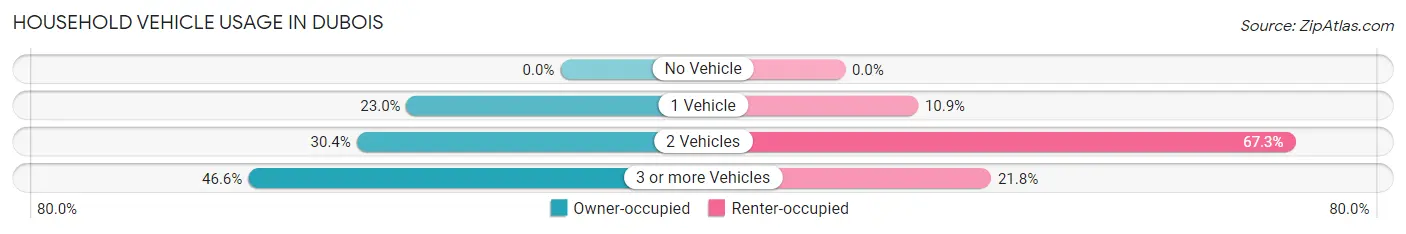
| Vehicles per Household | Owner-occupied | Renter-occupied |
| No Vehicle | 0 (0.0%) | 0 (0.0%) |
| 1 Vehicle | 34 (23.0%) | 6 (10.9%) |
| 2 Vehicles | 45 (30.4%) | 37 (67.3%) |
| 3 or more Vehicles | 69 (46.6%) | 12 (21.8%) |
| Total | 148 (100.0%) | 55 (100.0%) |
Real Estate & Mortgages in Dubois
Real Estate and Mortgage Overview in Dubois
| Characteristic | Without Mortgage | With Mortgage |
| Housing Units | 83 | 65 |
| Median Property Value | $96,300 | $403,100 |
| Median Household Income | $43,125 | $6 |
| Monthly Housing Costs | $328 | $0 |
| Real Estate Taxes | $507 | $0 |
Property Value by Mortgage Status in Dubois
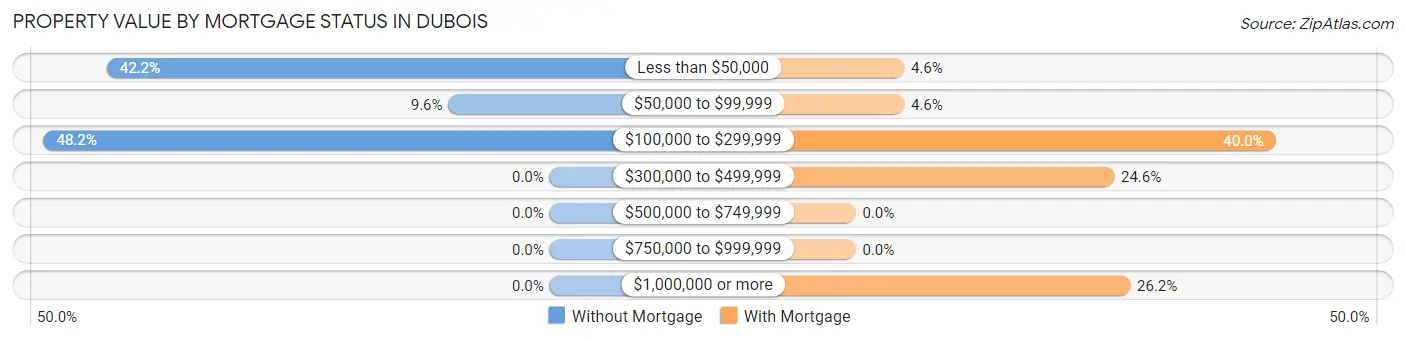
| Property Value | Without Mortgage | With Mortgage |
| Less than $50,000 | 35 (42.2%) | 3 (4.6%) |
| $50,000 to $99,999 | 8 (9.6%) | 3 (4.6%) |
| $100,000 to $299,999 | 40 (48.2%) | 26 (40.0%) |
| $300,000 to $499,999 | 0 (0.0%) | 16 (24.6%) |
| $500,000 to $749,999 | 0 (0.0%) | 0 (0.0%) |
| $750,000 to $999,999 | 0 (0.0%) | 0 (0.0%) |
| $1,000,000 or more | 0 (0.0%) | 17 (26.2%) |
| Total | 83 (100.0%) | 65 (100.0%) |
Household Income by Mortgage Status in Dubois
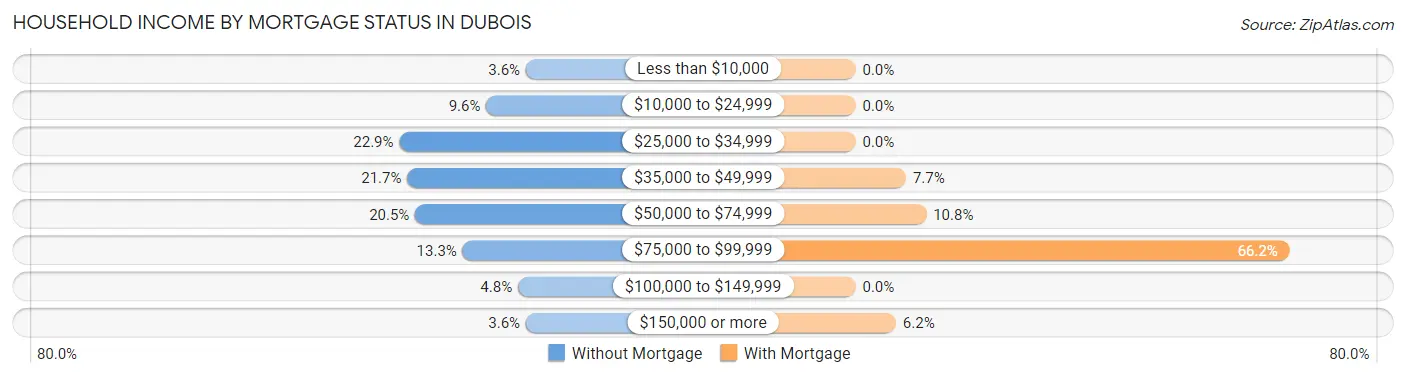
| Household Income | Without Mortgage | With Mortgage |
| Less than $10,000 | 3 (3.6%) | 0 (0.0%) |
| $10,000 to $24,999 | 8 (9.6%) | 0 (0.0%) |
| $25,000 to $34,999 | 19 (22.9%) | 0 (0.0%) |
| $35,000 to $49,999 | 18 (21.7%) | 5 (7.7%) |
| $50,000 to $74,999 | 17 (20.5%) | 7 (10.8%) |
| $75,000 to $99,999 | 11 (13.3%) | 43 (66.1%) |
| $100,000 to $149,999 | 4 (4.8%) | 0 (0.0%) |
| $150,000 or more | 3 (3.6%) | 4 (6.1%) |
| Total | 83 (100.0%) | 65 (100.0%) |
Property Value to Household Income Ratio in Dubois
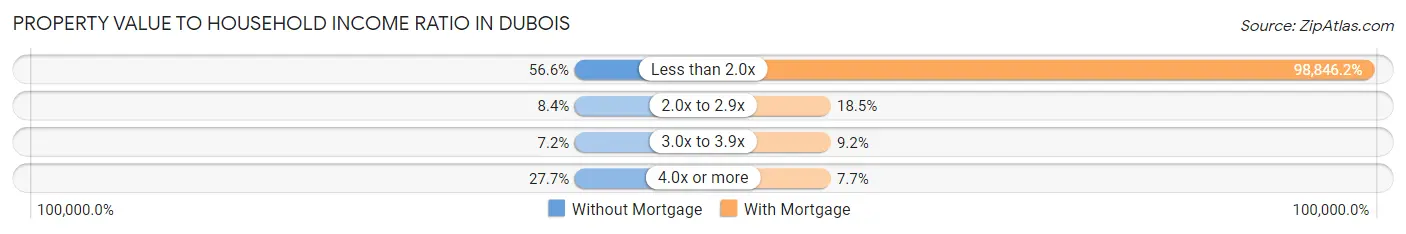
| Value-to-Income Ratio | Without Mortgage | With Mortgage |
| Less than 2.0x | 47 (56.6%) | 64,250 (98,846.2%) |
| 2.0x to 2.9x | 7 (8.4%) | 12 (18.5%) |
| 3.0x to 3.9x | 6 (7.2%) | 6 (9.2%) |
| 4.0x or more | 23 (27.7%) | 5 (7.7%) |
| Total | 83 (100.0%) | 65 (100.0%) |
Real Estate Taxes by Mortgage Status in Dubois
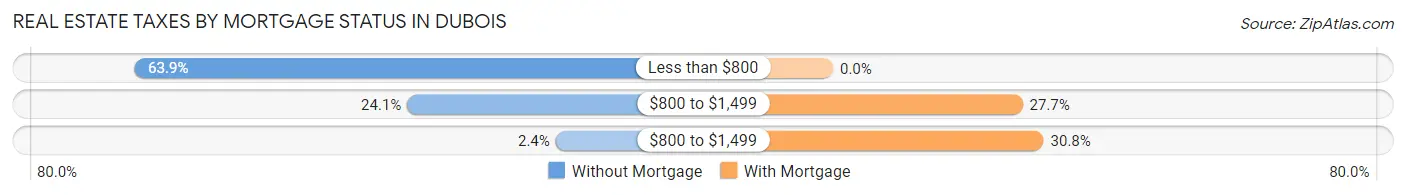
| Property Taxes | Without Mortgage | With Mortgage |
| Less than $800 | 53 (63.9%) | 0 (0.0%) |
| $800 to $1,499 | 20 (24.1%) | 18 (27.7%) |
| $800 to $1,499 | 2 (2.4%) | 20 (30.8%) |
| Total | 83 (100.0%) | 65 (100.0%) |
Health & Disability in Dubois
Health Insurance Coverage by Age in Dubois
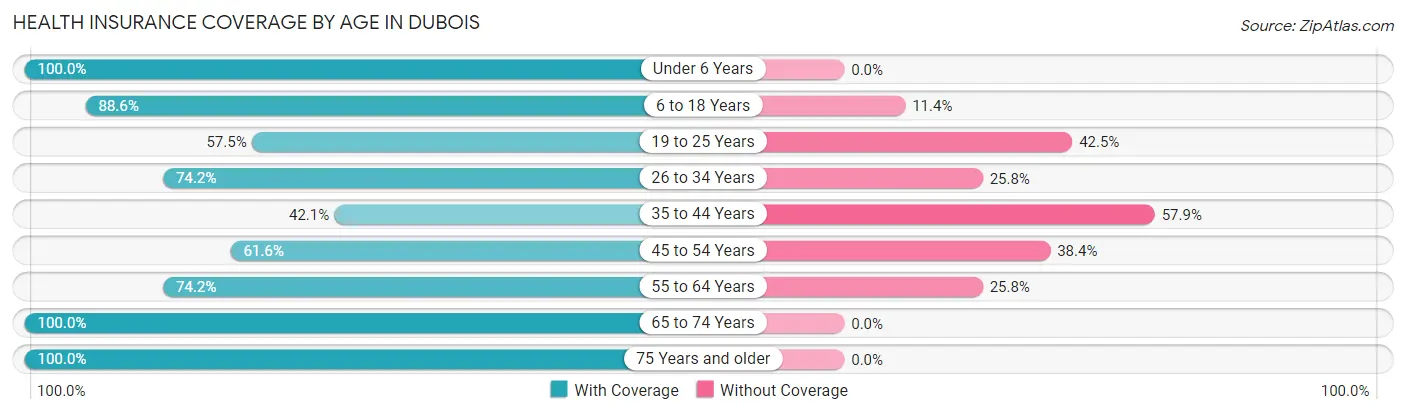
| Age Bracket | With Coverage | Without Coverage |
| Under 6 Years | 52 (100.0%) | 0 (0.0%) |
| 6 to 18 Years | 39 (88.6%) | 5 (11.4%) |
| 19 to 25 Years | 23 (57.5%) | 17 (42.5%) |
| 26 to 34 Years | 46 (74.2%) | 16 (25.8%) |
| 35 to 44 Years | 32 (42.1%) | 44 (57.9%) |
| 45 to 54 Years | 77 (61.6%) | 48 (38.4%) |
| 55 to 64 Years | 23 (74.2%) | 8 (25.8%) |
| 65 to 74 Years | 74 (100.0%) | 0 (0.0%) |
| 75 Years and older | 23 (100.0%) | 0 (0.0%) |
| Total | 389 (73.8%) | 138 (26.2%) |
Health Insurance Coverage by Citizenship Status in Dubois
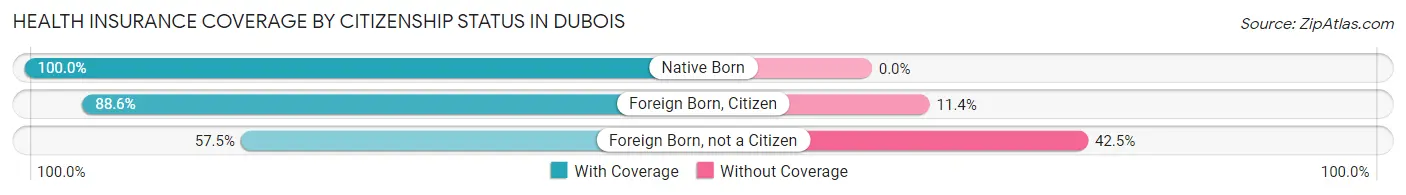
| Citizenship Status | With Coverage | Without Coverage |
| Native Born | 52 (100.0%) | 0 (0.0%) |
| Foreign Born, Citizen | 39 (88.6%) | 5 (11.4%) |
| Foreign Born, not a Citizen | 23 (57.5%) | 17 (42.5%) |
Health Insurance Coverage by Household Income in Dubois
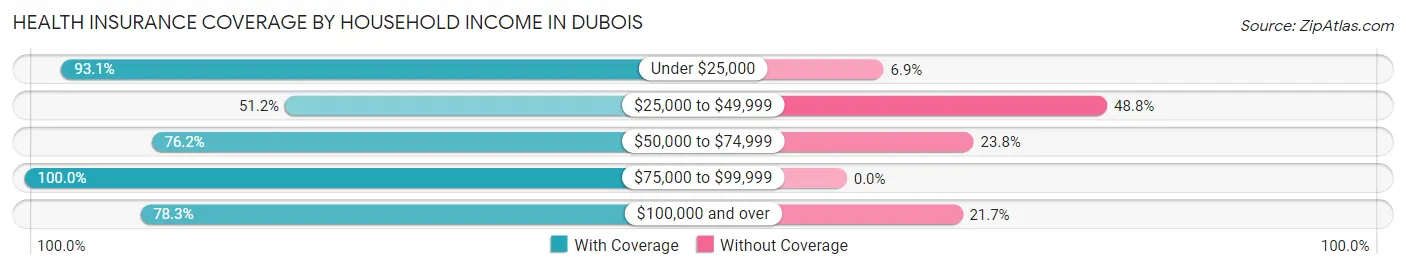
| Household Income | With Coverage | Without Coverage |
| Under $25,000 | 27 (93.1%) | 2 (6.9%) |
| $25,000 to $49,999 | 63 (51.2%) | 60 (48.8%) |
| $50,000 to $74,999 | 202 (76.2%) | 63 (23.8%) |
| $75,000 to $99,999 | 38 (100.0%) | 0 (0.0%) |
| $100,000 and over | 47 (78.3%) | 13 (21.7%) |
Public vs Private Health Insurance Coverage by Age in Dubois
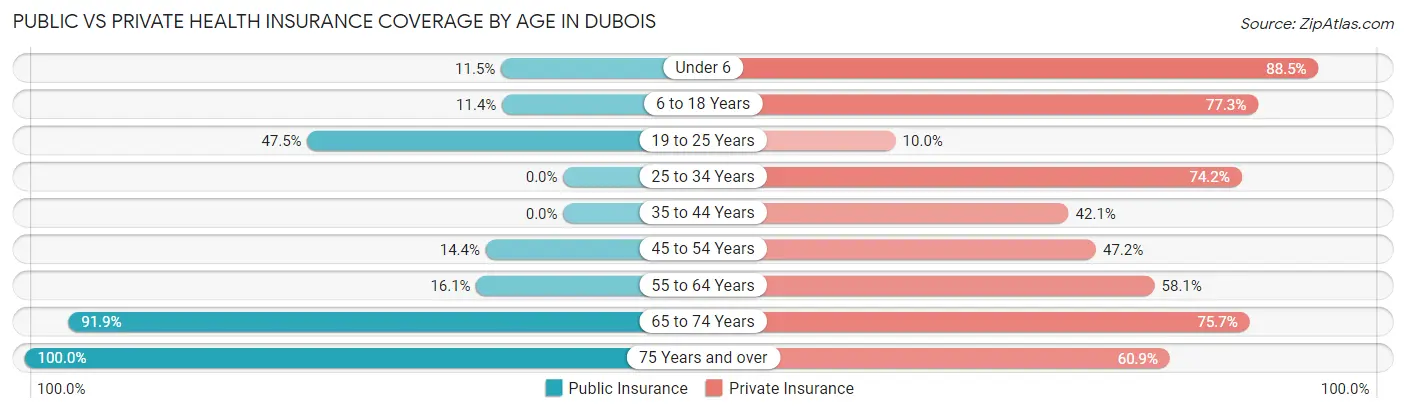
| Age Bracket | Public Insurance | Private Insurance |
| Under 6 | 6 (11.5%) | 46 (88.5%) |
| 6 to 18 Years | 5 (11.4%) | 34 (77.3%) |
| 19 to 25 Years | 19 (47.5%) | 4 (10.0%) |
| 25 to 34 Years | 0 (0.0%) | 46 (74.2%) |
| 35 to 44 Years | 0 (0.0%) | 32 (42.1%) |
| 45 to 54 Years | 18 (14.4%) | 59 (47.2%) |
| 55 to 64 Years | 5 (16.1%) | 18 (58.1%) |
| 65 to 74 Years | 68 (91.9%) | 56 (75.7%) |
| 75 Years and over | 23 (100.0%) | 14 (60.9%) |
| Total | 144 (27.3%) | 309 (58.6%) |
Disability Status by Sex by Age in Dubois
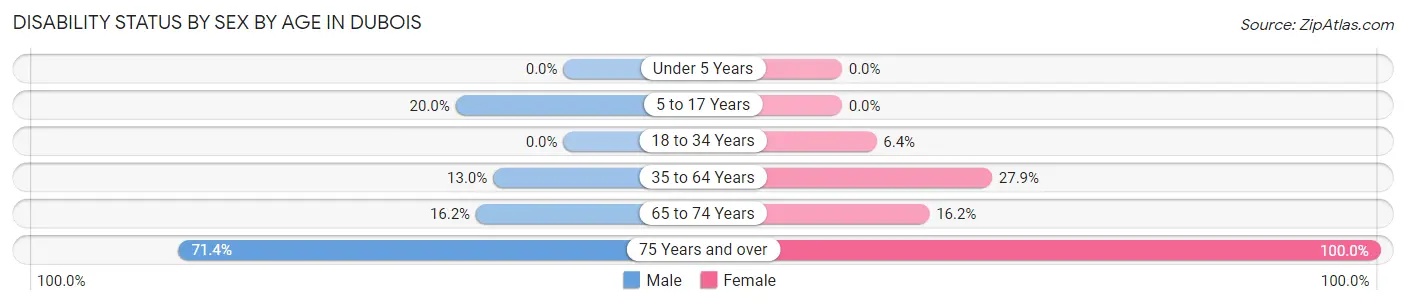
| Age Bracket | Male | Female |
| Under 5 Years | 0 (0.0%) | 0 (0.0%) |
| 5 to 17 Years | 3 (20.0%) | 0 (0.0%) |
| 18 to 34 Years | 0 (0.0%) | 5 (6.4%) |
| 35 to 64 Years | 12 (13.0%) | 39 (27.9%) |
| 65 to 74 Years | 6 (16.2%) | 6 (16.2%) |
| 75 Years and over | 10 (71.4%) | 9 (100.0%) |
Disability Class by Sex by Age in Dubois
Disability Class: Hearing Difficulty
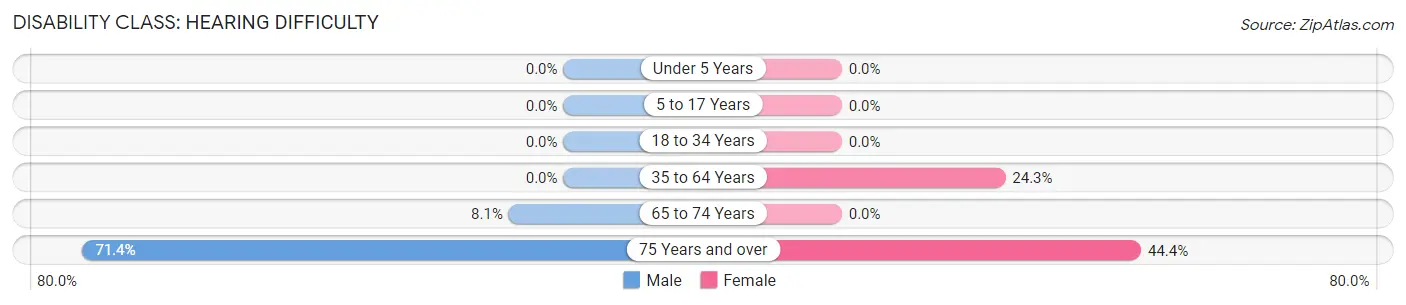
| Age Bracket | Male | Female |
| Under 5 Years | 0 (0.0%) | 0 (0.0%) |
| 5 to 17 Years | 0 (0.0%) | 0 (0.0%) |
| 18 to 34 Years | 0 (0.0%) | 0 (0.0%) |
| 35 to 64 Years | 0 (0.0%) | 34 (24.3%) |
| 65 to 74 Years | 3 (8.1%) | 0 (0.0%) |
| 75 Years and over | 10 (71.4%) | 4 (44.4%) |
Disability Class: Vision Difficulty
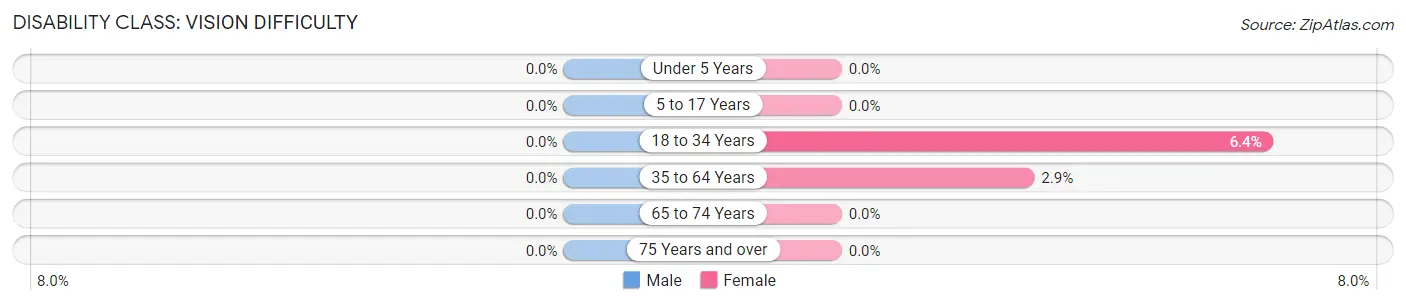
| Age Bracket | Male | Female |
| Under 5 Years | 0 (0.0%) | 0 (0.0%) |
| 5 to 17 Years | 0 (0.0%) | 0 (0.0%) |
| 18 to 34 Years | 0 (0.0%) | 5 (6.4%) |
| 35 to 64 Years | 0 (0.0%) | 4 (2.9%) |
| 65 to 74 Years | 0 (0.0%) | 0 (0.0%) |
| 75 Years and over | 0 (0.0%) | 0 (0.0%) |
Disability Class: Cognitive Difficulty
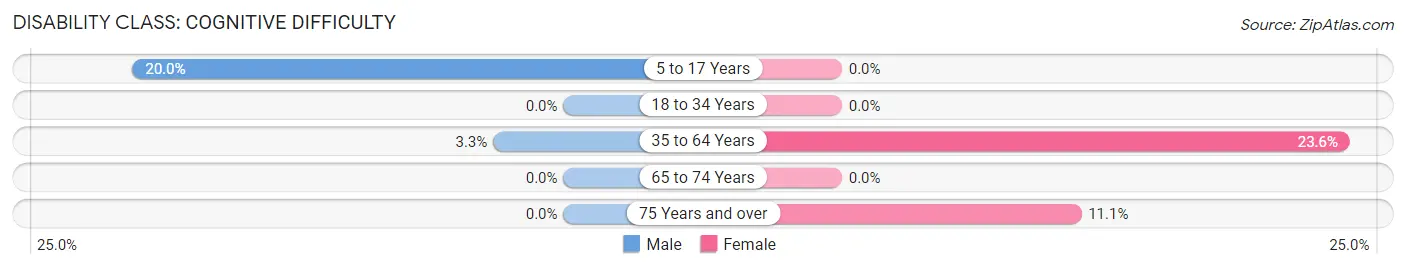
| Age Bracket | Male | Female |
| 5 to 17 Years | 3 (20.0%) | 0 (0.0%) |
| 18 to 34 Years | 0 (0.0%) | 0 (0.0%) |
| 35 to 64 Years | 3 (3.3%) | 33 (23.6%) |
| 65 to 74 Years | 0 (0.0%) | 0 (0.0%) |
| 75 Years and over | 0 (0.0%) | 1 (11.1%) |
Disability Class: Ambulatory Difficulty
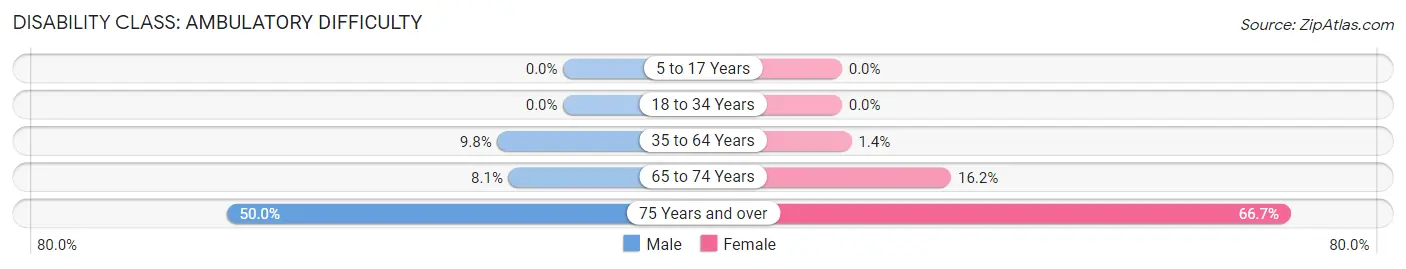
| Age Bracket | Male | Female |
| 5 to 17 Years | 0 (0.0%) | 0 (0.0%) |
| 18 to 34 Years | 0 (0.0%) | 0 (0.0%) |
| 35 to 64 Years | 9 (9.8%) | 2 (1.4%) |
| 65 to 74 Years | 3 (8.1%) | 6 (16.2%) |
| 75 Years and over | 7 (50.0%) | 6 (66.7%) |
Disability Class: Self-Care Difficulty
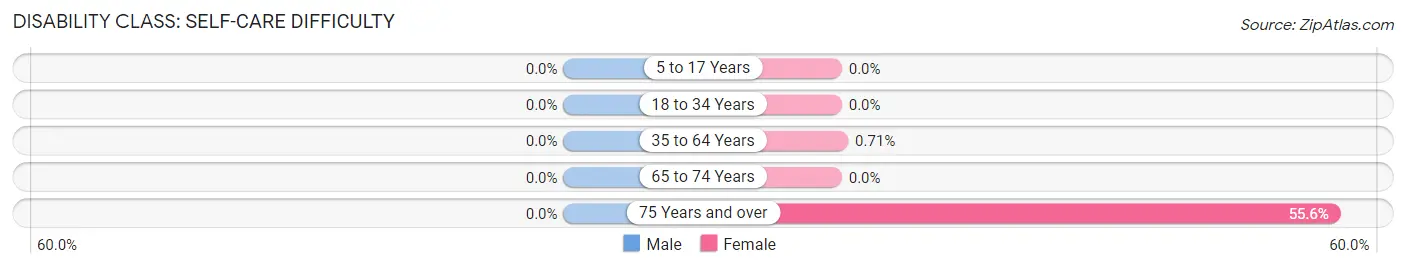
| Age Bracket | Male | Female |
| 5 to 17 Years | 0 (0.0%) | 0 (0.0%) |
| 18 to 34 Years | 0 (0.0%) | 0 (0.0%) |
| 35 to 64 Years | 0 (0.0%) | 1 (0.7%) |
| 65 to 74 Years | 0 (0.0%) | 0 (0.0%) |
| 75 Years and over | 0 (0.0%) | 5 (55.6%) |
Technology Access in Dubois
Computing Device Access in Dubois
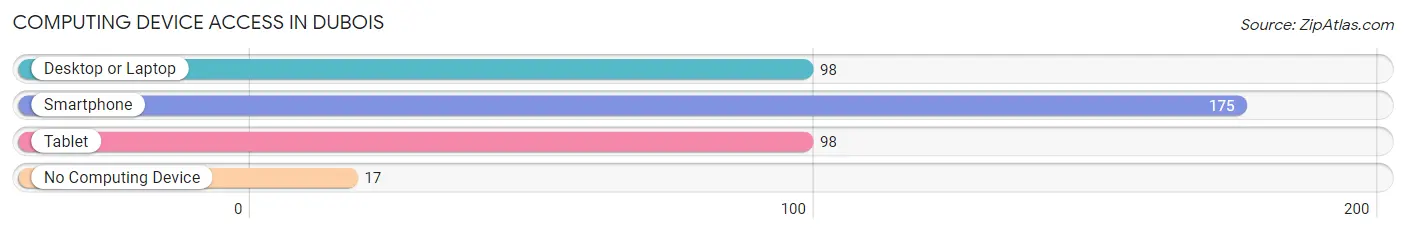
| Device Type | # Households | % Households |
| Desktop or Laptop | 98 | 48.3% |
| Smartphone | 175 | 86.2% |
| Tablet | 98 | 48.3% |
| No Computing Device | 17 | 8.4% |
| Total | 203 | 100.0% |
Internet Access in Dubois
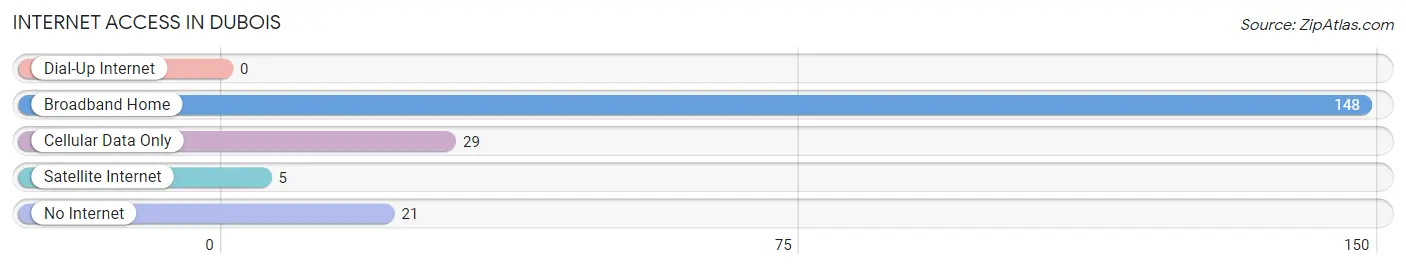
| Internet Type | # Households | % Households |
| Dial-Up Internet | 0 | 0.0% |
| Broadband Home | 148 | 72.9% |
| Cellular Data Only | 29 | 14.3% |
| Satellite Internet | 5 | 2.5% |
| No Internet | 21 | 10.3% |
| Total | 203 | 100.0% |
Dubois Summary
History
DuBois, Idaho is a small town located in the southeastern corner of the state, near the border of Utah. It was founded in 1883 by a group of Mormon settlers who were looking for a place to settle and raise their families. The town was named after the first settler, John DuBois, who was a French-Canadian fur trapper.
The town was originally a farming community, but it soon became a hub for the mining industry. The area was rich in minerals, and the town quickly grew as miners flocked to the area to take advantage of the resources. The town was also home to a number of sawmills, which provided lumber for the growing population.
In the early 1900s, the town was a bustling center of commerce and industry. It had a number of stores, hotels, saloons, and other businesses. The town also had a school, a post office, and a newspaper.
The town continued to grow and prosper until the Great Depression hit in the 1930s. The mining industry was hit hard, and many of the businesses in town closed. The population of the town declined, and it became a quiet, rural community.
In the 1950s, the town began to experience a resurgence. The mining industry was revived, and the town once again became a hub of activity. The population began to grow, and the town was able to attract new businesses.
Today, DuBois is a small, rural town with a population of just over 500 people. It is still home to a number of businesses, including a grocery store, a hardware store, and a few restaurants. The town also has a post office, a library, and a museum.
Geography
DuBois is located in the southeastern corner of Idaho, near the border of Utah. It is situated in a valley surrounded by mountains, and the town is located at an elevation of 4,800 feet. The town is located in a semi-arid climate, with hot summers and cold winters.
The town is located near the Snake River, which provides a source of water for the town. The area is also home to a number of lakes, including Bear Lake, which is a popular destination for fishing and boating.
Economy
The economy of DuBois is largely based on agriculture and mining. The town is home to a number of farms, which produce a variety of crops, including potatoes, corn, and hay. The town is also home to a number of mining operations, which produce a variety of minerals, including gold, silver, and copper.
The town is also home to a number of businesses, including a grocery store, a hardware store, and a few restaurants. The town also has a post office, a library, and a museum.
Demographics
As of the 2010 census, the population of DuBois was 514. The town is predominantly white, with a small Hispanic population. The median household income is $37,500, and the median age is 44. The town has a high school, and the town is served by a number of churches.
Common Questions
What is Per Capita Income in Dubois?
Per Capita income in Dubois is $24,424.
What is the Median Family Income in Dubois?
Median Family Income in Dubois is $59,044.
What is the Median Household income in Dubois?
Median Household Income in Dubois is $52,625.
What is Income or Wage Gap in Dubois?
Income or Wage Gap in Dubois is 12.4%.
Women in Dubois earn 87.6 cents for every dollar earned by a man.
What is Inequality or Gini Index in Dubois?
Inequality or Gini Index in Dubois is 0.31.
What is the Total Population of Dubois?
Total Population of Dubois is 530.
What is the Total Male Population of Dubois?
Total Male Population of Dubois is 224.
What is the Total Female Population of Dubois?
Total Female Population of Dubois is 306.
What is the Ratio of Males per 100 Females in Dubois?
There are 73.20 Males per 100 Females in Dubois.
What is the Ratio of Females per 100 Males in Dubois?
There are 136.61 Females per 100 Males in Dubois.
What is the Median Population Age in Dubois?
Median Population Age in Dubois is 41.9 Years.
What is the Average Family Size in Dubois
Average Family Size in Dubois is 3.5 People.
What is the Average Household Size in Dubois
Average Household Size in Dubois is 2.5 People.
How Large is the Labor Force in Dubois?
There are 290 People in the Labor Forcein in Dubois.
What is the Percentage of People in the Labor Force in Dubois?
65.8% of People are in the Labor Force in Dubois.
What is the Unemployment Rate in Dubois?
Unemployment Rate in Dubois is 1.0%.