Sun Valley, ID Map & Demographics
Sun Valley Map
Sun Valley Overview
$82,846
PER CAPITA INCOME
$94,423
AVG FAMILY INCOME
$67,386
AVG HOUSEHOLD INCOME
12.3%
WAGE / INCOME GAP [ % ]
87.7¢/ $1
WAGE / INCOME GAP [ $ ]
0.57
INEQUALITY / GINI INDEX
1,383
TOTAL POPULATION
606
MALE POPULATION
777
FEMALE POPULATION
77.99
MALES / 100 FEMALES
128.22
FEMALES / 100 MALES
64.4
MEDIAN AGE
2.5
AVG FAMILY SIZE
1.8
AVG HOUSEHOLD SIZE
868
LABOR FORCE [ PEOPLE ]
64.2%
PERCENT IN LABOR FORCE
Sun Valley Area Codes
Income in Sun Valley
Income Overview in Sun Valley
Per Capita Income in Sun Valley is $82,846, while median incomes of families and households are $94,423 and $67,386 respectively.
| Characteristic | Number | Measure |
| Per Capita Income | 1,383 | $82,846 |
| Median Family Income | 296 | $94,423 |
| Mean Family Income | 296 | $152,501 |
| Median Household Income | 634 | $67,386 |
| Mean Household Income | 634 | $158,944 |
| Income Deficit | 296 | $0 |
| Wage / Income Gap (%) | 1,383 | 12.30% |
| Wage / Income Gap ($) | 1,383 | 87.70¢ per $1 |
| Gini / Inequality Index | 1,383 | 0.57 |
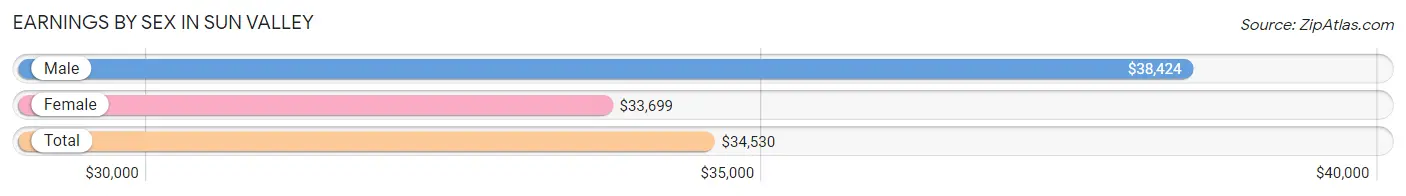
Earnings by Sex in Sun Valley
Average Earnings in Sun Valley are $34,530, $38,424 for men and $33,699 for women, a difference of 12.3%.
| Sex | Number | Average Earnings |
| Male | 398 (41.8%) | $38,424 |
| Female | 555 (58.2%) | $33,699 |
| Total | 953 (100.0%) | $34,530 |
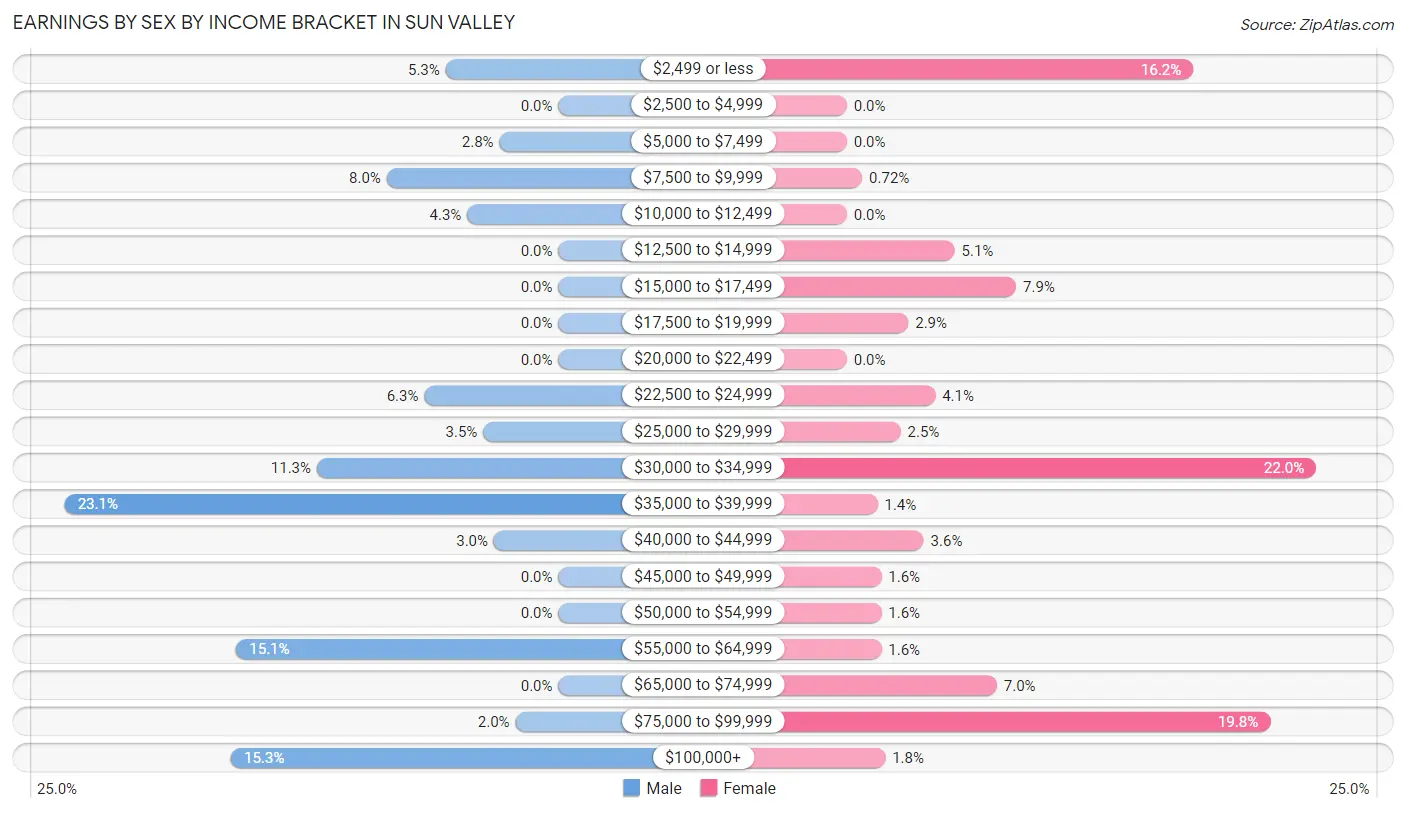
Earnings by Sex by Income Bracket in Sun Valley
The most common earnings brackets in Sun Valley are $35,000 to $39,999 for men (92 | 23.1%) and $30,000 to $34,999 for women (122 | 22.0%).
| Income | Male | Female |
| $2,499 or less | 21 (5.3%) | 90 (16.2%) |
| $2,500 to $4,999 | 0 (0.0%) | 0 (0.0%) |
| $5,000 to $7,499 | 11 (2.8%) | 0 (0.0%) |
| $7,500 to $9,999 | 32 (8.0%) | 4 (0.7%) |
| $10,000 to $12,499 | 17 (4.3%) | 0 (0.0%) |
| $12,500 to $14,999 | 0 (0.0%) | 28 (5.1%) |
| $15,000 to $17,499 | 0 (0.0%) | 44 (7.9%) |
| $17,500 to $19,999 | 0 (0.0%) | 16 (2.9%) |
| $20,000 to $22,499 | 0 (0.0%) | 0 (0.0%) |
| $22,500 to $24,999 | 25 (6.3%) | 23 (4.1%) |
| $25,000 to $29,999 | 14 (3.5%) | 14 (2.5%) |
| $30,000 to $34,999 | 45 (11.3%) | 122 (22.0%) |
| $35,000 to $39,999 | 92 (23.1%) | 8 (1.4%) |
| $40,000 to $44,999 | 12 (3.0%) | 20 (3.6%) |
| $45,000 to $49,999 | 0 (0.0%) | 9 (1.6%) |
| $50,000 to $54,999 | 0 (0.0%) | 9 (1.6%) |
| $55,000 to $64,999 | 60 (15.1%) | 9 (1.6%) |
| $65,000 to $74,999 | 0 (0.0%) | 39 (7.0%) |
| $75,000 to $99,999 | 8 (2.0%) | 110 (19.8%) |
| $100,000+ | 61 (15.3%) | 10 (1.8%) |
| Total | 398 (100.0%) | 555 (100.0%) |
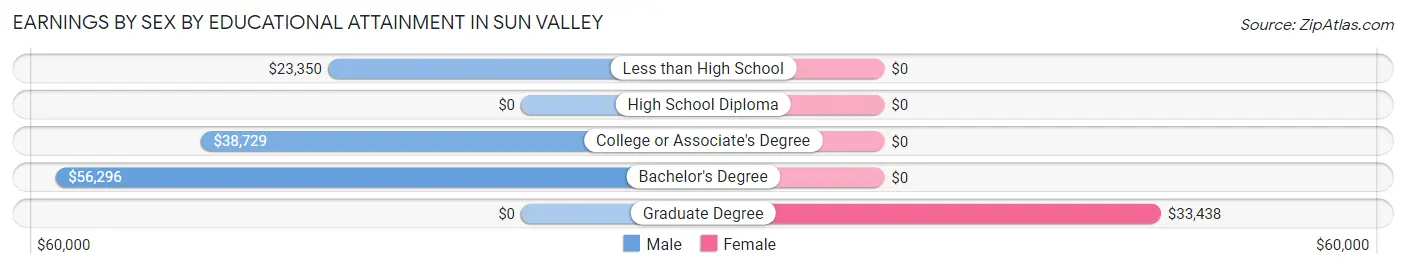
Earnings by Sex by Educational Attainment in Sun Valley
Average earnings in Sun Valley are $38,896 for men and $34,595 for women, a difference of 11.1%. Men with an educational attainment of bachelor's degree enjoy the highest average annual earnings of $56,296, while those with less than high school education earn the least with $23,350. Women with an educational attainment of graduate degree earn the most with the average annual earnings of $33,438, while those with graduate degree education have the smallest earnings of $33,438.
| Educational Attainment | Male Income | Female Income |
| Less than High School | $23,350 | $0 |
| High School Diploma | - | - |
| College or Associate's Degree | $38,729 | $0 |
| Bachelor's Degree | $56,296 | $0 |
| Graduate Degree | - | - |
| Total | $38,896 | $34,595 |
Family Income in Sun Valley
Family Income Brackets in Sun Valley
According to the Sun Valley family income data, there are 69 families falling into the $200,000+ income range, which is the most common income bracket and makes up 23.3% of all families.
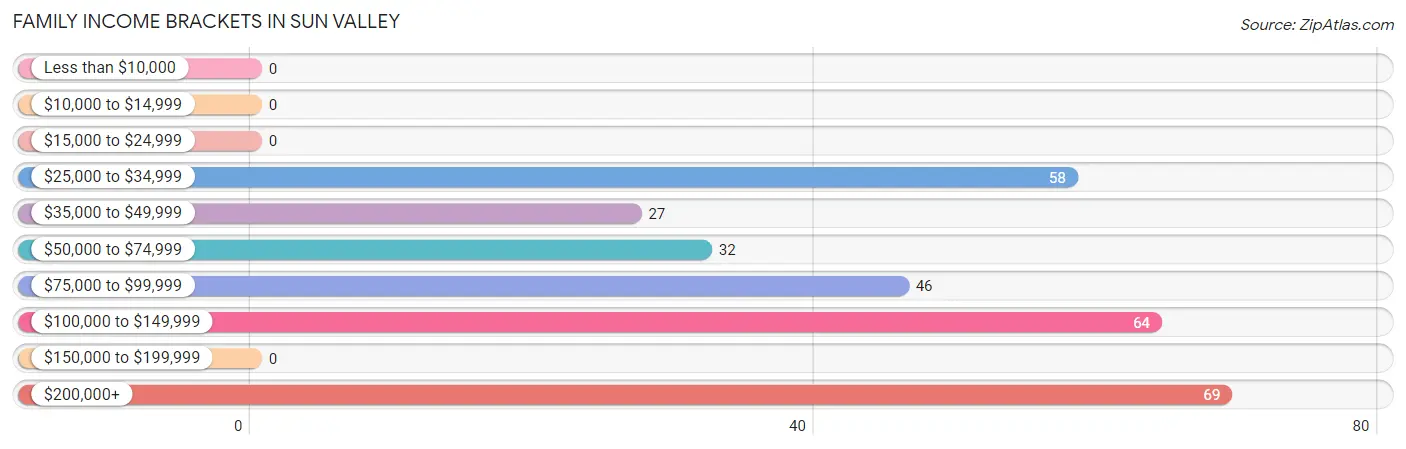
| Income Bracket | # Families | % Families |
| Less than $10,000 | 0 | 0.0% |
| $10,000 to $14,999 | 0 | 0.0% |
| $15,000 to $24,999 | 0 | 0.0% |
| $25,000 to $34,999 | 58 | 19.6% |
| $35,000 to $49,999 | 27 | 9.1% |
| $50,000 to $74,999 | 32 | 10.8% |
| $75,000 to $99,999 | 46 | 15.5% |
| $100,000 to $149,999 | 64 | 21.6% |
| $150,000 to $199,999 | 0 | 0.0% |
| $200,000+ | 69 | 23.3% |
Family Income by Famaliy Size in Sun Valley
2-person families (275 | 92.9%) account for the highest median family income in Sun Valley with $93,942 per family, while 2-person families (275 | 92.9%) have the highest median income of $46,971 per family member.
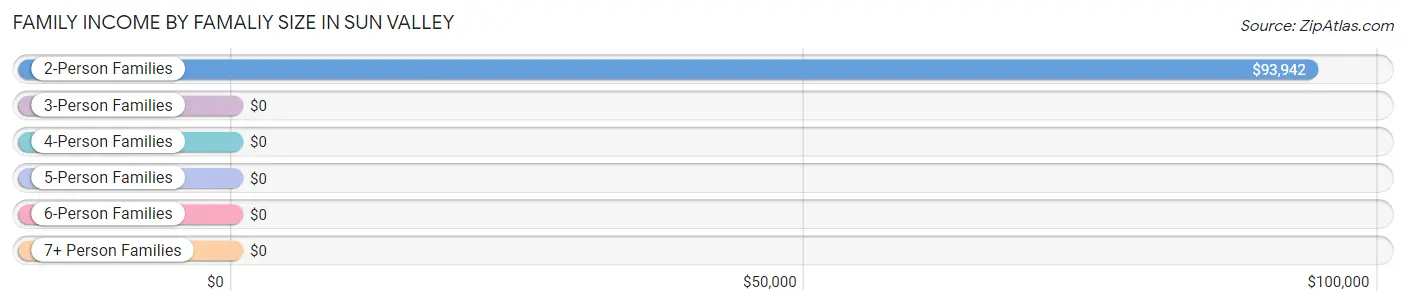
| Income Bracket | # Families | Median Income |
| 2-Person Families | 275 (92.9%) | $93,942 |
| 3-Person Families | 0 (0.0%) | $0 |
| 4-Person Families | 21 (7.1%) | $0 |
| 5-Person Families | 0 (0.0%) | $0 |
| 6-Person Families | 0 (0.0%) | $0 |
| 7+ Person Families | 0 (0.0%) | $0 |
| Total | 296 (100.0%) | $94,423 |
Family Income by Number of Earners in Sun Valley
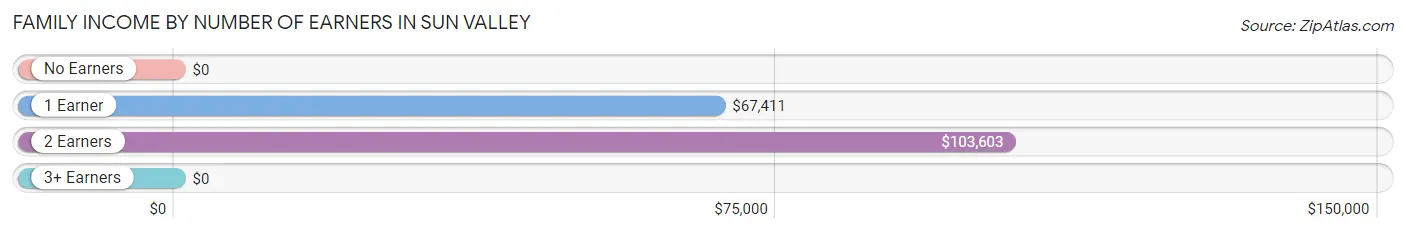
| Number of Earners | # Families | Median Income |
| No Earners | 62 (20.9%) | $0 |
| 1 Earner | 91 (30.7%) | $67,411 |
| 2 Earners | 143 (48.3%) | $103,603 |
| 3+ Earners | 0 (0.0%) | $0 |
| Total | 296 (100.0%) | $94,423 |
Household Income in Sun Valley
Household Income Brackets in Sun Valley
With 170 households falling in the category, the $50,000 to $74,999 income range is the most frequent in Sun Valley, accounting for 26.8% of all households.
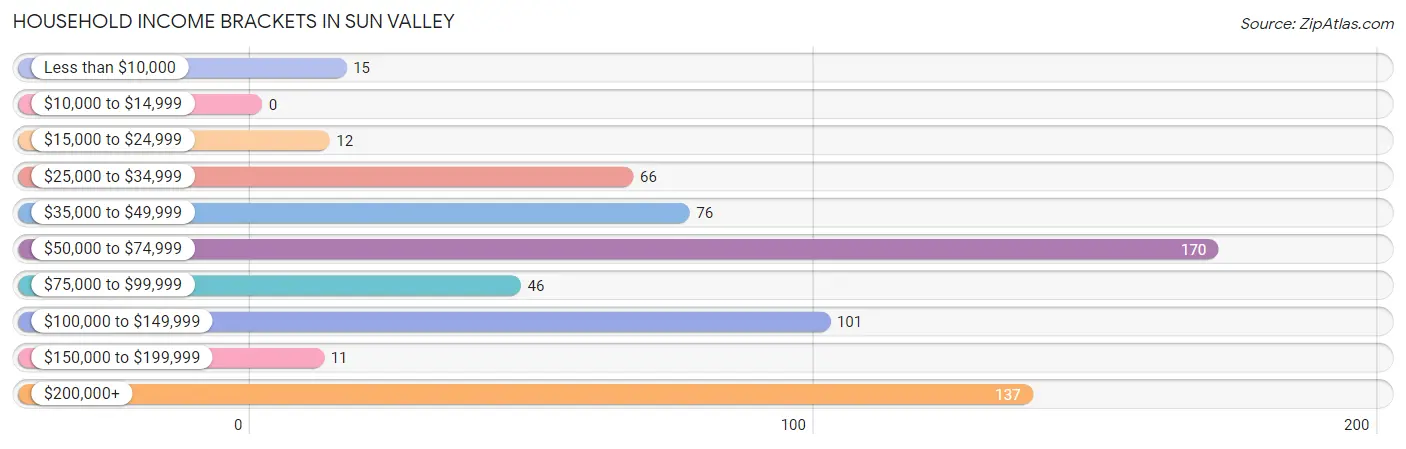
| Income Bracket | # Households | % Households |
| Less than $10,000 | 15 | 2.4% |
| $10,000 to $14,999 | 0 | 0.0% |
| $15,000 to $24,999 | 12 | 1.9% |
| $25,000 to $34,999 | 66 | 10.4% |
| $35,000 to $49,999 | 76 | 12.0% |
| $50,000 to $74,999 | 170 | 26.8% |
| $75,000 to $99,999 | 46 | 7.3% |
| $100,000 to $149,999 | 101 | 15.9% |
| $150,000 to $199,999 | 11 | 1.7% |
| $200,000+ | 137 | 21.6% |
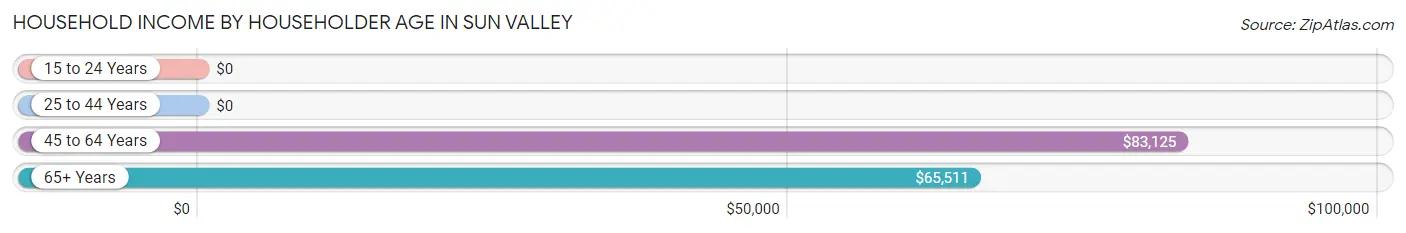
Household Income by Householder Age in Sun Valley
The median household income in Sun Valley is $67,386, with the highest median household income of $83,125 found in the 45 to 64 years age bracket for the primary householder. A total of 183 households (28.9%) fall into this category.
| Income Bracket | # Households | Median Income |
| 15 to 24 Years | 0 (0.0%) | $0 |
| 25 to 44 Years | 8 (1.3%) | $0 |
| 45 to 64 Years | 183 (28.9%) | $83,125 |
| 65+ Years | 443 (69.9%) | $65,511 |
| Total | 634 (100.0%) | $67,386 |
Poverty in Sun Valley
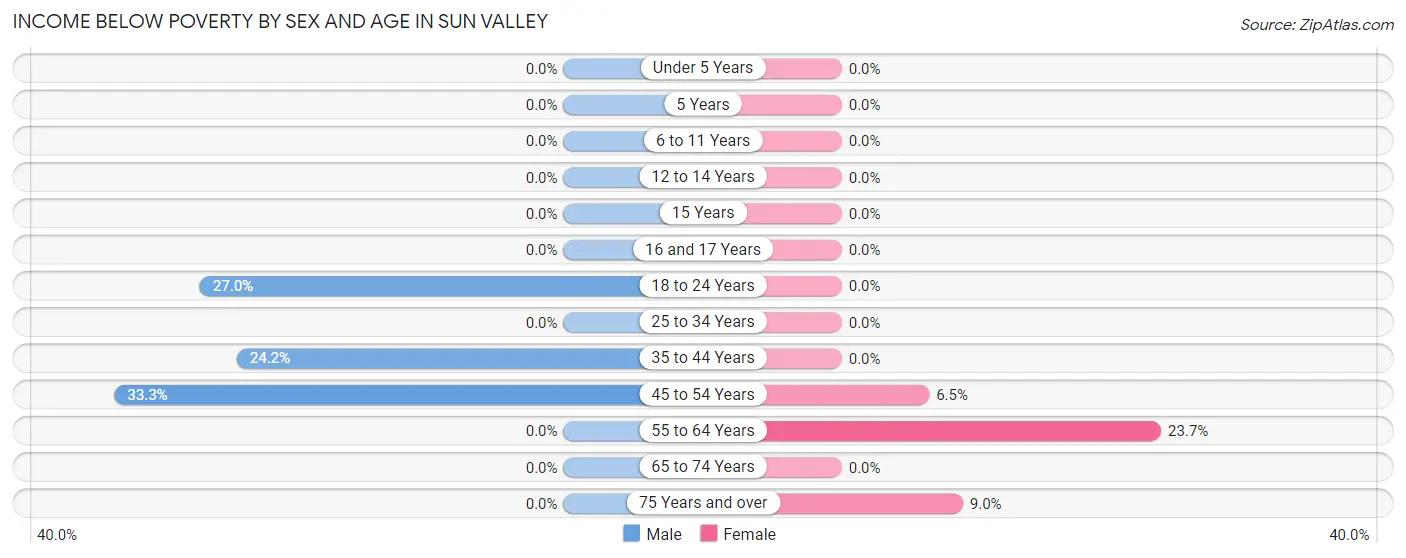
Income Below Poverty by Sex and Age in Sun Valley
With 7.8% poverty level for males and 5.3% for females among the residents of Sun Valley, 45 to 54 year old males and 55 to 64 year old females are the most vulnerable to poverty, with 22 males (33.3%) and 23 females (23.7%) in their respective age groups living below the poverty level.
| Age Bracket | Male | Female |
| Under 5 Years | 0 (0.0%) | 0 (0.0%) |
| 5 Years | 0 (0.0%) | 0 (0.0%) |
| 6 to 11 Years | 0 (0.0%) | 0 (0.0%) |
| 12 to 14 Years | 0 (0.0%) | 0 (0.0%) |
| 15 Years | 0 (0.0%) | 0 (0.0%) |
| 16 and 17 Years | 0 (0.0%) | 0 (0.0%) |
| 18 to 24 Years | 17 (27.0%) | 0 (0.0%) |
| 25 to 34 Years | 0 (0.0%) | 0 (0.0%) |
| 35 to 44 Years | 8 (24.2%) | 0 (0.0%) |
| 45 to 54 Years | 22 (33.3%) | 10 (6.5%) |
| 55 to 64 Years | 0 (0.0%) | 23 (23.7%) |
| 65 to 74 Years | 0 (0.0%) | 0 (0.0%) |
| 75 Years and over | 0 (0.0%) | 8 (9.0%) |
| Total | 47 (7.8%) | 41 (5.3%) |
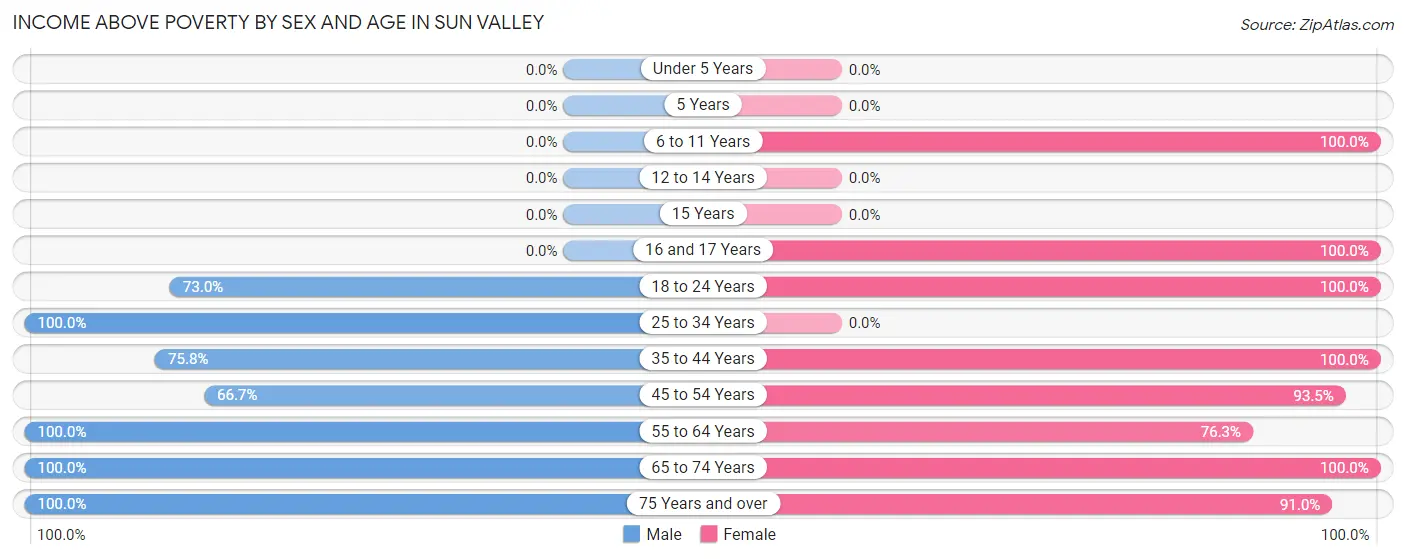
Income Above Poverty by Sex and Age in Sun Valley
According to the poverty statistics in Sun Valley, males aged 25 to 34 years and females aged 6 to 11 years are the age groups that are most secure financially, with 100.0% of males and 100.0% of females in these age groups living above the poverty line.
| Age Bracket | Male | Female |
| Under 5 Years | 0 (0.0%) | 0 (0.0%) |
| 5 Years | 0 (0.0%) | 0 (0.0%) |
| 6 to 11 Years | 0 (0.0%) | 31 (100.0%) |
| 12 to 14 Years | 0 (0.0%) | 0 (0.0%) |
| 15 Years | 0 (0.0%) | 0 (0.0%) |
| 16 and 17 Years | 0 (0.0%) | 48 (100.0%) |
| 18 to 24 Years | 46 (73.0%) | 44 (100.0%) |
| 25 to 34 Years | 77 (100.0%) | 0 (0.0%) |
| 35 to 44 Years | 25 (75.8%) | 27 (100.0%) |
| 45 to 54 Years | 44 (66.7%) | 144 (93.5%) |
| 55 to 64 Years | 72 (100.0%) | 74 (76.3%) |
| 65 to 74 Years | 212 (100.0%) | 287 (100.0%) |
| 75 Years and over | 83 (100.0%) | 81 (91.0%) |
| Total | 559 (92.2%) | 736 (94.7%) |
Income Below Poverty Among Married-Couple Families in Sun Valley
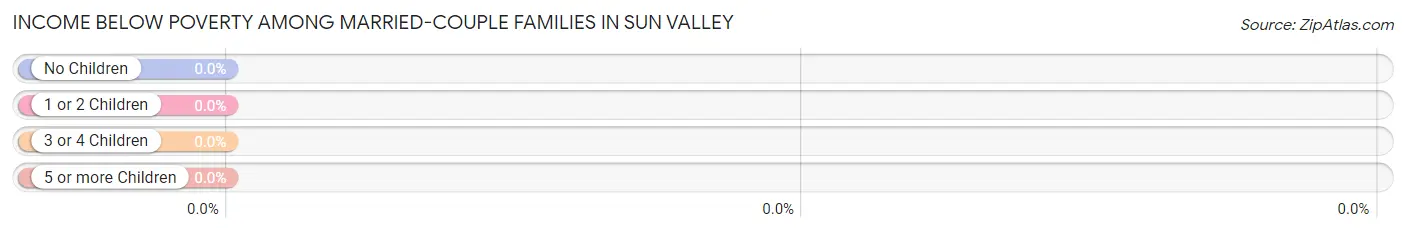
| Children | Above Poverty | Below Poverty |
| No Children | 266 (100.0%) | 0 (0.0%) |
| 1 or 2 Children | 21 (100.0%) | 0 (0.0%) |
| 3 or 4 Children | 0 (0.0%) | 0 (0.0%) |
| 5 or more Children | 0 (0.0%) | 0 (0.0%) |
| Total | 287 (100.0%) | 0 (0.0%) |
Income Below Poverty Among Single-Parent Households in Sun Valley
| Children | Single Father | Single Mother |
| No Children | 0 (0.0%) | 0 (0.0%) |
| 1 or 2 Children | 0 (0.0%) | 0 (0.0%) |
| 3 or 4 Children | 0 (0.0%) | 0 (0.0%) |
| 5 or more Children | 0 (0.0%) | 0 (0.0%) |
| Total | 0 (0.0%) | 0 (0.0%) |
Income Below Poverty Among Married-Couple vs Single-Parent Households in Sun Valley
| Children | Married-Couple Families | Single-Parent Households |
| No Children | 0 (0.0%) | 0 (0.0%) |
| 1 or 2 Children | 0 (0.0%) | 0 (0.0%) |
| 3 or 4 Children | 0 (0.0%) | 0 (0.0%) |
| 5 or more Children | 0 (0.0%) | 0 (0.0%) |
| Total | 0 (0.0%) | 0 (0.0%) |
Race in Sun Valley
The most populous races in Sun Valley are White / Caucasian (1,123 | 81.2%), Two or more Races (164 | 11.9%), and Hispanic or Latino (114 | 8.2%).
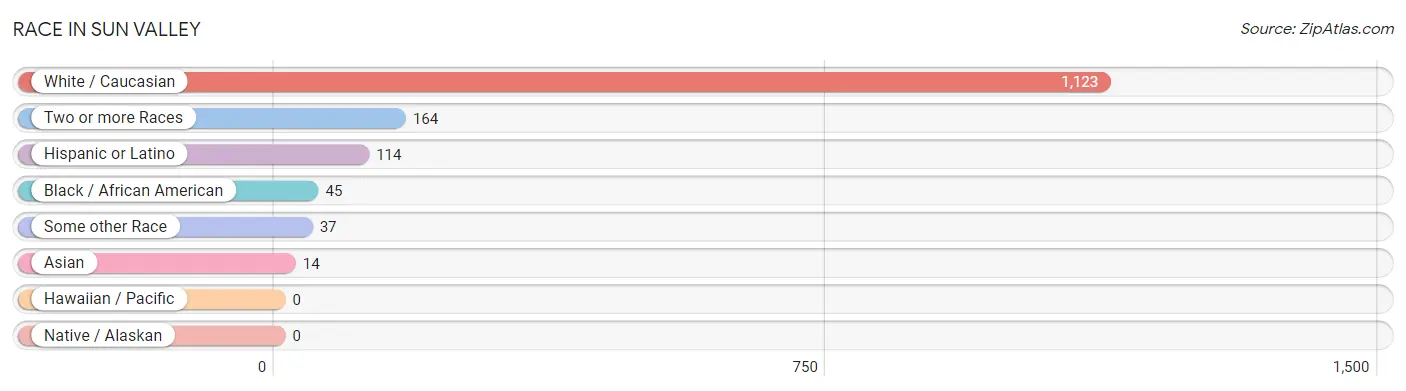
| Race | # Population | % Population |
| Asian | 14 | 1.0% |
| Black / African American | 45 | 3.3% |
| Hawaiian / Pacific | 0 | 0.0% |
| Hispanic or Latino | 114 | 8.2% |
| Native / Alaskan | 0 | 0.0% |
| White / Caucasian | 1,123 | 81.2% |
| Two or more Races | 164 | 11.9% |
| Some other Race | 37 | 2.7% |
| Total | 1,383 | 100.0% |
Ancestry in Sun Valley
The most populous ancestries reported in Sun Valley are German (254 | 18.4%), English (246 | 17.8%), Norwegian (118 | 8.5%), Mexican (100 | 7.2%), and Irish (89 | 6.4%), together accounting for 58.4% of all Sun Valley residents.
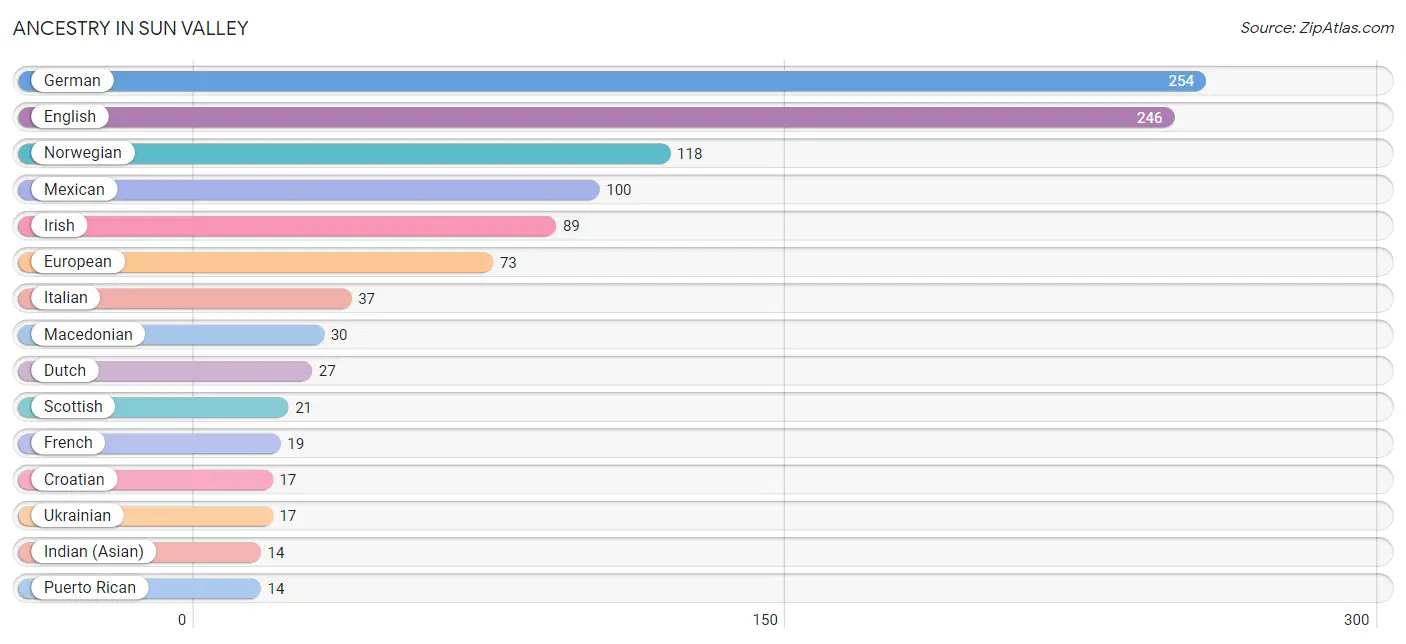
| Ancestry | # Population | % Population |
| Austrian | 12 | 0.9% |
| Cherokee | 10 | 0.7% |
| Croatian | 17 | 1.2% |
| Danish | 5 | 0.4% |
| Dutch | 27 | 1.9% |
| English | 246 | 17.8% |
| European | 73 | 5.3% |
| French | 19 | 1.4% |
| German | 254 | 18.4% |
| Indian (Asian) | 14 | 1.0% |
| Irish | 89 | 6.4% |
| Italian | 37 | 2.7% |
| Macedonian | 30 | 2.2% |
| Mexican | 100 | 7.2% |
| New Zealander | 9 | 0.6% |
| Norwegian | 118 | 8.5% |
| Puerto Rican | 14 | 1.0% |
| Scotch-Irish | 11 | 0.8% |
| Scottish | 21 | 1.5% |
| Sioux | 10 | 0.7% |
| Swedish | 11 | 0.8% |
| Swiss | 8 | 0.6% |
| Ukrainian | 17 | 1.2% | View All 23 Rows |
Immigrants in Sun Valley
The most numerous immigrant groups reported in Sun Valley came from Central America (90 | 6.5%), Latin America (90 | 6.5%), Mexico (90 | 6.5%), Eastern Europe (30 | 2.2%), and Europe (30 | 2.2%), together accounting for 23.9% of all Sun Valley residents.
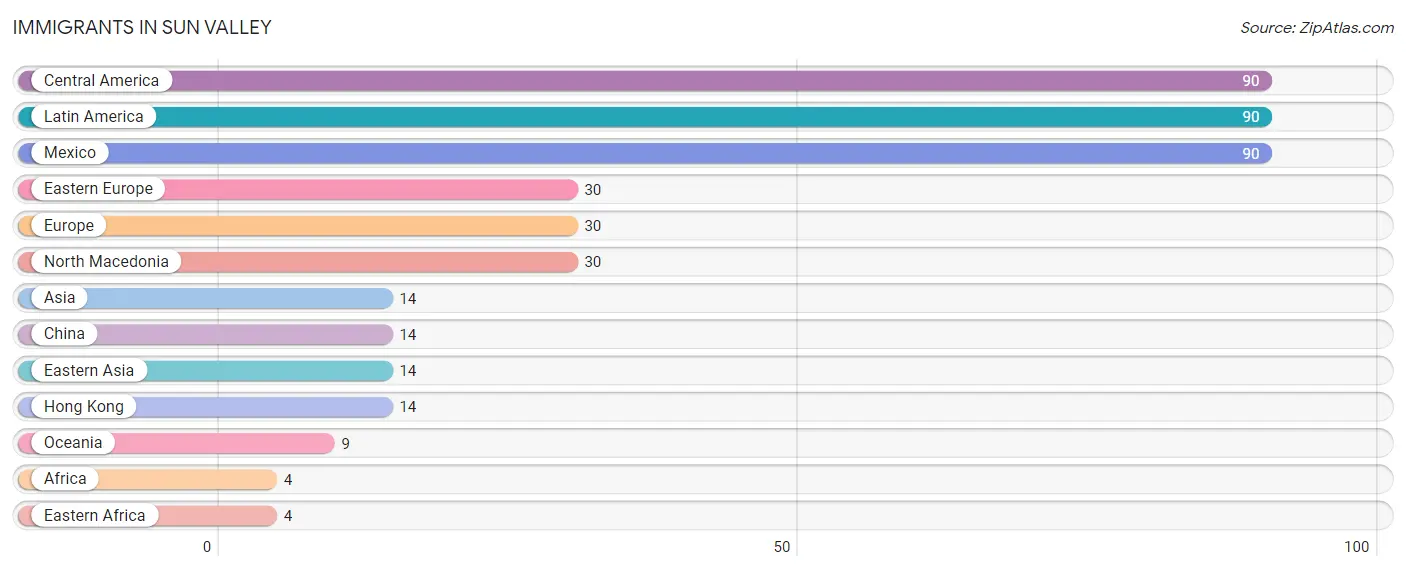
| Immigration Origin | # Population | % Population |
| Africa | 4 | 0.3% |
| Asia | 14 | 1.0% |
| Central America | 90 | 6.5% |
| China | 14 | 1.0% |
| Eastern Africa | 4 | 0.3% |
| Eastern Asia | 14 | 1.0% |
| Eastern Europe | 30 | 2.2% |
| Europe | 30 | 2.2% |
| Hong Kong | 14 | 1.0% |
| Latin America | 90 | 6.5% |
| Mexico | 90 | 6.5% |
| North Macedonia | 30 | 2.2% |
| Oceania | 9 | 0.6% | View All 13 Rows |
Sex and Age in Sun Valley
Sex and Age in Sun Valley
The most populous age groups in Sun Valley are 70 to 74 Years (112 | 18.5%) for men and 70 to 74 Years (183 | 23.5%) for women.
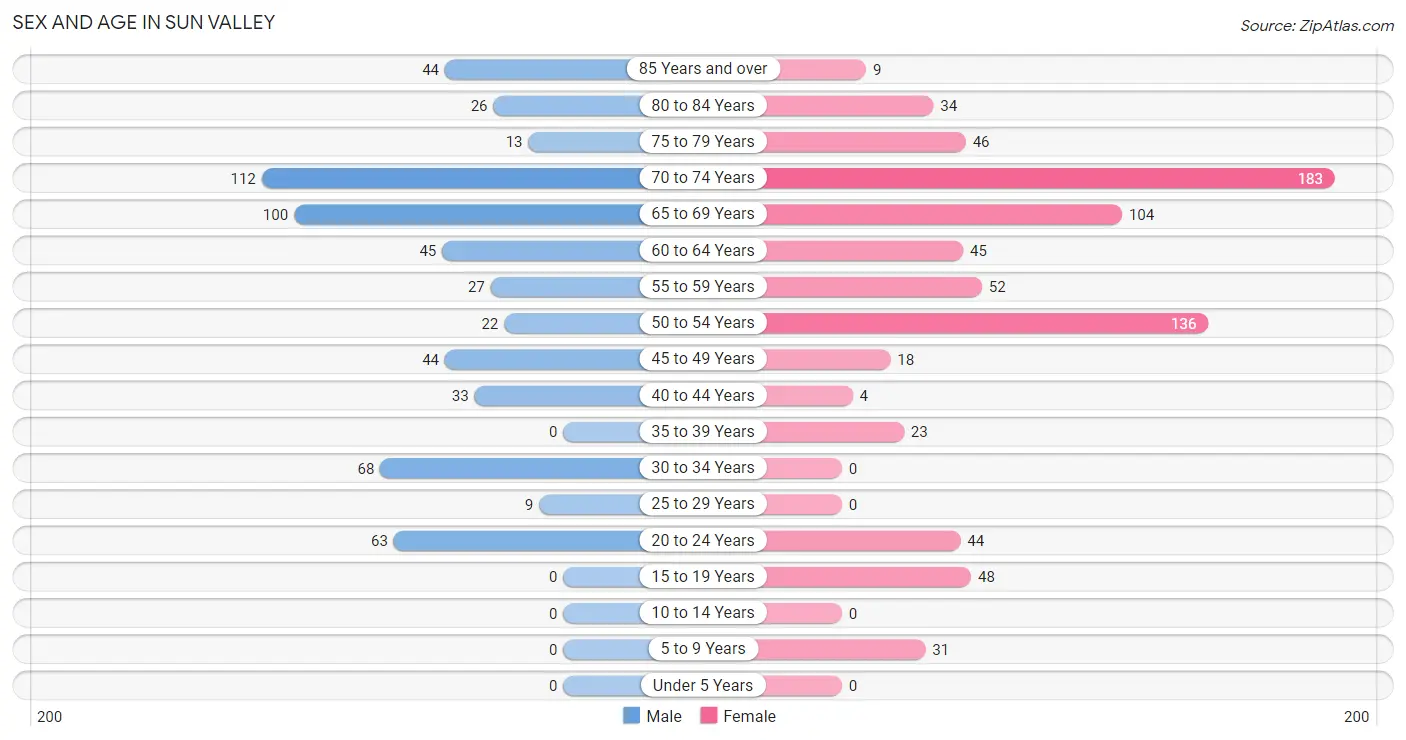
| Age Bracket | Male | Female |
| Under 5 Years | 0 (0.0%) | 0 (0.0%) |
| 5 to 9 Years | 0 (0.0%) | 31 (4.0%) |
| 10 to 14 Years | 0 (0.0%) | 0 (0.0%) |
| 15 to 19 Years | 0 (0.0%) | 48 (6.2%) |
| 20 to 24 Years | 63 (10.4%) | 44 (5.7%) |
| 25 to 29 Years | 9 (1.5%) | 0 (0.0%) |
| 30 to 34 Years | 68 (11.2%) | 0 (0.0%) |
| 35 to 39 Years | 0 (0.0%) | 23 (3.0%) |
| 40 to 44 Years | 33 (5.4%) | 4 (0.5%) |
| 45 to 49 Years | 44 (7.3%) | 18 (2.3%) |
| 50 to 54 Years | 22 (3.6%) | 136 (17.5%) |
| 55 to 59 Years | 27 (4.5%) | 52 (6.7%) |
| 60 to 64 Years | 45 (7.4%) | 45 (5.8%) |
| 65 to 69 Years | 100 (16.5%) | 104 (13.4%) |
| 70 to 74 Years | 112 (18.5%) | 183 (23.5%) |
| 75 to 79 Years | 13 (2.1%) | 46 (5.9%) |
| 80 to 84 Years | 26 (4.3%) | 34 (4.4%) |
| 85 Years and over | 44 (7.3%) | 9 (1.2%) |
| Total | 606 (100.0%) | 777 (100.0%) |
Families and Households in Sun Valley
Median Family Size in Sun Valley
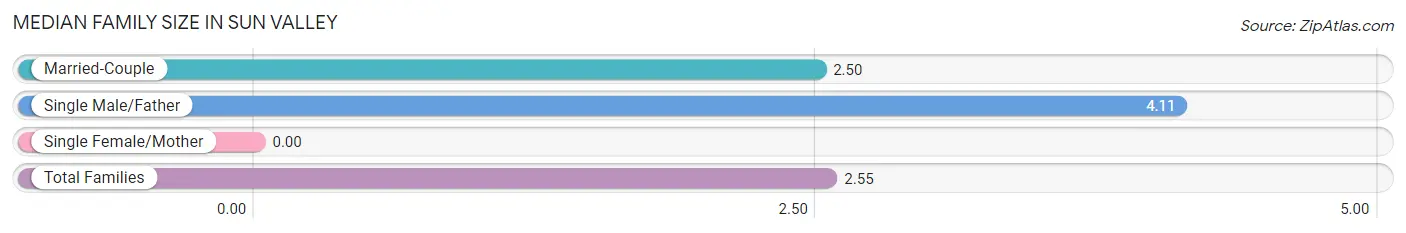
| Family Type | # Families | Family Size |
| Married-Couple | 287 (97.0%) | 2.50 |
| Single Male/Father | 9 (3.0%) | 4.11 |
| Single Female/Mother | 0 (0.0%) | - |
| Total Families | 296 (100.0%) | 2.55 |
Median Household Size in Sun Valley
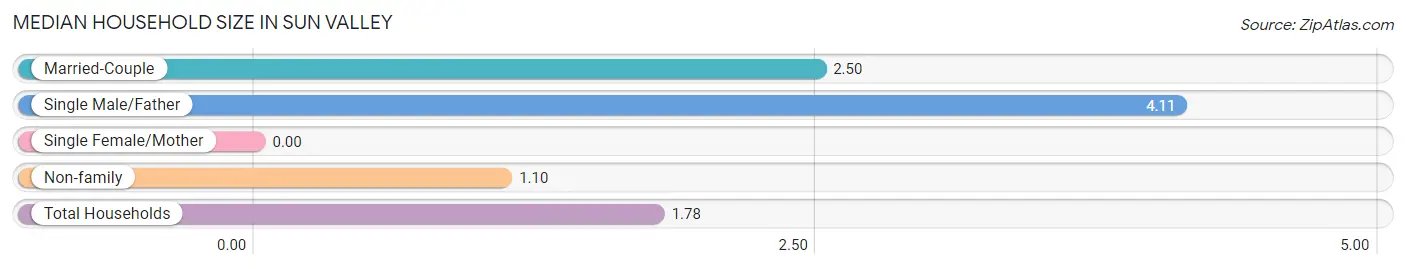
| Household Type | # Households | Household Size |
| Married-Couple | 287 (45.3%) | 2.50 |
| Single Male/Father | 9 (1.4%) | 4.11 |
| Single Female/Mother | 0 (0.0%) | - |
| Non-family | 338 (53.3%) | 1.10 |
| Total Households | 634 (100.0%) | 1.78 |
Household Size by Marriage Status in Sun Valley
Out of a total of 634 households in Sun Valley, 296 (46.7%) are family households, while 338 (53.3%) are nonfamily households. The most numerous type of family households are 2-person households, comprising 275, and the most common type of nonfamily households are 1-person households, comprising 303.
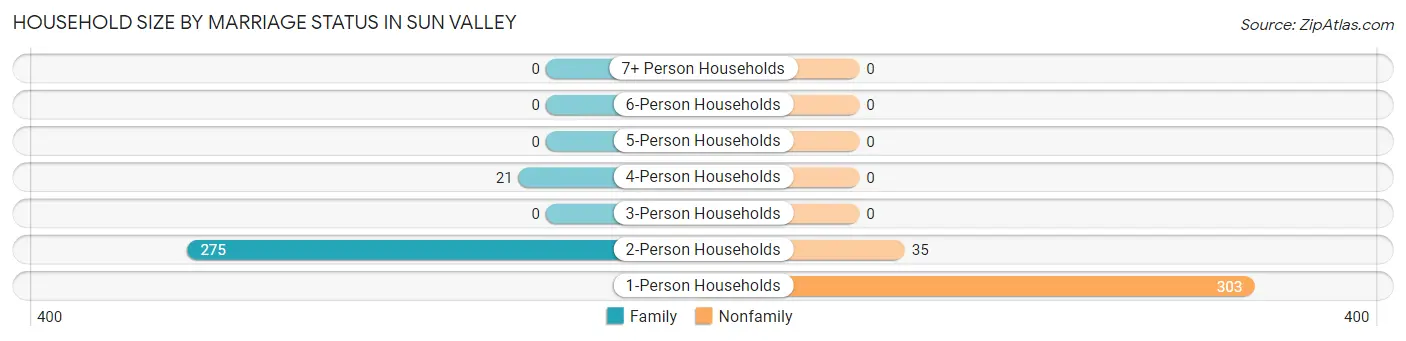
| Household Size | Family Households | Nonfamily Households |
| 1-Person Households | - | 303 (47.8%) |
| 2-Person Households | 275 (43.4%) | 35 (5.5%) |
| 3-Person Households | 0 (0.0%) | 0 (0.0%) |
| 4-Person Households | 21 (3.3%) | 0 (0.0%) |
| 5-Person Households | 0 (0.0%) | 0 (0.0%) |
| 6-Person Households | 0 (0.0%) | 0 (0.0%) |
| 7+ Person Households | 0 (0.0%) | 0 (0.0%) |
| Total | 296 (46.7%) | 338 (53.3%) |
Female Fertility in Sun Valley
Fertility by Age in Sun Valley
| Age Bracket | Women with Births | Births / 1,000 Women |
| 15 to 19 years | 0 (0.0%) | 0.0 |
| 20 to 34 years | 0 (0.0%) | 0.0 |
| 35 to 50 years | 0 (0.0%) | 0.0 |
| Total | 0 (0.0%) | 0.0 |
Fertility by Age by Marriage Status in Sun Valley
| Age Bracket | Married | Unmarried |
| 15 to 19 years | 0 (0.0%) | 0 (0.0%) |
| 20 to 34 years | 0 (0.0%) | 0 (0.0%) |
| 35 to 50 years | 0 (0.0%) | 0 (0.0%) |
| Total | 0 (0.0%) | 0 (0.0%) |
Fertility by Education in Sun Valley
| Educational Attainment | Women with Births | Births / 1,000 Women |
| Less than High School | 0 (0.0%) | 0.0 |
| High School Diploma | 0 (0.0%) | 0.0 |
| College or Associate's Degree | 0 (0.0%) | 0.0 |
| Bachelor's Degree | 0 (0.0%) | 0.0 |
| Graduate Degree | 0 (0.0%) | 0.0 |
| Total | 0 (0.0%) | 0.0 |
Fertility by Education by Marriage Status in Sun Valley
| Educational Attainment | Married | Unmarried |
| Less than High School | 0 (0.0%) | 0 (0.0%) |
| High School Diploma | 0 (0.0%) | 0 (0.0%) |
| College or Associate's Degree | 0 (0.0%) | 0 (0.0%) |
| Bachelor's Degree | 0 (0.0%) | 0 (0.0%) |
| Graduate Degree | 0 (0.0%) | 0 (0.0%) |
| Total | 0 (0.0%) | 0 (0.0%) |
Employment Characteristics in Sun Valley
Employment by Class of Employer in Sun Valley
Among the 868 employed individuals in Sun Valley, private company employees (346 | 39.9%), self-employed (incorporated) (277 | 31.9%), and self-employed (not incorporated) (101 | 11.6%) make up the most common classes of employment.
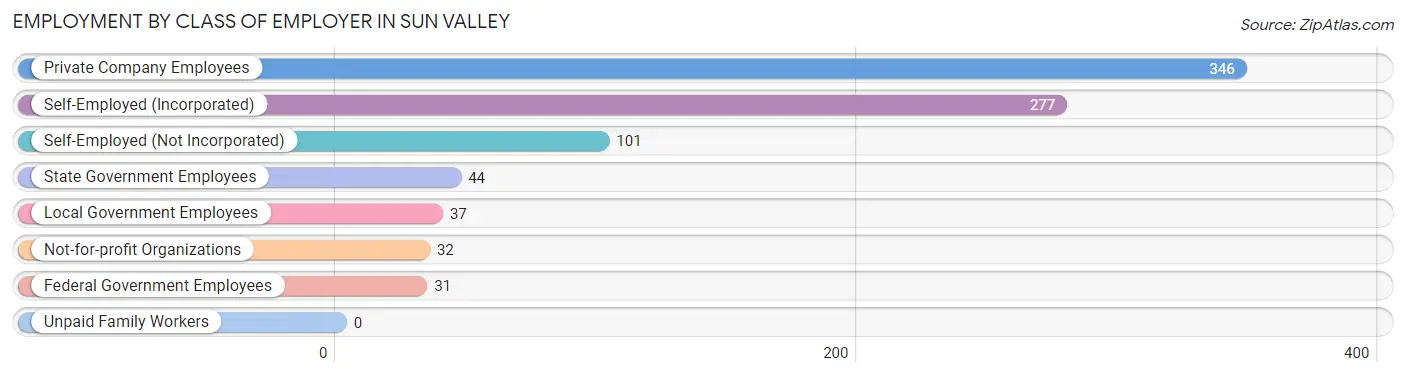
| Employer Class | # Employees | % Employees |
| Private Company Employees | 346 | 39.9% |
| Self-Employed (Incorporated) | 277 | 31.9% |
| Self-Employed (Not Incorporated) | 101 | 11.6% |
| Not-for-profit Organizations | 32 | 3.7% |
| Local Government Employees | 37 | 4.3% |
| State Government Employees | 44 | 5.1% |
| Federal Government Employees | 31 | 3.6% |
| Unpaid Family Workers | 0 | 0.0% |
| Total | 868 | 100.0% |
Employment Status by Age in Sun Valley
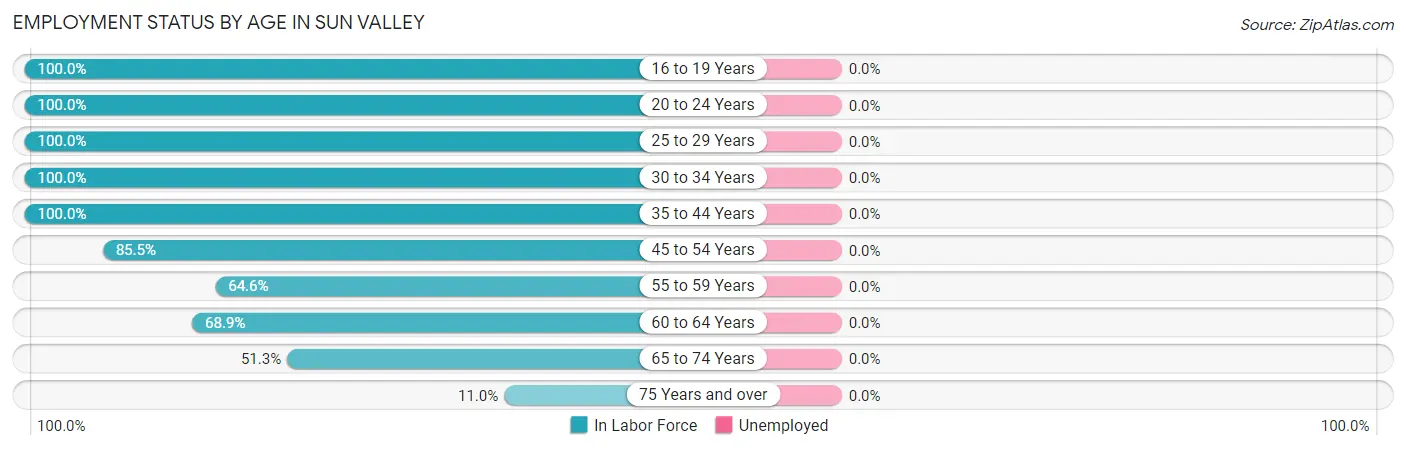
| Age Bracket | In Labor Force | Unemployed |
| 16 to 19 Years | 48 (100.0%) | 0 (0.0%) |
| 20 to 24 Years | 107 (100.0%) | 0 (0.0%) |
| 25 to 29 Years | 9 (100.0%) | 0 (0.0%) |
| 30 to 34 Years | 68 (100.0%) | 0 (0.0%) |
| 35 to 44 Years | 60 (100.0%) | 0 (0.0%) |
| 45 to 54 Years | 188 (85.5%) | 0 (0.0%) |
| 55 to 59 Years | 51 (64.6%) | 0 (0.0%) |
| 60 to 64 Years | 62 (68.9%) | 0 (0.0%) |
| 65 to 74 Years | 256 (51.3%) | 0 (0.0%) |
| 75 Years and over | 19 (11.0%) | 0 (0.0%) |
| Total | 868 (64.2%) | 0 (0.0%) |
Employment Status by Educational Attainment in Sun Valley

| Educational Attainment | In Labor Force | Unemployed |
| Less than High School | 33 (55.9%) | 0 (0.0%) |
| High School Diploma | 25 (53.2%) | 0 (0.0%) |
| College / Associate Degree | 110 (100.0%) | 0 (0.0%) |
| Bachelor's Degree or higher | 270 (87.1%) | 0 (0.0%) |
| Total | 438 (83.3%) | 0 (0.0%) |
Employment Occupations by Sex in Sun Valley
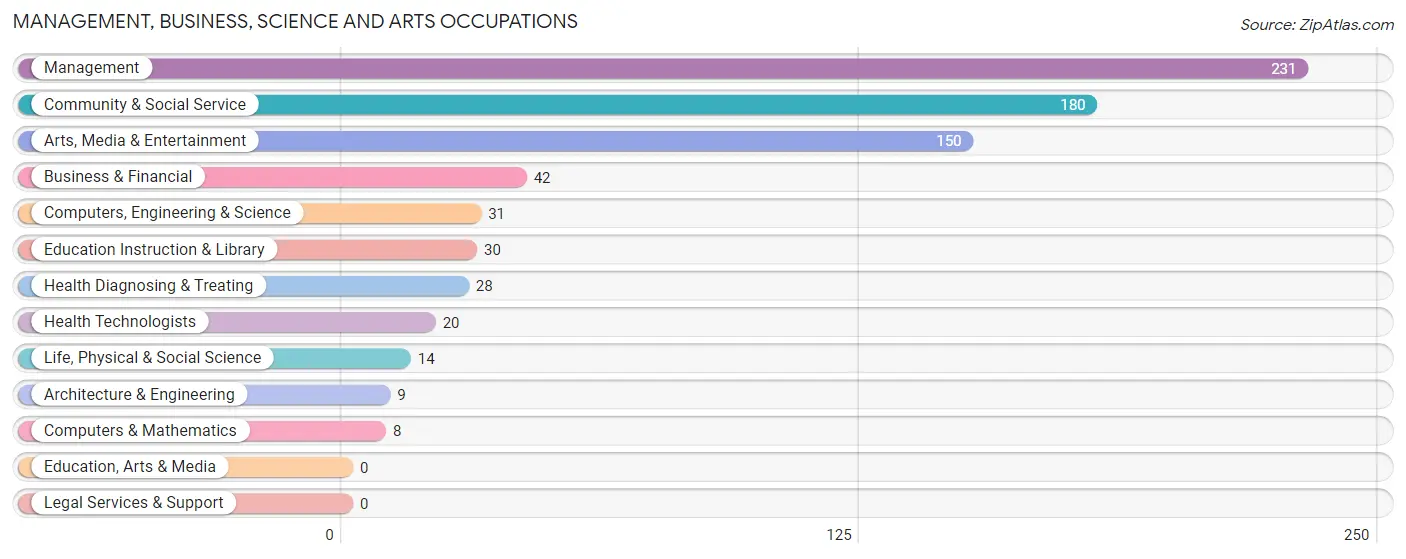
Management, Business, Science and Arts Occupations
The most common Management, Business, Science and Arts occupations in Sun Valley are Management (231 | 26.6%), Community & Social Service (180 | 20.7%), Arts, Media & Entertainment (150 | 17.3%), Business & Financial (42 | 4.8%), and Computers, Engineering & Science (31 | 3.6%).
Management, Business, Science and Arts Occupations by Sex
Within the Management, Business, Science and Arts occupations in Sun Valley, the most male-oriented occupations are Computers & Mathematics (100.0%), Architecture & Engineering (100.0%), and Computers, Engineering & Science (54.8%), while the most female-oriented occupations are Life, Physical & Social Science (100.0%), Education Instruction & Library (100.0%), and Community & Social Service (93.3%).
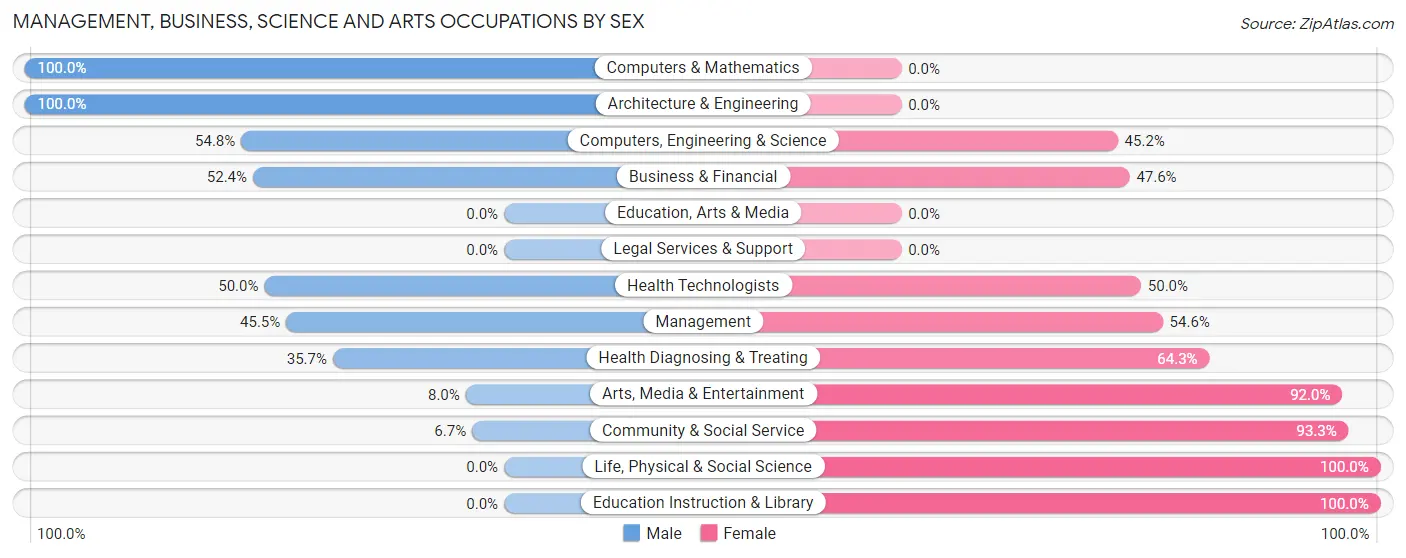
| Occupation | Male | Female |
| Management | 105 (45.5%) | 126 (54.5%) |
| Business & Financial | 22 (52.4%) | 20 (47.6%) |
| Computers, Engineering & Science | 17 (54.8%) | 14 (45.2%) |
| Computers & Mathematics | 8 (100.0%) | 0 (0.0%) |
| Architecture & Engineering | 9 (100.0%) | 0 (0.0%) |
| Life, Physical & Social Science | 0 (0.0%) | 14 (100.0%) |
| Community & Social Service | 12 (6.7%) | 168 (93.3%) |
| Education, Arts & Media | 0 (0.0%) | 0 (0.0%) |
| Legal Services & Support | 0 (0.0%) | 0 (0.0%) |
| Education Instruction & Library | 0 (0.0%) | 30 (100.0%) |
| Arts, Media & Entertainment | 12 (8.0%) | 138 (92.0%) |
| Health Diagnosing & Treating | 10 (35.7%) | 18 (64.3%) |
| Health Technologists | 10 (50.0%) | 10 (50.0%) |
| Total (Category) | 166 (32.4%) | 346 (67.6%) |
| Total (Overall) | 355 (40.9%) | 513 (59.1%) |
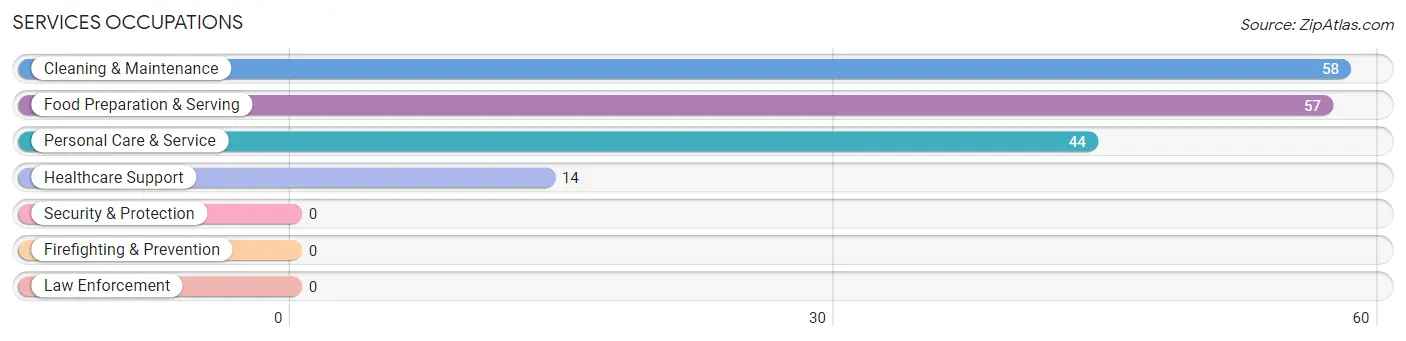
Services Occupations
The most common Services occupations in Sun Valley are Cleaning & Maintenance (58 | 6.7%), Food Preparation & Serving (57 | 6.6%), Personal Care & Service (44 | 5.1%), and Healthcare Support (14 | 1.6%).
Services Occupations by Sex
Within the Services occupations in Sun Valley, the most male-oriented occupations are Personal Care & Service (72.7%), Cleaning & Maintenance (51.7%), and Food Preparation & Serving (15.8%), while the most female-oriented occupations are Healthcare Support (100.0%), Food Preparation & Serving (84.2%), and Cleaning & Maintenance (48.3%).
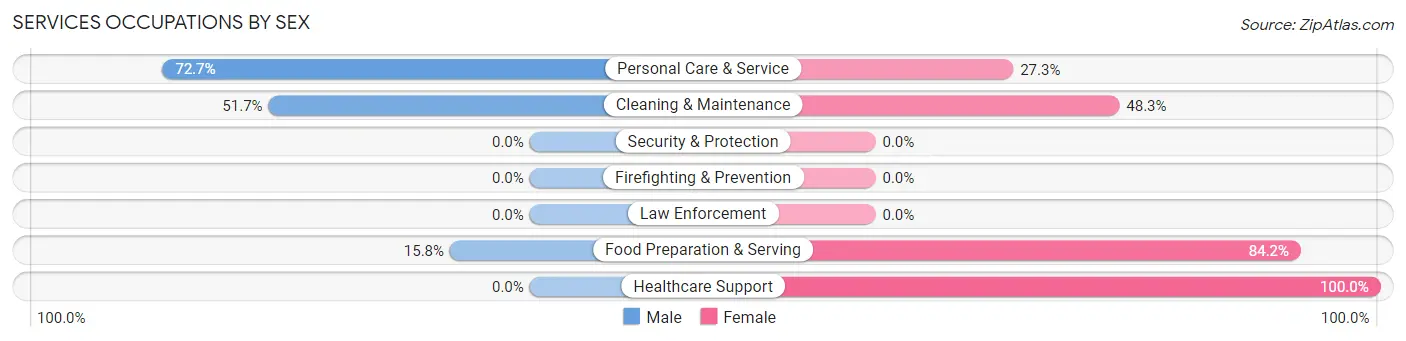
| Occupation | Male | Female |
| Healthcare Support | 0 (0.0%) | 14 (100.0%) |
| Security & Protection | 0 (0.0%) | 0 (0.0%) |
| Firefighting & Prevention | 0 (0.0%) | 0 (0.0%) |
| Law Enforcement | 0 (0.0%) | 0 (0.0%) |
| Food Preparation & Serving | 9 (15.8%) | 48 (84.2%) |
| Cleaning & Maintenance | 30 (51.7%) | 28 (48.3%) |
| Personal Care & Service | 32 (72.7%) | 12 (27.3%) |
| Total (Category) | 71 (41.0%) | 102 (59.0%) |
| Total (Overall) | 355 (40.9%) | 513 (59.1%) |
Sales and Office Occupations
The most common Sales and Office occupations in Sun Valley are Office & Administration (65 | 7.5%), and Sales & Related (33 | 3.8%).
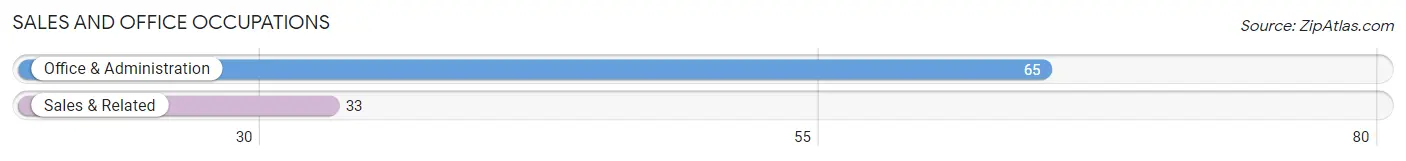
Sales and Office Occupations by Sex
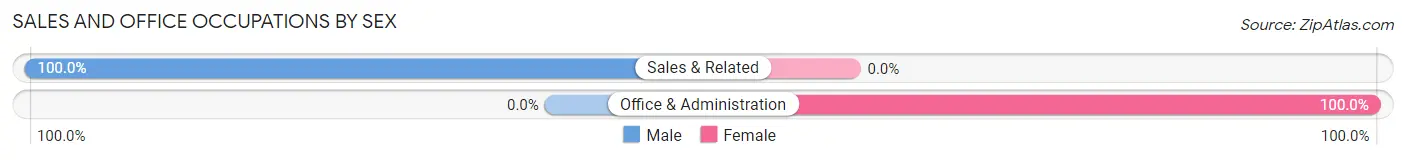
| Occupation | Male | Female |
| Sales & Related | 33 (100.0%) | 0 (0.0%) |
| Office & Administration | 0 (0.0%) | 65 (100.0%) |
| Total (Category) | 33 (33.7%) | 65 (66.3%) |
| Total (Overall) | 355 (40.9%) | 513 (59.1%) |
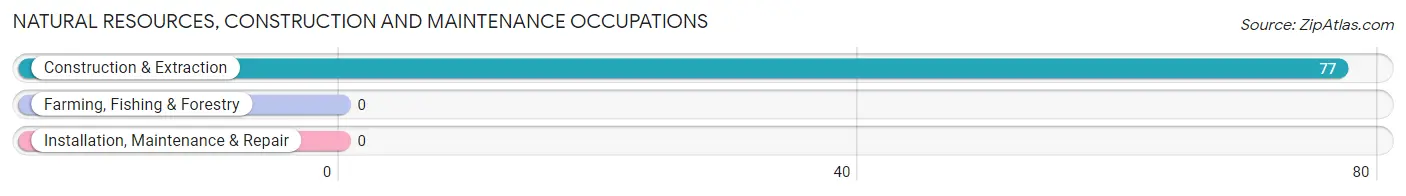
Natural Resources, Construction and Maintenance Occupations
The most common Natural Resources, Construction and Maintenance occupations in Sun Valley are , and Construction & Extraction (77 | 8.9%).
Natural Resources, Construction and Maintenance Occupations by Sex
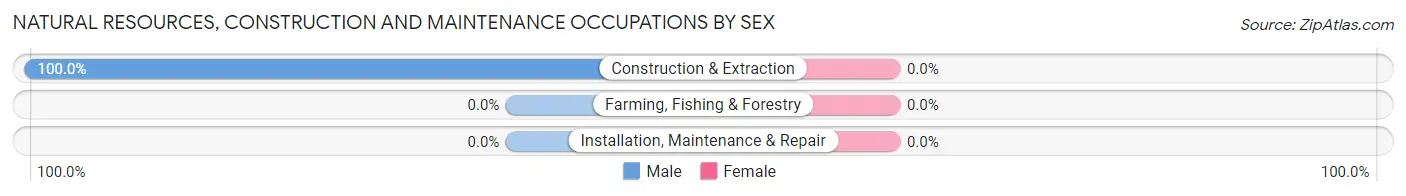
| Occupation | Male | Female |
| Farming, Fishing & Forestry | 0 (0.0%) | 0 (0.0%) |
| Construction & Extraction | 77 (100.0%) | 0 (0.0%) |
| Installation, Maintenance & Repair | 0 (0.0%) | 0 (0.0%) |
| Total (Category) | 77 (100.0%) | 0 (0.0%) |
| Total (Overall) | 355 (40.9%) | 513 (59.1%) |
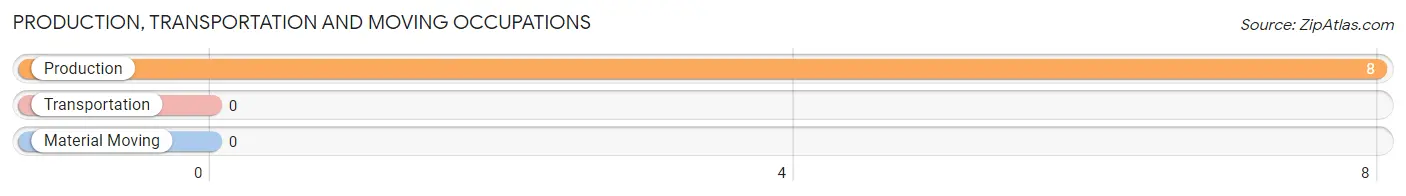
Production, Transportation and Moving Occupations
The most common Production, Transportation and Moving occupations in Sun Valley are , and Production (8 | 0.9%).
Production, Transportation and Moving Occupations by Sex
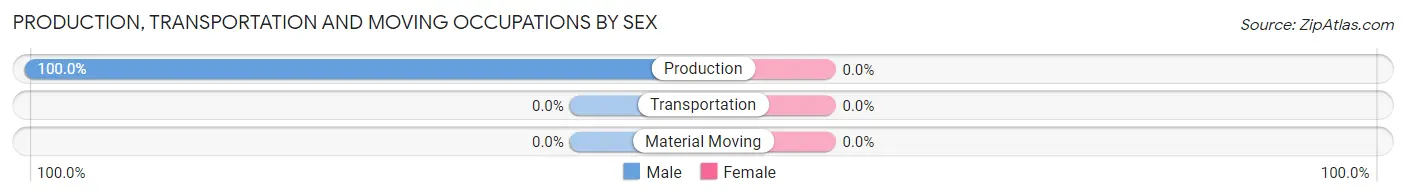
| Occupation | Male | Female |
| Production | 8 (100.0%) | 0 (0.0%) |
| Transportation | 0 (0.0%) | 0 (0.0%) |
| Material Moving | 0 (0.0%) | 0 (0.0%) |
| Total (Category) | 8 (100.0%) | 0 (0.0%) |
| Total (Overall) | 355 (40.9%) | 513 (59.1%) |
Employment Industries by Sex in Sun Valley
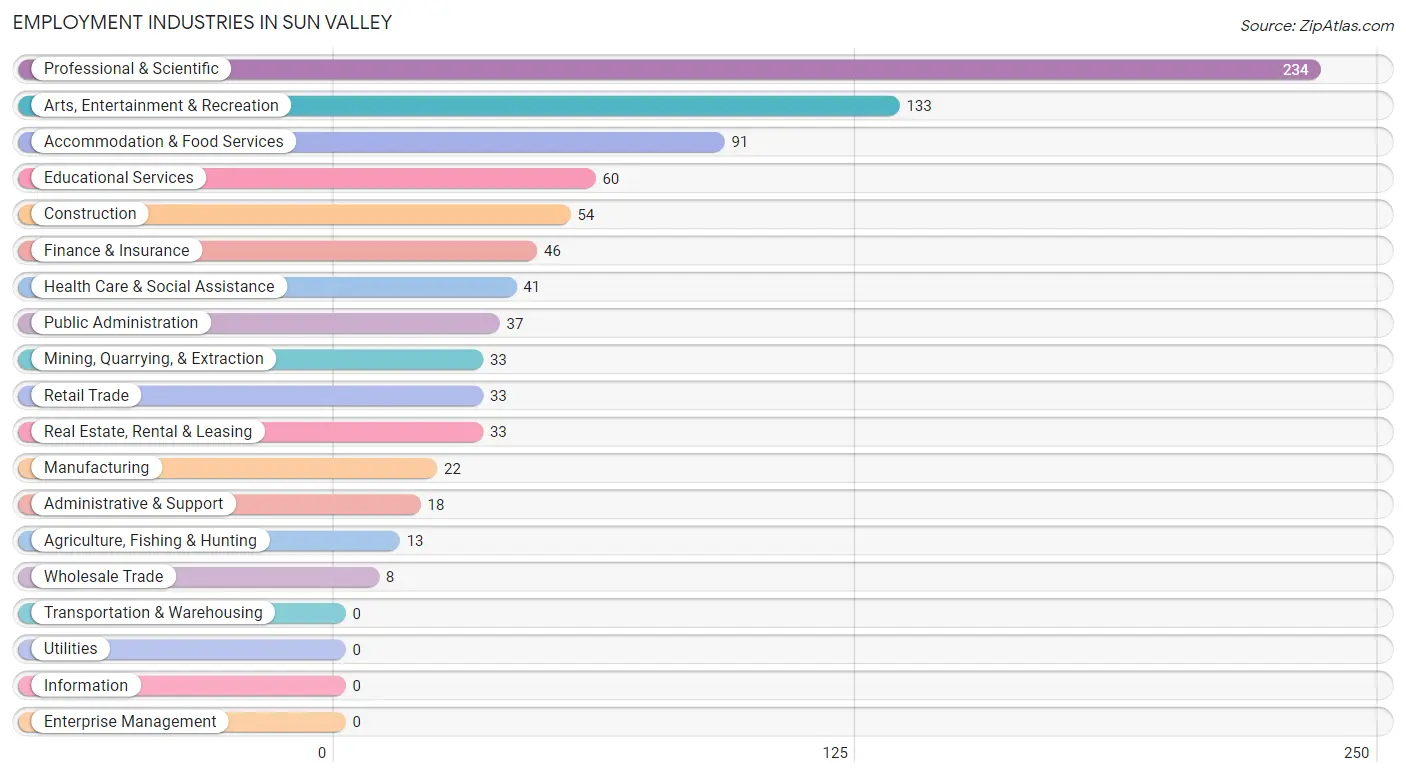
Employment Industries in Sun Valley
The major employment industries in Sun Valley include Professional & Scientific (234 | 27.0%), Arts, Entertainment & Recreation (133 | 15.3%), Accommodation & Food Services (91 | 10.5%), Educational Services (60 | 6.9%), and Construction (54 | 6.2%).
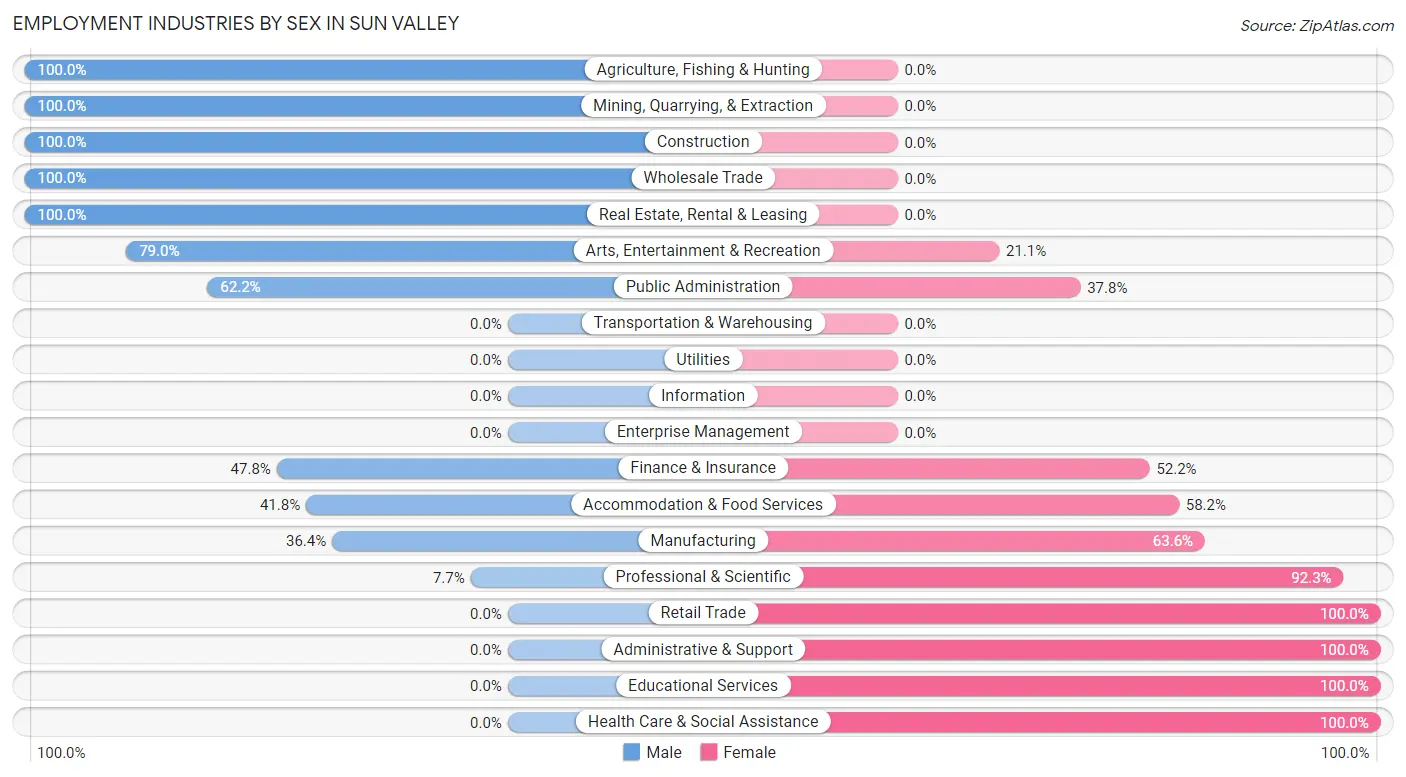
Employment Industries by Sex in Sun Valley
The Sun Valley industries that see more men than women are Agriculture, Fishing & Hunting (100.0%), Mining, Quarrying, & Extraction (100.0%), and Construction (100.0%), whereas the industries that tend to have a higher number of women are Retail Trade (100.0%), Administrative & Support (100.0%), and Educational Services (100.0%).
| Industry | Male | Female |
| Agriculture, Fishing & Hunting | 13 (100.0%) | 0 (0.0%) |
| Mining, Quarrying, & Extraction | 33 (100.0%) | 0 (0.0%) |
| Construction | 54 (100.0%) | 0 (0.0%) |
| Manufacturing | 8 (36.4%) | 14 (63.6%) |
| Wholesale Trade | 8 (100.0%) | 0 (0.0%) |
| Retail Trade | 0 (0.0%) | 33 (100.0%) |
| Transportation & Warehousing | 0 (0.0%) | 0 (0.0%) |
| Utilities | 0 (0.0%) | 0 (0.0%) |
| Information | 0 (0.0%) | 0 (0.0%) |
| Finance & Insurance | 22 (47.8%) | 24 (52.2%) |
| Real Estate, Rental & Leasing | 33 (100.0%) | 0 (0.0%) |
| Professional & Scientific | 18 (7.7%) | 216 (92.3%) |
| Enterprise Management | 0 (0.0%) | 0 (0.0%) |
| Administrative & Support | 0 (0.0%) | 18 (100.0%) |
| Educational Services | 0 (0.0%) | 60 (100.0%) |
| Health Care & Social Assistance | 0 (0.0%) | 41 (100.0%) |
| Arts, Entertainment & Recreation | 105 (78.9%) | 28 (21.0%) |
| Accommodation & Food Services | 38 (41.8%) | 53 (58.2%) |
| Public Administration | 23 (62.2%) | 14 (37.8%) |
| Total | 355 (40.9%) | 513 (59.1%) |
Education in Sun Valley
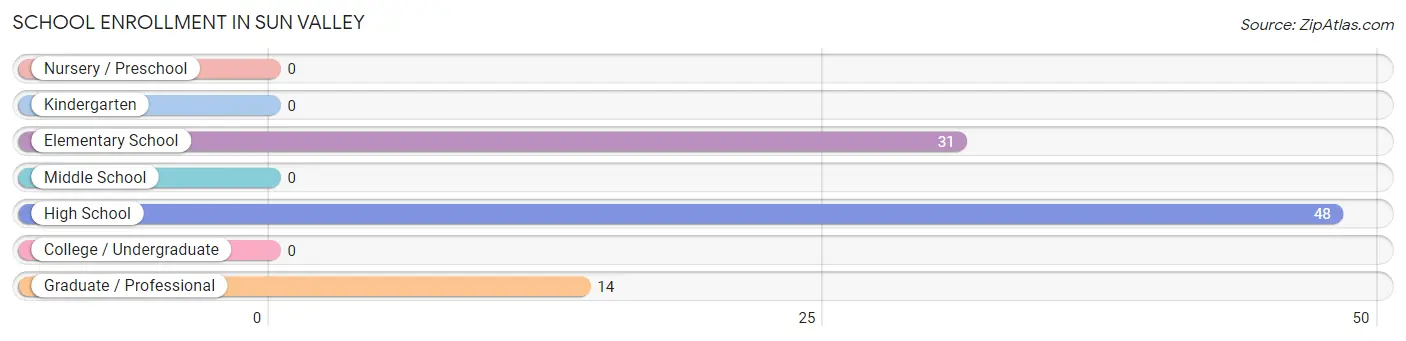
School Enrollment in Sun Valley
The most common levels of schooling among the 93 students in Sun Valley are high school (48 | 51.6%), elementary school (31 | 33.3%), and graduate / professional (14 | 15.0%).
| School Level | # Students | % Students |
| Nursery / Preschool | 0 | 0.0% |
| Kindergarten | 0 | 0.0% |
| Elementary School | 31 | 33.3% |
| Middle School | 0 | 0.0% |
| High School | 48 | 51.6% |
| College / Undergraduate | 0 | 0.0% |
| Graduate / Professional | 14 | 15.0% |
| Total | 93 | 100.0% |
School Enrollment by Age by Funding Source in Sun Valley
Out of a total of 93 students who are enrolled in schools in Sun Valley, 48 (51.6%) attend a private institution, while the remaining 45 (48.4%) are enrolled in public schools. The age group of 15 to 17 year olds has the highest likelihood of being enrolled in private schools, with 48 (100.0% in the age bracket) enrolled. Conversely, the age group of 5 to 9 year old has the lowest likelihood of being enrolled in a private school, with 31 (100.0% in the age bracket) attending a public institution.
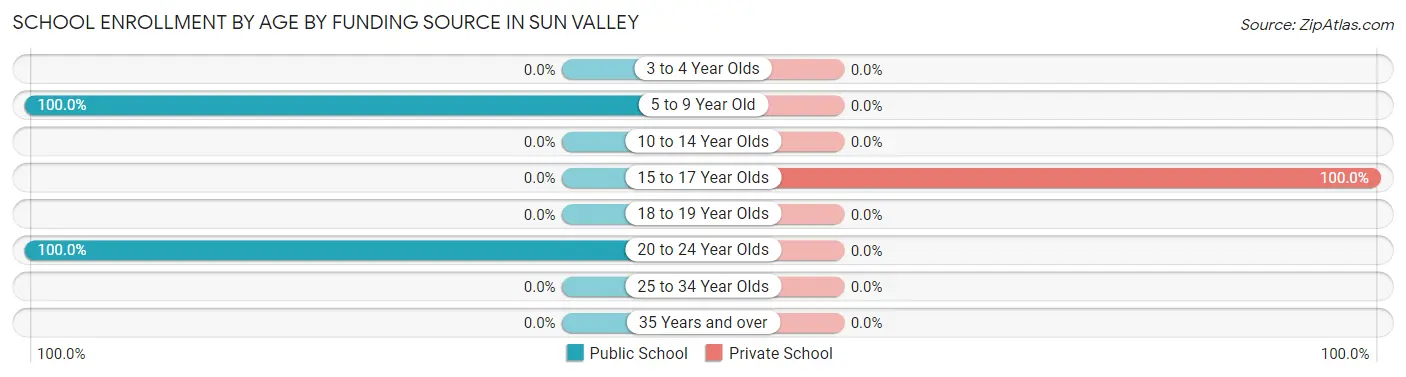
| Age Bracket | Public School | Private School |
| 3 to 4 Year Olds | 0 (0.0%) | 0 (0.0%) |
| 5 to 9 Year Old | 31 (100.0%) | 0 (0.0%) |
| 10 to 14 Year Olds | 0 (0.0%) | 0 (0.0%) |
| 15 to 17 Year Olds | 0 (0.0%) | 48 (100.0%) |
| 18 to 19 Year Olds | 0 (0.0%) | 0 (0.0%) |
| 20 to 24 Year Olds | 14 (100.0%) | 0 (0.0%) |
| 25 to 34 Year Olds | 0 (0.0%) | 0 (0.0%) |
| 35 Years and over | 0 (0.0%) | 0 (0.0%) |
| Total | 45 (48.4%) | 48 (51.6%) |
Educational Attainment by Field of Study in Sun Valley
Literature & languages (218 | 20.9%), education (211 | 20.2%), social sciences (138 | 13.2%), communications (128 | 12.2%), and business (124 | 11.9%) are the most common fields of study among 1,045 individuals in Sun Valley who have obtained a bachelor's degree or higher.
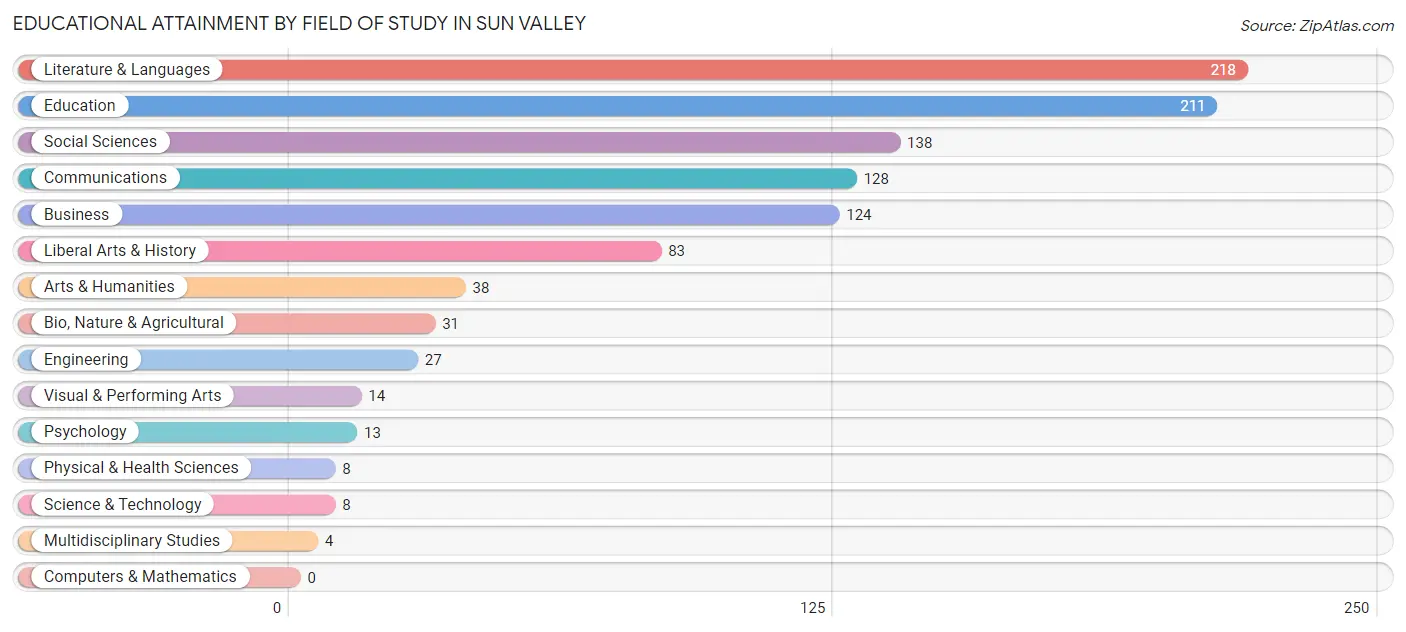
| Field of Study | # Graduates | % Graduates |
| Computers & Mathematics | 0 | 0.0% |
| Bio, Nature & Agricultural | 31 | 3.0% |
| Physical & Health Sciences | 8 | 0.8% |
| Psychology | 13 | 1.2% |
| Social Sciences | 138 | 13.2% |
| Engineering | 27 | 2.6% |
| Multidisciplinary Studies | 4 | 0.4% |
| Science & Technology | 8 | 0.8% |
| Business | 124 | 11.9% |
| Education | 211 | 20.2% |
| Literature & Languages | 218 | 20.9% |
| Liberal Arts & History | 83 | 7.9% |
| Visual & Performing Arts | 14 | 1.3% |
| Communications | 128 | 12.2% |
| Arts & Humanities | 38 | 3.6% |
| Total | 1,045 | 100.0% |
Transportation & Commute in Sun Valley
Vehicle Availability by Sex in Sun Valley
The most prevalent vehicle ownership categories in Sun Valley are males with 2 vehicles (125, accounting for 70.6%) and females with 2 vehicles (164, making up 25.9%).
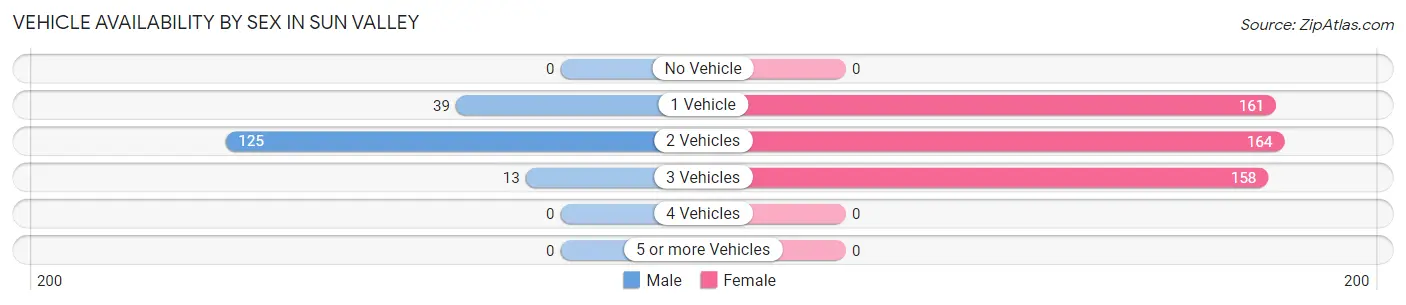
| Vehicles Available | Male | Female |
| No Vehicle | 0 (0.0%) | 0 (0.0%) |
| 1 Vehicle | 39 (22.0%) | 161 (33.3%) |
| 2 Vehicles | 125 (70.6%) | 164 (34.0%) |
| 3 Vehicles | 13 (7.3%) | 158 (32.7%) |
| 4 Vehicles | 0 (0.0%) | 0 (0.0%) |
| 5 or more Vehicles | 0 (0.0%) | 0 (0.0%) |
| Total | 177 (100.0%) | 483 (100.0%) |
Commute Time in Sun Valley
The most frequently occuring commute durations in Sun Valley are 10 to 14 minutes (345 commuters, 51.3%), less than 5 minutes (77 commuters, 11.4%), and 15 to 19 minutes (69 commuters, 10.2%).
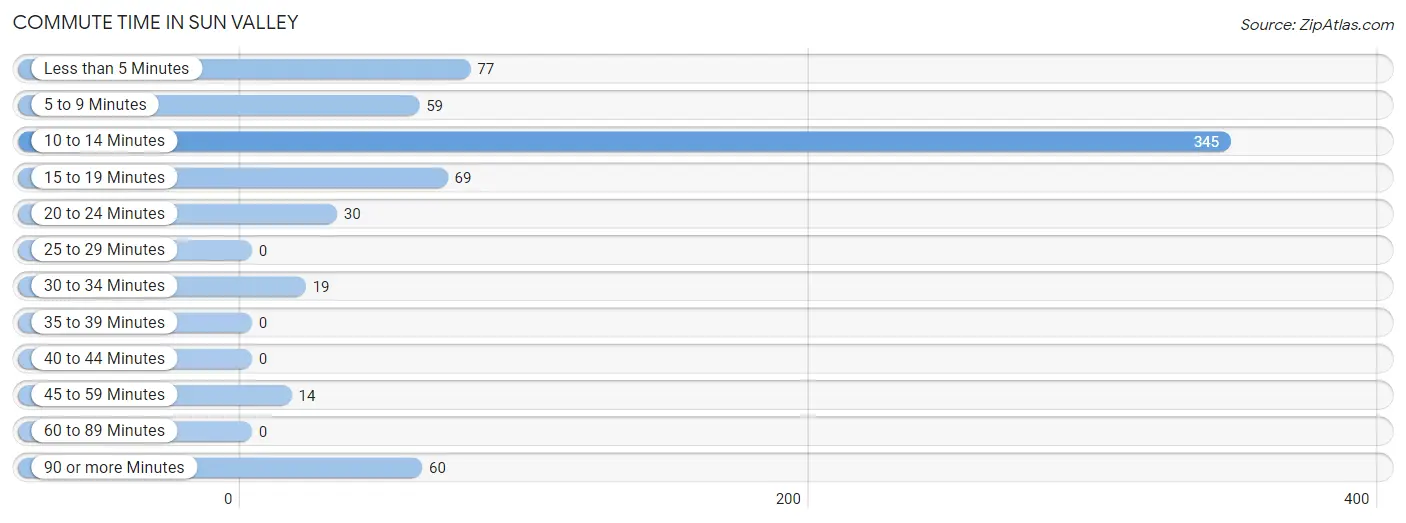
| Commute Time | # Commuters | % Commuters |
| Less than 5 Minutes | 77 | 11.4% |
| 5 to 9 Minutes | 59 | 8.8% |
| 10 to 14 Minutes | 345 | 51.3% |
| 15 to 19 Minutes | 69 | 10.2% |
| 20 to 24 Minutes | 30 | 4.5% |
| 25 to 29 Minutes | 0 | 0.0% |
| 30 to 34 Minutes | 19 | 2.8% |
| 35 to 39 Minutes | 0 | 0.0% |
| 40 to 44 Minutes | 0 | 0.0% |
| 45 to 59 Minutes | 14 | 2.1% |
| 60 to 89 Minutes | 0 | 0.0% |
| 90 or more Minutes | 60 | 8.9% |
Commute Time by Sex in Sun Valley
The most common commute times in Sun Valley are 90 or more minutes (60 commuters, 27.7%) for males and 10 to 14 minutes (300 commuters, 65.8%) for females.
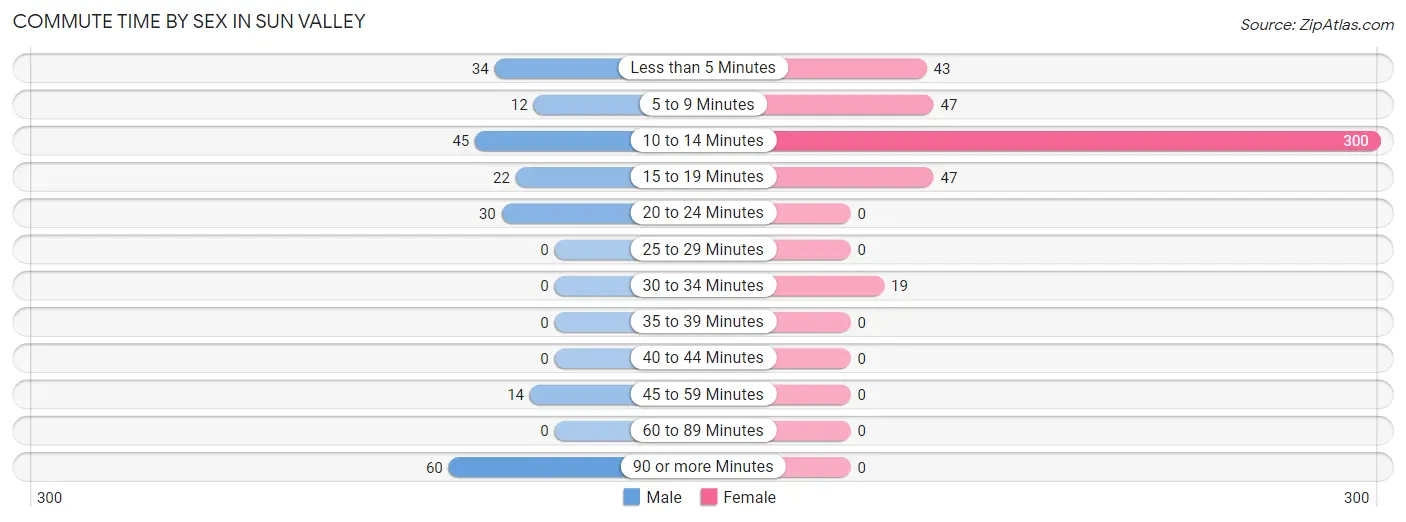
| Commute Time | Male | Female |
| Less than 5 Minutes | 34 (15.7%) | 43 (9.4%) |
| 5 to 9 Minutes | 12 (5.5%) | 47 (10.3%) |
| 10 to 14 Minutes | 45 (20.7%) | 300 (65.8%) |
| 15 to 19 Minutes | 22 (10.1%) | 47 (10.3%) |
| 20 to 24 Minutes | 30 (13.8%) | 0 (0.0%) |
| 25 to 29 Minutes | 0 (0.0%) | 0 (0.0%) |
| 30 to 34 Minutes | 0 (0.0%) | 19 (4.2%) |
| 35 to 39 Minutes | 0 (0.0%) | 0 (0.0%) |
| 40 to 44 Minutes | 0 (0.0%) | 0 (0.0%) |
| 45 to 59 Minutes | 14 (6.5%) | 0 (0.0%) |
| 60 to 89 Minutes | 0 (0.0%) | 0 (0.0%) |
| 90 or more Minutes | 60 (27.7%) | 0 (0.0%) |
Time of Departure to Work by Sex in Sun Valley
The most frequent times of departure to work in Sun Valley are 4:00 PM to 11:59 PM (60, 27.7%) for males and 7:00 AM to 7:29 AM (203, 44.5%) for females.
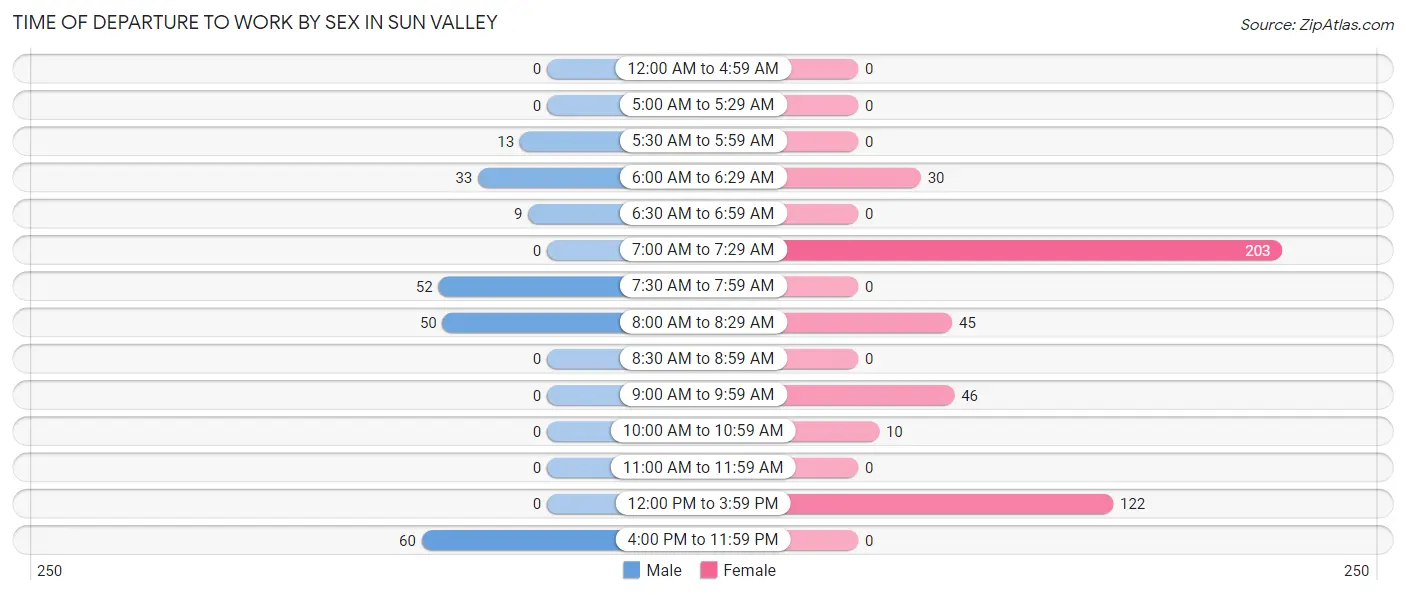
| Time of Departure | Male | Female |
| 12:00 AM to 4:59 AM | 0 (0.0%) | 0 (0.0%) |
| 5:00 AM to 5:29 AM | 0 (0.0%) | 0 (0.0%) |
| 5:30 AM to 5:59 AM | 13 (6.0%) | 0 (0.0%) |
| 6:00 AM to 6:29 AM | 33 (15.2%) | 30 (6.6%) |
| 6:30 AM to 6:59 AM | 9 (4.2%) | 0 (0.0%) |
| 7:00 AM to 7:29 AM | 0 (0.0%) | 203 (44.5%) |
| 7:30 AM to 7:59 AM | 52 (24.0%) | 0 (0.0%) |
| 8:00 AM to 8:29 AM | 50 (23.0%) | 45 (9.9%) |
| 8:30 AM to 8:59 AM | 0 (0.0%) | 0 (0.0%) |
| 9:00 AM to 9:59 AM | 0 (0.0%) | 46 (10.1%) |
| 10:00 AM to 10:59 AM | 0 (0.0%) | 10 (2.2%) |
| 11:00 AM to 11:59 AM | 0 (0.0%) | 0 (0.0%) |
| 12:00 PM to 3:59 PM | 0 (0.0%) | 122 (26.8%) |
| 4:00 PM to 11:59 PM | 60 (27.7%) | 0 (0.0%) |
| Total | 217 (100.0%) | 456 (100.0%) |
Housing Occupancy in Sun Valley
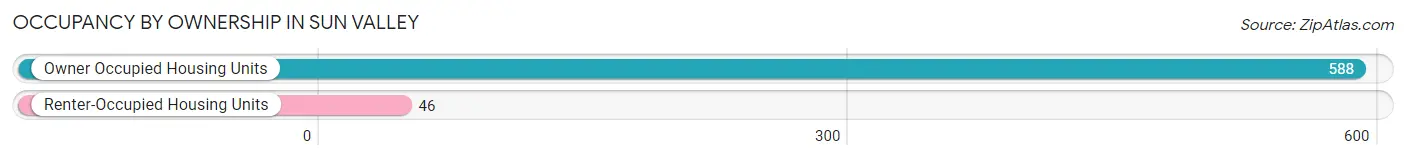
Occupancy by Ownership in Sun Valley
Of the total 634 dwellings in Sun Valley, owner-occupied units account for 588 (92.7%), while renter-occupied units make up 46 (7.3%).
| Occupancy | # Housing Units | % Housing Units |
| Owner Occupied Housing Units | 588 | 92.7% |
| Renter-Occupied Housing Units | 46 | 7.3% |
| Total Occupied Housing Units | 634 | 100.0% |
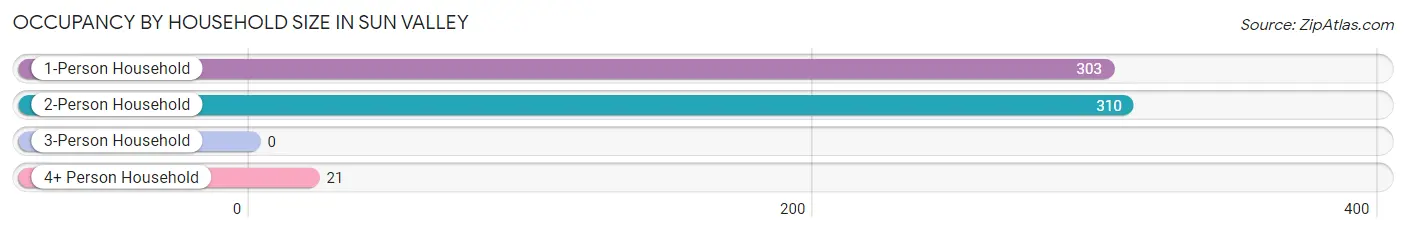
Occupancy by Household Size in Sun Valley
| Household Size | # Housing Units | % Housing Units |
| 1-Person Household | 303 | 47.8% |
| 2-Person Household | 310 | 48.9% |
| 3-Person Household | 0 | 0.0% |
| 4+ Person Household | 21 | 3.3% |
| Total Housing Units | 634 | 100.0% |
Occupancy by Ownership by Household Size in Sun Valley
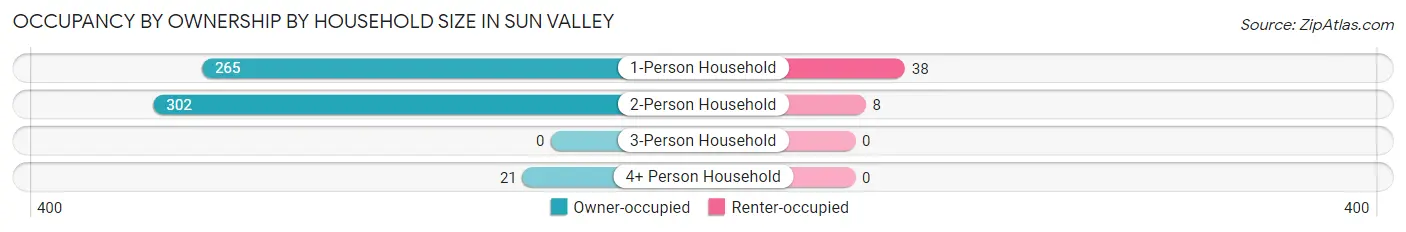
| Household Size | Owner-occupied | Renter-occupied |
| 1-Person Household | 265 (87.5%) | 38 (12.5%) |
| 2-Person Household | 302 (97.4%) | 8 (2.6%) |
| 3-Person Household | 0 (0.0%) | 0 (0.0%) |
| 4+ Person Household | 21 (100.0%) | 0 (0.0%) |
| Total Housing Units | 588 (92.7%) | 46 (7.3%) |
Occupancy by Educational Attainment in Sun Valley
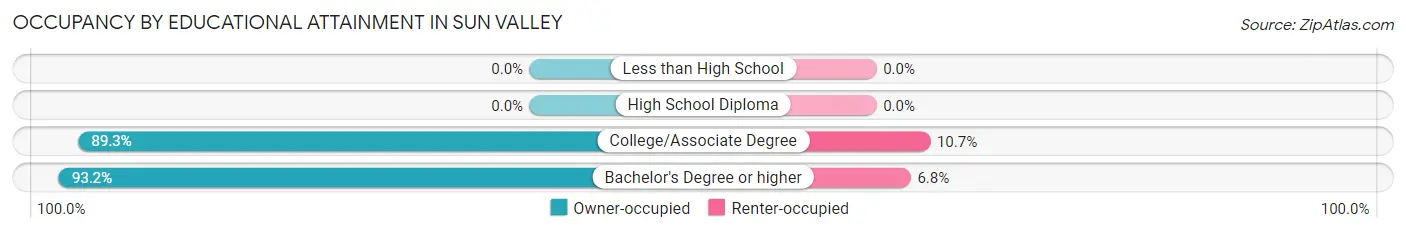
| Household Size | Owner-occupied | Renter-occupied |
| Less than High School | 0 (0.0%) | 0 (0.0%) |
| High School Diploma | 0 (0.0%) | 0 (0.0%) |
| College/Associate Degree | 67 (89.3%) | 8 (10.7%) |
| Bachelor's Degree or higher | 521 (93.2%) | 38 (6.8%) |
Occupancy by Age of Householder in Sun Valley
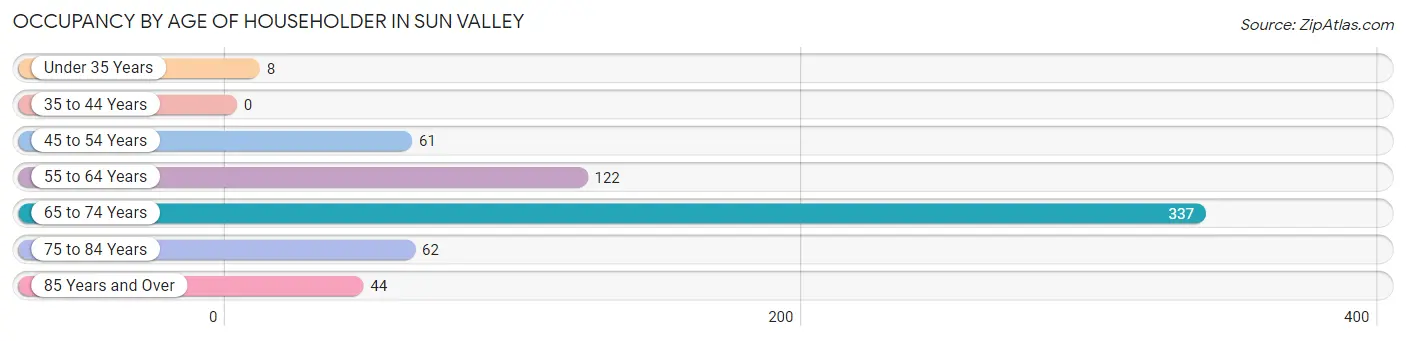
| Age Bracket | # Households | % Households |
| Under 35 Years | 8 | 1.3% |
| 35 to 44 Years | 0 | 0.0% |
| 45 to 54 Years | 61 | 9.6% |
| 55 to 64 Years | 122 | 19.2% |
| 65 to 74 Years | 337 | 53.1% |
| 75 to 84 Years | 62 | 9.8% |
| 85 Years and Over | 44 | 6.9% |
| Total | 634 | 100.0% |
Housing Finances in Sun Valley
Median Income by Occupancy in Sun Valley
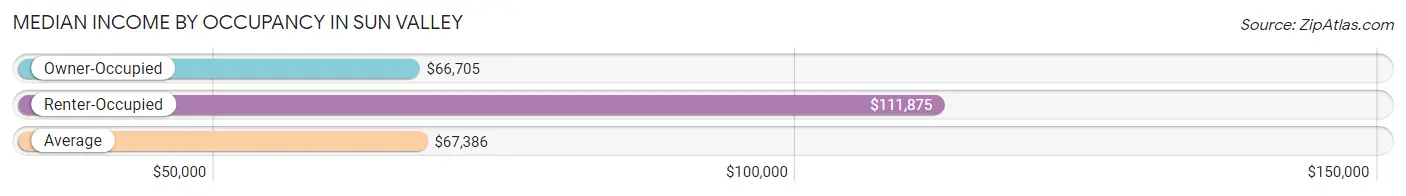
| Occupancy Type | # Households | Median Income |
| Owner-Occupied | 588 (92.7%) | $66,705 |
| Renter-Occupied | 46 (7.3%) | $111,875 |
| Average | 634 (100.0%) | $67,386 |
Occupancy by Householder Income Bracket in Sun Valley
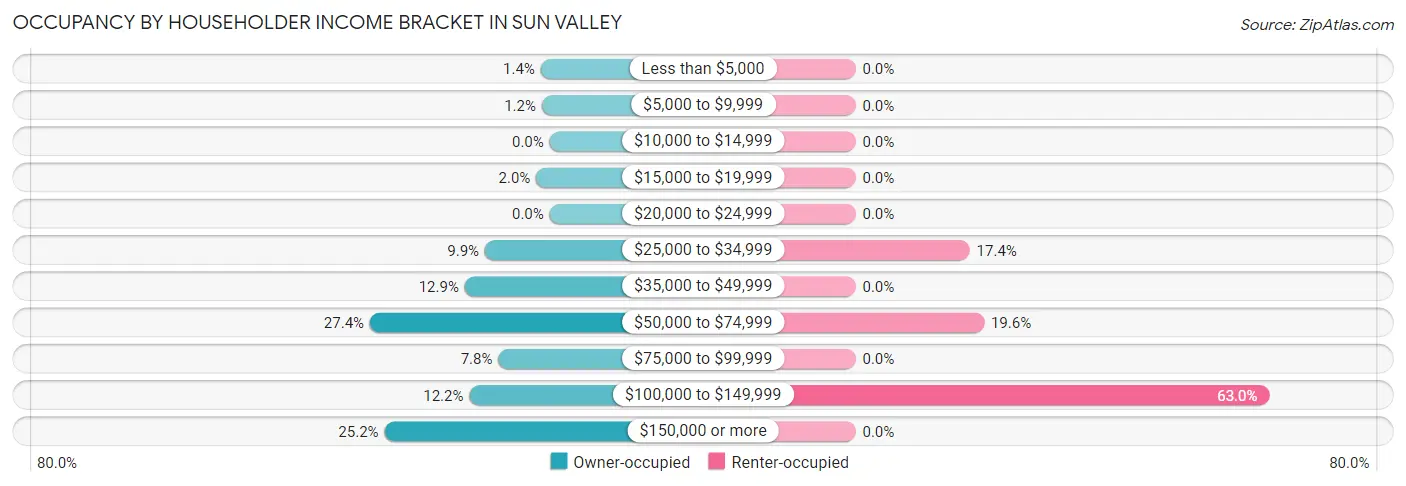
| Income Bracket | Owner-occupied | Renter-occupied |
| Less than $5,000 | 8 (1.4%) | 0 (0.0%) |
| $5,000 to $9,999 | 7 (1.2%) | 0 (0.0%) |
| $10,000 to $14,999 | 0 (0.0%) | 0 (0.0%) |
| $15,000 to $19,999 | 12 (2.0%) | 0 (0.0%) |
| $20,000 to $24,999 | 0 (0.0%) | 0 (0.0%) |
| $25,000 to $34,999 | 58 (9.9%) | 8 (17.4%) |
| $35,000 to $49,999 | 76 (12.9%) | 0 (0.0%) |
| $50,000 to $74,999 | 161 (27.4%) | 9 (19.6%) |
| $75,000 to $99,999 | 46 (7.8%) | 0 (0.0%) |
| $100,000 to $149,999 | 72 (12.2%) | 29 (63.0%) |
| $150,000 or more | 148 (25.2%) | 0 (0.0%) |
| Total | 588 (100.0%) | 46 (100.0%) |
Monthly Housing Cost Tiers in Sun Valley
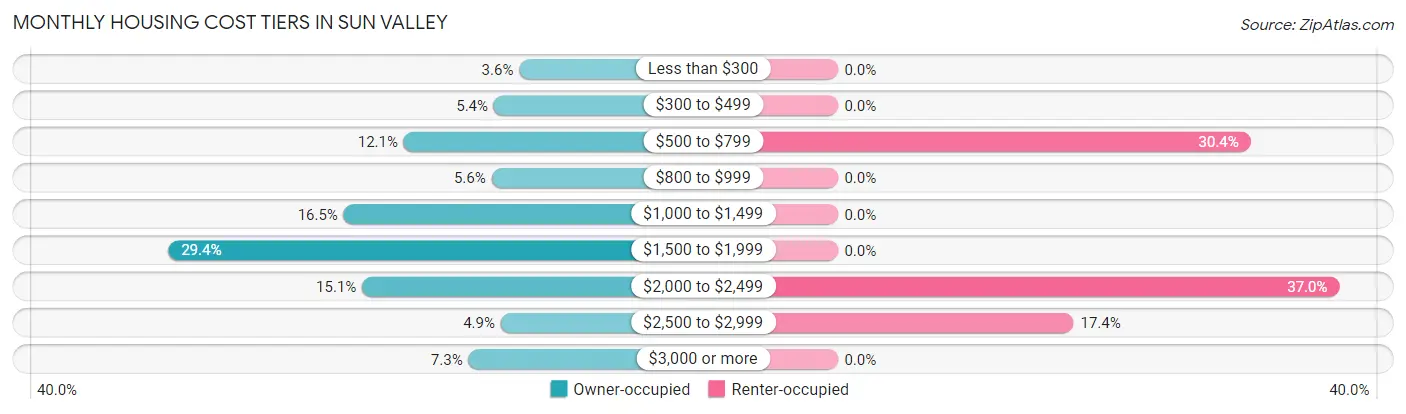
| Monthly Cost | Owner-occupied | Renter-occupied |
| Less than $300 | 21 (3.6%) | 0 (0.0%) |
| $300 to $499 | 32 (5.4%) | 0 (0.0%) |
| $500 to $799 | 71 (12.1%) | 14 (30.4%) |
| $800 to $999 | 33 (5.6%) | 0 (0.0%) |
| $1,000 to $1,499 | 97 (16.5%) | 0 (0.0%) |
| $1,500 to $1,999 | 173 (29.4%) | 0 (0.0%) |
| $2,000 to $2,499 | 89 (15.1%) | 17 (37.0%) |
| $2,500 to $2,999 | 29 (4.9%) | 8 (17.4%) |
| $3,000 or more | 43 (7.3%) | 0 (0.0%) |
| Total | 588 (100.0%) | 46 (100.0%) |
Physical Housing Characteristics in Sun Valley
Housing Structures in Sun Valley
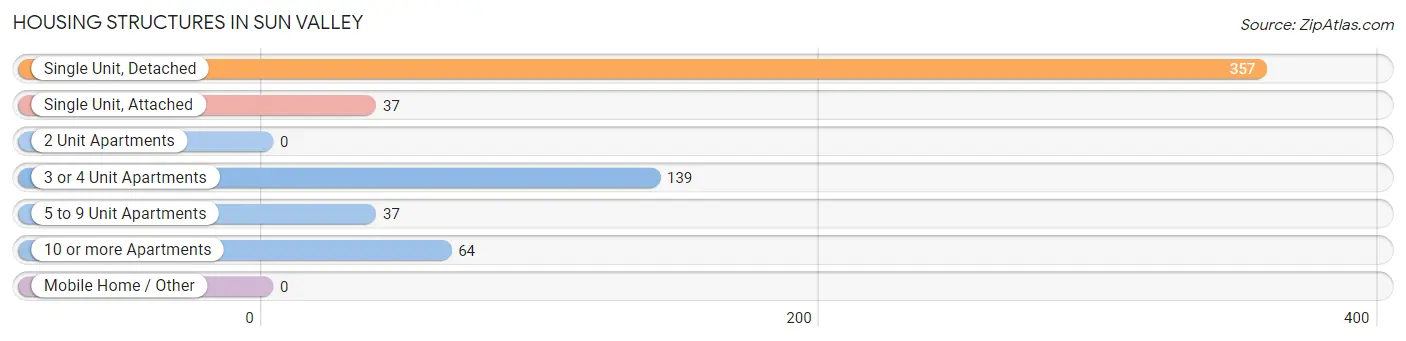
| Structure Type | # Housing Units | % Housing Units |
| Single Unit, Detached | 357 | 56.3% |
| Single Unit, Attached | 37 | 5.8% |
| 2 Unit Apartments | 0 | 0.0% |
| 3 or 4 Unit Apartments | 139 | 21.9% |
| 5 to 9 Unit Apartments | 37 | 5.8% |
| 10 or more Apartments | 64 | 10.1% |
| Mobile Home / Other | 0 | 0.0% |
| Total | 634 | 100.0% |
Housing Structures by Occupancy in Sun Valley
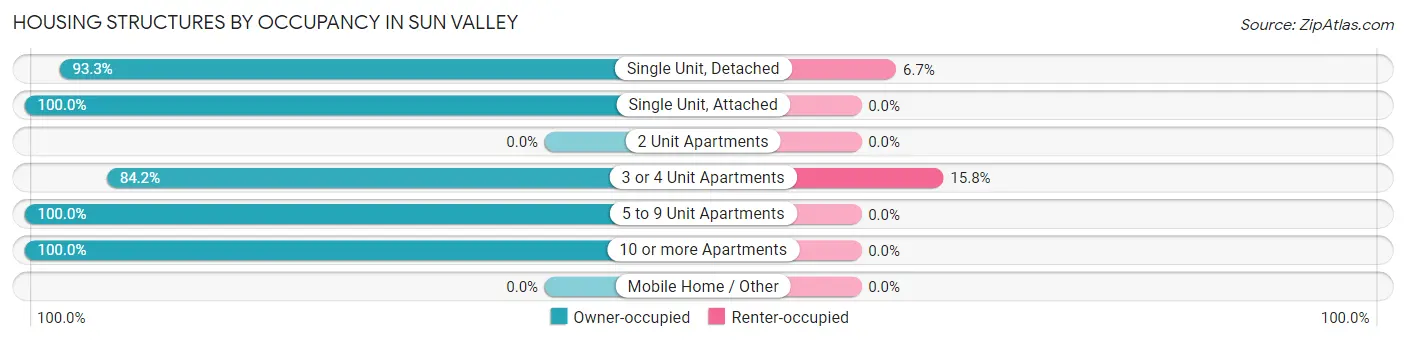
| Structure Type | Owner-occupied | Renter-occupied |
| Single Unit, Detached | 333 (93.3%) | 24 (6.7%) |
| Single Unit, Attached | 37 (100.0%) | 0 (0.0%) |
| 2 Unit Apartments | 0 (0.0%) | 0 (0.0%) |
| 3 or 4 Unit Apartments | 117 (84.2%) | 22 (15.8%) |
| 5 to 9 Unit Apartments | 37 (100.0%) | 0 (0.0%) |
| 10 or more Apartments | 64 (100.0%) | 0 (0.0%) |
| Mobile Home / Other | 0 (0.0%) | 0 (0.0%) |
| Total | 588 (92.7%) | 46 (7.3%) |
Housing Structures by Number of Rooms in Sun Valley
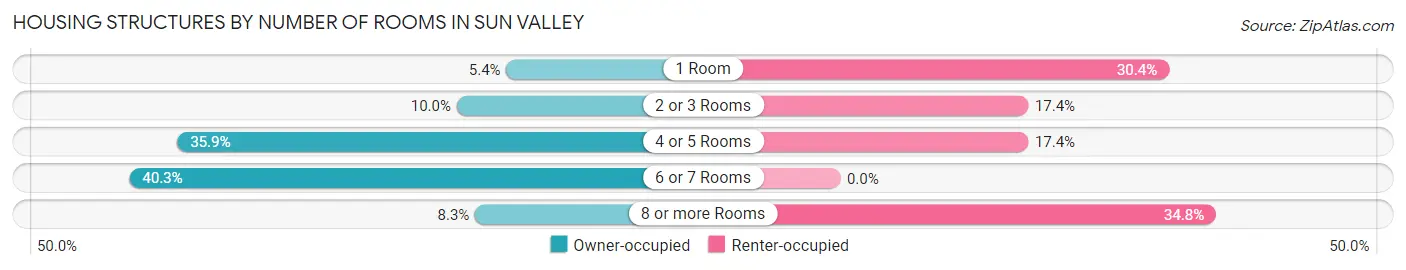
| Number of Rooms | Owner-occupied | Renter-occupied |
| 1 Room | 32 (5.4%) | 14 (30.4%) |
| 2 or 3 Rooms | 59 (10.0%) | 8 (17.4%) |
| 4 or 5 Rooms | 211 (35.9%) | 8 (17.4%) |
| 6 or 7 Rooms | 237 (40.3%) | 0 (0.0%) |
| 8 or more Rooms | 49 (8.3%) | 16 (34.8%) |
| Total | 588 (100.0%) | 46 (100.0%) |
Housing Structure by Heating Type in Sun Valley
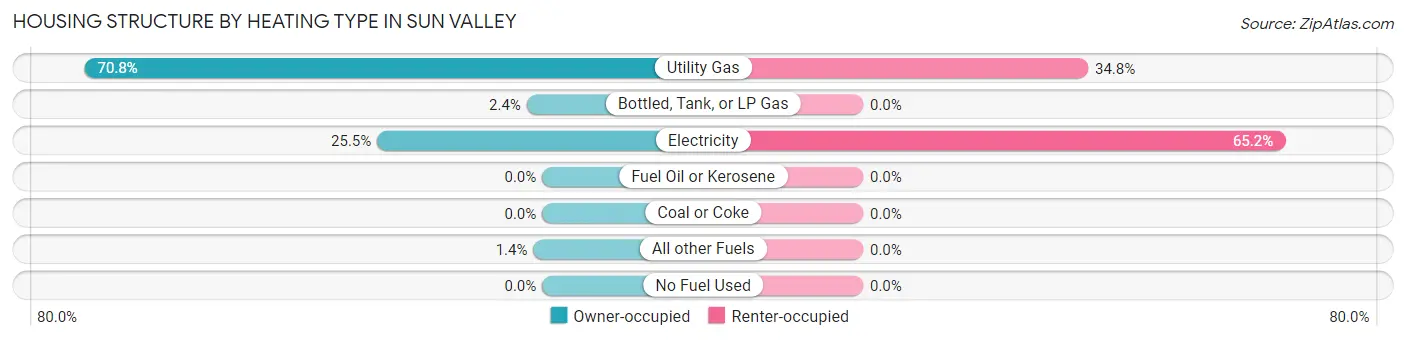
| Heating Type | Owner-occupied | Renter-occupied |
| Utility Gas | 416 (70.8%) | 16 (34.8%) |
| Bottled, Tank, or LP Gas | 14 (2.4%) | 0 (0.0%) |
| Electricity | 150 (25.5%) | 30 (65.2%) |
| Fuel Oil or Kerosene | 0 (0.0%) | 0 (0.0%) |
| Coal or Coke | 0 (0.0%) | 0 (0.0%) |
| All other Fuels | 8 (1.4%) | 0 (0.0%) |
| No Fuel Used | 0 (0.0%) | 0 (0.0%) |
| Total | 588 (100.0%) | 46 (100.0%) |
Household Vehicle Usage in Sun Valley
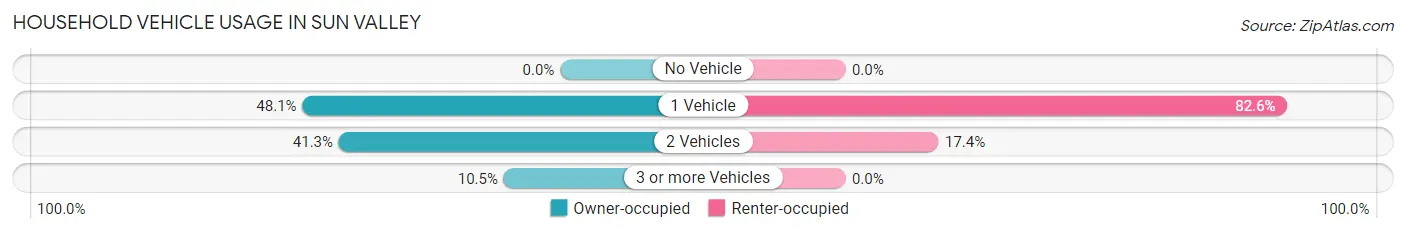
| Vehicles per Household | Owner-occupied | Renter-occupied |
| No Vehicle | 0 (0.0%) | 0 (0.0%) |
| 1 Vehicle | 283 (48.1%) | 38 (82.6%) |
| 2 Vehicles | 243 (41.3%) | 8 (17.4%) |
| 3 or more Vehicles | 62 (10.5%) | 0 (0.0%) |
| Total | 588 (100.0%) | 46 (100.0%) |
Real Estate & Mortgages in Sun Valley
Real Estate and Mortgage Overview in Sun Valley
| Characteristic | Without Mortgage | With Mortgage |
| Housing Units | 403 | 185 |
| Median Property Value | $1,280,000 | $487,100 |
| Median Household Income | $61,817 | $28 |
| Monthly Housing Costs | $1,238 | $26 |
| Real Estate Taxes | $7,096 | $0 |
Property Value by Mortgage Status in Sun Valley
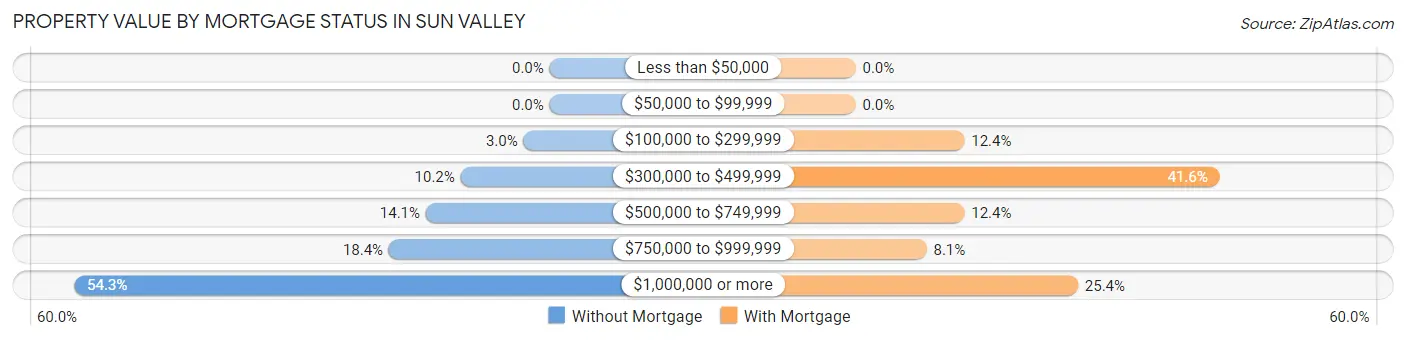
| Property Value | Without Mortgage | With Mortgage |
| Less than $50,000 | 0 (0.0%) | 0 (0.0%) |
| $50,000 to $99,999 | 0 (0.0%) | 0 (0.0%) |
| $100,000 to $299,999 | 12 (3.0%) | 23 (12.4%) |
| $300,000 to $499,999 | 41 (10.2%) | 77 (41.6%) |
| $500,000 to $749,999 | 57 (14.1%) | 23 (12.4%) |
| $750,000 to $999,999 | 74 (18.4%) | 15 (8.1%) |
| $1,000,000 or more | 219 (54.3%) | 47 (25.4%) |
| Total | 403 (100.0%) | 185 (100.0%) |
Household Income by Mortgage Status in Sun Valley
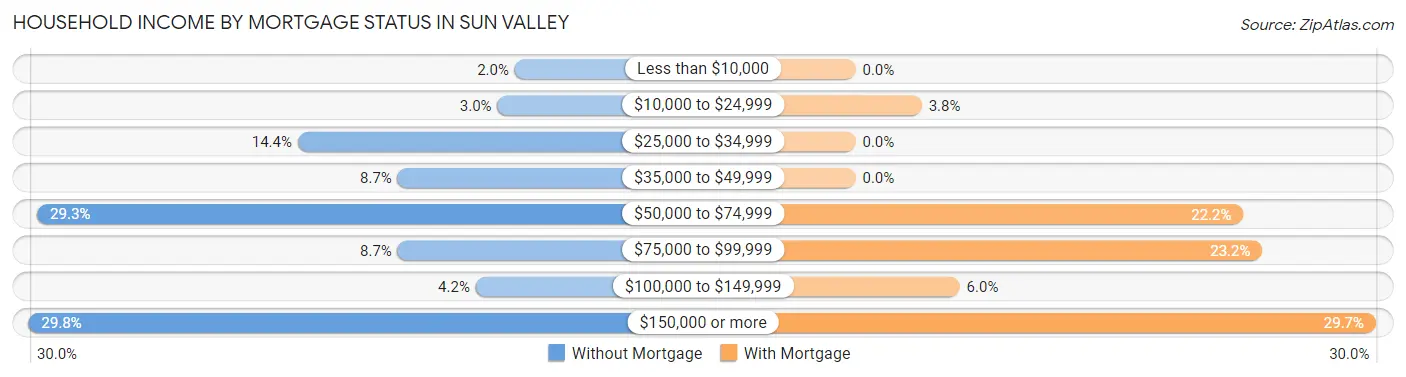
| Household Income | Without Mortgage | With Mortgage |
| Less than $10,000 | 8 (2.0%) | 0 (0.0%) |
| $10,000 to $24,999 | 12 (3.0%) | 7 (3.8%) |
| $25,000 to $34,999 | 58 (14.4%) | 0 (0.0%) |
| $35,000 to $49,999 | 35 (8.7%) | 0 (0.0%) |
| $50,000 to $74,999 | 118 (29.3%) | 41 (22.2%) |
| $75,000 to $99,999 | 35 (8.7%) | 43 (23.2%) |
| $100,000 to $149,999 | 17 (4.2%) | 11 (5.9%) |
| $150,000 or more | 120 (29.8%) | 55 (29.7%) |
| Total | 403 (100.0%) | 185 (100.0%) |
Property Value to Household Income Ratio in Sun Valley
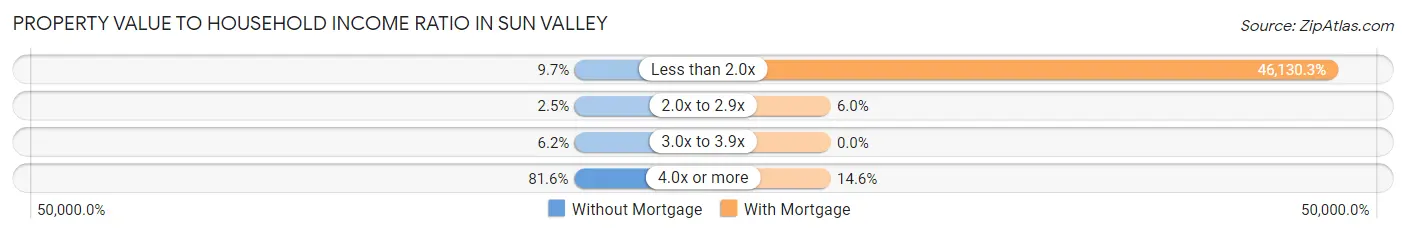
| Value-to-Income Ratio | Without Mortgage | With Mortgage |
| Less than 2.0x | 39 (9.7%) | 85,341 (46,130.3%) |
| 2.0x to 2.9x | 10 (2.5%) | 11 (5.9%) |
| 3.0x to 3.9x | 25 (6.2%) | 0 (0.0%) |
| 4.0x or more | 329 (81.6%) | 27 (14.6%) |
| Total | 403 (100.0%) | 185 (100.0%) |
Real Estate Taxes by Mortgage Status in Sun Valley
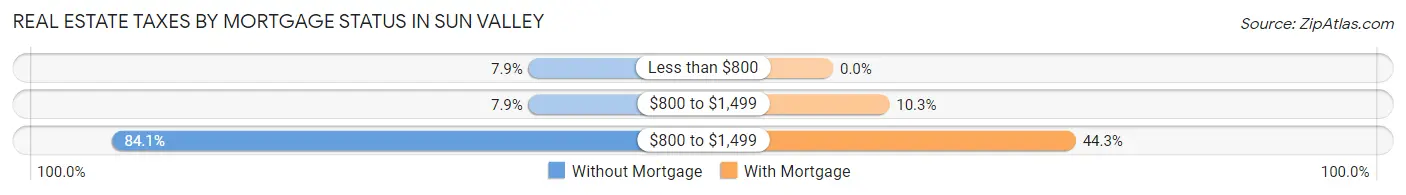
| Property Taxes | Without Mortgage | With Mortgage |
| Less than $800 | 32 (7.9%) | 0 (0.0%) |
| $800 to $1,499 | 32 (7.9%) | 19 (10.3%) |
| $800 to $1,499 | 339 (84.1%) | 82 (44.3%) |
| Total | 403 (100.0%) | 185 (100.0%) |
Health & Disability in Sun Valley
Health Insurance Coverage by Age in Sun Valley
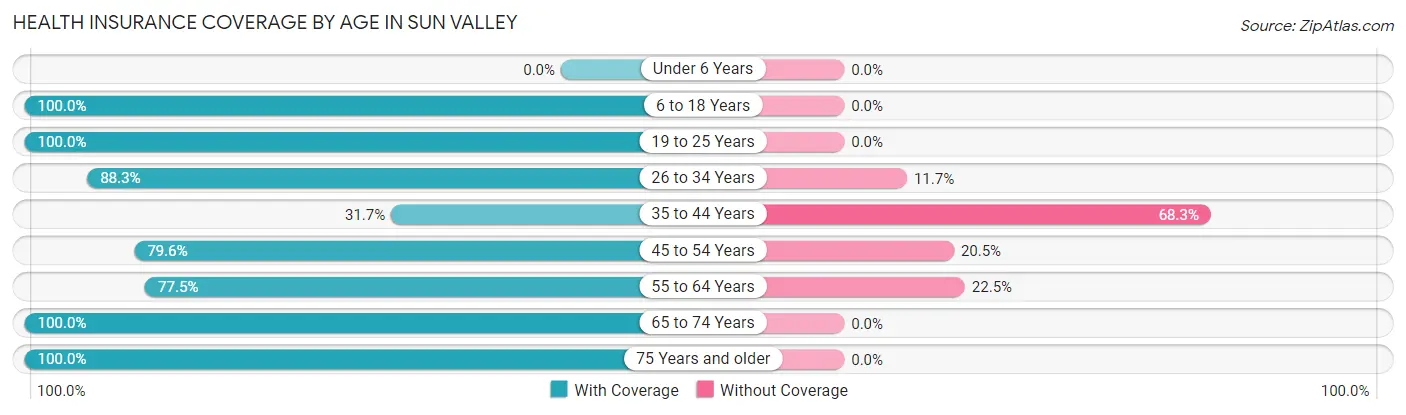
| Age Bracket | With Coverage | Without Coverage |
| Under 6 Years | 0 (0.0%) | 0 (0.0%) |
| 6 to 18 Years | 79 (100.0%) | 0 (0.0%) |
| 19 to 25 Years | 107 (100.0%) | 0 (0.0%) |
| 26 to 34 Years | 68 (88.3%) | 9 (11.7%) |
| 35 to 44 Years | 19 (31.7%) | 41 (68.3%) |
| 45 to 54 Years | 175 (79.5%) | 45 (20.4%) |
| 55 to 64 Years | 131 (77.5%) | 38 (22.5%) |
| 65 to 74 Years | 499 (100.0%) | 0 (0.0%) |
| 75 Years and older | 172 (100.0%) | 0 (0.0%) |
| Total | 1,250 (90.4%) | 133 (9.6%) |
Health Insurance Coverage by Citizenship Status in Sun Valley
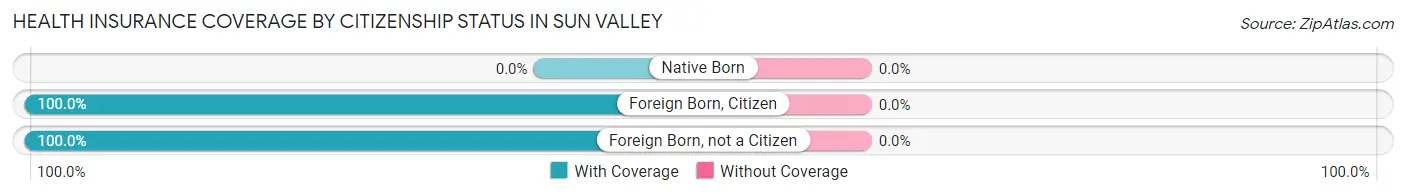
| Citizenship Status | With Coverage | Without Coverage |
| Native Born | 0 (0.0%) | 0 (0.0%) |
| Foreign Born, Citizen | 79 (100.0%) | 0 (0.0%) |
| Foreign Born, not a Citizen | 107 (100.0%) | 0 (0.0%) |
Health Insurance Coverage by Household Income in Sun Valley
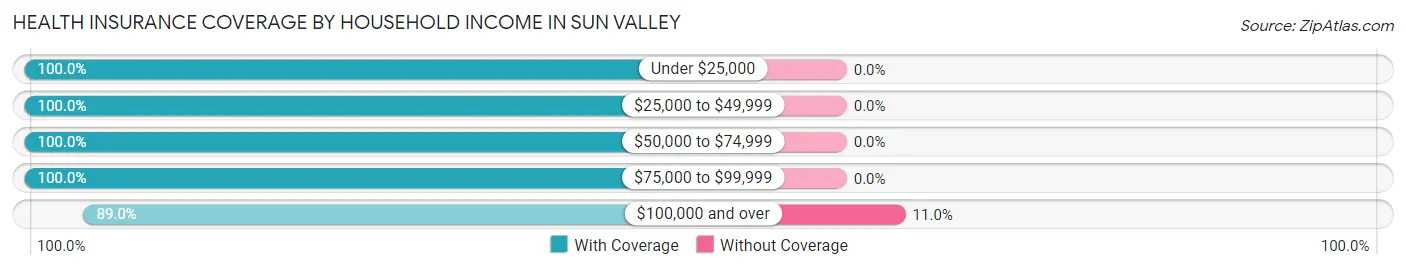
| Household Income | With Coverage | Without Coverage |
| Under $25,000 | 27 (100.0%) | 0 (0.0%) |
| $25,000 to $49,999 | 222 (100.0%) | 0 (0.0%) |
| $50,000 to $74,999 | 228 (100.0%) | 0 (0.0%) |
| $75,000 to $99,999 | 88 (100.0%) | 0 (0.0%) |
| $100,000 and over | 500 (89.0%) | 62 (11.0%) |
Public vs Private Health Insurance Coverage by Age in Sun Valley
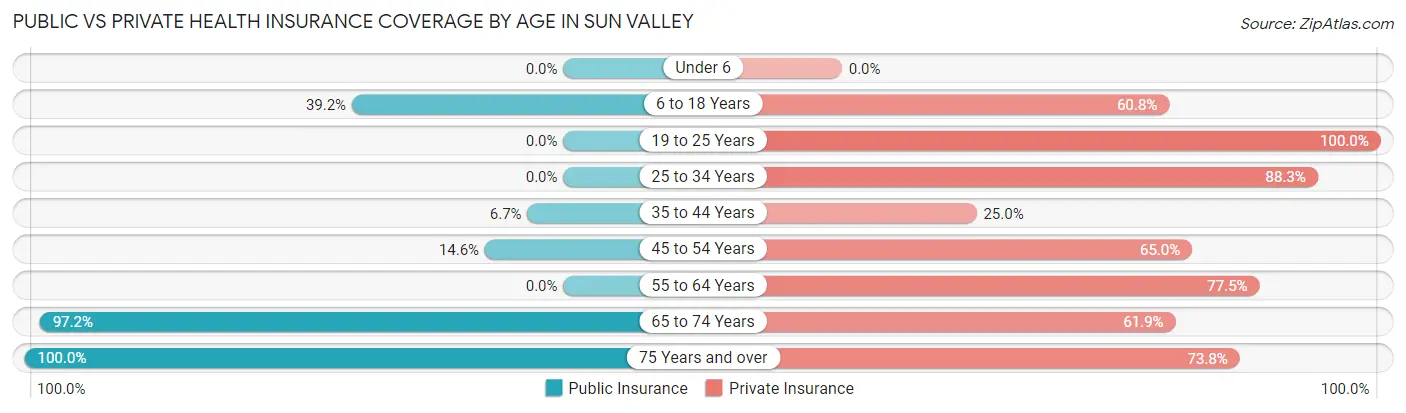
| Age Bracket | Public Insurance | Private Insurance |
| Under 6 | 0 (0.0%) | 0 (0.0%) |
| 6 to 18 Years | 31 (39.2%) | 48 (60.8%) |
| 19 to 25 Years | 0 (0.0%) | 107 (100.0%) |
| 25 to 34 Years | 0 (0.0%) | 68 (88.3%) |
| 35 to 44 Years | 4 (6.7%) | 15 (25.0%) |
| 45 to 54 Years | 32 (14.5%) | 143 (65.0%) |
| 55 to 64 Years | 0 (0.0%) | 131 (77.5%) |
| 65 to 74 Years | 485 (97.2%) | 309 (61.9%) |
| 75 Years and over | 172 (100.0%) | 127 (73.8%) |
| Total | 724 (52.3%) | 948 (68.5%) |
Disability Status by Sex by Age in Sun Valley
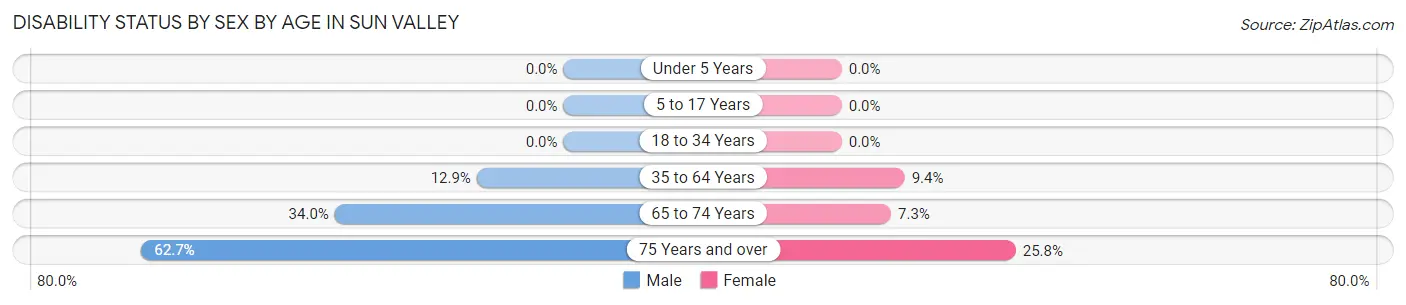
| Age Bracket | Male | Female |
| Under 5 Years | 0 (0.0%) | 0 (0.0%) |
| 5 to 17 Years | 0 (0.0%) | 0 (0.0%) |
| 18 to 34 Years | 0 (0.0%) | 0 (0.0%) |
| 35 to 64 Years | 22 (12.9%) | 26 (9.3%) |
| 65 to 74 Years | 72 (34.0%) | 21 (7.3%) |
| 75 Years and over | 52 (62.6%) | 23 (25.8%) |
Disability Class by Sex by Age in Sun Valley
Disability Class: Hearing Difficulty
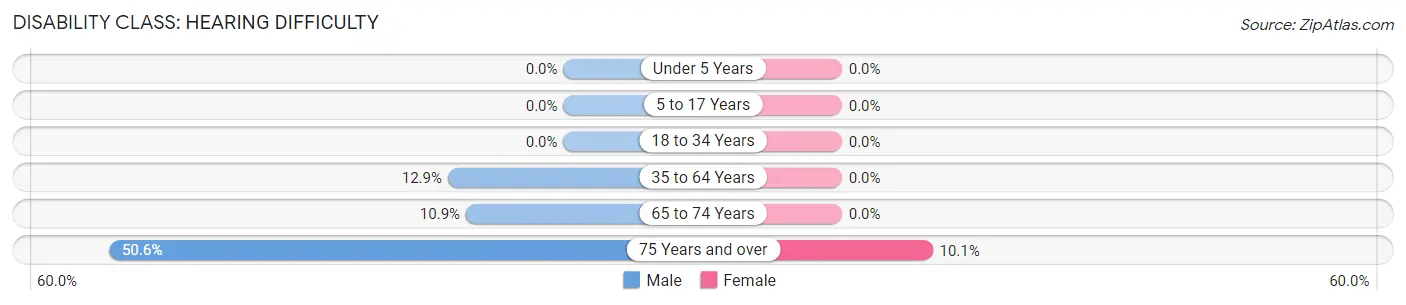
| Age Bracket | Male | Female |
| Under 5 Years | 0 (0.0%) | 0 (0.0%) |
| 5 to 17 Years | 0 (0.0%) | 0 (0.0%) |
| 18 to 34 Years | 0 (0.0%) | 0 (0.0%) |
| 35 to 64 Years | 22 (12.9%) | 0 (0.0%) |
| 65 to 74 Years | 23 (10.8%) | 0 (0.0%) |
| 75 Years and over | 42 (50.6%) | 9 (10.1%) |
Disability Class: Vision Difficulty
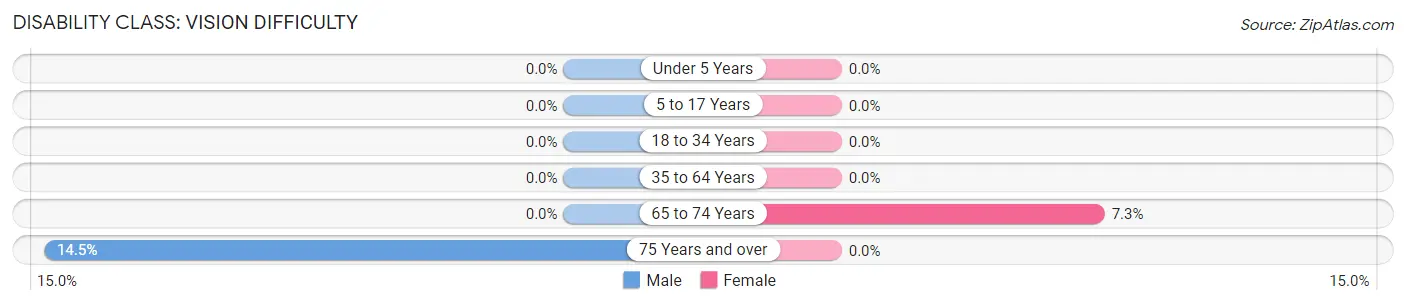
| Age Bracket | Male | Female |
| Under 5 Years | 0 (0.0%) | 0 (0.0%) |
| 5 to 17 Years | 0 (0.0%) | 0 (0.0%) |
| 18 to 34 Years | 0 (0.0%) | 0 (0.0%) |
| 35 to 64 Years | 0 (0.0%) | 0 (0.0%) |
| 65 to 74 Years | 0 (0.0%) | 21 (7.3%) |
| 75 Years and over | 12 (14.5%) | 0 (0.0%) |
Disability Class: Cognitive Difficulty
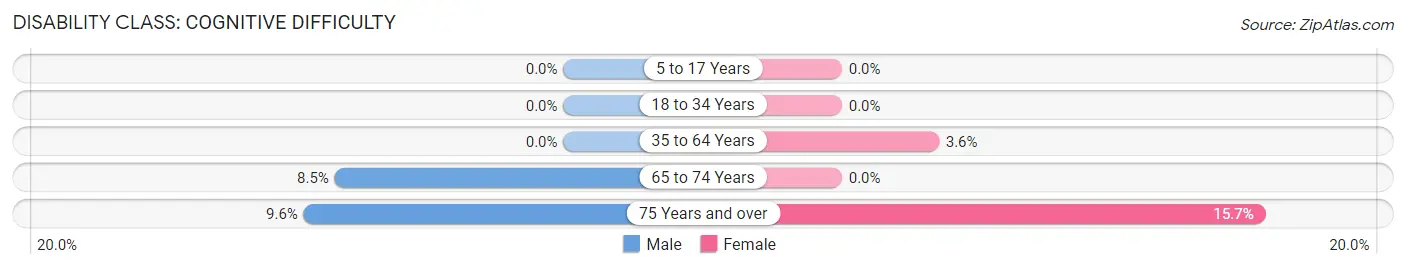
| Age Bracket | Male | Female |
| 5 to 17 Years | 0 (0.0%) | 0 (0.0%) |
| 18 to 34 Years | 0 (0.0%) | 0 (0.0%) |
| 35 to 64 Years | 0 (0.0%) | 10 (3.6%) |
| 65 to 74 Years | 18 (8.5%) | 0 (0.0%) |
| 75 Years and over | 8 (9.6%) | 14 (15.7%) |
Disability Class: Ambulatory Difficulty
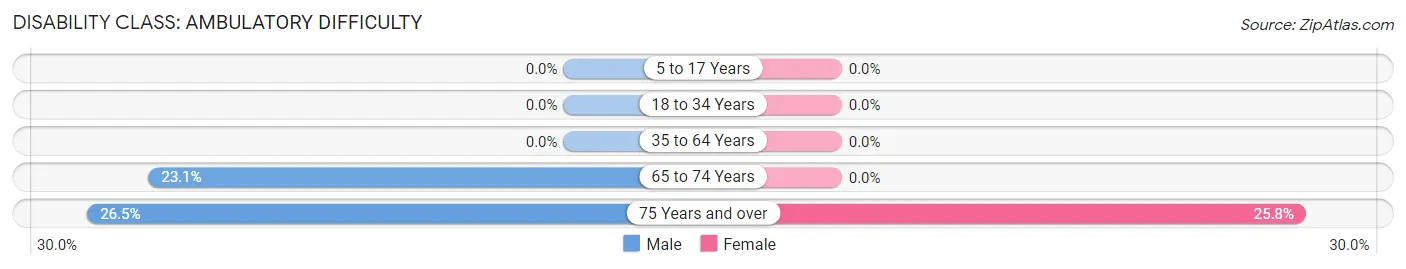
| Age Bracket | Male | Female |
| 5 to 17 Years | 0 (0.0%) | 0 (0.0%) |
| 18 to 34 Years | 0 (0.0%) | 0 (0.0%) |
| 35 to 64 Years | 0 (0.0%) | 0 (0.0%) |
| 65 to 74 Years | 49 (23.1%) | 0 (0.0%) |
| 75 Years and over | 22 (26.5%) | 23 (25.8%) |
Disability Class: Self-Care Difficulty
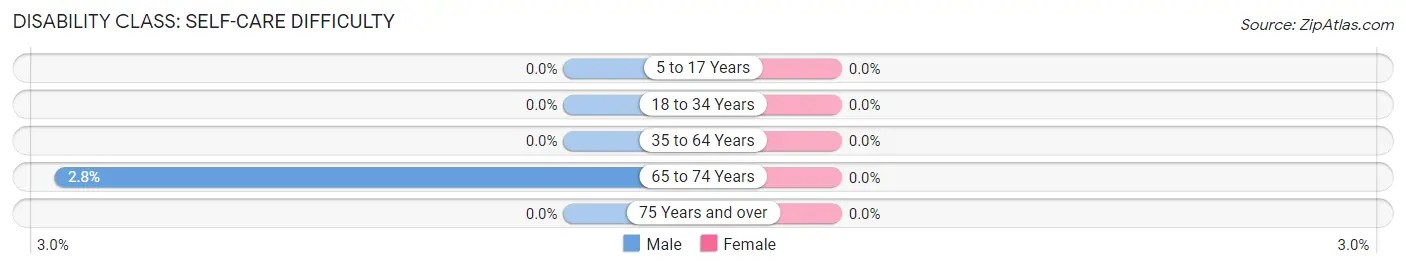
| Age Bracket | Male | Female |
| 5 to 17 Years | 0 (0.0%) | 0 (0.0%) |
| 18 to 34 Years | 0 (0.0%) | 0 (0.0%) |
| 35 to 64 Years | 0 (0.0%) | 0 (0.0%) |
| 65 to 74 Years | 6 (2.8%) | 0 (0.0%) |
| 75 Years and over | 0 (0.0%) | 0 (0.0%) |
Technology Access in Sun Valley
Computing Device Access in Sun Valley
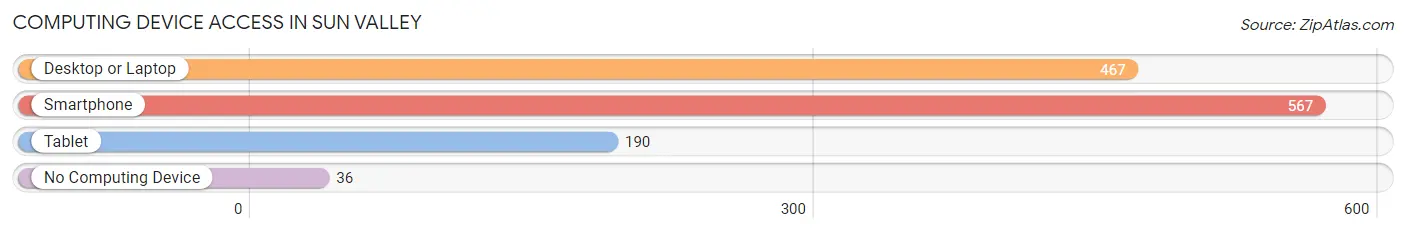
| Device Type | # Households | % Households |
| Desktop or Laptop | 467 | 73.7% |
| Smartphone | 567 | 89.4% |
| Tablet | 190 | 30.0% |
| No Computing Device | 36 | 5.7% |
| Total | 634 | 100.0% |
Internet Access in Sun Valley
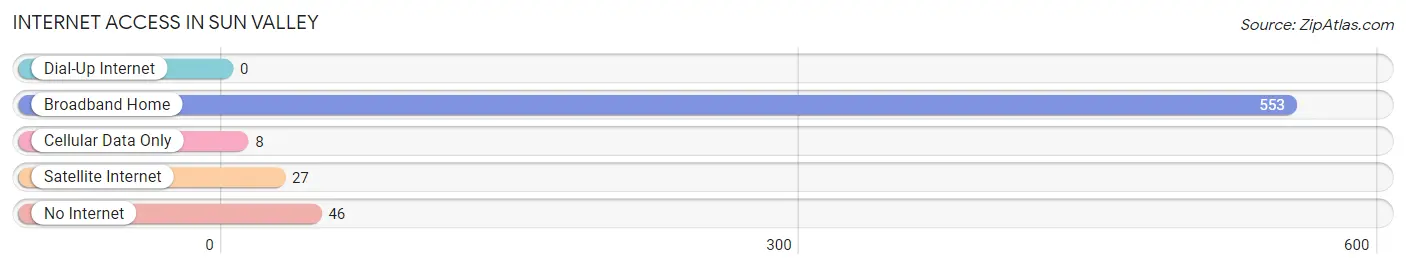
| Internet Type | # Households | % Households |
| Dial-Up Internet | 0 | 0.0% |
| Broadband Home | 553 | 87.2% |
| Cellular Data Only | 8 | 1.3% |
| Satellite Internet | 27 | 4.3% |
| No Internet | 46 | 7.3% |
| Total | 634 | 100.0% |
Sun Valley Summary
History
Sun Valley, Idaho is a small resort town located in the Wood River Valley of central Idaho. It is known for its world-class skiing, outdoor recreation, and stunning mountain scenery. The area was first explored by fur trappers in the early 1800s, and the first permanent settlers arrived in the late 1800s. The area was originally known as Leadville, but was renamed Sun Valley in 1936 when the Union Pacific Railroad built a ski resort in the area. The resort was the first of its kind in the United States and quickly became a popular destination for skiers and outdoor enthusiasts.
Geography
Sun Valley is located in the Wood River Valley of central Idaho, approximately 80 miles north of Boise. The area is surrounded by the Sawtooth Mountains to the east, the White Cloud Mountains to the west, and the Pioneer Mountains to the south. The valley is home to the Big Wood River, which flows through the area and provides a source of irrigation for the local farms and ranches. The area is known for its stunning mountain scenery and outdoor recreation opportunities, including skiing, hiking, camping, fishing, and more.
Economy
Sun Valley’s economy is largely driven by tourism. The area is home to the world-renowned Sun Valley Resort, which attracts visitors from around the world. The resort offers a variety of activities, including skiing, snowboarding, golf, tennis, and more. The area also has a number of other attractions, such as the Sun Valley Opera House, the Sun Valley Museum of Art, and the Sun Valley Center for the Arts. In addition to tourism, the area is also home to a number of small businesses, including restaurants, shops, and galleries.
Demographics
As of the 2010 census, the population of Sun Valley was 1,406. The median age of the population was 44.7 years, and the median household income was $50,977. The population is predominantly white (93.3%), with small percentages of Hispanic (2.2%), Asian (1.2%), and African American (0.7%) residents. The area is also home to a number of seasonal residents, as well as a large number of retirees.
Sun Valley is a popular destination for outdoor enthusiasts and those looking for a quiet mountain retreat. The area is known for its stunning scenery, world-class skiing, and outdoor recreation opportunities. The area’s economy is largely driven by tourism, and the population is predominantly white. Sun Valley is a unique and beautiful place to visit or call home.
Common Questions
What is Per Capita Income in Sun Valley?
Per Capita income in Sun Valley is $82,846.
What is the Median Family Income in Sun Valley?
Median Family Income in Sun Valley is $94,423.
What is the Median Household income in Sun Valley?
Median Household Income in Sun Valley is $67,386.
What is Income or Wage Gap in Sun Valley?
Income or Wage Gap in Sun Valley is 12.3%.
Women in Sun Valley earn 87.7 cents for every dollar earned by a man.
What is Inequality or Gini Index in Sun Valley?
Inequality or Gini Index in Sun Valley is 0.57.
What is the Total Population of Sun Valley?
Total Population of Sun Valley is 1,383.
What is the Total Male Population of Sun Valley?
Total Male Population of Sun Valley is 606.
What is the Total Female Population of Sun Valley?
Total Female Population of Sun Valley is 777.
What is the Ratio of Males per 100 Females in Sun Valley?
There are 77.99 Males per 100 Females in Sun Valley.
What is the Ratio of Females per 100 Males in Sun Valley?
There are 128.22 Females per 100 Males in Sun Valley.
What is the Median Population Age in Sun Valley?
Median Population Age in Sun Valley is 64.4 Years.
What is the Average Family Size in Sun Valley
Average Family Size in Sun Valley is 2.5 People.
What is the Average Household Size in Sun Valley
Average Household Size in Sun Valley is 1.8 People.
How Large is the Labor Force in Sun Valley?
There are 868 People in the Labor Forcein in Sun Valley.
What is the Percentage of People in the Labor Force in Sun Valley?
64.2% of People are in the Labor Force in Sun Valley.