Harrison, ID Map & Demographics
Harrison Map
Harrison Overview
$36,641
PER CAPITA INCOME
$76,389
AVG FAMILY INCOME
$75,833
AVG HOUSEHOLD INCOME
40.8%
WAGE / INCOME GAP [ % ]
59.2¢/ $1
WAGE / INCOME GAP [ $ ]
0.34
INEQUALITY / GINI INDEX
277
TOTAL POPULATION
154
MALE POPULATION
123
FEMALE POPULATION
125.20
MALES / 100 FEMALES
79.87
FEMALES / 100 MALES
55.4
MEDIAN AGE
2.3
AVG FAMILY SIZE
2.3
AVG HOUSEHOLD SIZE
109
LABOR FORCE [ PEOPLE ]
47.6%
PERCENT IN LABOR FORCE
10.1%
UNEMPLOYMENT RATE
Harrison Zip Codes
Harrison Area Codes
Income in Harrison
Income Overview in Harrison
Per Capita Income in Harrison is $36,641, while median incomes of families and households are $76,389 and $75,833 respectively.
| Characteristic | Number | Measure |
| Per Capita Income | 277 | $36,641 |
| Median Family Income | 94 | $76,389 |
| Mean Family Income | 94 | $85,696 |
| Median Household Income | 120 | $75,833 |
| Mean Household Income | 120 | $85,656 |
| Income Deficit | 94 | $0 |
| Wage / Income Gap (%) | 277 | 40.84% |
| Wage / Income Gap ($) | 277 | 59.16¢ per $1 |
| Gini / Inequality Index | 277 | 0.34 |
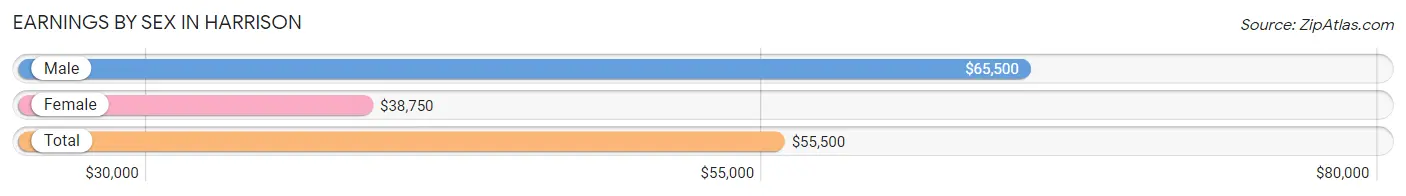
Earnings by Sex in Harrison
Average Earnings in Harrison are $55,500, $65,500 for men and $38,750 for women, a difference of 40.8%.
| Sex | Number | Average Earnings |
| Male | 50 (41.7%) | $65,500 |
| Female | 70 (58.3%) | $38,750 |
| Total | 120 (100.0%) | $55,500 |
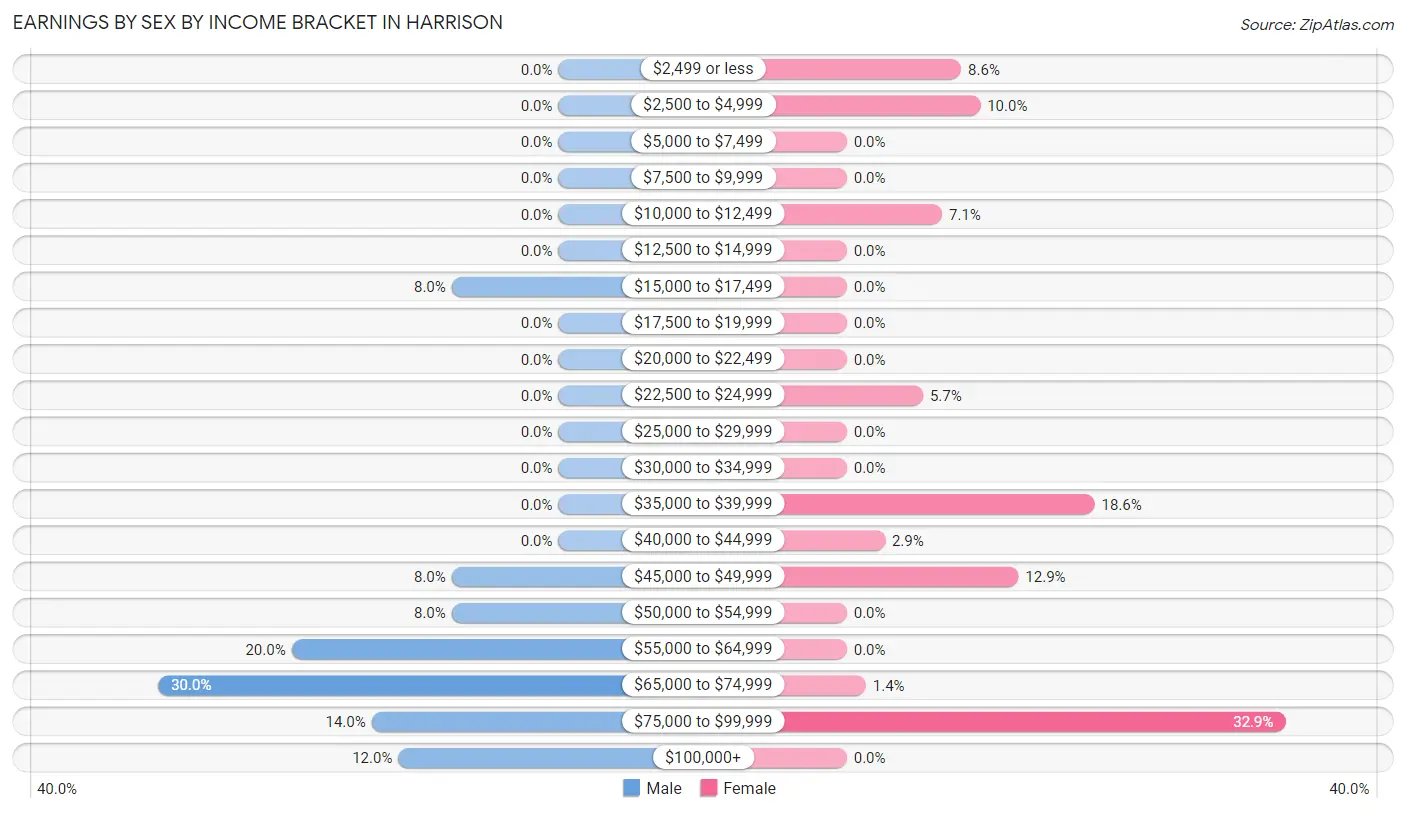
Earnings by Sex by Income Bracket in Harrison
The most common earnings brackets in Harrison are $65,000 to $74,999 for men (15 | 30.0%) and $75,000 to $99,999 for women (23 | 32.9%).
| Income | Male | Female |
| $2,499 or less | 0 (0.0%) | 6 (8.6%) |
| $2,500 to $4,999 | 0 (0.0%) | 7 (10.0%) |
| $5,000 to $7,499 | 0 (0.0%) | 0 (0.0%) |
| $7,500 to $9,999 | 0 (0.0%) | 0 (0.0%) |
| $10,000 to $12,499 | 0 (0.0%) | 5 (7.1%) |
| $12,500 to $14,999 | 0 (0.0%) | 0 (0.0%) |
| $15,000 to $17,499 | 4 (8.0%) | 0 (0.0%) |
| $17,500 to $19,999 | 0 (0.0%) | 0 (0.0%) |
| $20,000 to $22,499 | 0 (0.0%) | 0 (0.0%) |
| $22,500 to $24,999 | 0 (0.0%) | 4 (5.7%) |
| $25,000 to $29,999 | 0 (0.0%) | 0 (0.0%) |
| $30,000 to $34,999 | 0 (0.0%) | 0 (0.0%) |
| $35,000 to $39,999 | 0 (0.0%) | 13 (18.6%) |
| $40,000 to $44,999 | 0 (0.0%) | 2 (2.9%) |
| $45,000 to $49,999 | 4 (8.0%) | 9 (12.9%) |
| $50,000 to $54,999 | 4 (8.0%) | 0 (0.0%) |
| $55,000 to $64,999 | 10 (20.0%) | 0 (0.0%) |
| $65,000 to $74,999 | 15 (30.0%) | 1 (1.4%) |
| $75,000 to $99,999 | 7 (14.0%) | 23 (32.9%) |
| $100,000+ | 6 (12.0%) | 0 (0.0%) |
| Total | 50 (100.0%) | 70 (100.0%) |
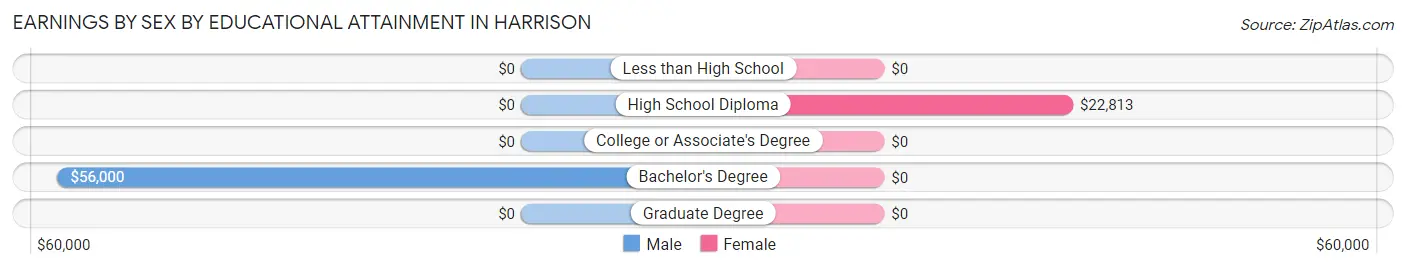
Earnings by Sex by Educational Attainment in Harrison
Average earnings in Harrison are $65,500 for men and $38,750 for women, a difference of 40.8%. Men with an educational attainment of bachelor's degree enjoy the highest average annual earnings of $56,000, while those with bachelor's degree education earn the least with $56,000. Women with an educational attainment of high school diploma earn the most with the average annual earnings of $22,813, while those with high school diploma education have the smallest earnings of $22,813.
| Educational Attainment | Male Income | Female Income |
| Less than High School | - | - |
| High School Diploma | - | - |
| College or Associate's Degree | - | - |
| Bachelor's Degree | $56,000 | $0 |
| Graduate Degree | - | - |
| Total | $65,500 | $38,750 |
Family Income in Harrison
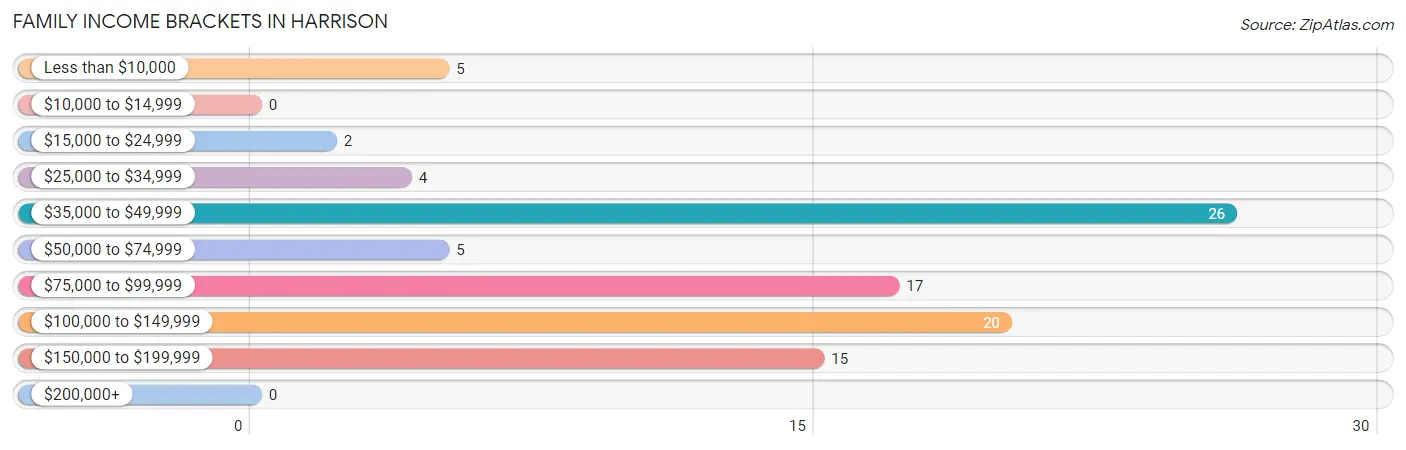
Family Income Brackets in Harrison
According to the Harrison family income data, there are 26 families falling into the $35,000 to $49,999 income range, which is the most common income bracket and makes up 27.7% of all families.
| Income Bracket | # Families | % Families |
| Less than $10,000 | 5 | 5.3% |
| $10,000 to $14,999 | 0 | 0.0% |
| $15,000 to $24,999 | 2 | 2.1% |
| $25,000 to $34,999 | 4 | 4.3% |
| $35,000 to $49,999 | 26 | 27.7% |
| $50,000 to $74,999 | 5 | 5.3% |
| $75,000 to $99,999 | 17 | 18.1% |
| $100,000 to $149,999 | 20 | 21.3% |
| $150,000 to $199,999 | 15 | 16.0% |
| $200,000+ | 0 | 0.0% |
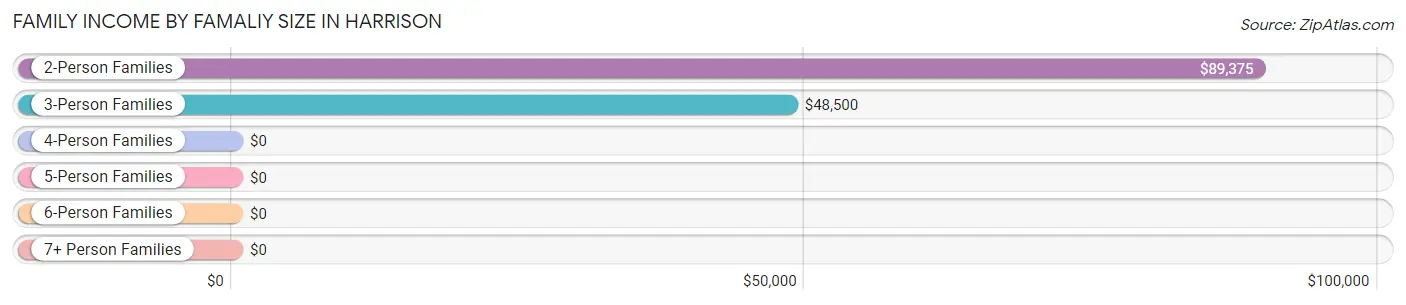
Family Income by Famaliy Size in Harrison
2-person families (71 | 75.5%) account for the highest median family income in Harrison with $89,375 per family, while 2-person families (71 | 75.5%) have the highest median income of $44,688 per family member.
| Income Bracket | # Families | Median Income |
| 2-Person Families | 71 (75.5%) | $89,375 |
| 3-Person Families | 16 (17.0%) | $48,500 |
| 4-Person Families | 7 (7.4%) | $0 |
| 5-Person Families | 0 (0.0%) | $0 |
| 6-Person Families | 0 (0.0%) | $0 |
| 7+ Person Families | 0 (0.0%) | $0 |
| Total | 94 (100.0%) | $76,389 |
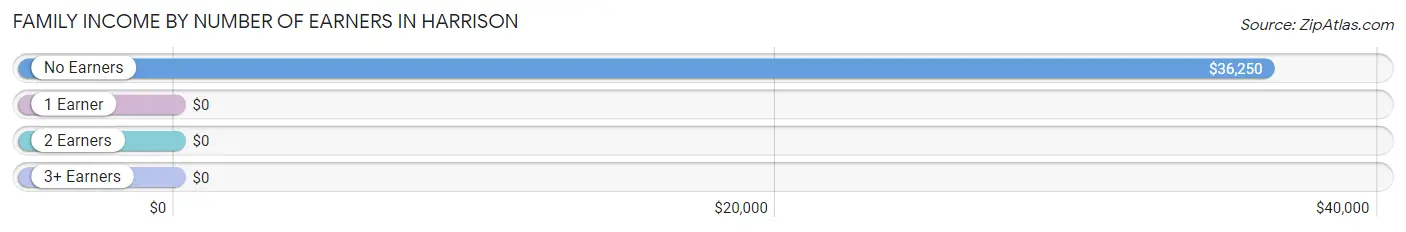
Family Income by Number of Earners in Harrison
| Number of Earners | # Families | Median Income |
| No Earners | 26 (27.7%) | $36,250 |
| 1 Earner | 35 (37.2%) | $0 |
| 2 Earners | 33 (35.1%) | $0 |
| 3+ Earners | 0 (0.0%) | $0 |
| Total | 94 (100.0%) | $76,389 |
Household Income in Harrison
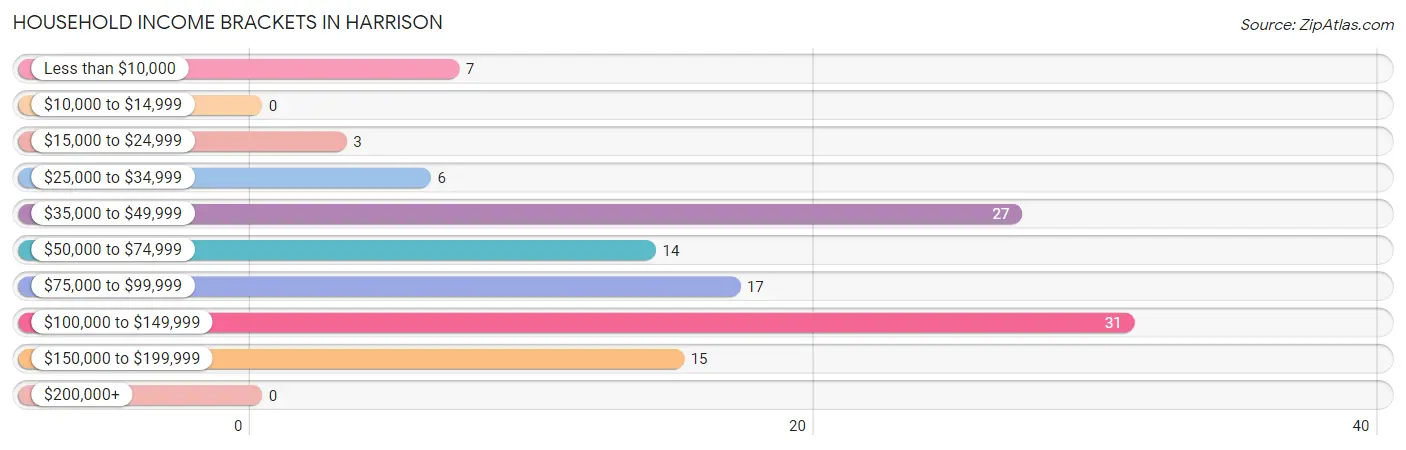
Household Income Brackets in Harrison
With 31 households falling in the category, the $100,000 to $149,999 income range is the most frequent in Harrison, accounting for 25.8% of all households.
| Income Bracket | # Households | % Households |
| Less than $10,000 | 7 | 5.8% |
| $10,000 to $14,999 | 0 | 0.0% |
| $15,000 to $24,999 | 3 | 2.5% |
| $25,000 to $34,999 | 6 | 5.0% |
| $35,000 to $49,999 | 27 | 22.5% |
| $50,000 to $74,999 | 14 | 11.7% |
| $75,000 to $99,999 | 17 | 14.2% |
| $100,000 to $149,999 | 31 | 25.8% |
| $150,000 to $199,999 | 15 | 12.5% |
| $200,000+ | 0 | 0.0% |
Household Income by Householder Age in Harrison
The median household income in Harrison is $75,833, with the highest median household income of $100,417 found in the 45 to 64 years age bracket for the primary householder. A total of 63 households (52.5%) fall into this category.
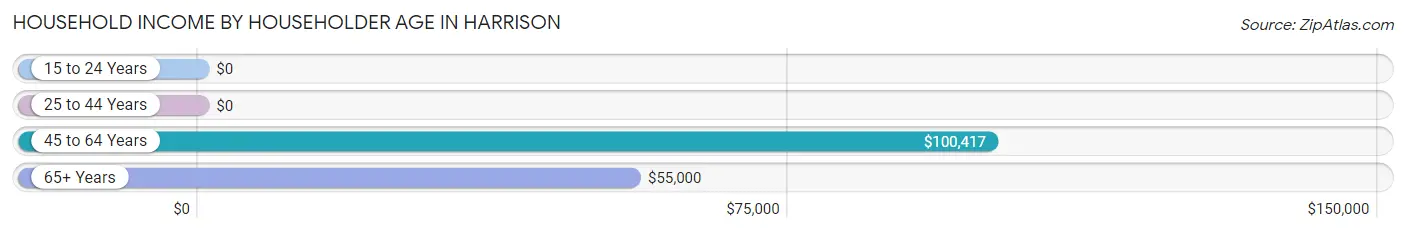
| Income Bracket | # Households | Median Income |
| 15 to 24 Years | 0 (0.0%) | $0 |
| 25 to 44 Years | 17 (14.2%) | $0 |
| 45 to 64 Years | 63 (52.5%) | $100,417 |
| 65+ Years | 40 (33.3%) | $55,000 |
| Total | 120 (100.0%) | $75,833 |
Poverty in Harrison
Income Below Poverty by Sex and Age in Harrison
With 16.3% poverty level for males and 4.9% for females among the residents of Harrison, 25 to 34 year old males and 55 to 64 year old females are the most vulnerable to poverty, with 6 males (60.0%) and 4 females (19.1%) in their respective age groups living below the poverty level.
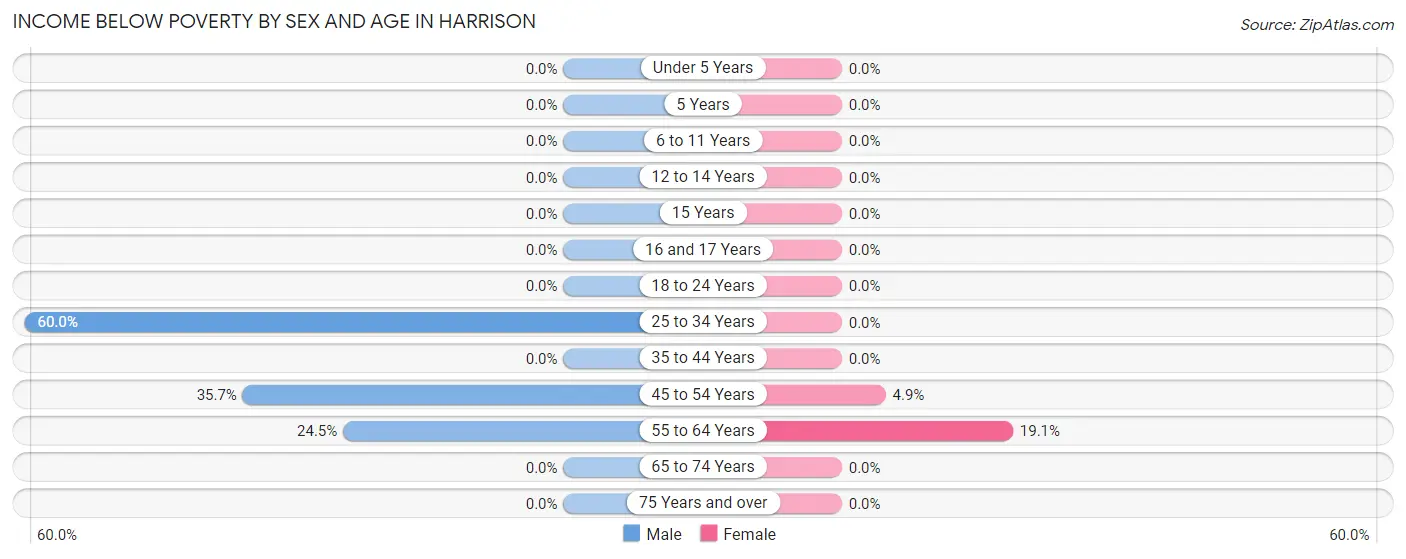
| Age Bracket | Male | Female |
| Under 5 Years | 0 (0.0%) | 0 (0.0%) |
| 5 Years | 0 (0.0%) | 0 (0.0%) |
| 6 to 11 Years | 0 (0.0%) | 0 (0.0%) |
| 12 to 14 Years | 0 (0.0%) | 0 (0.0%) |
| 15 Years | 0 (0.0%) | 0 (0.0%) |
| 16 and 17 Years | 0 (0.0%) | 0 (0.0%) |
| 18 to 24 Years | 0 (0.0%) | 0 (0.0%) |
| 25 to 34 Years | 6 (60.0%) | 0 (0.0%) |
| 35 to 44 Years | 0 (0.0%) | 0 (0.0%) |
| 45 to 54 Years | 5 (35.7%) | 2 (4.9%) |
| 55 to 64 Years | 13 (24.5%) | 4 (19.1%) |
| 65 to 74 Years | 0 (0.0%) | 0 (0.0%) |
| 75 Years and over | 0 (0.0%) | 0 (0.0%) |
| Total | 24 (16.3%) | 6 (4.9%) |
Income Above Poverty by Sex and Age in Harrison
According to the poverty statistics in Harrison, males aged 6 to 11 years and females aged 6 to 11 years are the age groups that are most secure financially, with 100.0% of males and 100.0% of females in these age groups living above the poverty line.
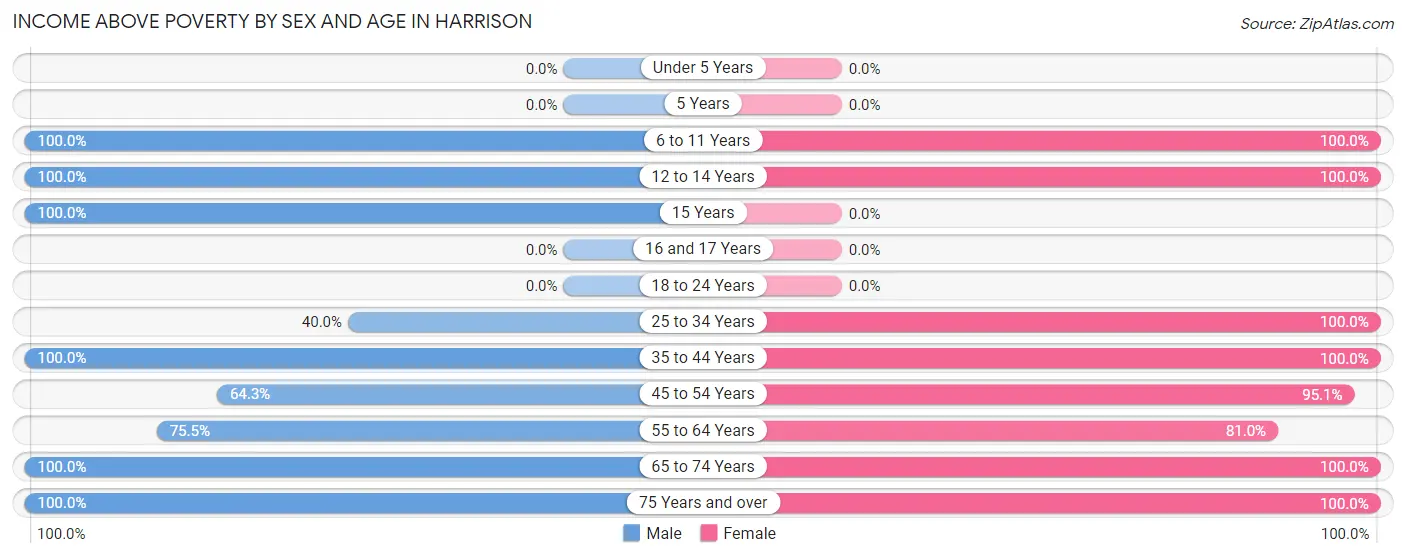
| Age Bracket | Male | Female |
| Under 5 Years | 0 (0.0%) | 0 (0.0%) |
| 5 Years | 0 (0.0%) | 0 (0.0%) |
| 6 to 11 Years | 7 (100.0%) | 12 (100.0%) |
| 12 to 14 Years | 5 (100.0%) | 7 (100.0%) |
| 15 Years | 10 (100.0%) | 0 (0.0%) |
| 16 and 17 Years | 0 (0.0%) | 0 (0.0%) |
| 18 to 24 Years | 0 (0.0%) | 0 (0.0%) |
| 25 to 34 Years | 4 (40.0%) | 7 (100.0%) |
| 35 to 44 Years | 6 (100.0%) | 10 (100.0%) |
| 45 to 54 Years | 9 (64.3%) | 39 (95.1%) |
| 55 to 64 Years | 40 (75.5%) | 17 (80.9%) |
| 65 to 74 Years | 26 (100.0%) | 10 (100.0%) |
| 75 Years and over | 16 (100.0%) | 15 (100.0%) |
| Total | 123 (83.7%) | 117 (95.1%) |
Income Below Poverty Among Married-Couple Families in Harrison
The poverty statistics for married-couple families in Harrison show that 6.5% or 5 of the total 77 families live below the poverty line. Families with no children have the highest poverty rate of 7.5%, comprising of 5 families. On the other hand, families with 1 or 2 children have the lowest poverty rate of 0.0%, which includes 0 families.
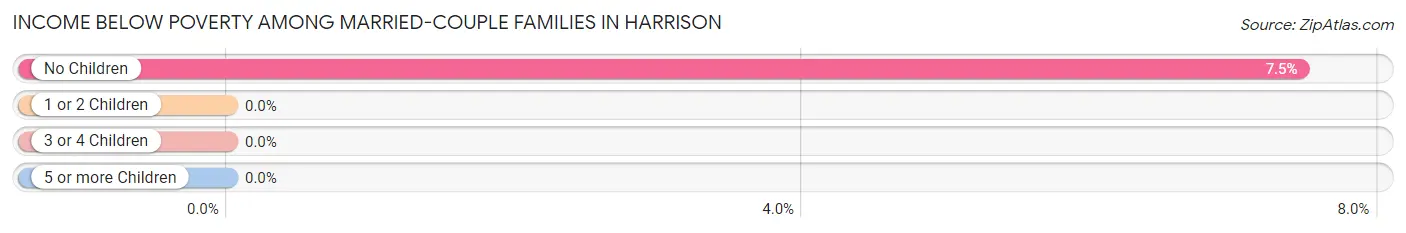
| Children | Above Poverty | Below Poverty |
| No Children | 62 (92.5%) | 5 (7.5%) |
| 1 or 2 Children | 10 (100.0%) | 0 (0.0%) |
| 3 or 4 Children | 0 (0.0%) | 0 (0.0%) |
| 5 or more Children | 0 (0.0%) | 0 (0.0%) |
| Total | 72 (93.5%) | 5 (6.5%) |
Income Below Poverty Among Single-Parent Households in Harrison
| Children | Single Father | Single Mother |
| No Children | 0 (0.0%) | 0 (0.0%) |
| 1 or 2 Children | 0 (0.0%) | 0 (0.0%) |
| 3 or 4 Children | 0 (0.0%) | 0 (0.0%) |
| 5 or more Children | 0 (0.0%) | 0 (0.0%) |
| Total | 0 (0.0%) | 0 (0.0%) |
Income Below Poverty Among Married-Couple vs Single-Parent Households in Harrison
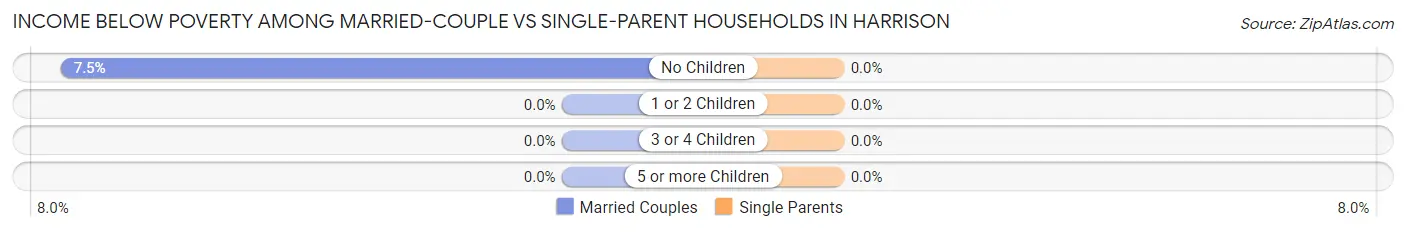
| Children | Married-Couple Families | Single-Parent Households |
| No Children | 5 (7.5%) | 0 (0.0%) |
| 1 or 2 Children | 0 (0.0%) | 0 (0.0%) |
| 3 or 4 Children | 0 (0.0%) | 0 (0.0%) |
| 5 or more Children | 0 (0.0%) | 0 (0.0%) |
| Total | 5 (6.5%) | 0 (0.0%) |
Race in Harrison
The most populous races in Harrison are , and White / Caucasian (277 | 100.0%).
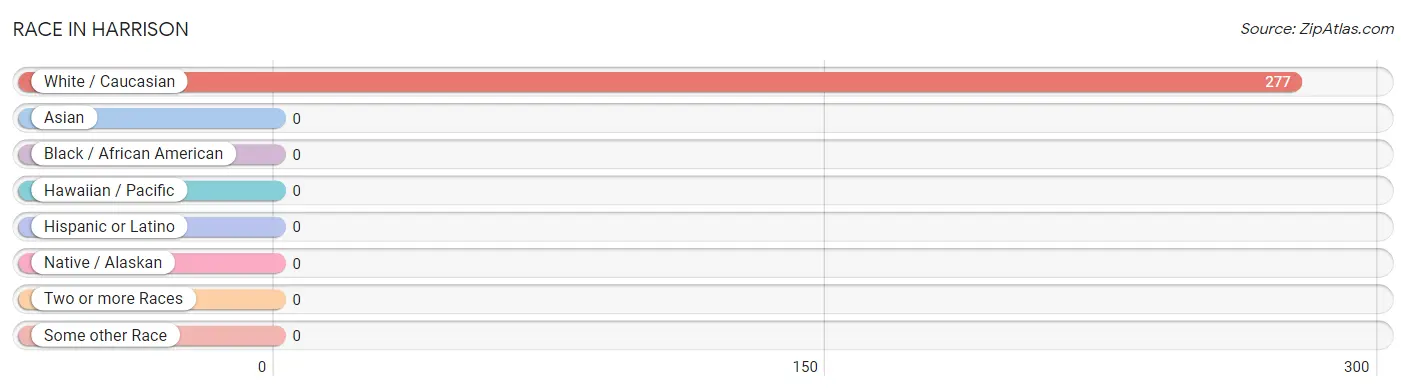
| Race | # Population | % Population |
| Asian | 0 | 0.0% |
| Black / African American | 0 | 0.0% |
| Hawaiian / Pacific | 0 | 0.0% |
| Hispanic or Latino | 0 | 0.0% |
| Native / Alaskan | 0 | 0.0% |
| White / Caucasian | 277 | 100.0% |
| Two or more Races | 0 | 0.0% |
| Some other Race | 0 | 0.0% |
| Total | 277 | 100.0% |
Ancestry in Harrison
The most populous ancestries reported in Harrison are German (96 | 34.7%), Polish (32 | 11.6%), Irish (23 | 8.3%), Norwegian (23 | 8.3%), and Danish (11 | 4.0%), together accounting for 66.8% of all Harrison residents.
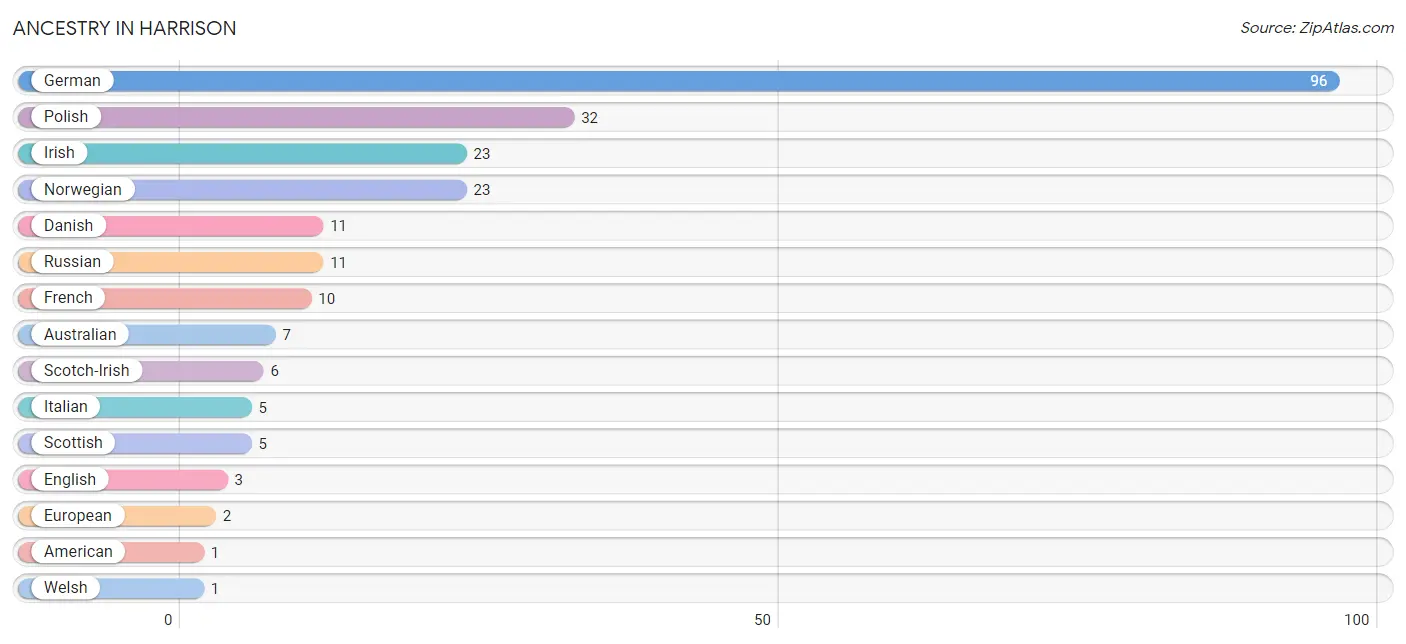
| Ancestry | # Population | % Population |
| American | 1 | 0.4% |
| Australian | 7 | 2.5% |
| Danish | 11 | 4.0% |
| English | 3 | 1.1% |
| European | 2 | 0.7% |
| French | 10 | 3.6% |
| German | 96 | 34.7% |
| Irish | 23 | 8.3% |
| Italian | 5 | 1.8% |
| Norwegian | 23 | 8.3% |
| Polish | 32 | 11.6% |
| Russian | 11 | 4.0% |
| Scotch-Irish | 6 | 2.2% |
| Scottish | 5 | 1.8% |
| Welsh | 1 | 0.4% | View All 15 Rows |
Immigrants in Harrison

| Immigration Origin | # Population | % Population | View All 0 Rows |
Sex and Age in Harrison
Sex and Age in Harrison
The most populous age groups in Harrison are 55 to 59 Years (40 | 26.0%) for men and 50 to 54 Years (31 | 25.2%) for women.
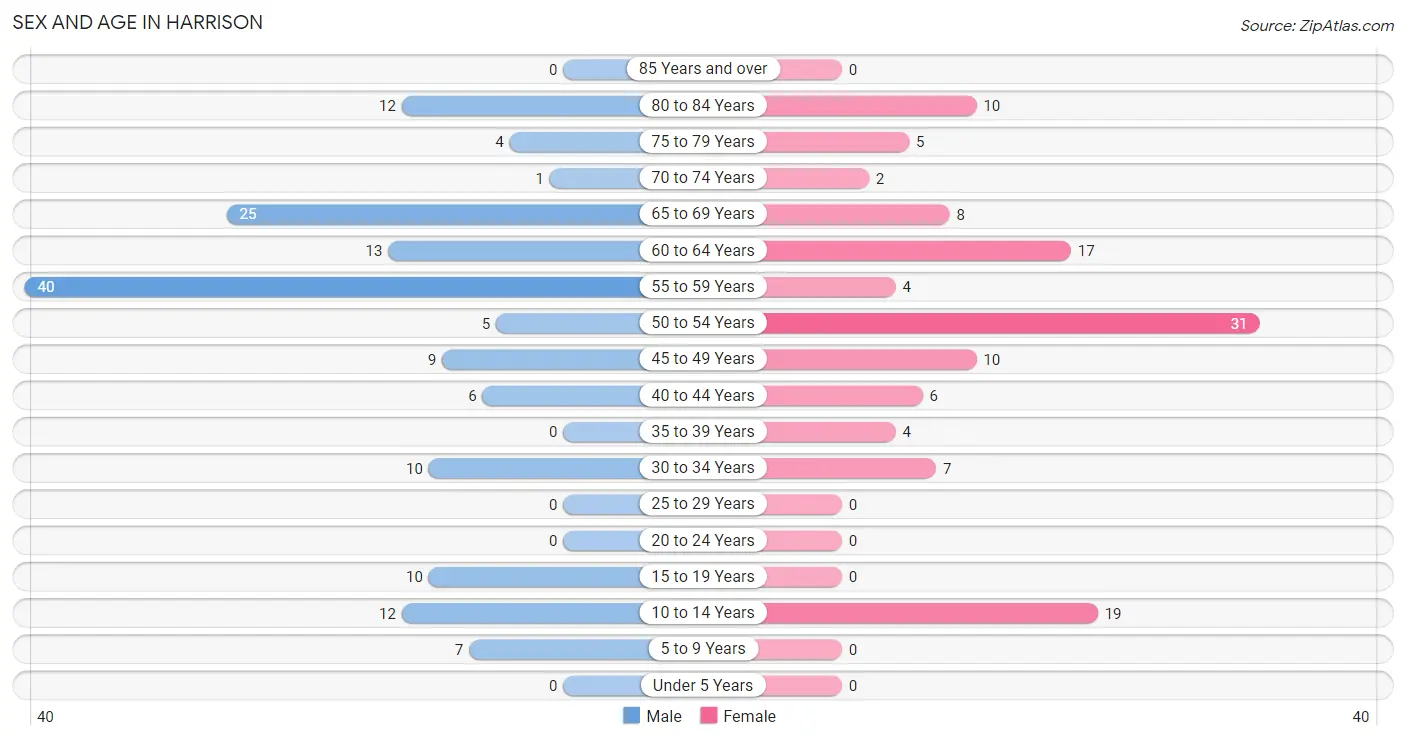
| Age Bracket | Male | Female |
| Under 5 Years | 0 (0.0%) | 0 (0.0%) |
| 5 to 9 Years | 7 (4.5%) | 0 (0.0%) |
| 10 to 14 Years | 12 (7.8%) | 19 (15.4%) |
| 15 to 19 Years | 10 (6.5%) | 0 (0.0%) |
| 20 to 24 Years | 0 (0.0%) | 0 (0.0%) |
| 25 to 29 Years | 0 (0.0%) | 0 (0.0%) |
| 30 to 34 Years | 10 (6.5%) | 7 (5.7%) |
| 35 to 39 Years | 0 (0.0%) | 4 (3.3%) |
| 40 to 44 Years | 6 (3.9%) | 6 (4.9%) |
| 45 to 49 Years | 9 (5.8%) | 10 (8.1%) |
| 50 to 54 Years | 5 (3.3%) | 31 (25.2%) |
| 55 to 59 Years | 40 (26.0%) | 4 (3.3%) |
| 60 to 64 Years | 13 (8.4%) | 17 (13.8%) |
| 65 to 69 Years | 25 (16.2%) | 8 (6.5%) |
| 70 to 74 Years | 1 (0.6%) | 2 (1.6%) |
| 75 to 79 Years | 4 (2.6%) | 5 (4.1%) |
| 80 to 84 Years | 12 (7.8%) | 10 (8.1%) |
| 85 Years and over | 0 (0.0%) | 0 (0.0%) |
| Total | 154 (100.0%) | 123 (100.0%) |
Families and Households in Harrison
Median Family Size in Harrison
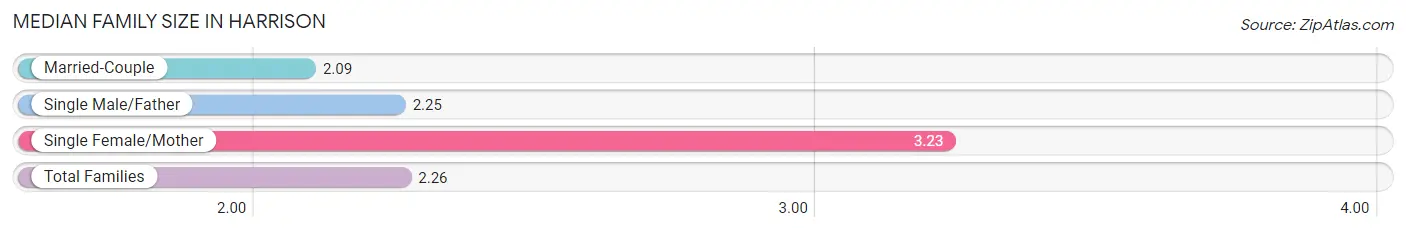
The median family size in Harrison is 2.26 persons per family, with single female/mother families (13 | 13.8%) accounting for the largest median family size of 3.23 persons per family. On the other hand, married-couple families (77 | 81.9%) represent the smallest median family size with 2.09 persons per family.
| Family Type | # Families | Family Size |
| Married-Couple | 77 (81.9%) | 2.09 |
| Single Male/Father | 4 (4.3%) | 2.25 |
| Single Female/Mother | 13 (13.8%) | 3.23 |
| Total Families | 94 (100.0%) | 2.26 |
Median Household Size in Harrison
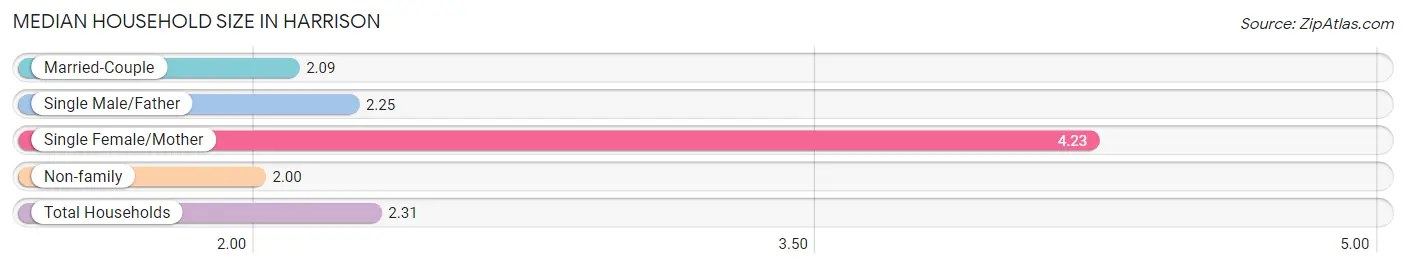
The median household size in Harrison is 2.31 persons per household, with single female/mother households (13 | 10.8%) accounting for the largest median household size of 4.23 persons per household. non-family households (26 | 21.7%) represent the smallest median household size with 2.00 persons per household.
| Household Type | # Households | Household Size |
| Married-Couple | 77 (64.2%) | 2.09 |
| Single Male/Father | 4 (3.3%) | 2.25 |
| Single Female/Mother | 13 (10.8%) | 4.23 |
| Non-family | 26 (21.7%) | 2.00 |
| Total Households | 120 (100.0%) | 2.31 |
Household Size by Marriage Status in Harrison
Out of a total of 120 households in Harrison, 94 (78.3%) are family households, while 26 (21.7%) are nonfamily households. The most numerous type of family households are 2-person households, comprising 71, and the most common type of nonfamily households are 1-person households, comprising 17.
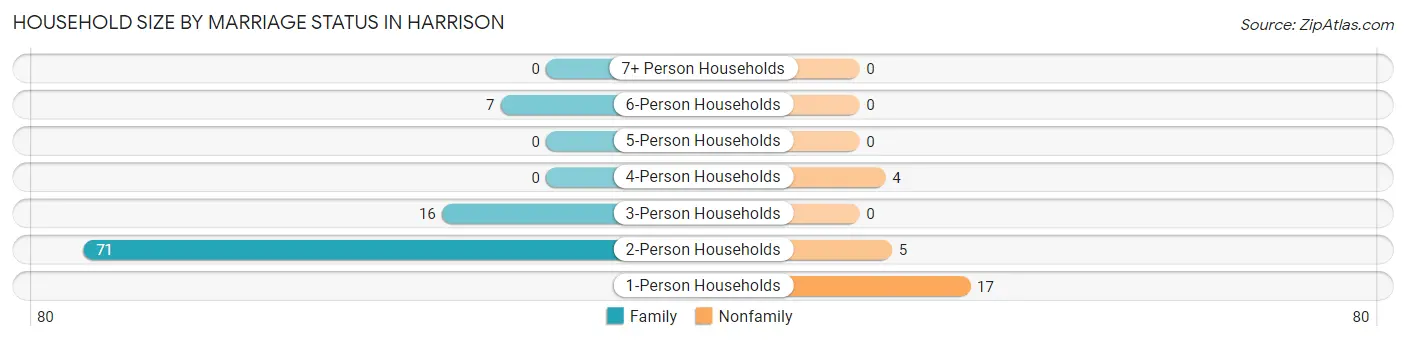
| Household Size | Family Households | Nonfamily Households |
| 1-Person Households | - | 17 (14.2%) |
| 2-Person Households | 71 (59.2%) | 5 (4.2%) |
| 3-Person Households | 16 (13.3%) | 0 (0.0%) |
| 4-Person Households | 0 (0.0%) | 4 (3.3%) |
| 5-Person Households | 0 (0.0%) | 0 (0.0%) |
| 6-Person Households | 7 (5.8%) | 0 (0.0%) |
| 7+ Person Households | 0 (0.0%) | 0 (0.0%) |
| Total | 94 (78.3%) | 26 (21.7%) |
Female Fertility in Harrison
Fertility by Age in Harrison
| Age Bracket | Women with Births | Births / 1,000 Women |
| 15 to 19 years | 0 (0.0%) | 0.0 |
| 20 to 34 years | 0 (0.0%) | 0.0 |
| 35 to 50 years | 0 (0.0%) | 0.0 |
| Total | 0 (0.0%) | 0.0 |
Fertility by Age by Marriage Status in Harrison
| Age Bracket | Married | Unmarried |
| 15 to 19 years | 0 (0.0%) | 0 (0.0%) |
| 20 to 34 years | 0 (0.0%) | 0 (0.0%) |
| 35 to 50 years | 0 (0.0%) | 0 (0.0%) |
| Total | 0 (0.0%) | 0 (0.0%) |
Fertility by Education in Harrison
| Educational Attainment | Women with Births | Births / 1,000 Women |
| Less than High School | 0 (0.0%) | 0.0 |
| High School Diploma | 0 (0.0%) | 0.0 |
| College or Associate's Degree | 0 (0.0%) | 0.0 |
| Bachelor's Degree | 0 (0.0%) | 0.0 |
| Graduate Degree | 0 (0.0%) | 0.0 |
| Total | 0 (0.0%) | 0.0 |
Fertility by Education by Marriage Status in Harrison
| Educational Attainment | Married | Unmarried |
| Less than High School | 0 (0.0%) | 0 (0.0%) |
| High School Diploma | 0 (0.0%) | 0 (0.0%) |
| College or Associate's Degree | 0 (0.0%) | 0 (0.0%) |
| Bachelor's Degree | 0 (0.0%) | 0 (0.0%) |
| Graduate Degree | 0 (0.0%) | 0 (0.0%) |
| Total | 0 (0.0%) | 0 (0.0%) |
Employment Characteristics in Harrison
Employment by Class of Employer in Harrison
Among the 98 employed individuals in Harrison, local government employees (46 | 46.9%), private company employees (37 | 37.8%), and self-employed (not incorporated) (9 | 9.2%) make up the most common classes of employment.
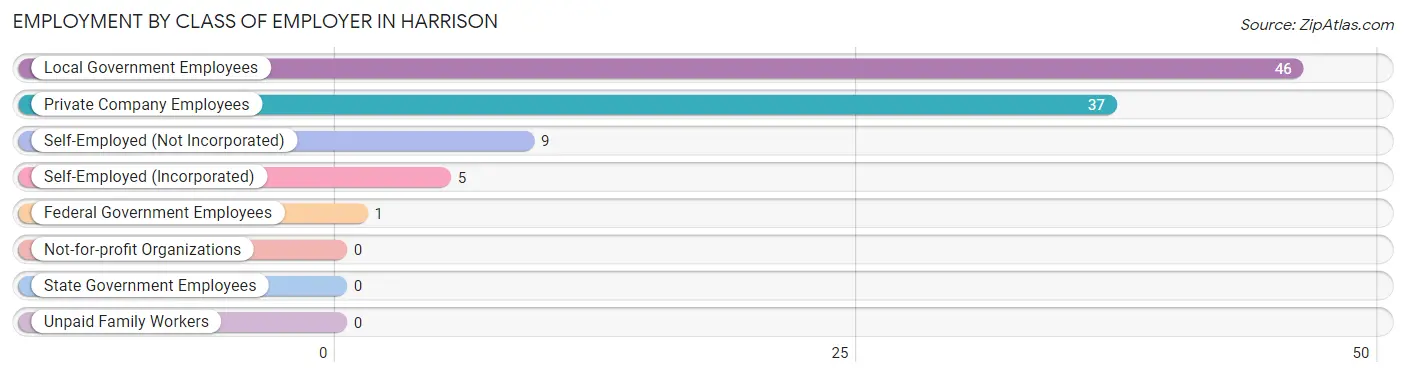
| Employer Class | # Employees | % Employees |
| Private Company Employees | 37 | 37.8% |
| Self-Employed (Incorporated) | 5 | 5.1% |
| Self-Employed (Not Incorporated) | 9 | 9.2% |
| Not-for-profit Organizations | 0 | 0.0% |
| Local Government Employees | 46 | 46.9% |
| State Government Employees | 0 | 0.0% |
| Federal Government Employees | 1 | 1.0% |
| Unpaid Family Workers | 0 | 0.0% |
| Total | 98 | 100.0% |
Employment Status by Age in Harrison
According to the labor force statistics for Harrison, out of the total population over 16 years of age (229), 47.6% or 109 individuals are in the labor force, with 10.1% or 11 of them unemployed. The age group with the highest labor force participation rate is 30 to 34 years, with 100.0% or 17 individuals in the labor force. Within the labor force, the 30 to 34 years age range has the highest percentage of unemployed individuals, with 35.3% or 6 of them being unemployed.
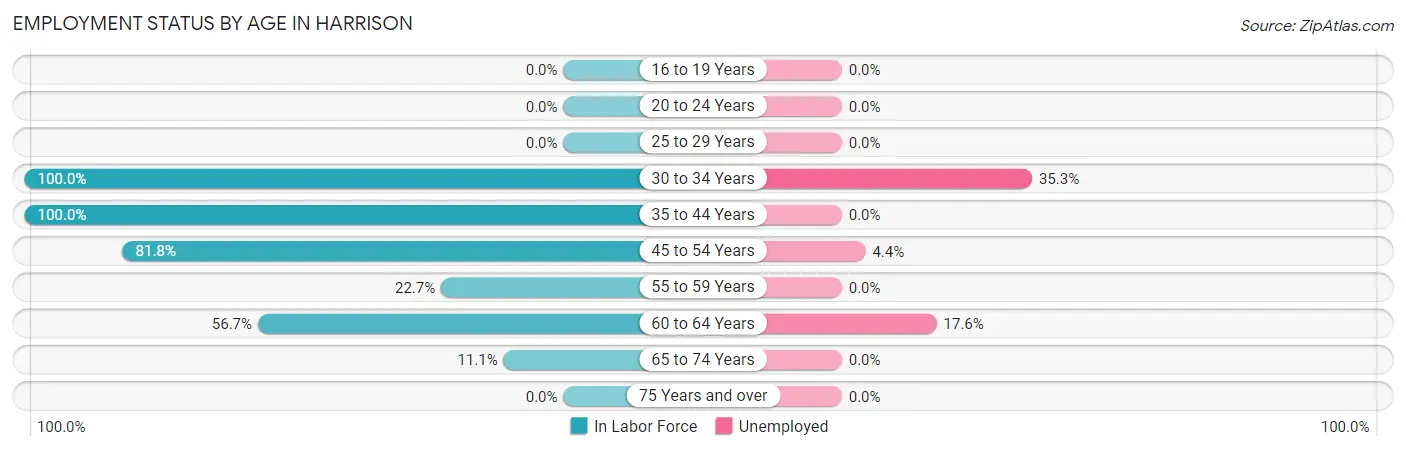
| Age Bracket | In Labor Force | Unemployed |
| 16 to 19 Years | 0 (0.0%) | 0 (0.0%) |
| 20 to 24 Years | 0 (0.0%) | 0 (0.0%) |
| 25 to 29 Years | 0 (0.0%) | 0 (0.0%) |
| 30 to 34 Years | 17 (100.0%) | 6 (35.3%) |
| 35 to 44 Years | 16 (100.0%) | 0 (0.0%) |
| 45 to 54 Years | 45 (81.8%) | 2 (4.4%) |
| 55 to 59 Years | 10 (22.7%) | 0 (0.0%) |
| 60 to 64 Years | 17 (56.7%) | 3 (17.6%) |
| 65 to 74 Years | 4 (11.1%) | 0 (0.0%) |
| 75 Years and over | 0 (0.0%) | 0 (0.0%) |
| Total | 109 (47.6%) | 11 (10.1%) |
Employment Status by Educational Attainment in Harrison
According to labor force statistics for Harrison, 64.8% of individuals (105) out of the total population between 25 and 64 years of age (162) are in the labor force, with 10.5% or 11 of them being unemployed. The group with the highest labor force participation rate are those with the educational attainment of college / associate degree, with 89.6% or 43 individuals in the labor force. Within the labor force, individuals with college / associate degree education have the highest percentage of unemployment, with 25.6% or 11 of them being unemployed.
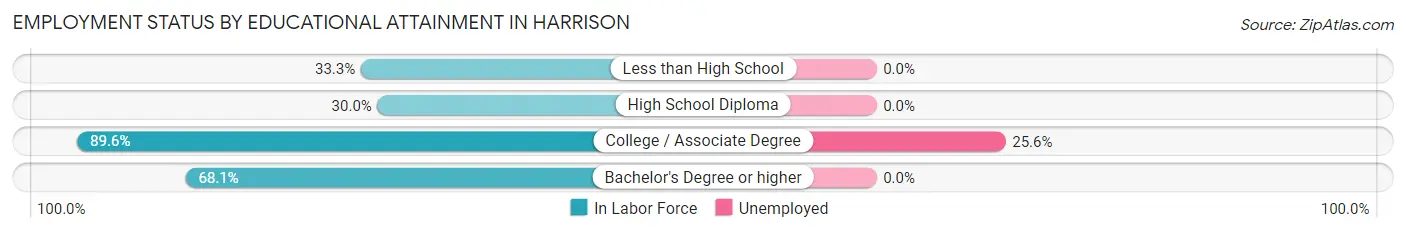
| Educational Attainment | In Labor Force | Unemployed |
| Less than High School | 4 (33.3%) | 0 (0.0%) |
| High School Diploma | 9 (30.0%) | 0 (0.0%) |
| College / Associate Degree | 43 (89.6%) | 12 (25.6%) |
| Bachelor's Degree or higher | 49 (68.1%) | 0 (0.0%) |
| Total | 105 (64.8%) | 17 (10.5%) |
Employment Occupations by Sex in Harrison
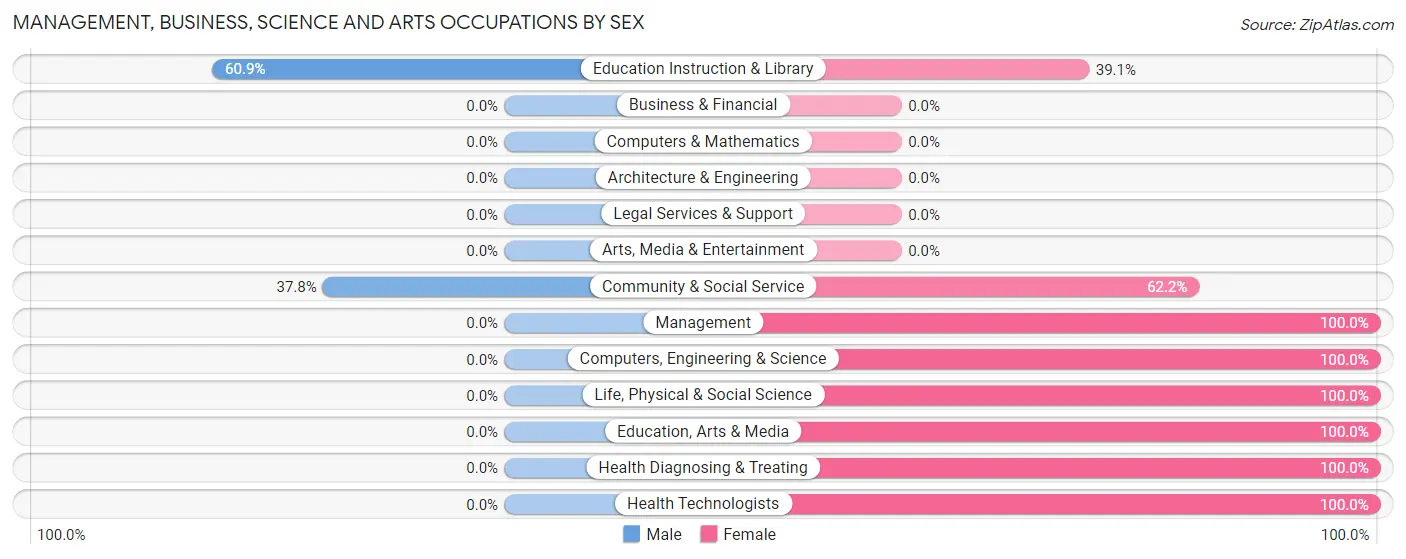
Management, Business, Science and Arts Occupations
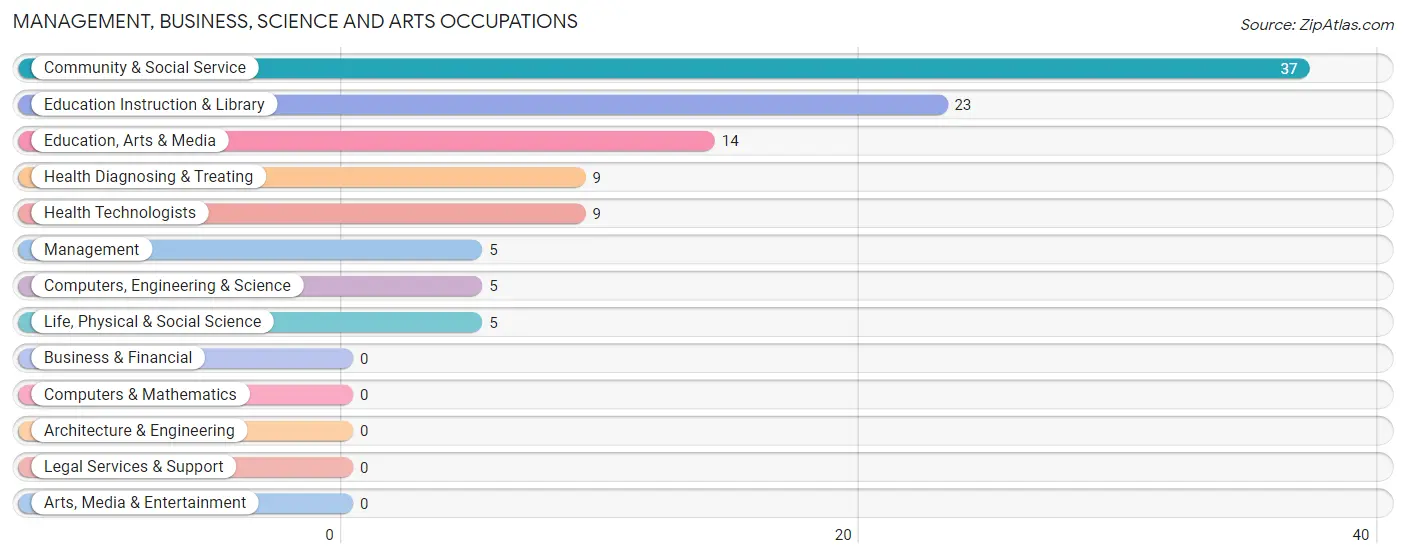
The most common Management, Business, Science and Arts occupations in Harrison are Community & Social Service (37 | 37.8%), Education Instruction & Library (23 | 23.5%), Education, Arts & Media (14 | 14.3%), Health Diagnosing & Treating (9 | 9.2%), and Health Technologists (9 | 9.2%).
Management, Business, Science and Arts Occupations by Sex
Within the Management, Business, Science and Arts occupations in Harrison, the most male-oriented occupations are Education Instruction & Library (60.9%), and Community & Social Service (37.8%), while the most female-oriented occupations are Management (100.0%), Computers, Engineering & Science (100.0%), and Life, Physical & Social Science (100.0%).
| Occupation | Male | Female |
| Management | 0 (0.0%) | 5 (100.0%) |
| Business & Financial | 0 (0.0%) | 0 (0.0%) |
| Computers, Engineering & Science | 0 (0.0%) | 5 (100.0%) |
| Computers & Mathematics | 0 (0.0%) | 0 (0.0%) |
| Architecture & Engineering | 0 (0.0%) | 0 (0.0%) |
| Life, Physical & Social Science | 0 (0.0%) | 5 (100.0%) |
| Community & Social Service | 14 (37.8%) | 23 (62.2%) |
| Education, Arts & Media | 0 (0.0%) | 14 (100.0%) |
| Legal Services & Support | 0 (0.0%) | 0 (0.0%) |
| Education Instruction & Library | 14 (60.9%) | 9 (39.1%) |
| Arts, Media & Entertainment | 0 (0.0%) | 0 (0.0%) |
| Health Diagnosing & Treating | 0 (0.0%) | 9 (100.0%) |
| Health Technologists | 0 (0.0%) | 9 (100.0%) |
| Total (Category) | 14 (25.0%) | 42 (75.0%) |
| Total (Overall) | 33 (33.7%) | 65 (66.3%) |
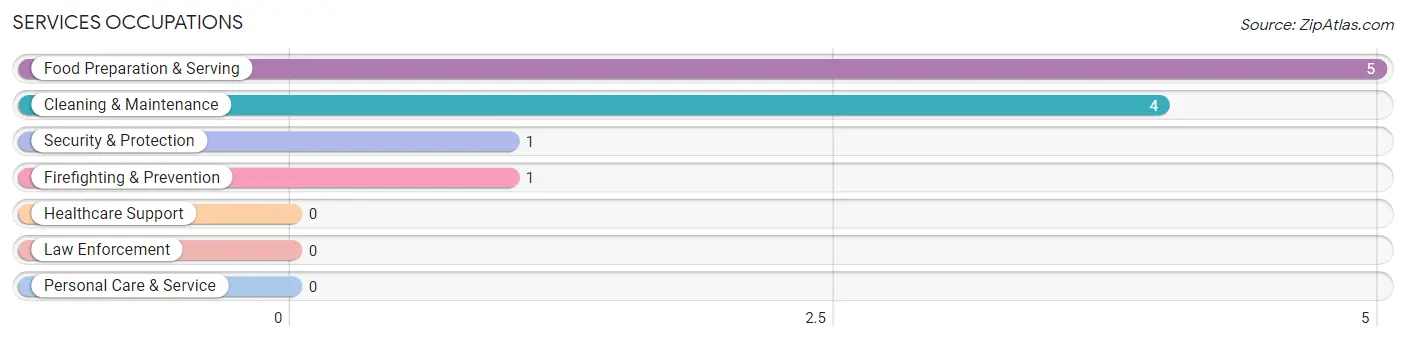
Services Occupations
The most common Services occupations in Harrison are Food Preparation & Serving (5 | 5.1%), Cleaning & Maintenance (4 | 4.1%), Security & Protection (1 | 1.0%), and Firefighting & Prevention (1 | 1.0%).
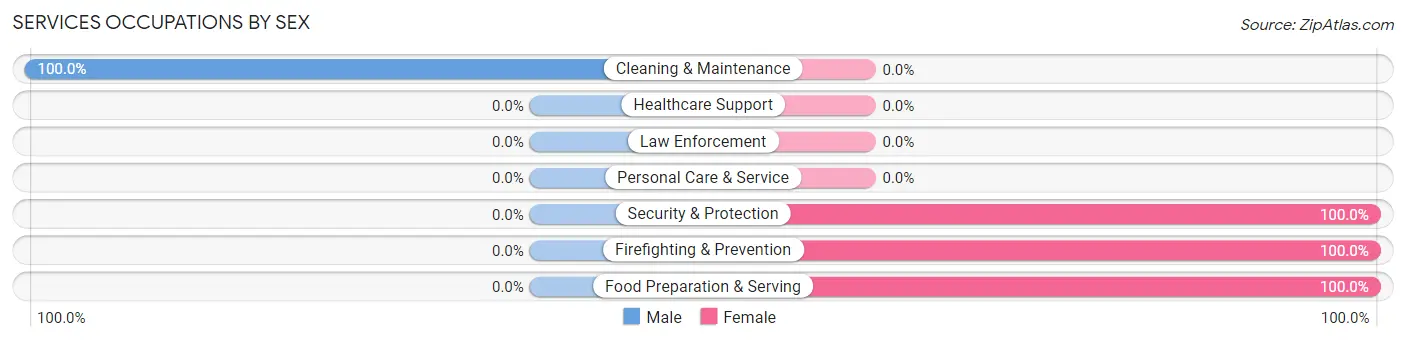
Services Occupations by Sex
| Occupation | Male | Female |
| Healthcare Support | 0 (0.0%) | 0 (0.0%) |
| Security & Protection | 0 (0.0%) | 1 (100.0%) |
| Firefighting & Prevention | 0 (0.0%) | 1 (100.0%) |
| Law Enforcement | 0 (0.0%) | 0 (0.0%) |
| Food Preparation & Serving | 0 (0.0%) | 5 (100.0%) |
| Cleaning & Maintenance | 4 (100.0%) | 0 (0.0%) |
| Personal Care & Service | 0 (0.0%) | 0 (0.0%) |
| Total (Category) | 4 (40.0%) | 6 (60.0%) |
| Total (Overall) | 33 (33.7%) | 65 (66.3%) |
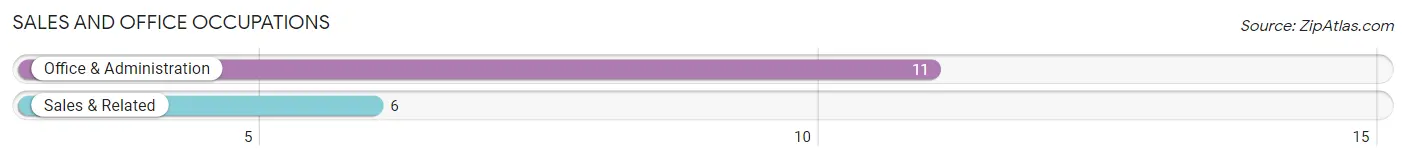
Sales and Office Occupations
The most common Sales and Office occupations in Harrison are Office & Administration (11 | 11.2%), and Sales & Related (6 | 6.1%).
Sales and Office Occupations by Sex
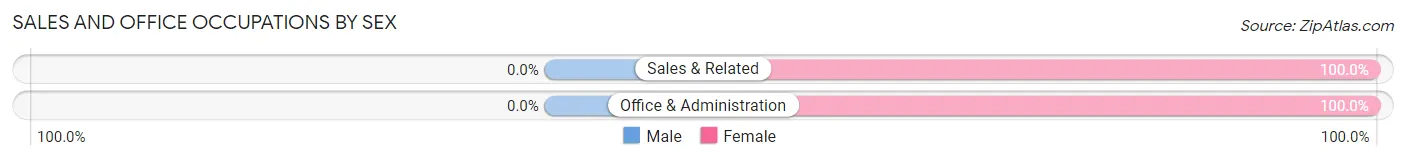
| Occupation | Male | Female |
| Sales & Related | 0 (0.0%) | 6 (100.0%) |
| Office & Administration | 0 (0.0%) | 11 (100.0%) |
| Total (Category) | 0 (0.0%) | 17 (100.0%) |
| Total (Overall) | 33 (33.7%) | 65 (66.3%) |
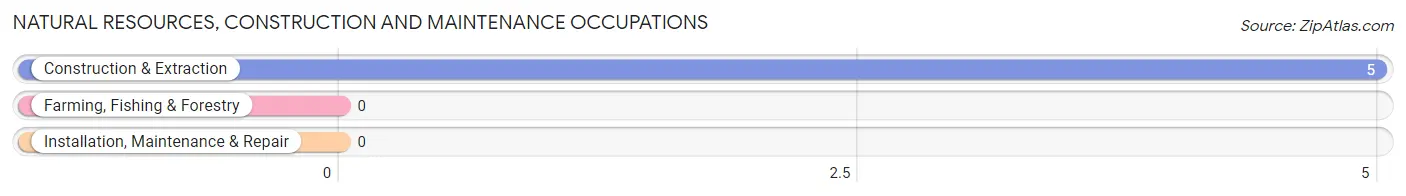
Natural Resources, Construction and Maintenance Occupations
The most common Natural Resources, Construction and Maintenance occupations in Harrison are , and Construction & Extraction (5 | 5.1%).
Natural Resources, Construction and Maintenance Occupations by Sex
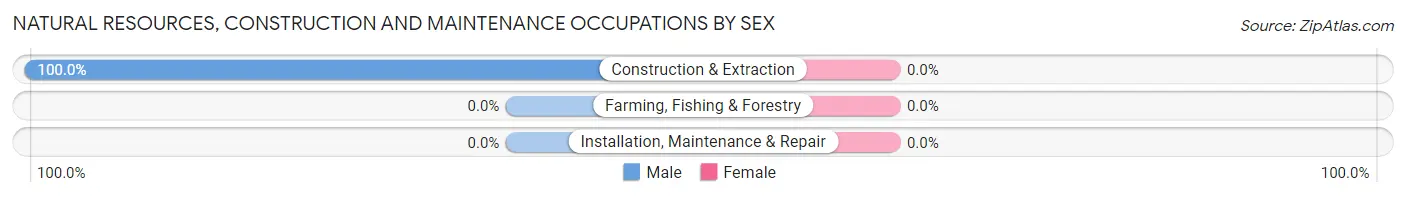
| Occupation | Male | Female |
| Farming, Fishing & Forestry | 0 (0.0%) | 0 (0.0%) |
| Construction & Extraction | 5 (100.0%) | 0 (0.0%) |
| Installation, Maintenance & Repair | 0 (0.0%) | 0 (0.0%) |
| Total (Category) | 5 (100.0%) | 0 (0.0%) |
| Total (Overall) | 33 (33.7%) | 65 (66.3%) |
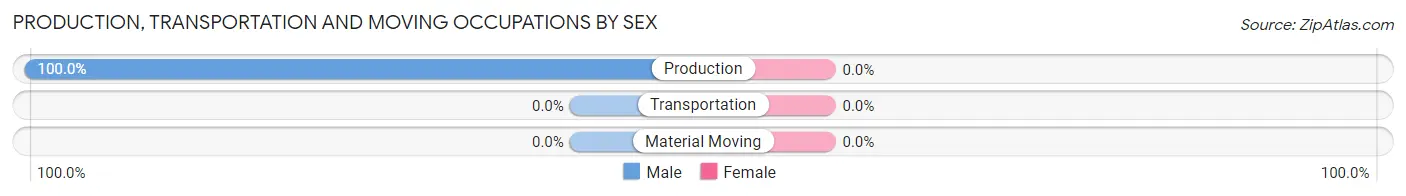
Production, Transportation and Moving Occupations
The most common Production, Transportation and Moving occupations in Harrison are , and Production (10 | 10.2%).
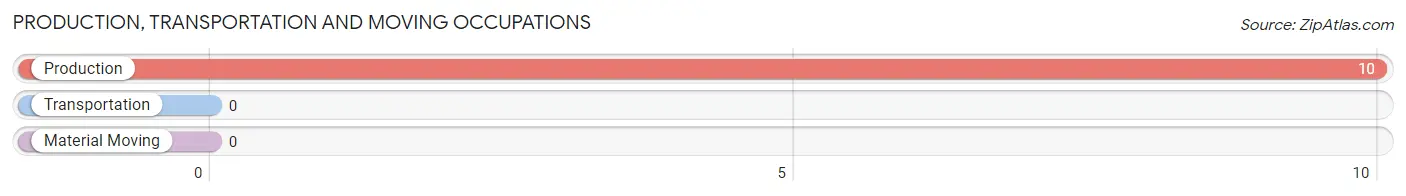
Production, Transportation and Moving Occupations by Sex
| Occupation | Male | Female |
| Production | 10 (100.0%) | 0 (0.0%) |
| Transportation | 0 (0.0%) | 0 (0.0%) |
| Material Moving | 0 (0.0%) | 0 (0.0%) |
| Total (Category) | 10 (100.0%) | 0 (0.0%) |
| Total (Overall) | 33 (33.7%) | 65 (66.3%) |
Employment Industries by Sex in Harrison
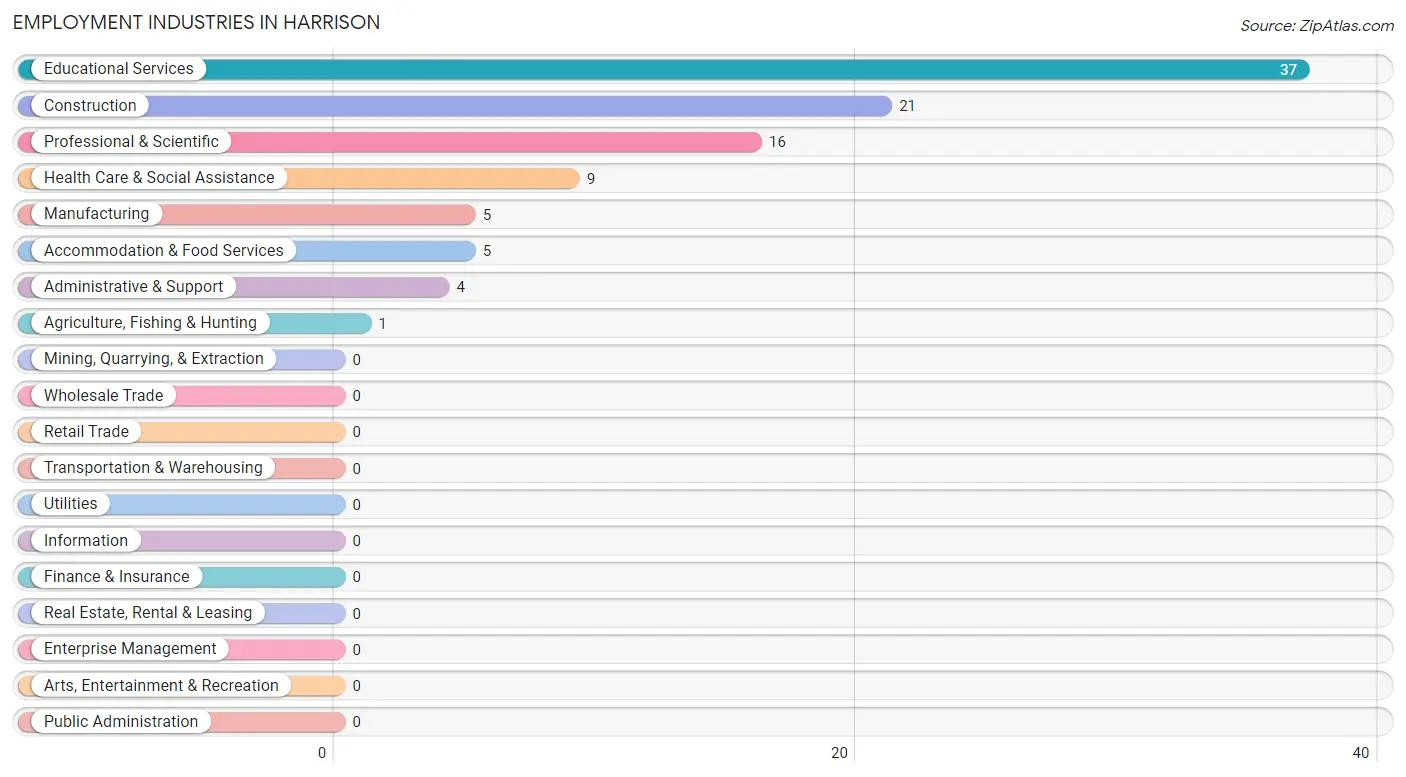
Employment Industries in Harrison
The major employment industries in Harrison include Educational Services (37 | 37.8%), Construction (21 | 21.4%), Professional & Scientific (16 | 16.3%), Health Care & Social Assistance (9 | 9.2%), and Manufacturing (5 | 5.1%).
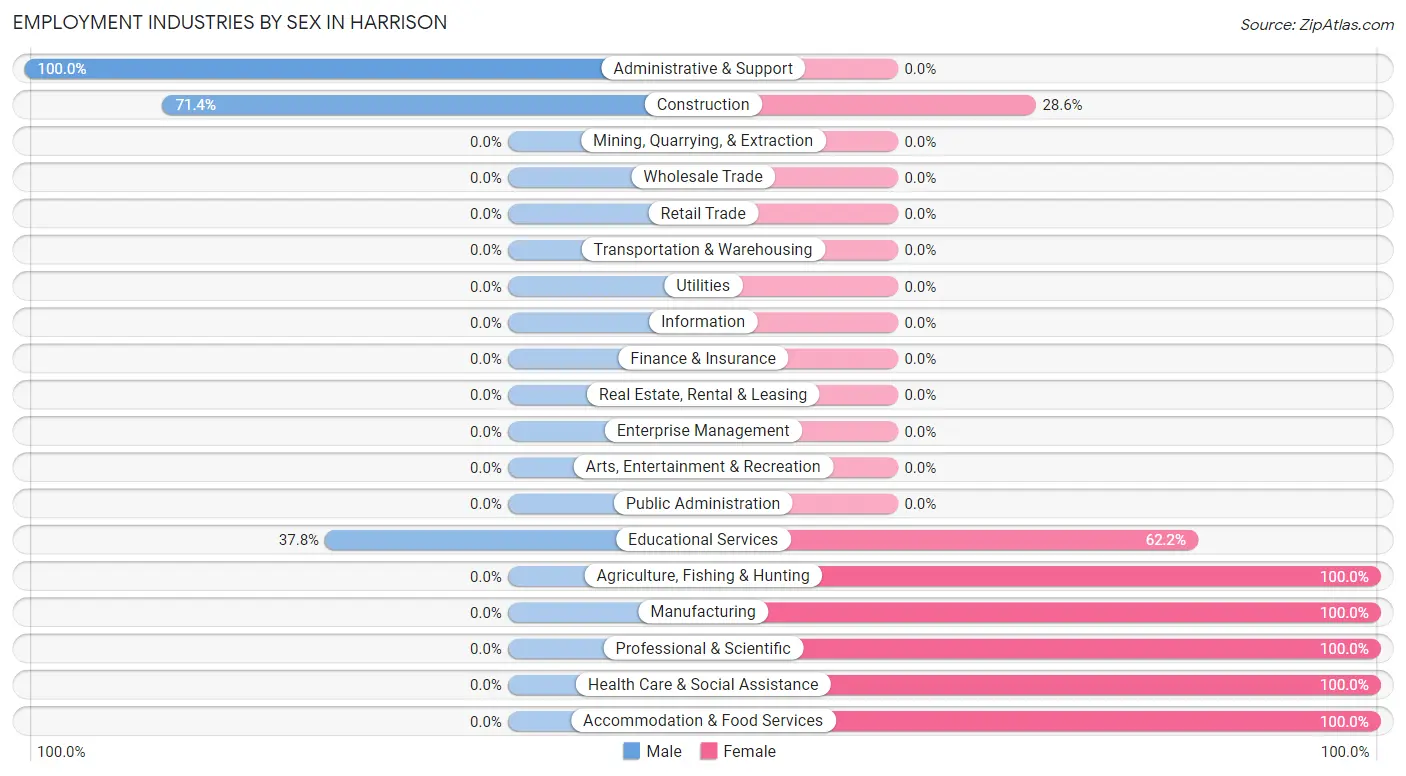
Employment Industries by Sex in Harrison
The Harrison industries that see more men than women are Administrative & Support (100.0%), Construction (71.4%), and Educational Services (37.8%), whereas the industries that tend to have a higher number of women are Agriculture, Fishing & Hunting (100.0%), Manufacturing (100.0%), and Professional & Scientific (100.0%).
| Industry | Male | Female |
| Agriculture, Fishing & Hunting | 0 (0.0%) | 1 (100.0%) |
| Mining, Quarrying, & Extraction | 0 (0.0%) | 0 (0.0%) |
| Construction | 15 (71.4%) | 6 (28.6%) |
| Manufacturing | 0 (0.0%) | 5 (100.0%) |
| Wholesale Trade | 0 (0.0%) | 0 (0.0%) |
| Retail Trade | 0 (0.0%) | 0 (0.0%) |
| Transportation & Warehousing | 0 (0.0%) | 0 (0.0%) |
| Utilities | 0 (0.0%) | 0 (0.0%) |
| Information | 0 (0.0%) | 0 (0.0%) |
| Finance & Insurance | 0 (0.0%) | 0 (0.0%) |
| Real Estate, Rental & Leasing | 0 (0.0%) | 0 (0.0%) |
| Professional & Scientific | 0 (0.0%) | 16 (100.0%) |
| Enterprise Management | 0 (0.0%) | 0 (0.0%) |
| Administrative & Support | 4 (100.0%) | 0 (0.0%) |
| Educational Services | 14 (37.8%) | 23 (62.2%) |
| Health Care & Social Assistance | 0 (0.0%) | 9 (100.0%) |
| Arts, Entertainment & Recreation | 0 (0.0%) | 0 (0.0%) |
| Accommodation & Food Services | 0 (0.0%) | 5 (100.0%) |
| Public Administration | 0 (0.0%) | 0 (0.0%) |
| Total | 33 (33.7%) | 65 (66.3%) |
Education in Harrison
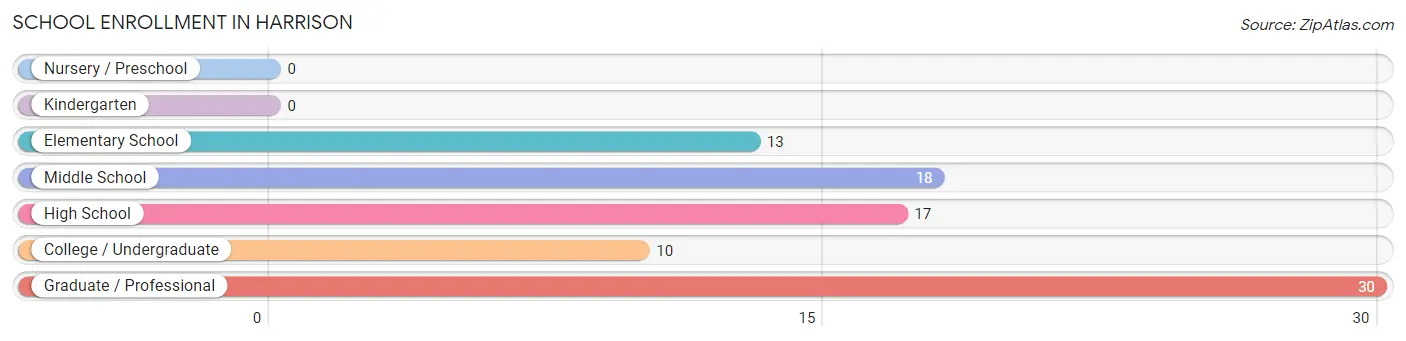
School Enrollment in Harrison
The most common levels of schooling among the 88 students in Harrison are graduate / professional (30 | 34.1%), middle school (18 | 20.4%), and high school (17 | 19.3%).
| School Level | # Students | % Students |
| Nursery / Preschool | 0 | 0.0% |
| Kindergarten | 0 | 0.0% |
| Elementary School | 13 | 14.8% |
| Middle School | 18 | 20.4% |
| High School | 17 | 19.3% |
| College / Undergraduate | 10 | 11.4% |
| Graduate / Professional | 30 | 34.1% |
| Total | 88 | 100.0% |
School Enrollment by Age by Funding Source in Harrison
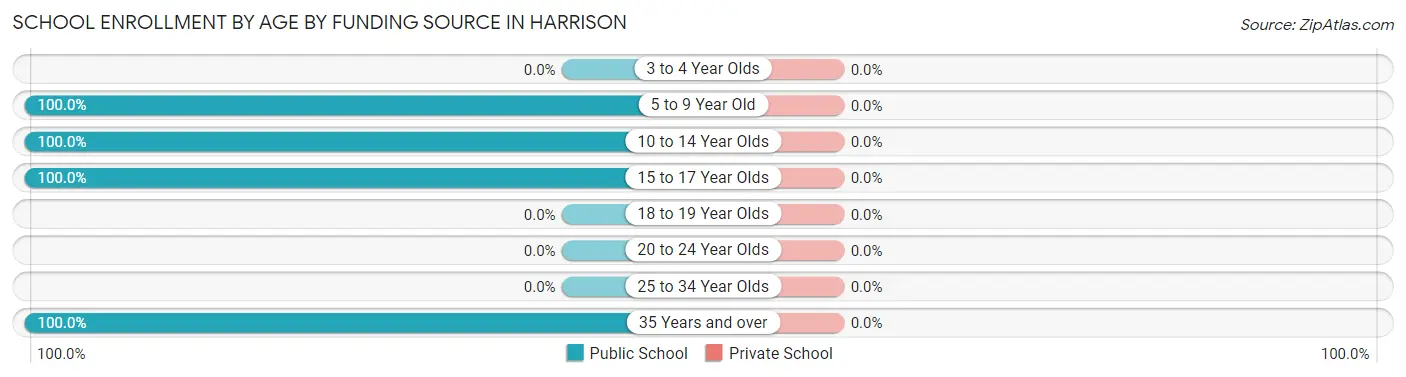
| Age Bracket | Public School | Private School |
| 3 to 4 Year Olds | 0 (0.0%) | 0 (0.0%) |
| 5 to 9 Year Old | 7 (100.0%) | 0 (0.0%) |
| 10 to 14 Year Olds | 31 (100.0%) | 0 (0.0%) |
| 15 to 17 Year Olds | 10 (100.0%) | 0 (0.0%) |
| 18 to 19 Year Olds | 0 (0.0%) | 0 (0.0%) |
| 20 to 24 Year Olds | 0 (0.0%) | 0 (0.0%) |
| 25 to 34 Year Olds | 0 (0.0%) | 0 (0.0%) |
| 35 Years and over | 40 (100.0%) | 0 (0.0%) |
| Total | 88 (100.0%) | 0 (0.0%) |
Educational Attainment by Field of Study in Harrison
Education (44 | 29.5%), arts & humanities (18 | 12.1%), science & technology (15 | 10.1%), psychology (14 | 9.4%), and physical & health sciences (12 | 8.1%) are the most common fields of study among 149 individuals in Harrison who have obtained a bachelor's degree or higher.
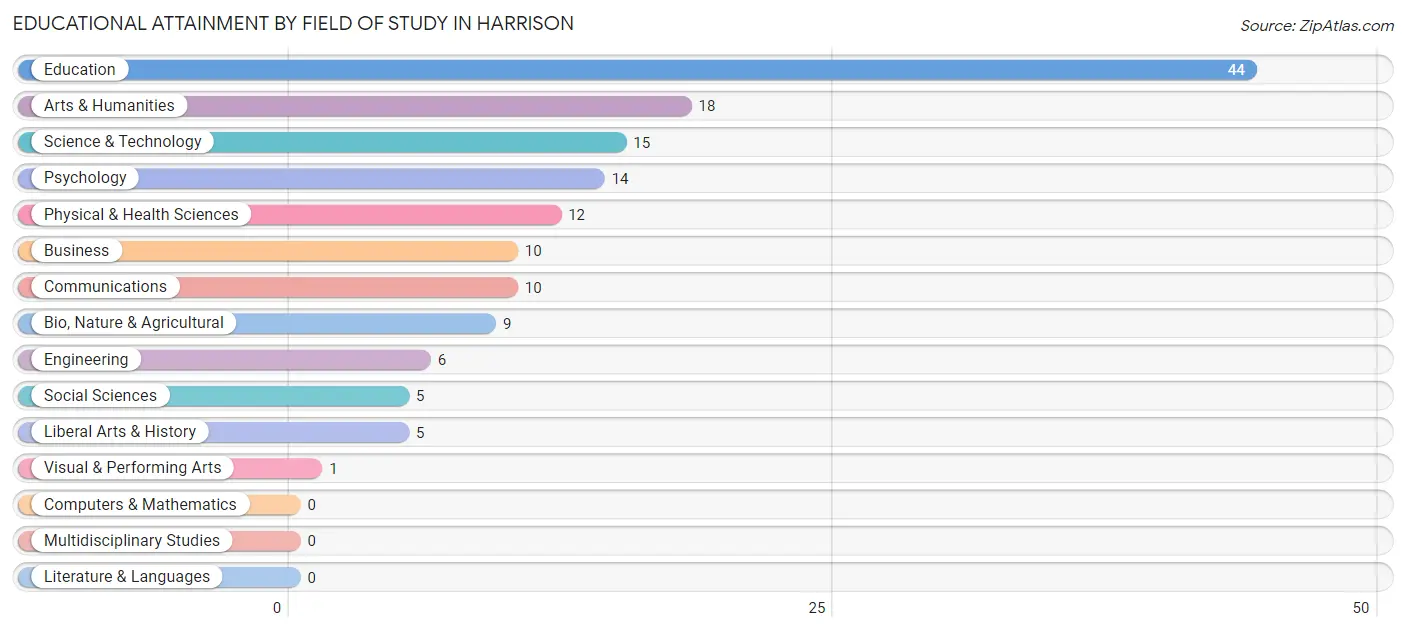
| Field of Study | # Graduates | % Graduates |
| Computers & Mathematics | 0 | 0.0% |
| Bio, Nature & Agricultural | 9 | 6.0% |
| Physical & Health Sciences | 12 | 8.1% |
| Psychology | 14 | 9.4% |
| Social Sciences | 5 | 3.4% |
| Engineering | 6 | 4.0% |
| Multidisciplinary Studies | 0 | 0.0% |
| Science & Technology | 15 | 10.1% |
| Business | 10 | 6.7% |
| Education | 44 | 29.5% |
| Literature & Languages | 0 | 0.0% |
| Liberal Arts & History | 5 | 3.4% |
| Visual & Performing Arts | 1 | 0.7% |
| Communications | 10 | 6.7% |
| Arts & Humanities | 18 | 12.1% |
| Total | 149 | 100.0% |
Transportation & Commute in Harrison
Vehicle Availability by Sex in Harrison
The most prevalent vehicle ownership categories in Harrison are males with 4 vehicles (16, accounting for 48.5%) and females with 4 vehicles (30, making up 24.6%).
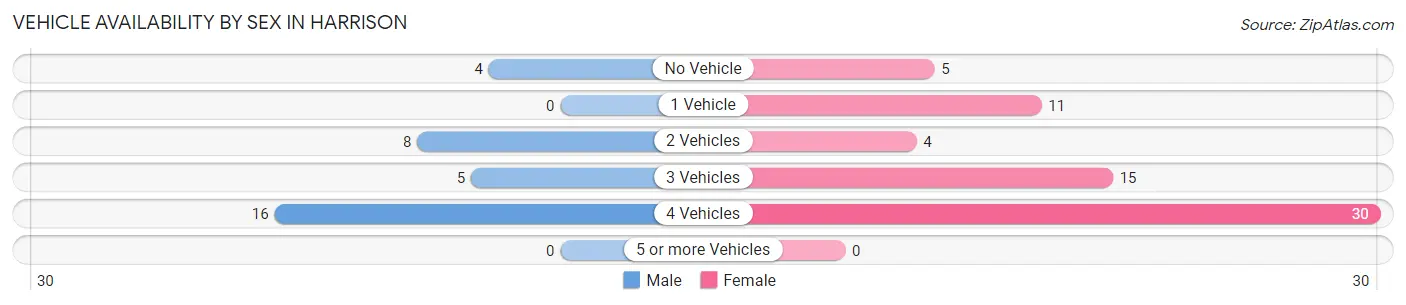
| Vehicles Available | Male | Female |
| No Vehicle | 4 (12.1%) | 5 (7.7%) |
| 1 Vehicle | 0 (0.0%) | 11 (16.9%) |
| 2 Vehicles | 8 (24.2%) | 4 (6.1%) |
| 3 Vehicles | 5 (15.1%) | 15 (23.1%) |
| 4 Vehicles | 16 (48.5%) | 30 (46.2%) |
| 5 or more Vehicles | 0 (0.0%) | 0 (0.0%) |
| Total | 33 (100.0%) | 65 (100.0%) |
Commute Time in Harrison
The most frequently occuring commute durations in Harrison are 10 to 14 minutes (34 commuters, 42.0%), 20 to 24 minutes (18 commuters, 22.2%), and 30 to 34 minutes (9 commuters, 11.1%).
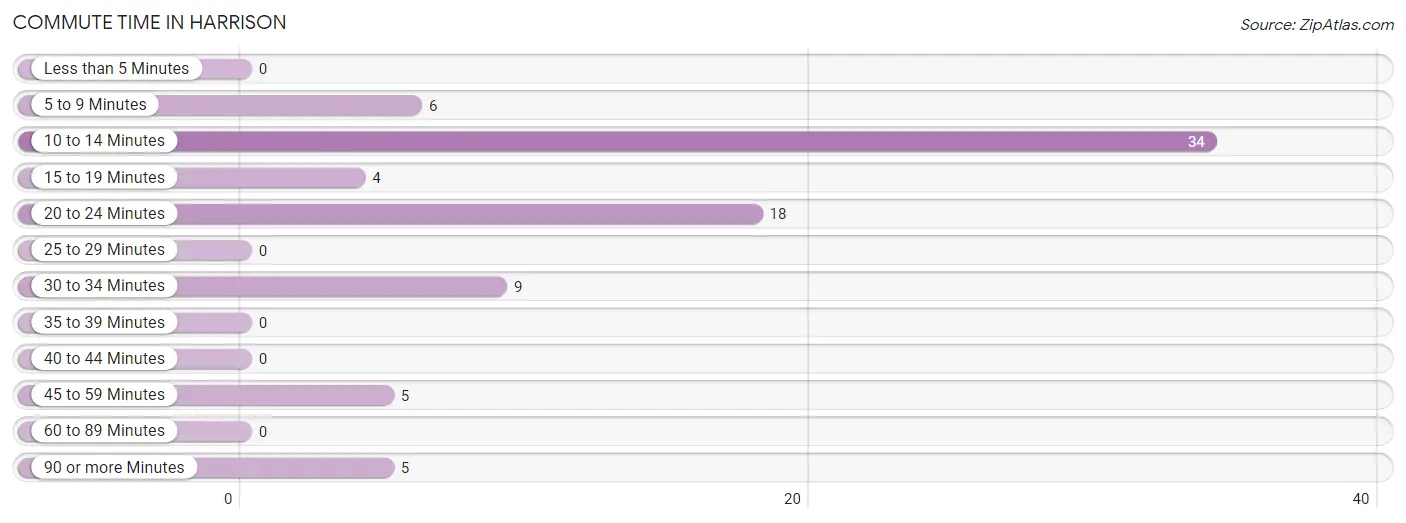
| Commute Time | # Commuters | % Commuters |
| Less than 5 Minutes | 0 | 0.0% |
| 5 to 9 Minutes | 6 | 7.4% |
| 10 to 14 Minutes | 34 | 42.0% |
| 15 to 19 Minutes | 4 | 4.9% |
| 20 to 24 Minutes | 18 | 22.2% |
| 25 to 29 Minutes | 0 | 0.0% |
| 30 to 34 Minutes | 9 | 11.1% |
| 35 to 39 Minutes | 0 | 0.0% |
| 40 to 44 Minutes | 0 | 0.0% |
| 45 to 59 Minutes | 5 | 6.2% |
| 60 to 89 Minutes | 0 | 0.0% |
| 90 or more Minutes | 5 | 6.2% |
Commute Time by Sex in Harrison
The most common commute times in Harrison are 10 to 14 minutes (16 commuters, 55.2%) for males and 10 to 14 minutes (18 commuters, 34.6%) for females.
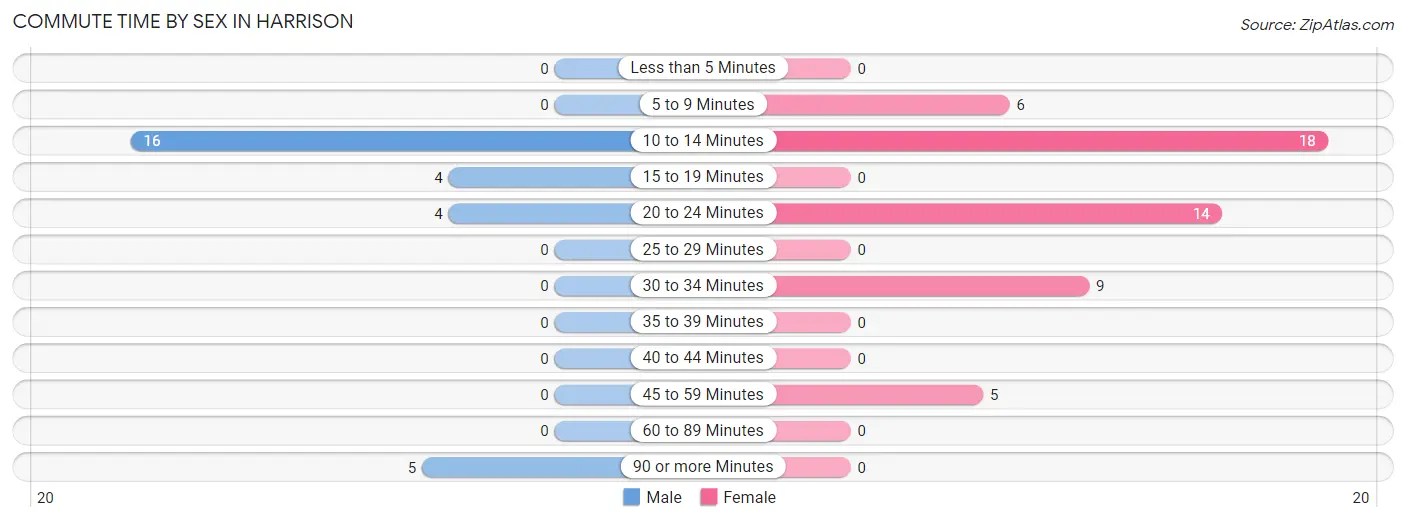
| Commute Time | Male | Female |
| Less than 5 Minutes | 0 (0.0%) | 0 (0.0%) |
| 5 to 9 Minutes | 0 (0.0%) | 6 (11.5%) |
| 10 to 14 Minutes | 16 (55.2%) | 18 (34.6%) |
| 15 to 19 Minutes | 4 (13.8%) | 0 (0.0%) |
| 20 to 24 Minutes | 4 (13.8%) | 14 (26.9%) |
| 25 to 29 Minutes | 0 (0.0%) | 0 (0.0%) |
| 30 to 34 Minutes | 0 (0.0%) | 9 (17.3%) |
| 35 to 39 Minutes | 0 (0.0%) | 0 (0.0%) |
| 40 to 44 Minutes | 0 (0.0%) | 0 (0.0%) |
| 45 to 59 Minutes | 0 (0.0%) | 5 (9.6%) |
| 60 to 89 Minutes | 0 (0.0%) | 0 (0.0%) |
| 90 or more Minutes | 5 (17.2%) | 0 (0.0%) |
Time of Departure to Work by Sex in Harrison
The most frequent times of departure to work in Harrison are 6:00 AM to 6:29 AM (19, 65.5%) for males and 6:30 AM to 6:59 AM (15, 28.8%) for females.
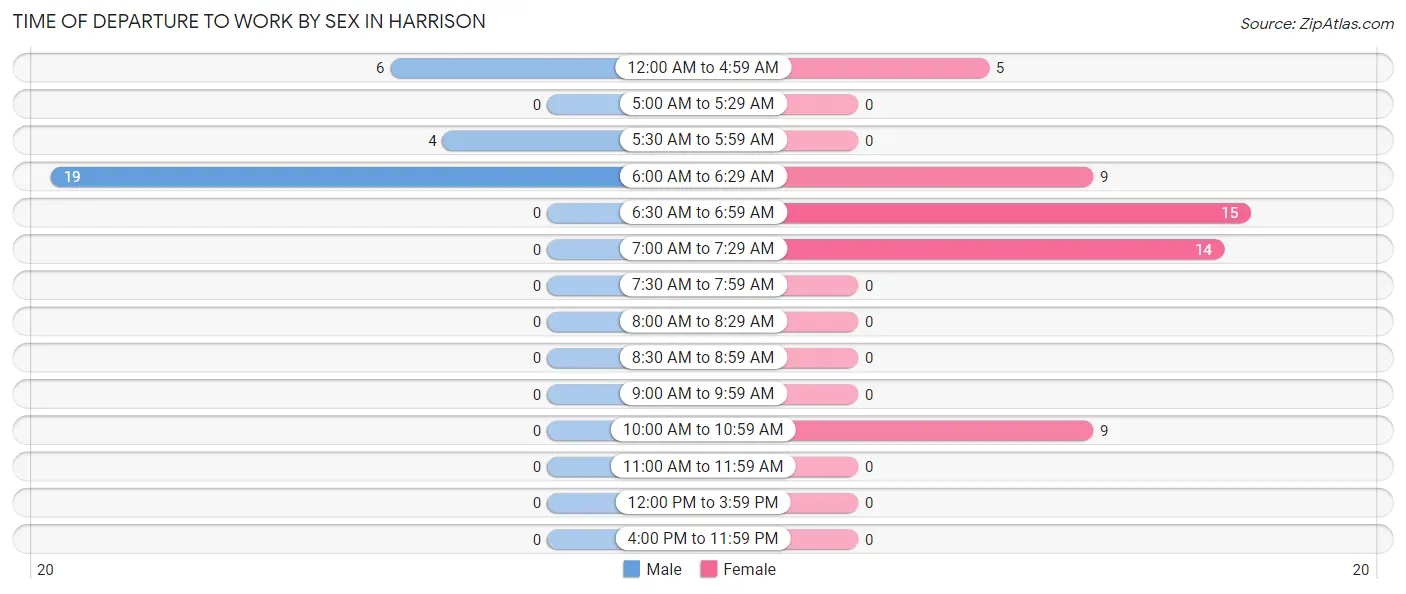
| Time of Departure | Male | Female |
| 12:00 AM to 4:59 AM | 6 (20.7%) | 5 (9.6%) |
| 5:00 AM to 5:29 AM | 0 (0.0%) | 0 (0.0%) |
| 5:30 AM to 5:59 AM | 4 (13.8%) | 0 (0.0%) |
| 6:00 AM to 6:29 AM | 19 (65.5%) | 9 (17.3%) |
| 6:30 AM to 6:59 AM | 0 (0.0%) | 15 (28.8%) |
| 7:00 AM to 7:29 AM | 0 (0.0%) | 14 (26.9%) |
| 7:30 AM to 7:59 AM | 0 (0.0%) | 0 (0.0%) |
| 8:00 AM to 8:29 AM | 0 (0.0%) | 0 (0.0%) |
| 8:30 AM to 8:59 AM | 0 (0.0%) | 0 (0.0%) |
| 9:00 AM to 9:59 AM | 0 (0.0%) | 0 (0.0%) |
| 10:00 AM to 10:59 AM | 0 (0.0%) | 9 (17.3%) |
| 11:00 AM to 11:59 AM | 0 (0.0%) | 0 (0.0%) |
| 12:00 PM to 3:59 PM | 0 (0.0%) | 0 (0.0%) |
| 4:00 PM to 11:59 PM | 0 (0.0%) | 0 (0.0%) |
| Total | 29 (100.0%) | 52 (100.0%) |
Housing Occupancy in Harrison
Occupancy by Ownership in Harrison
Of the total 120 dwellings in Harrison, owner-occupied units account for 99 (82.5%), while renter-occupied units make up 21 (17.5%).
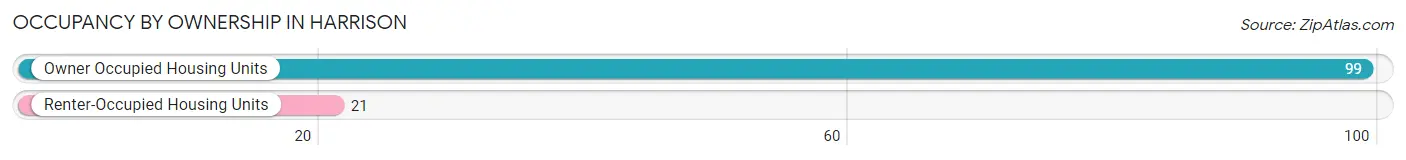
| Occupancy | # Housing Units | % Housing Units |
| Owner Occupied Housing Units | 99 | 82.5% |
| Renter-Occupied Housing Units | 21 | 17.5% |
| Total Occupied Housing Units | 120 | 100.0% |
Occupancy by Household Size in Harrison
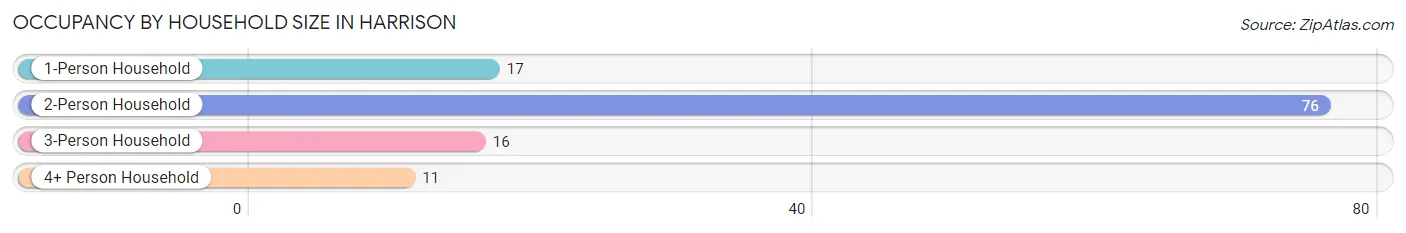
| Household Size | # Housing Units | % Housing Units |
| 1-Person Household | 17 | 14.2% |
| 2-Person Household | 76 | 63.3% |
| 3-Person Household | 16 | 13.3% |
| 4+ Person Household | 11 | 9.2% |
| Total Housing Units | 120 | 100.0% |
Occupancy by Ownership by Household Size in Harrison
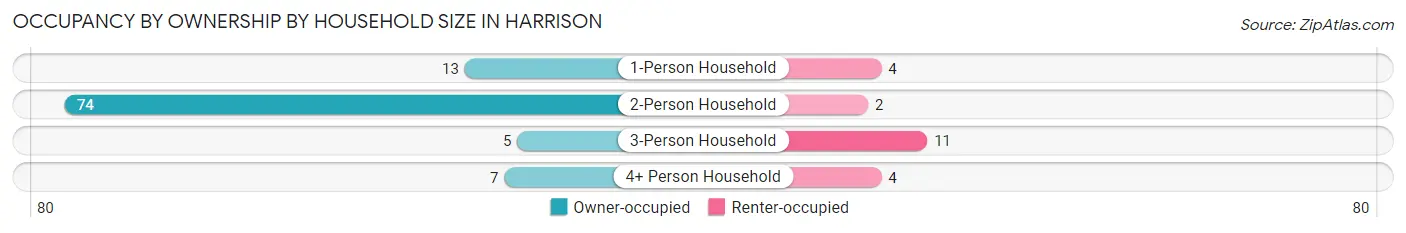
| Household Size | Owner-occupied | Renter-occupied |
| 1-Person Household | 13 (76.5%) | 4 (23.5%) |
| 2-Person Household | 74 (97.4%) | 2 (2.6%) |
| 3-Person Household | 5 (31.2%) | 11 (68.8%) |
| 4+ Person Household | 7 (63.6%) | 4 (36.4%) |
| Total Housing Units | 99 (82.5%) | 21 (17.5%) |
Occupancy by Educational Attainment in Harrison
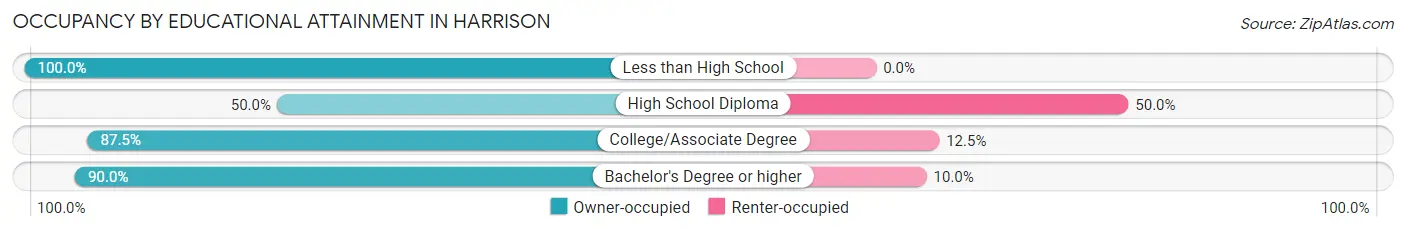
| Household Size | Owner-occupied | Renter-occupied |
| Less than High School | 6 (100.0%) | 0 (0.0%) |
| High School Diploma | 11 (50.0%) | 11 (50.0%) |
| College/Associate Degree | 28 (87.5%) | 4 (12.5%) |
| Bachelor's Degree or higher | 54 (90.0%) | 6 (10.0%) |
Occupancy by Age of Householder in Harrison
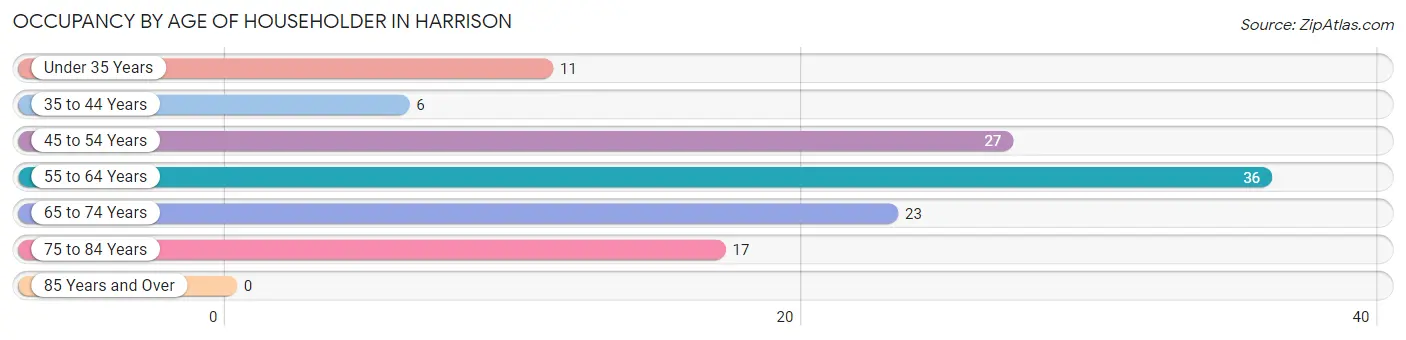
| Age Bracket | # Households | % Households |
| Under 35 Years | 11 | 9.2% |
| 35 to 44 Years | 6 | 5.0% |
| 45 to 54 Years | 27 | 22.5% |
| 55 to 64 Years | 36 | 30.0% |
| 65 to 74 Years | 23 | 19.2% |
| 75 to 84 Years | 17 | 14.2% |
| 85 Years and Over | 0 | 0.0% |
| Total | 120 | 100.0% |
Housing Finances in Harrison
Median Income by Occupancy in Harrison
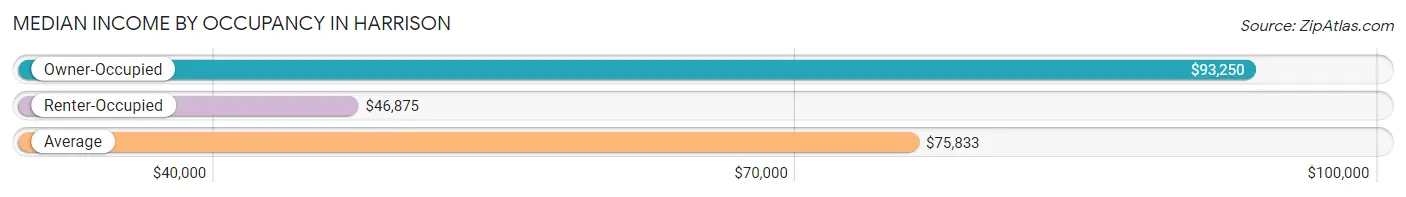
| Occupancy Type | # Households | Median Income |
| Owner-Occupied | 99 (82.5%) | $93,250 |
| Renter-Occupied | 21 (17.5%) | $46,875 |
| Average | 120 (100.0%) | $75,833 |
Occupancy by Householder Income Bracket in Harrison
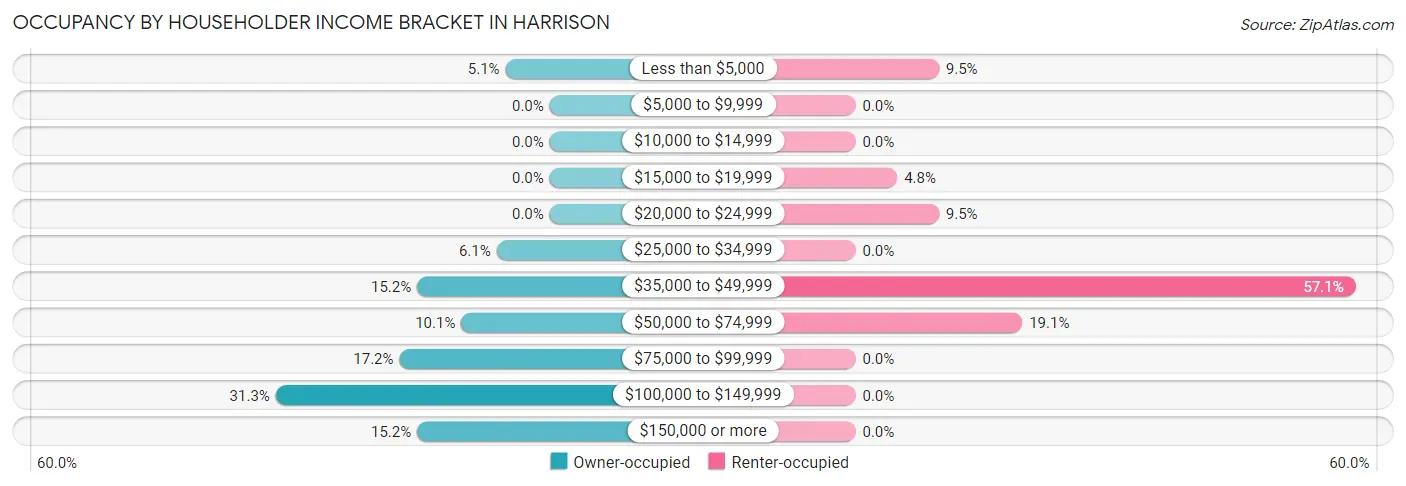
| Income Bracket | Owner-occupied | Renter-occupied |
| Less than $5,000 | 5 (5.1%) | 2 (9.5%) |
| $5,000 to $9,999 | 0 (0.0%) | 0 (0.0%) |
| $10,000 to $14,999 | 0 (0.0%) | 0 (0.0%) |
| $15,000 to $19,999 | 0 (0.0%) | 1 (4.8%) |
| $20,000 to $24,999 | 0 (0.0%) | 2 (9.5%) |
| $25,000 to $34,999 | 6 (6.1%) | 0 (0.0%) |
| $35,000 to $49,999 | 15 (15.1%) | 12 (57.1%) |
| $50,000 to $74,999 | 10 (10.1%) | 4 (19.1%) |
| $75,000 to $99,999 | 17 (17.2%) | 0 (0.0%) |
| $100,000 to $149,999 | 31 (31.3%) | 0 (0.0%) |
| $150,000 or more | 15 (15.1%) | 0 (0.0%) |
| Total | 99 (100.0%) | 21 (100.0%) |
Monthly Housing Cost Tiers in Harrison
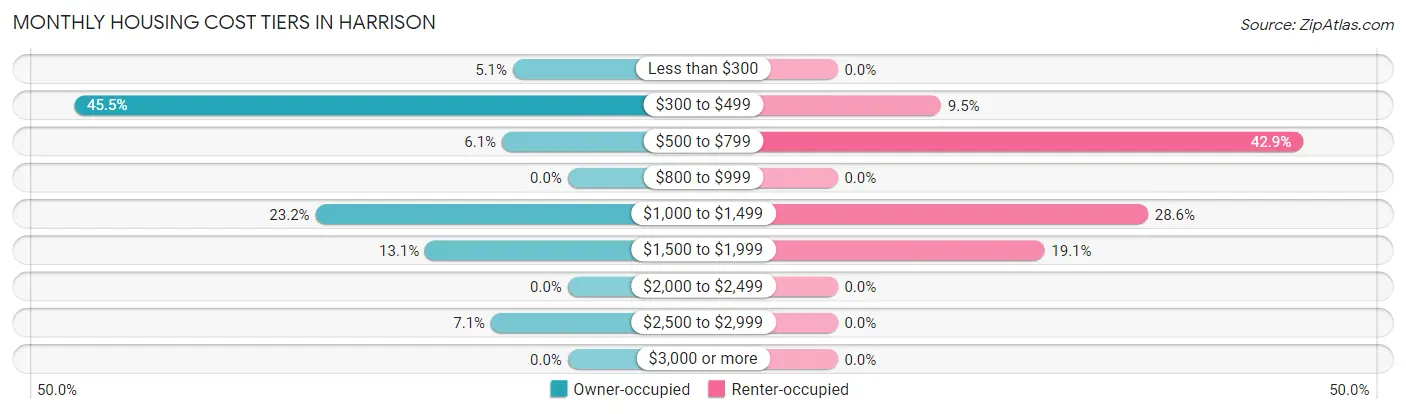
| Monthly Cost | Owner-occupied | Renter-occupied |
| Less than $300 | 5 (5.1%) | 0 (0.0%) |
| $300 to $499 | 45 (45.5%) | 2 (9.5%) |
| $500 to $799 | 6 (6.1%) | 9 (42.9%) |
| $800 to $999 | 0 (0.0%) | 0 (0.0%) |
| $1,000 to $1,499 | 23 (23.2%) | 6 (28.6%) |
| $1,500 to $1,999 | 13 (13.1%) | 4 (19.1%) |
| $2,000 to $2,499 | 0 (0.0%) | 0 (0.0%) |
| $2,500 to $2,999 | 7 (7.1%) | 0 (0.0%) |
| $3,000 or more | 0 (0.0%) | 0 (0.0%) |
| Total | 99 (100.0%) | 21 (100.0%) |
Physical Housing Characteristics in Harrison
Housing Structures in Harrison
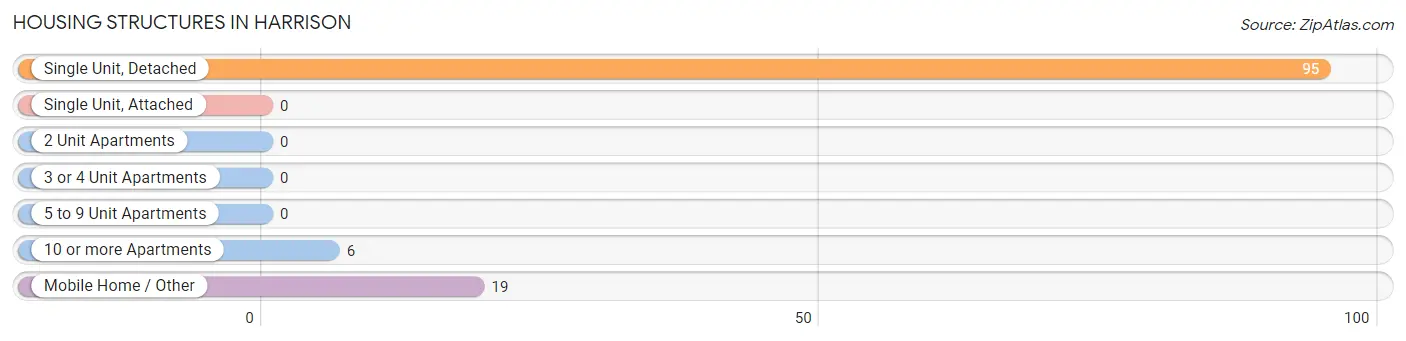
| Structure Type | # Housing Units | % Housing Units |
| Single Unit, Detached | 95 | 79.2% |
| Single Unit, Attached | 0 | 0.0% |
| 2 Unit Apartments | 0 | 0.0% |
| 3 or 4 Unit Apartments | 0 | 0.0% |
| 5 to 9 Unit Apartments | 0 | 0.0% |
| 10 or more Apartments | 6 | 5.0% |
| Mobile Home / Other | 19 | 15.8% |
| Total | 120 | 100.0% |
Housing Structures by Occupancy in Harrison
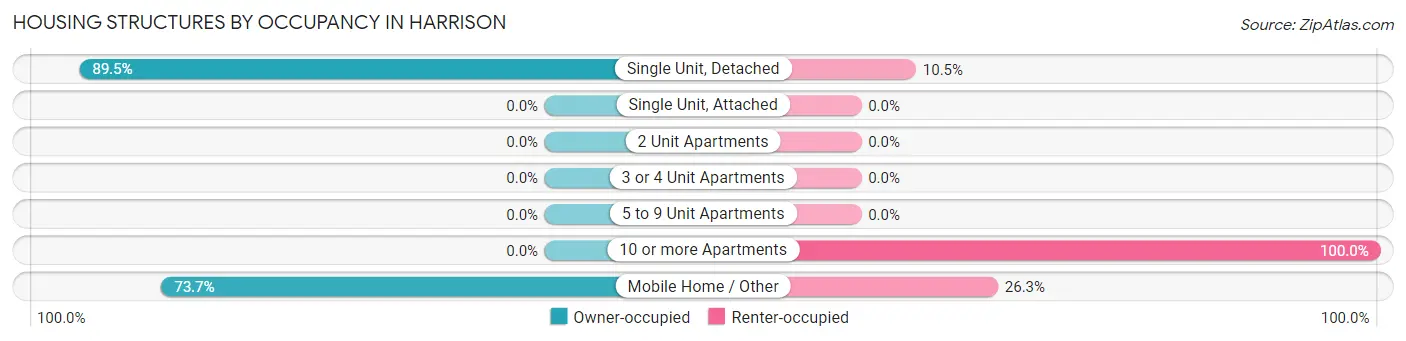
| Structure Type | Owner-occupied | Renter-occupied |
| Single Unit, Detached | 85 (89.5%) | 10 (10.5%) |
| Single Unit, Attached | 0 (0.0%) | 0 (0.0%) |
| 2 Unit Apartments | 0 (0.0%) | 0 (0.0%) |
| 3 or 4 Unit Apartments | 0 (0.0%) | 0 (0.0%) |
| 5 to 9 Unit Apartments | 0 (0.0%) | 0 (0.0%) |
| 10 or more Apartments | 0 (0.0%) | 6 (100.0%) |
| Mobile Home / Other | 14 (73.7%) | 5 (26.3%) |
| Total | 99 (82.5%) | 21 (17.5%) |
Housing Structures by Number of Rooms in Harrison
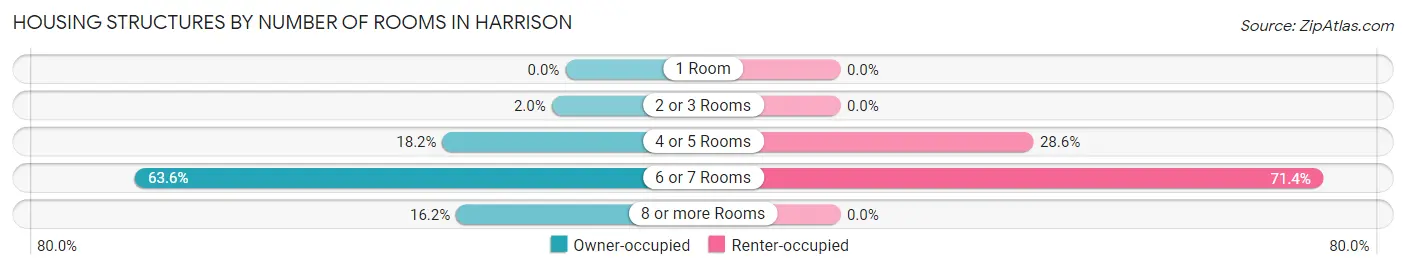
| Number of Rooms | Owner-occupied | Renter-occupied |
| 1 Room | 0 (0.0%) | 0 (0.0%) |
| 2 or 3 Rooms | 2 (2.0%) | 0 (0.0%) |
| 4 or 5 Rooms | 18 (18.2%) | 6 (28.6%) |
| 6 or 7 Rooms | 63 (63.6%) | 15 (71.4%) |
| 8 or more Rooms | 16 (16.2%) | 0 (0.0%) |
| Total | 99 (100.0%) | 21 (100.0%) |
Housing Structure by Heating Type in Harrison
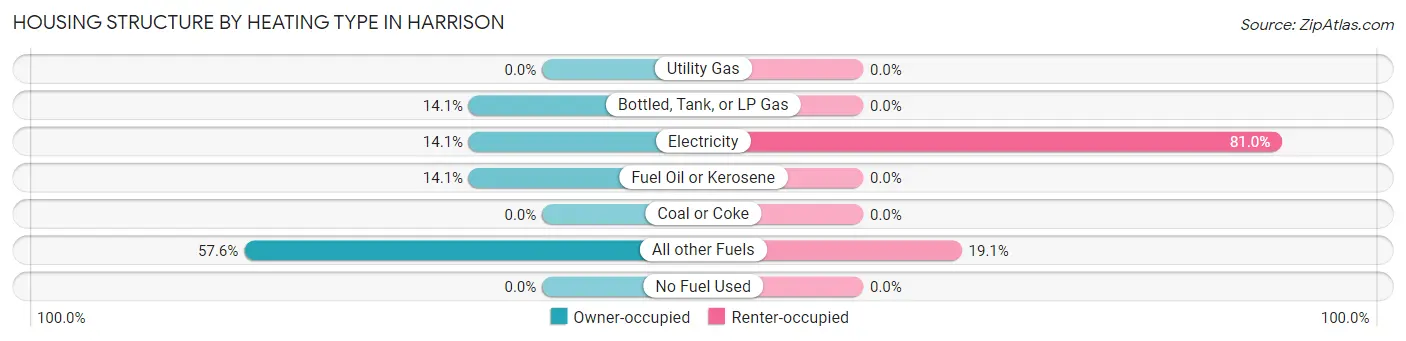
| Heating Type | Owner-occupied | Renter-occupied |
| Utility Gas | 0 (0.0%) | 0 (0.0%) |
| Bottled, Tank, or LP Gas | 14 (14.1%) | 0 (0.0%) |
| Electricity | 14 (14.1%) | 17 (80.9%) |
| Fuel Oil or Kerosene | 14 (14.1%) | 0 (0.0%) |
| Coal or Coke | 0 (0.0%) | 0 (0.0%) |
| All other Fuels | 57 (57.6%) | 4 (19.1%) |
| No Fuel Used | 0 (0.0%) | 0 (0.0%) |
| Total | 99 (100.0%) | 21 (100.0%) |
Household Vehicle Usage in Harrison
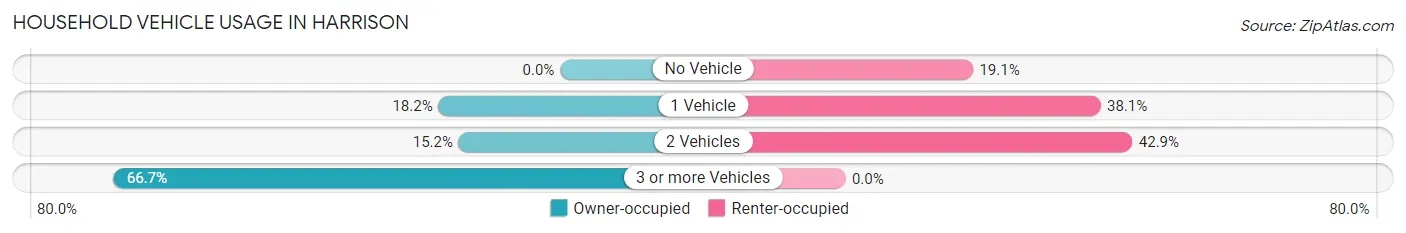
| Vehicles per Household | Owner-occupied | Renter-occupied |
| No Vehicle | 0 (0.0%) | 4 (19.1%) |
| 1 Vehicle | 18 (18.2%) | 8 (38.1%) |
| 2 Vehicles | 15 (15.1%) | 9 (42.9%) |
| 3 or more Vehicles | 66 (66.7%) | 0 (0.0%) |
| Total | 99 (100.0%) | 21 (100.0%) |
Real Estate & Mortgages in Harrison
Real Estate and Mortgage Overview in Harrison
| Characteristic | Without Mortgage | With Mortgage |
| Housing Units | 65 | 34 |
| Median Property Value | $350,000 | $269,000 |
| Median Household Income | $100,139 | $0 |
| Monthly Housing Costs | $413 | $0 |
| Real Estate Taxes | $1,548 | $7 |
Property Value by Mortgage Status in Harrison
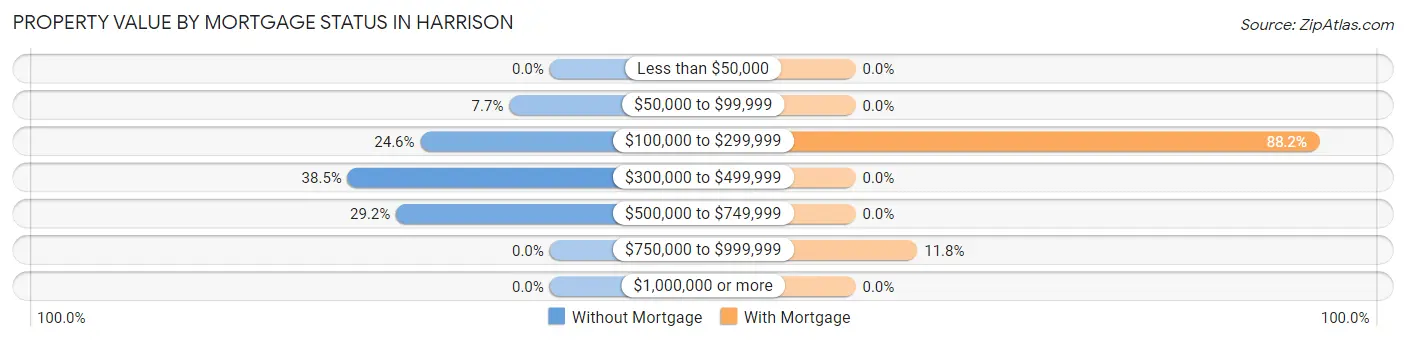
| Property Value | Without Mortgage | With Mortgage |
| Less than $50,000 | 0 (0.0%) | 0 (0.0%) |
| $50,000 to $99,999 | 5 (7.7%) | 0 (0.0%) |
| $100,000 to $299,999 | 16 (24.6%) | 30 (88.2%) |
| $300,000 to $499,999 | 25 (38.5%) | 0 (0.0%) |
| $500,000 to $749,999 | 19 (29.2%) | 0 (0.0%) |
| $750,000 to $999,999 | 0 (0.0%) | 4 (11.8%) |
| $1,000,000 or more | 0 (0.0%) | 0 (0.0%) |
| Total | 65 (100.0%) | 34 (100.0%) |
Household Income by Mortgage Status in Harrison
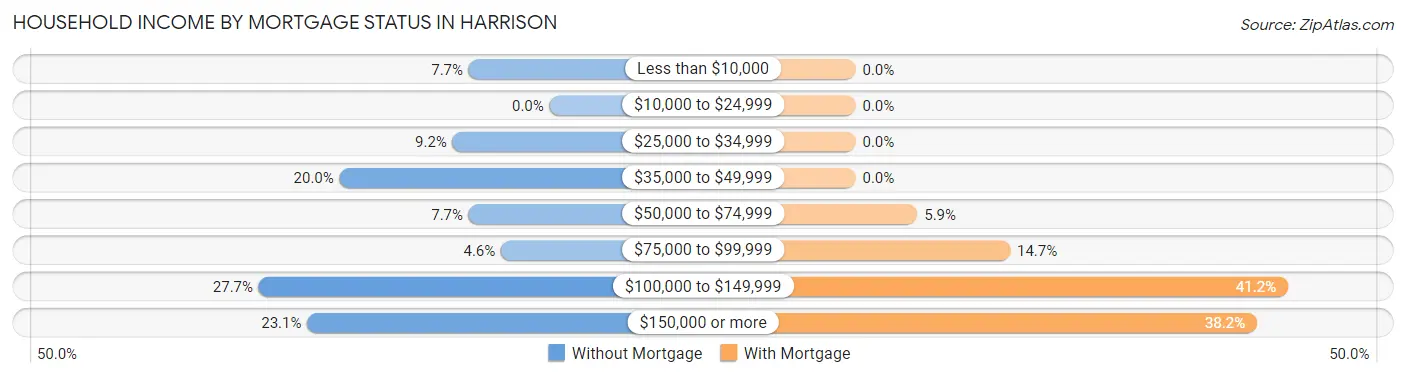
| Household Income | Without Mortgage | With Mortgage |
| Less than $10,000 | 5 (7.7%) | 0 (0.0%) |
| $10,000 to $24,999 | 0 (0.0%) | 0 (0.0%) |
| $25,000 to $34,999 | 6 (9.2%) | 0 (0.0%) |
| $35,000 to $49,999 | 13 (20.0%) | 0 (0.0%) |
| $50,000 to $74,999 | 5 (7.7%) | 2 (5.9%) |
| $75,000 to $99,999 | 3 (4.6%) | 5 (14.7%) |
| $100,000 to $149,999 | 18 (27.7%) | 14 (41.2%) |
| $150,000 or more | 15 (23.1%) | 13 (38.2%) |
| Total | 65 (100.0%) | 34 (100.0%) |
Property Value to Household Income Ratio in Harrison
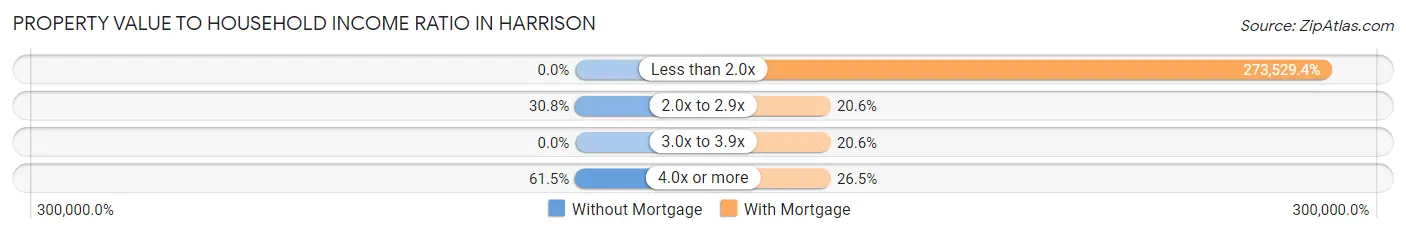
| Value-to-Income Ratio | Without Mortgage | With Mortgage |
| Less than 2.0x | 0 (0.0%) | 93,000 (273,529.4%) |
| 2.0x to 2.9x | 20 (30.8%) | 7 (20.6%) |
| 3.0x to 3.9x | 0 (0.0%) | 7 (20.6%) |
| 4.0x or more | 40 (61.5%) | 9 (26.5%) |
| Total | 65 (100.0%) | 34 (100.0%) |
Real Estate Taxes by Mortgage Status in Harrison
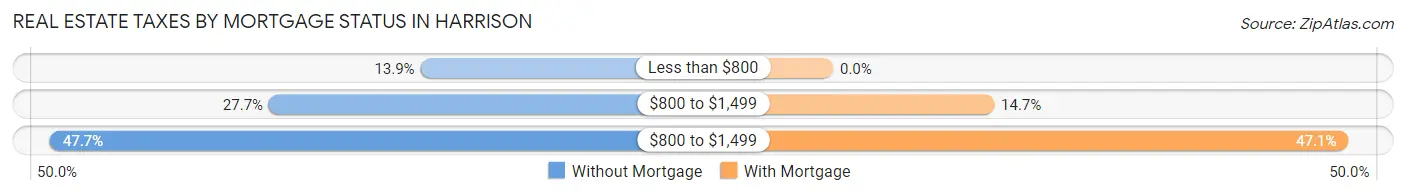
| Property Taxes | Without Mortgage | With Mortgage |
| Less than $800 | 9 (13.9%) | 0 (0.0%) |
| $800 to $1,499 | 18 (27.7%) | 5 (14.7%) |
| $800 to $1,499 | 31 (47.7%) | 16 (47.1%) |
| Total | 65 (100.0%) | 34 (100.0%) |
Health & Disability in Harrison
Health Insurance Coverage by Age in Harrison
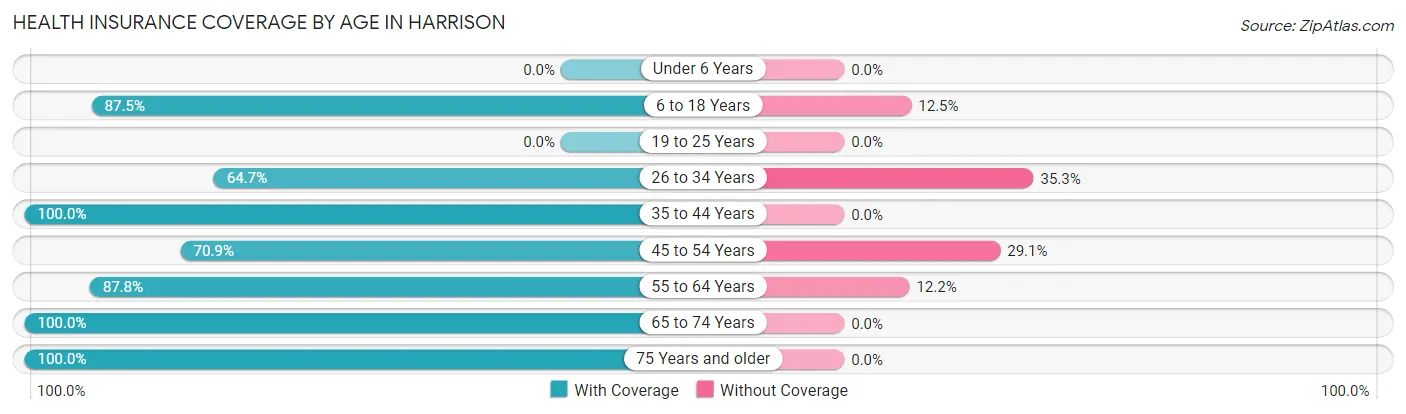
| Age Bracket | With Coverage | Without Coverage |
| Under 6 Years | 0 (0.0%) | 0 (0.0%) |
| 6 to 18 Years | 42 (87.5%) | 6 (12.5%) |
| 19 to 25 Years | 0 (0.0%) | 0 (0.0%) |
| 26 to 34 Years | 11 (64.7%) | 6 (35.3%) |
| 35 to 44 Years | 16 (100.0%) | 0 (0.0%) |
| 45 to 54 Years | 39 (70.9%) | 16 (29.1%) |
| 55 to 64 Years | 65 (87.8%) | 9 (12.2%) |
| 65 to 74 Years | 36 (100.0%) | 0 (0.0%) |
| 75 Years and older | 31 (100.0%) | 0 (0.0%) |
| Total | 240 (86.6%) | 37 (13.4%) |
Health Insurance Coverage by Citizenship Status in Harrison
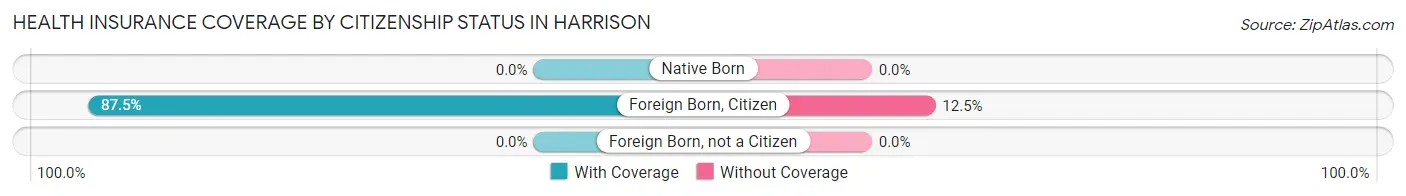
| Citizenship Status | With Coverage | Without Coverage |
| Native Born | 0 (0.0%) | 0 (0.0%) |
| Foreign Born, Citizen | 42 (87.5%) | 6 (12.5%) |
| Foreign Born, not a Citizen | 0 (0.0%) | 0 (0.0%) |
Health Insurance Coverage by Household Income in Harrison
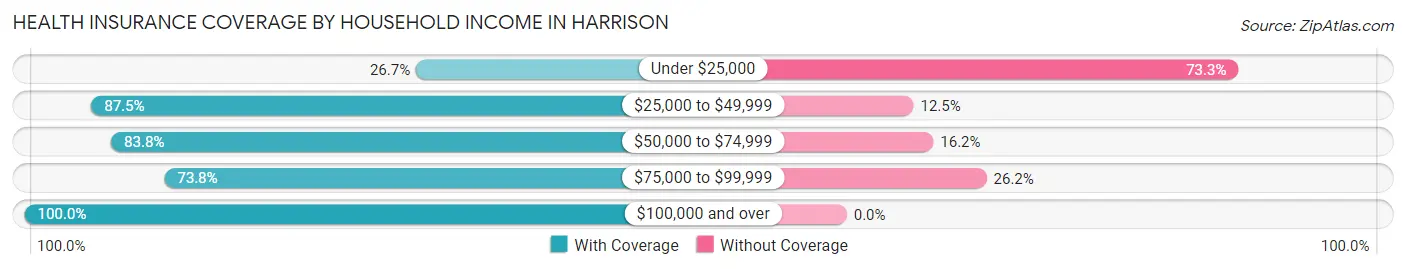
| Household Income | With Coverage | Without Coverage |
| Under $25,000 | 4 (26.7%) | 11 (73.3%) |
| $25,000 to $49,999 | 63 (87.5%) | 9 (12.5%) |
| $50,000 to $74,999 | 31 (83.8%) | 6 (16.2%) |
| $75,000 to $99,999 | 31 (73.8%) | 11 (26.2%) |
| $100,000 and over | 111 (100.0%) | 0 (0.0%) |
Public vs Private Health Insurance Coverage by Age in Harrison
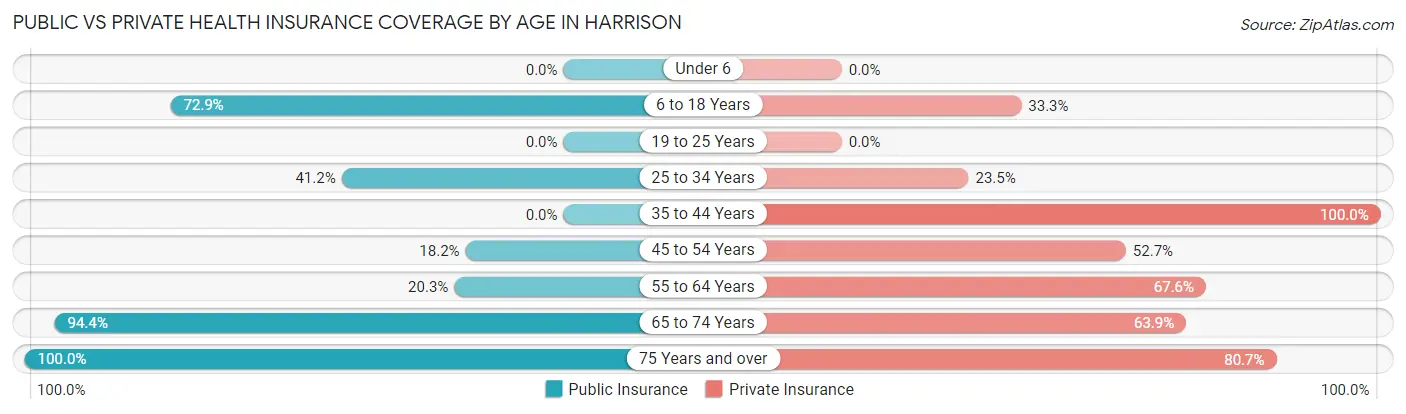
| Age Bracket | Public Insurance | Private Insurance |
| Under 6 | 0 (0.0%) | 0 (0.0%) |
| 6 to 18 Years | 35 (72.9%) | 16 (33.3%) |
| 19 to 25 Years | 0 (0.0%) | 0 (0.0%) |
| 25 to 34 Years | 7 (41.2%) | 4 (23.5%) |
| 35 to 44 Years | 0 (0.0%) | 16 (100.0%) |
| 45 to 54 Years | 10 (18.2%) | 29 (52.7%) |
| 55 to 64 Years | 15 (20.3%) | 50 (67.6%) |
| 65 to 74 Years | 34 (94.4%) | 23 (63.9%) |
| 75 Years and over | 31 (100.0%) | 25 (80.6%) |
| Total | 132 (47.6%) | 163 (58.8%) |
Disability Status by Sex by Age in Harrison
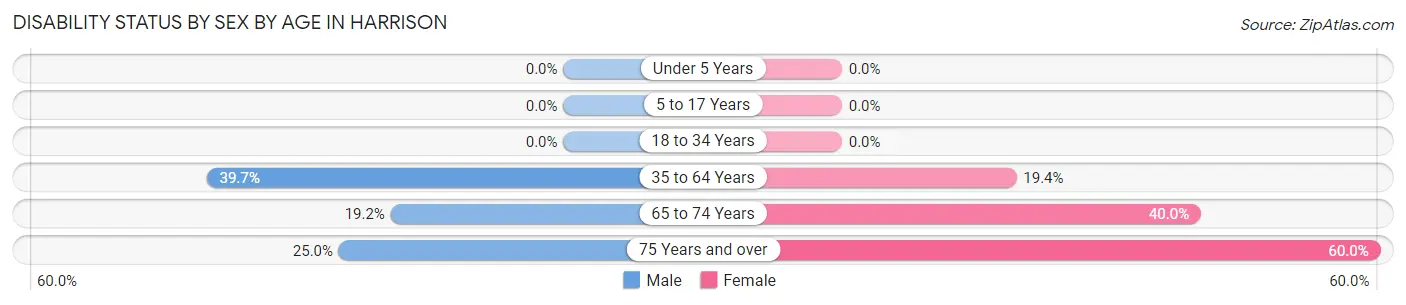
| Age Bracket | Male | Female |
| Under 5 Years | 0 (0.0%) | 0 (0.0%) |
| 5 to 17 Years | 0 (0.0%) | 0 (0.0%) |
| 18 to 34 Years | 0 (0.0%) | 0 (0.0%) |
| 35 to 64 Years | 29 (39.7%) | 14 (19.4%) |
| 65 to 74 Years | 5 (19.2%) | 4 (40.0%) |
| 75 Years and over | 4 (25.0%) | 9 (60.0%) |
Disability Class by Sex by Age in Harrison
Disability Class: Hearing Difficulty
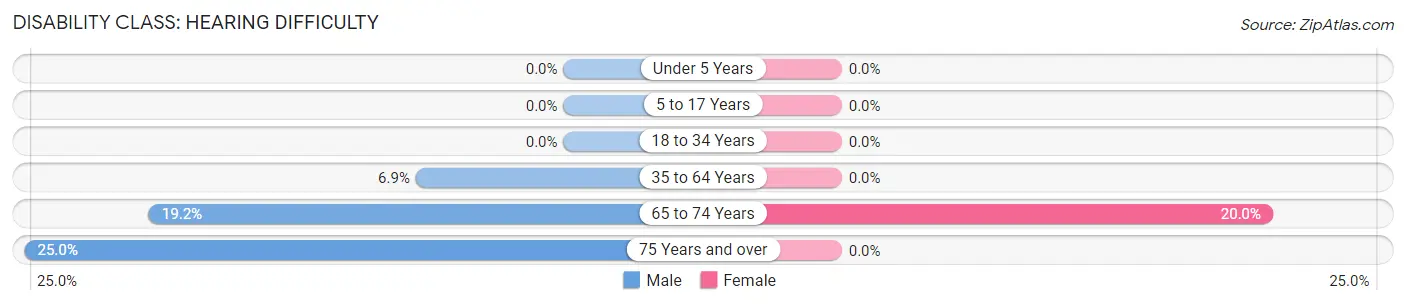
| Age Bracket | Male | Female |
| Under 5 Years | 0 (0.0%) | 0 (0.0%) |
| 5 to 17 Years | 0 (0.0%) | 0 (0.0%) |
| 18 to 34 Years | 0 (0.0%) | 0 (0.0%) |
| 35 to 64 Years | 5 (6.9%) | 0 (0.0%) |
| 65 to 74 Years | 5 (19.2%) | 2 (20.0%) |
| 75 Years and over | 4 (25.0%) | 0 (0.0%) |
Disability Class: Vision Difficulty
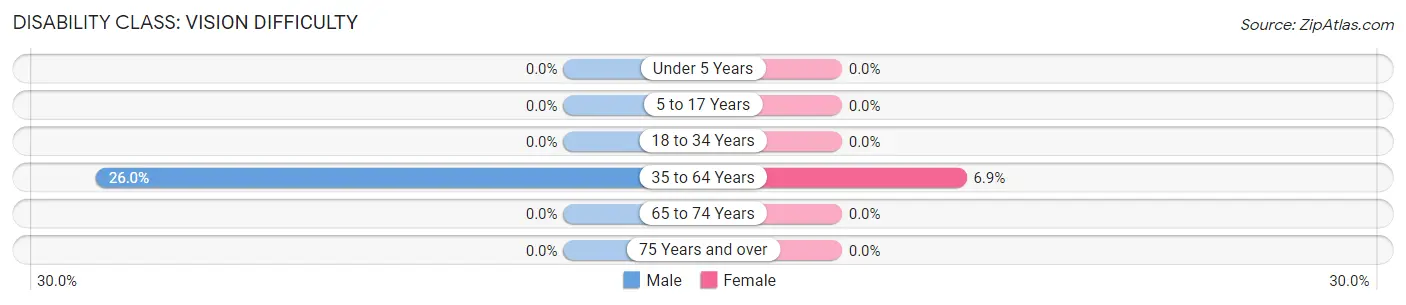
| Age Bracket | Male | Female |
| Under 5 Years | 0 (0.0%) | 0 (0.0%) |
| 5 to 17 Years | 0 (0.0%) | 0 (0.0%) |
| 18 to 34 Years | 0 (0.0%) | 0 (0.0%) |
| 35 to 64 Years | 19 (26.0%) | 5 (6.9%) |
| 65 to 74 Years | 0 (0.0%) | 0 (0.0%) |
| 75 Years and over | 0 (0.0%) | 0 (0.0%) |
Disability Class: Cognitive Difficulty
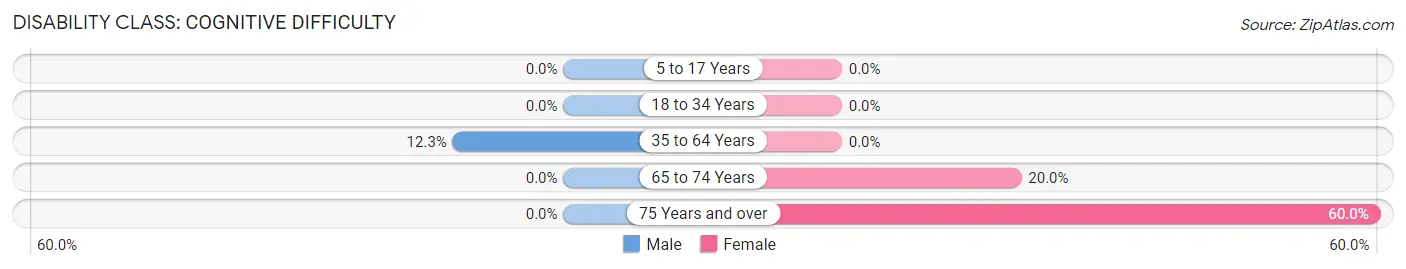
| Age Bracket | Male | Female |
| 5 to 17 Years | 0 (0.0%) | 0 (0.0%) |
| 18 to 34 Years | 0 (0.0%) | 0 (0.0%) |
| 35 to 64 Years | 9 (12.3%) | 0 (0.0%) |
| 65 to 74 Years | 0 (0.0%) | 2 (20.0%) |
| 75 Years and over | 0 (0.0%) | 9 (60.0%) |
Disability Class: Ambulatory Difficulty
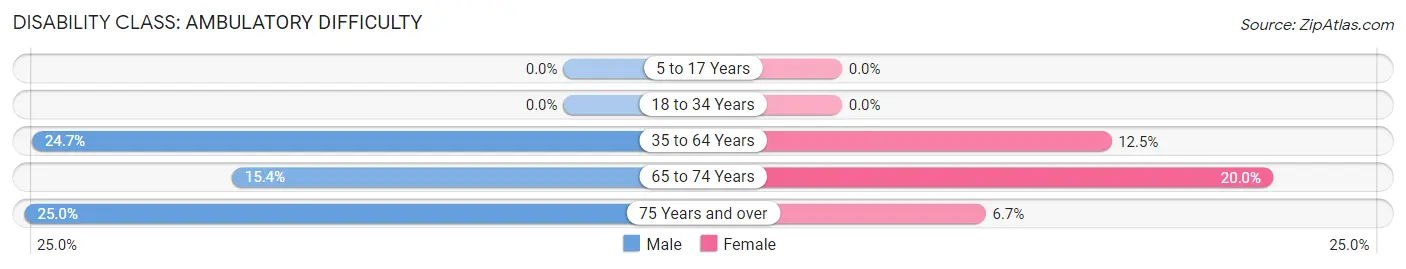
| Age Bracket | Male | Female |
| 5 to 17 Years | 0 (0.0%) | 0 (0.0%) |
| 18 to 34 Years | 0 (0.0%) | 0 (0.0%) |
| 35 to 64 Years | 18 (24.7%) | 9 (12.5%) |
| 65 to 74 Years | 4 (15.4%) | 2 (20.0%) |
| 75 Years and over | 4 (25.0%) | 1 (6.7%) |
Disability Class: Self-Care Difficulty
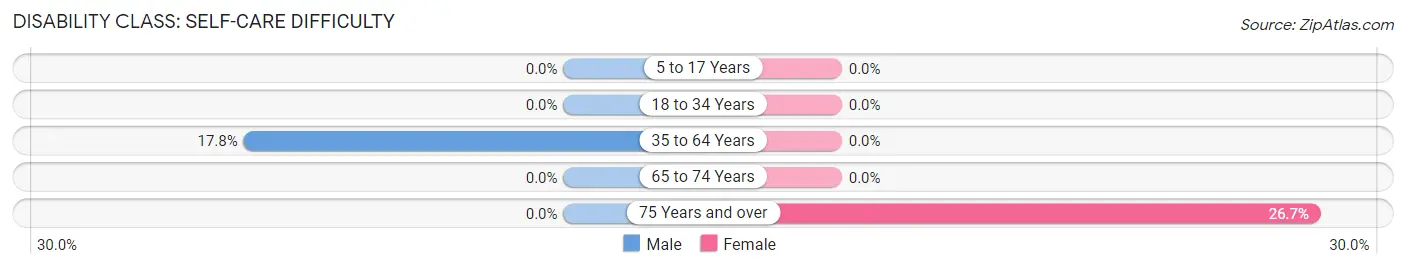
| Age Bracket | Male | Female |
| 5 to 17 Years | 0 (0.0%) | 0 (0.0%) |
| 18 to 34 Years | 0 (0.0%) | 0 (0.0%) |
| 35 to 64 Years | 13 (17.8%) | 0 (0.0%) |
| 65 to 74 Years | 0 (0.0%) | 0 (0.0%) |
| 75 Years and over | 0 (0.0%) | 4 (26.7%) |
Technology Access in Harrison
Computing Device Access in Harrison
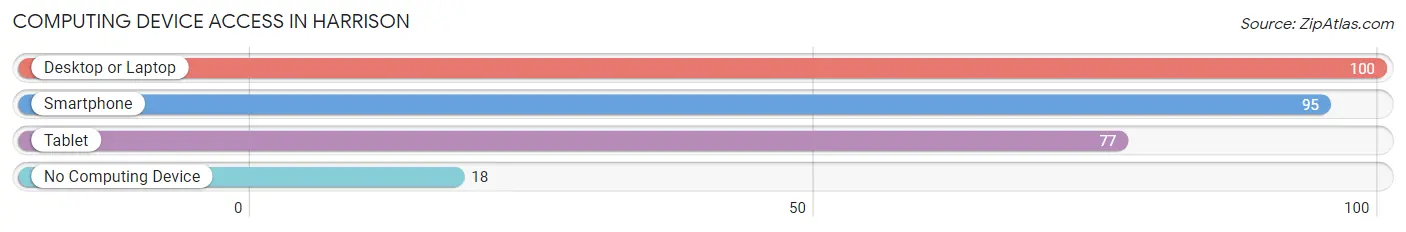
| Device Type | # Households | % Households |
| Desktop or Laptop | 100 | 83.3% |
| Smartphone | 95 | 79.2% |
| Tablet | 77 | 64.2% |
| No Computing Device | 18 | 15.0% |
| Total | 120 | 100.0% |
Internet Access in Harrison
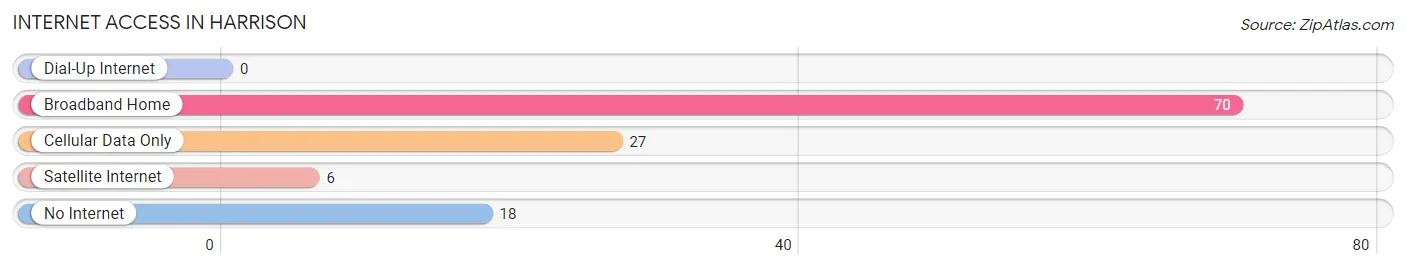
| Internet Type | # Households | % Households |
| Dial-Up Internet | 0 | 0.0% |
| Broadband Home | 70 | 58.3% |
| Cellular Data Only | 27 | 22.5% |
| Satellite Internet | 6 | 5.0% |
| No Internet | 18 | 15.0% |
| Total | 120 | 100.0% |
Harrison Summary
Harrison, Idaho is a small town located in the northern part of the state, near the border of Montana. It is situated in the Kootenai County, and is part of the Coeur d'Alene metropolitan area. The town has a population of just over 1,000 people, and is known for its rural charm and small-town atmosphere.
History
Harrison was first settled in the late 1800s by a group of homesteaders who were drawn to the area by its abundance of natural resources. The town was officially incorporated in 1909, and was named after the Harrison family, who were among the first settlers.
The town grew slowly over the years, and by the 1950s, it had become a popular tourist destination. The town was known for its beautiful scenery, and its proximity to the nearby Coeur d'Alene Lake.
In the late 1970s, the town began to experience a decline in population as people moved away in search of better economic opportunities. However, in recent years, the town has seen a resurgence in population as people have moved back to the area in search of a more rural lifestyle.
Geography
Harrison is located in the northern part of Idaho, near the border of Montana. It is situated in the Kootenai County, and is part of the Coeur d'Alene metropolitan area. The town is located in a valley surrounded by mountains, and is known for its beautiful scenery.
The town is located at an elevation of 2,845 feet, and has a total area of 1.2 square miles. The climate in Harrison is generally mild, with warm summers and cold winters.
Economy
Harrison's economy is largely based on tourism and agriculture. The town is home to several small businesses, including restaurants, shops, and lodging. The town is also home to a number of farms, which produce a variety of crops, including potatoes, wheat, and hay.
The town is also home to a number of recreational activities, including fishing, hunting, and camping. The nearby Coeur d'Alene Lake is a popular destination for boating and other water sports.
Demographics
As of the 2010 census, the population of Harrison was 1,072. The racial makeup of the town was 95.3% White, 0.7% Native American, 0.3% Asian, 0.2% African American, and 3.5% from other races. The median household income was $37,917, and the median age was 41.
Harrison is a small town with a rural atmosphere. The town is known for its friendly people and its beautiful scenery. It is a great place to live for those who are looking for a quiet, peaceful lifestyle.
Common Questions
What is Per Capita Income in Harrison?
Per Capita income in Harrison is $36,641.
What is the Median Family Income in Harrison?
Median Family Income in Harrison is $76,389.
What is the Median Household income in Harrison?
Median Household Income in Harrison is $75,833.
What is Income or Wage Gap in Harrison?
Income or Wage Gap in Harrison is 40.8%.
Women in Harrison earn 59.2 cents for every dollar earned by a man.
What is Inequality or Gini Index in Harrison?
Inequality or Gini Index in Harrison is 0.34.
What is the Total Population of Harrison?
Total Population of Harrison is 277.
What is the Total Male Population of Harrison?
Total Male Population of Harrison is 154.
What is the Total Female Population of Harrison?
Total Female Population of Harrison is 123.
What is the Ratio of Males per 100 Females in Harrison?
There are 125.20 Males per 100 Females in Harrison.
What is the Ratio of Females per 100 Males in Harrison?
There are 79.87 Females per 100 Males in Harrison.
What is the Median Population Age in Harrison?
Median Population Age in Harrison is 55.4 Years.
What is the Average Family Size in Harrison
Average Family Size in Harrison is 2.3 People.
What is the Average Household Size in Harrison
Average Household Size in Harrison is 2.3 People.
How Large is the Labor Force in Harrison?
There are 109 People in the Labor Forcein in Harrison.
What is the Percentage of People in the Labor Force in Harrison?
47.6% of People are in the Labor Force in Harrison.
What is the Unemployment Rate in Harrison?
Unemployment Rate in Harrison is 10.1%.