Fort Hall, ID Map & Demographics
Fort Hall Map
Fort Hall Overview
$21,978
PER CAPITA INCOME
$49,050
AVG FAMILY INCOME
$37,786
AVG HOUSEHOLD INCOME
34.3%
WAGE / INCOME GAP [ % ]
65.7¢/ $1
WAGE / INCOME GAP [ $ ]
0.52
INEQUALITY / GINI INDEX
2,608
TOTAL POPULATION
1,357
MALE POPULATION
1,251
FEMALE POPULATION
108.47
MALES / 100 FEMALES
92.19
FEMALES / 100 MALES
36.8
MEDIAN AGE
3.7
AVG FAMILY SIZE
2.8
AVG HOUSEHOLD SIZE
1,117
LABOR FORCE [ PEOPLE ]
55.5%
PERCENT IN LABOR FORCE
12.3%
UNEMPLOYMENT RATE
Fort Hall Zip Codes
Fort Hall Area Codes
Income in Fort Hall
Income Overview in Fort Hall
Per Capita Income in Fort Hall is $21,978, while median incomes of families and households are $49,050 and $37,786 respectively.
| Characteristic | Number | Measure |
| Per Capita Income | 2,608 | $21,978 |
| Median Family Income | 535 | $49,050 |
| Mean Family Income | 535 | $63,590 |
| Median Household Income | 920 | $37,786 |
| Mean Household Income | 920 | $54,115 |
| Income Deficit | 535 | $0 |
| Wage / Income Gap (%) | 2,608 | 34.29% |
| Wage / Income Gap ($) | 2,608 | 65.71¢ per $1 |
| Gini / Inequality Index | 2,608 | 0.52 |
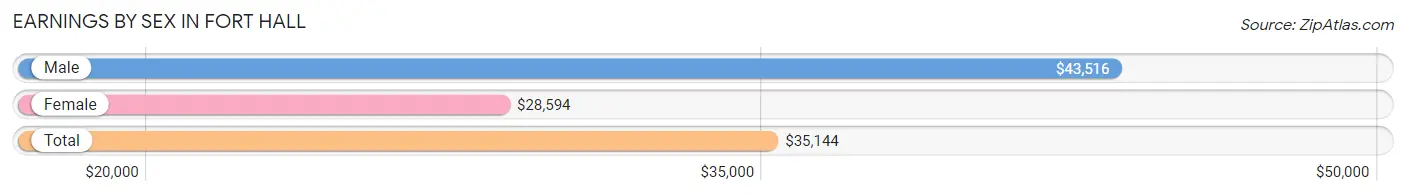
Earnings by Sex in Fort Hall
Average Earnings in Fort Hall are $35,144, $43,516 for men and $28,594 for women, a difference of 34.3%.
| Sex | Number | Average Earnings |
| Male | 557 (50.1%) | $43,516 |
| Female | 554 (49.9%) | $28,594 |
| Total | 1,111 (100.0%) | $35,144 |
Earnings by Sex by Income Bracket in Fort Hall
The most common earnings brackets in Fort Hall are $50,000 to $54,999 for men (118 | 21.2%) and $35,000 to $39,999 for women (110 | 19.9%).
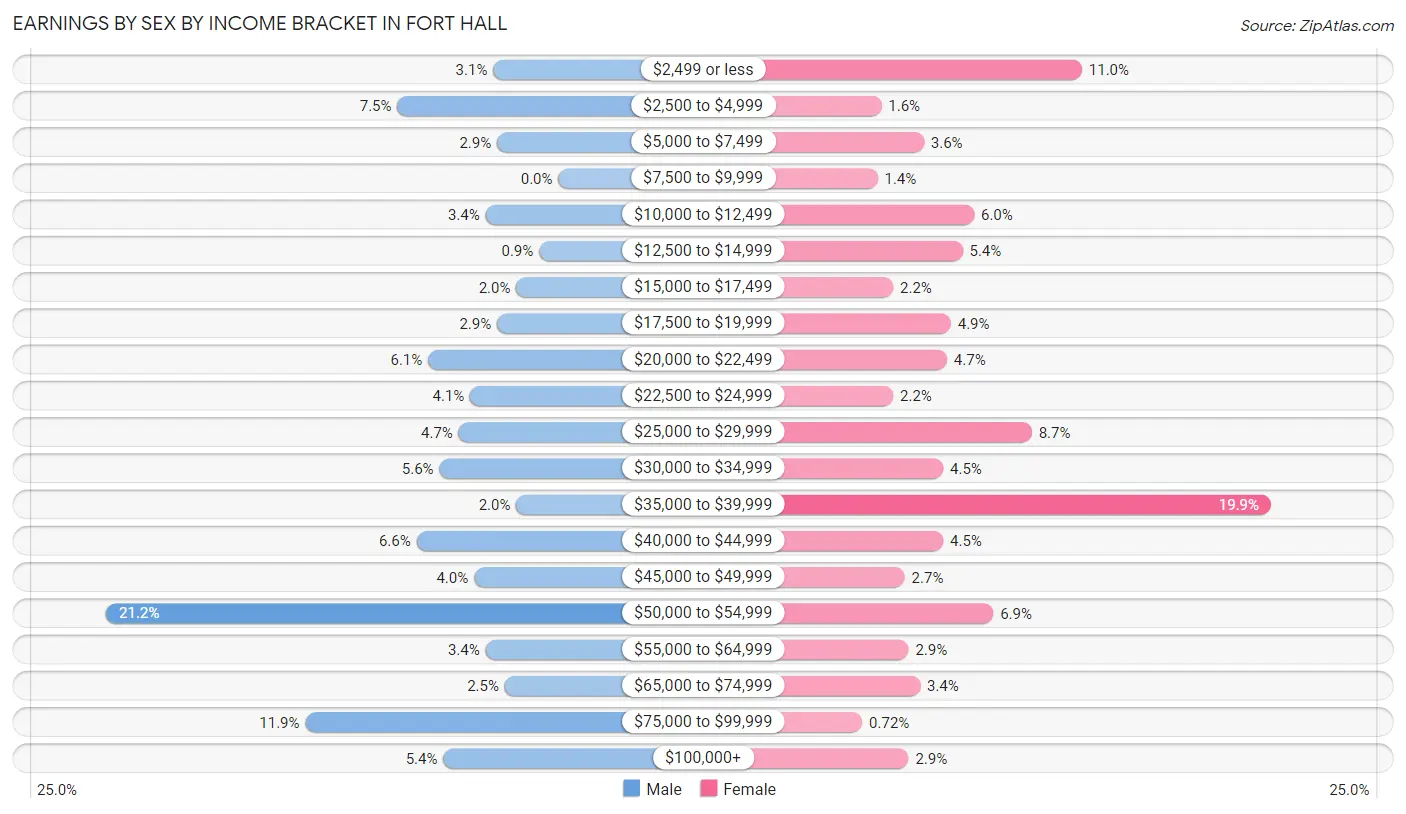
| Income | Male | Female |
| $2,499 or less | 17 (3.0%) | 61 (11.0%) |
| $2,500 to $4,999 | 42 (7.5%) | 9 (1.6%) |
| $5,000 to $7,499 | 16 (2.9%) | 20 (3.6%) |
| $7,500 to $9,999 | 0 (0.0%) | 8 (1.4%) |
| $10,000 to $12,499 | 19 (3.4%) | 33 (6.0%) |
| $12,500 to $14,999 | 5 (0.9%) | 30 (5.4%) |
| $15,000 to $17,499 | 11 (2.0%) | 12 (2.2%) |
| $17,500 to $19,999 | 16 (2.9%) | 27 (4.9%) |
| $20,000 to $22,499 | 34 (6.1%) | 26 (4.7%) |
| $22,500 to $24,999 | 23 (4.1%) | 12 (2.2%) |
| $25,000 to $29,999 | 26 (4.7%) | 48 (8.7%) |
| $30,000 to $34,999 | 31 (5.6%) | 25 (4.5%) |
| $35,000 to $39,999 | 11 (2.0%) | 110 (19.9%) |
| $40,000 to $44,999 | 37 (6.6%) | 25 (4.5%) |
| $45,000 to $49,999 | 22 (4.0%) | 15 (2.7%) |
| $50,000 to $54,999 | 118 (21.2%) | 38 (6.9%) |
| $55,000 to $64,999 | 19 (3.4%) | 16 (2.9%) |
| $65,000 to $74,999 | 14 (2.5%) | 19 (3.4%) |
| $75,000 to $99,999 | 66 (11.8%) | 4 (0.7%) |
| $100,000+ | 30 (5.4%) | 16 (2.9%) |
| Total | 557 (100.0%) | 554 (100.0%) |
Earnings by Sex by Educational Attainment in Fort Hall
Average earnings in Fort Hall are $50,269 for men and $30,893 for women, a difference of 38.5%. Men with an educational attainment of graduate degree enjoy the highest average annual earnings of $92,708, while those with less than high school education earn the least with $29,514. Women with an educational attainment of bachelor's degree earn the most with the average annual earnings of $37,361, while those with high school diploma education have the smallest earnings of $20,469.
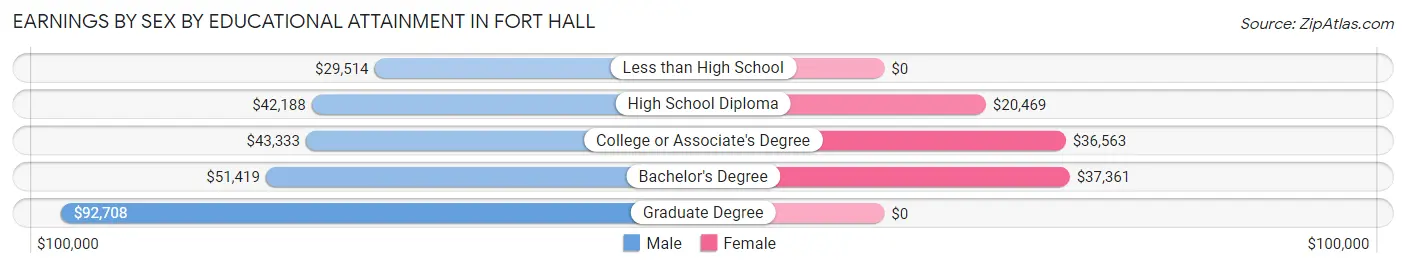
| Educational Attainment | Male Income | Female Income |
| Less than High School | $29,514 | $0 |
| High School Diploma | $42,188 | $20,469 |
| College or Associate's Degree | $43,333 | $36,563 |
| Bachelor's Degree | $51,419 | $37,361 |
| Graduate Degree | $92,708 | $0 |
| Total | $50,269 | $30,893 |
Family Income in Fort Hall
Family Income Brackets in Fort Hall
According to the Fort Hall family income data, there are 107 families falling into the $35,000 to $49,999 income range, which is the most common income bracket and makes up 20.0% of all families. Conversely, the $10,000 to $14,999 income bracket is the least frequent group with only 14 families (2.6%) belonging to this category.
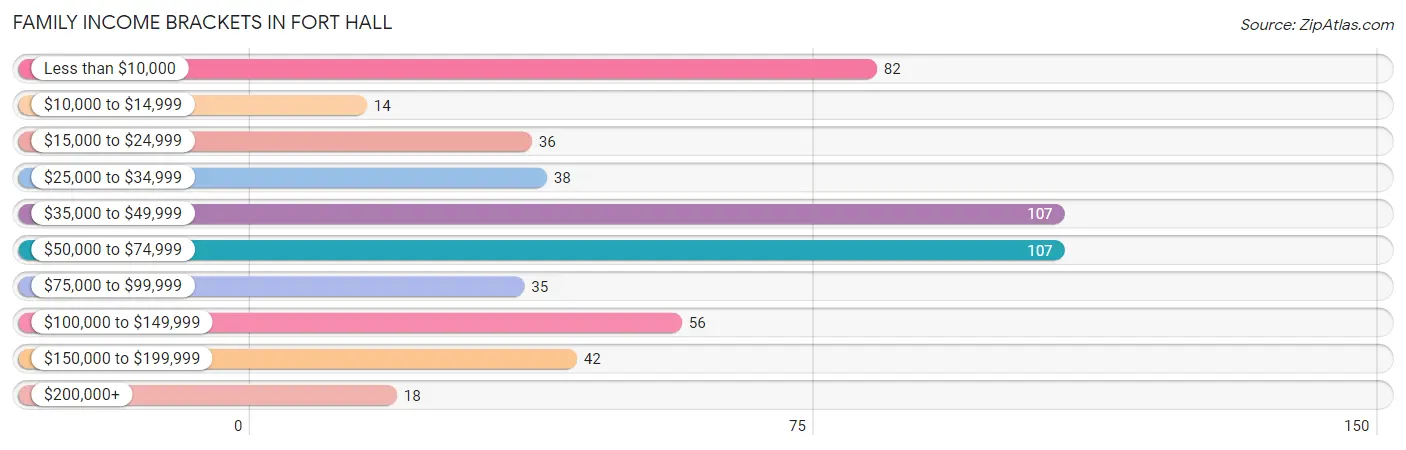
| Income Bracket | # Families | % Families |
| Less than $10,000 | 82 | 15.3% |
| $10,000 to $14,999 | 14 | 2.6% |
| $15,000 to $24,999 | 36 | 6.7% |
| $25,000 to $34,999 | 38 | 7.1% |
| $35,000 to $49,999 | 107 | 20.0% |
| $50,000 to $74,999 | 107 | 20.0% |
| $75,000 to $99,999 | 35 | 6.5% |
| $100,000 to $149,999 | 56 | 10.5% |
| $150,000 to $199,999 | 42 | 7.9% |
| $200,000+ | 18 | 3.4% |
Family Income by Famaliy Size in Fort Hall
5-person families (37 | 6.9%) account for the highest median family income in Fort Hall with $117,708 per family, while 5-person families (37 | 6.9%) have the highest median income of $23,542 per family member.
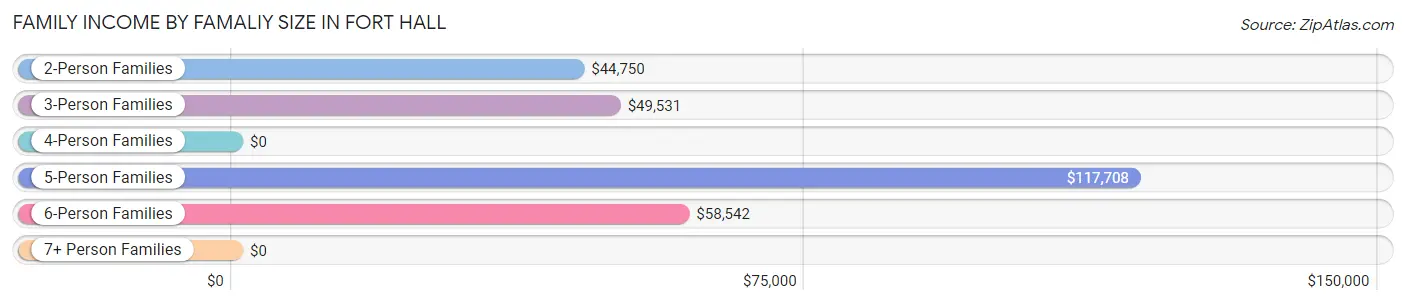
| Income Bracket | # Families | Median Income |
| 2-Person Families | 289 (54.0%) | $44,750 |
| 3-Person Families | 135 (25.2%) | $49,531 |
| 4-Person Families | 45 (8.4%) | $0 |
| 5-Person Families | 37 (6.9%) | $117,708 |
| 6-Person Families | 13 (2.4%) | $58,542 |
| 7+ Person Families | 16 (3.0%) | $0 |
| Total | 535 (100.0%) | $49,050 |
Family Income by Number of Earners in Fort Hall
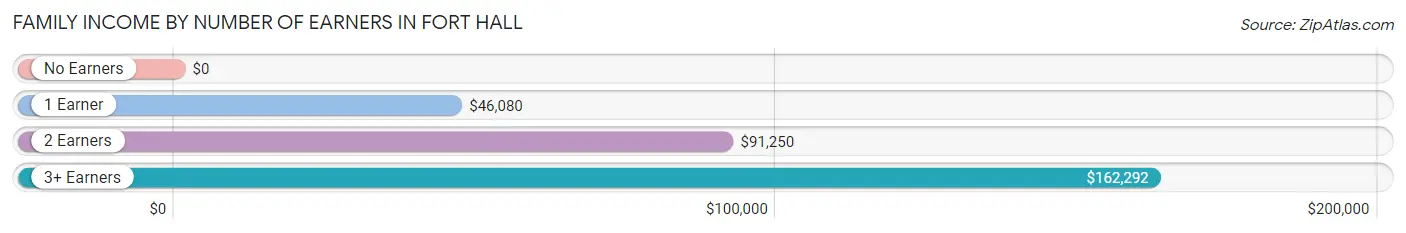
| Number of Earners | # Families | Median Income |
| No Earners | 134 (25.1%) | $0 |
| 1 Earner | 211 (39.4%) | $46,080 |
| 2 Earners | 127 (23.7%) | $91,250 |
| 3+ Earners | 63 (11.8%) | $162,292 |
| Total | 535 (100.0%) | $49,050 |
Household Income in Fort Hall
Household Income Brackets in Fort Hall
With 213 households falling in the category, the less than $10,000 income range is the most frequent in Fort Hall, accounting for 23.2% of all households. In contrast, only 16 households (1.7%) fall into the $10,000 to $14,999 income bracket, making it the least populous group.
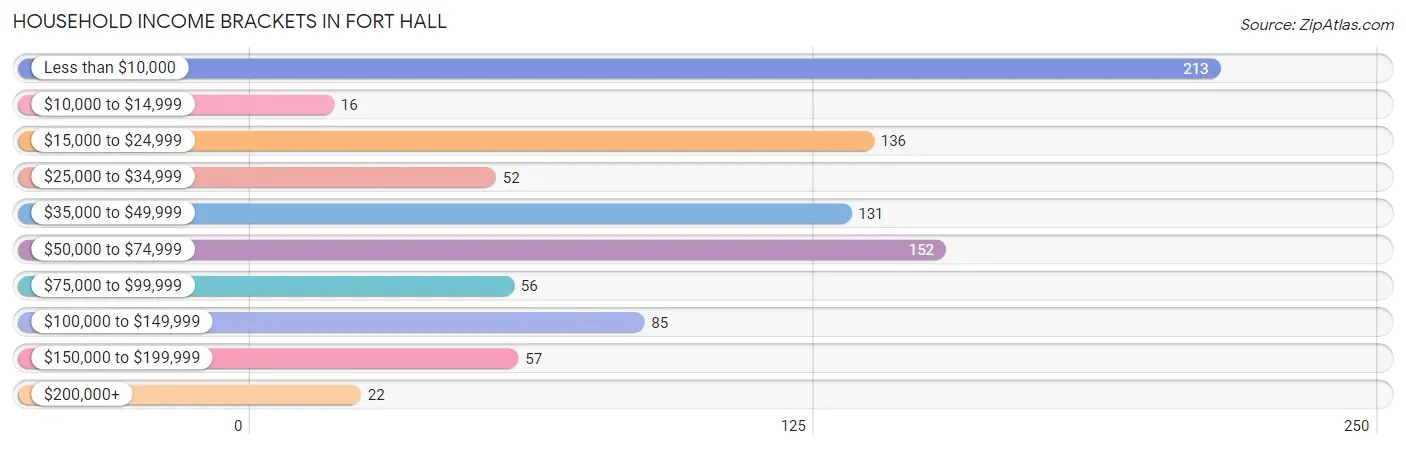
| Income Bracket | # Households | % Households |
| Less than $10,000 | 213 | 23.2% |
| $10,000 to $14,999 | 16 | 1.7% |
| $15,000 to $24,999 | 136 | 14.8% |
| $25,000 to $34,999 | 52 | 5.7% |
| $35,000 to $49,999 | 131 | 14.2% |
| $50,000 to $74,999 | 152 | 16.5% |
| $75,000 to $99,999 | 56 | 6.1% |
| $100,000 to $149,999 | 85 | 9.2% |
| $150,000 to $199,999 | 57 | 6.2% |
| $200,000+ | 22 | 2.4% |
Household Income by Householder Age in Fort Hall
The median household income in Fort Hall is $37,786, with the highest median household income of $49,000 found in the 45 to 64 years age bracket for the primary householder. A total of 368 households (40.0%) fall into this category. Meanwhile, the 15 to 24 years age bracket for the primary householder has the lowest median household income of $0, with 13 households (1.4%) in this group.
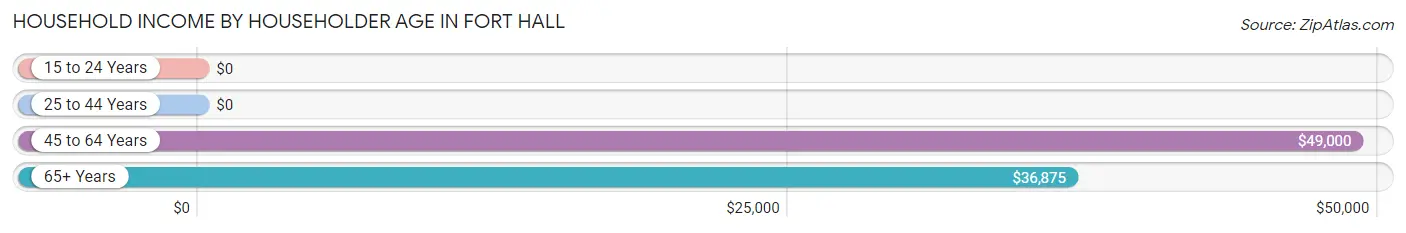
| Income Bracket | # Households | Median Income |
| 15 to 24 Years | 13 (1.4%) | $0 |
| 25 to 44 Years | 285 (31.0%) | $0 |
| 45 to 64 Years | 368 (40.0%) | $49,000 |
| 65+ Years | 254 (27.6%) | $36,875 |
| Total | 920 (100.0%) | $37,786 |
Poverty in Fort Hall
Income Below Poverty by Sex and Age in Fort Hall
With 22.3% poverty level for males and 25.4% for females among the residents of Fort Hall, 15 year old males and 16 and 17 year old females are the most vulnerable to poverty, with 4 males (100.0%) and 39 females (69.6%) in their respective age groups living below the poverty level.
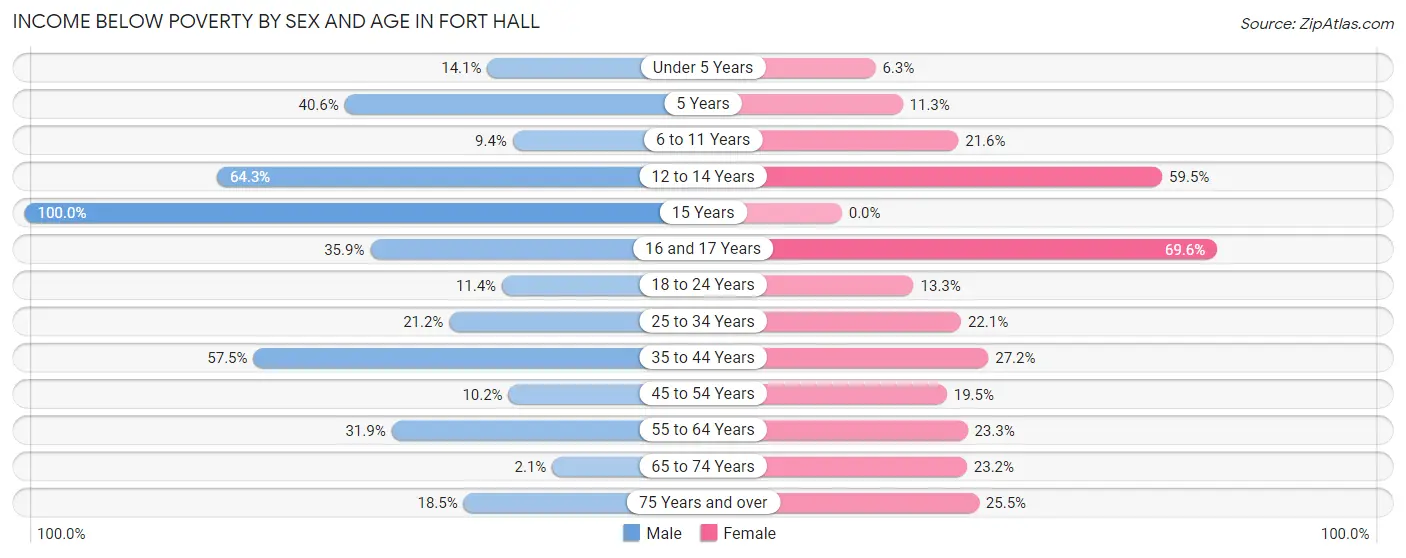
| Age Bracket | Male | Female |
| Under 5 Years | 12 (14.1%) | 3 (6.2%) |
| 5 Years | 13 (40.6%) | 7 (11.3%) |
| 6 to 11 Years | 14 (9.4%) | 16 (21.6%) |
| 12 to 14 Years | 18 (64.3%) | 44 (59.5%) |
| 15 Years | 4 (100.0%) | 0 (0.0%) |
| 16 and 17 Years | 19 (35.8%) | 39 (69.6%) |
| 18 to 24 Years | 13 (11.4%) | 6 (13.3%) |
| 25 to 34 Years | 25 (21.2%) | 46 (22.1%) |
| 35 to 44 Years | 103 (57.5%) | 31 (27.2%) |
| 45 to 54 Years | 16 (10.2%) | 38 (19.5%) |
| 55 to 64 Years | 37 (31.9%) | 42 (23.3%) |
| 65 to 74 Years | 4 (2.1%) | 26 (23.2%) |
| 75 Years and over | 20 (18.5%) | 14 (25.5%) |
| Total | 298 (22.3%) | 312 (25.4%) |
Income Above Poverty by Sex and Age in Fort Hall
According to the poverty statistics in Fort Hall, males aged 65 to 74 years and females aged 15 years are the age groups that are most secure financially, with 97.9% of males and 100.0% of females in these age groups living above the poverty line.
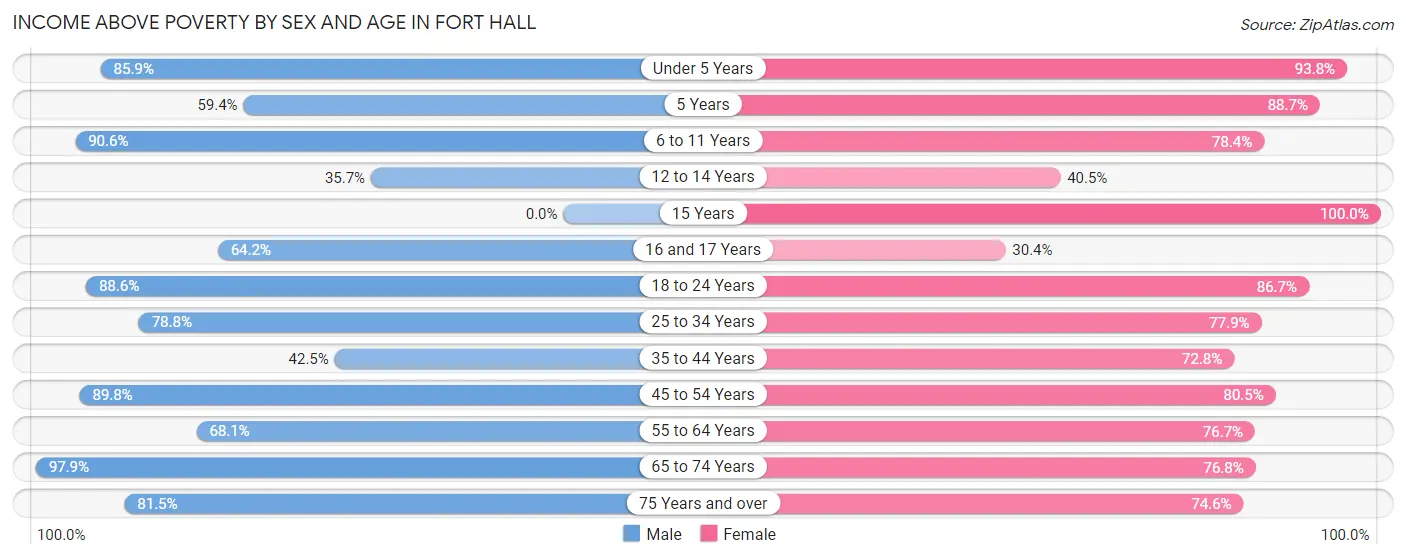
| Age Bracket | Male | Female |
| Under 5 Years | 73 (85.9%) | 45 (93.8%) |
| 5 Years | 19 (59.4%) | 55 (88.7%) |
| 6 to 11 Years | 135 (90.6%) | 58 (78.4%) |
| 12 to 14 Years | 10 (35.7%) | 30 (40.5%) |
| 15 Years | 0 (0.0%) | 4 (100.0%) |
| 16 and 17 Years | 34 (64.1%) | 17 (30.4%) |
| 18 to 24 Years | 101 (88.6%) | 39 (86.7%) |
| 25 to 34 Years | 93 (78.8%) | 162 (77.9%) |
| 35 to 44 Years | 76 (42.5%) | 83 (72.8%) |
| 45 to 54 Years | 141 (89.8%) | 157 (80.5%) |
| 55 to 64 Years | 79 (68.1%) | 138 (76.7%) |
| 65 to 74 Years | 188 (97.9%) | 86 (76.8%) |
| 75 Years and over | 88 (81.5%) | 41 (74.6%) |
| Total | 1,037 (77.7%) | 915 (74.6%) |
Income Below Poverty Among Married-Couple Families in Fort Hall
The poverty statistics for married-couple families in Fort Hall show that 5.6% or 14 of the total 252 families live below the poverty line. Families with no children have the highest poverty rate of 7.6%, comprising of 14 families. On the other hand, families with 1 or 2 children have the lowest poverty rate of 0.0%, which includes 0 families.
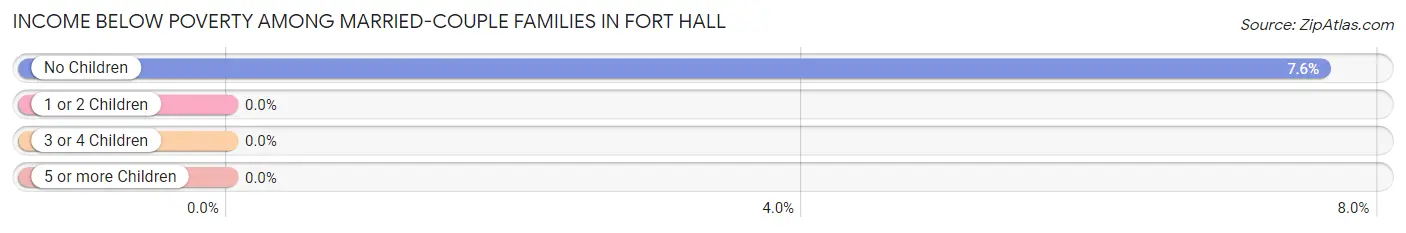
| Children | Above Poverty | Below Poverty |
| No Children | 170 (92.4%) | 14 (7.6%) |
| 1 or 2 Children | 26 (100.0%) | 0 (0.0%) |
| 3 or 4 Children | 42 (100.0%) | 0 (0.0%) |
| 5 or more Children | 0 (0.0%) | 0 (0.0%) |
| Total | 238 (94.4%) | 14 (5.6%) |
Income Below Poverty Among Single-Parent Households in Fort Hall
According to the poverty data in Fort Hall, 23.1% or 18 single-father households and 46.3% or 95 single-mother households are living below the poverty line. Among single-father households, those with 1 or 2 children have the highest poverty rate, with 10 households (58.8%) experiencing poverty. Likewise, among single-mother households, those with 1 or 2 children have the highest poverty rate, with 83 households (56.1%) falling below the poverty line.
| Children | Single Father | Single Mother |
| No Children | 4 (8.0%) | 7 (20.6%) |
| 1 or 2 Children | 10 (58.8%) | 83 (56.1%) |
| 3 or 4 Children | 4 (36.4%) | 5 (26.3%) |
| 5 or more Children | 0 (0.0%) | 0 (0.0%) |
| Total | 18 (23.1%) | 95 (46.3%) |
Income Below Poverty Among Married-Couple vs Single-Parent Households in Fort Hall
The poverty data for Fort Hall shows that 14 of the married-couple family households (5.6%) and 113 of the single-parent households (39.9%) are living below the poverty level. Within the married-couple family households, those with no children have the highest poverty rate, with 14 households (7.6%) falling below the poverty line. Among the single-parent households, those with 1 or 2 children have the highest poverty rate, with 93 household (56.4%) living below poverty.
| Children | Married-Couple Families | Single-Parent Households |
| No Children | 14 (7.6%) | 11 (13.1%) |
| 1 or 2 Children | 0 (0.0%) | 93 (56.4%) |
| 3 or 4 Children | 0 (0.0%) | 9 (30.0%) |
| 5 or more Children | 0 (0.0%) | 0 (0.0%) |
| Total | 14 (5.6%) | 113 (39.9%) |
Race in Fort Hall
The most populous races in Fort Hall are Native / Alaskan (1,751 | 67.1%), White / Caucasian (681 | 26.1%), and Hispanic or Latino (248 | 9.5%).
| Race | # Population | % Population |
| Asian | 0 | 0.0% |
| Black / African American | 0 | 0.0% |
| Hawaiian / Pacific | 7 | 0.3% |
| Hispanic or Latino | 248 | 9.5% |
| Native / Alaskan | 1,751 | 67.1% |
| White / Caucasian | 681 | 26.1% |
| Two or more Races | 143 | 5.5% |
| Some other Race | 26 | 1.0% |
| Total | 2,608 | 100.0% |
Ancestry in Fort Hall
The most populous ancestries reported in Fort Hall are Mexican (248 | 9.5%), Shoshone (222 | 8.5%), English (136 | 5.2%), German (100 | 3.8%), and American (86 | 3.3%), together accounting for 30.4% of all Fort Hall residents.
| Ancestry | # Population | % Population |
| African | 6 | 0.2% |
| American | 86 | 3.3% |
| Austrian | 18 | 0.7% |
| Basque | 10 | 0.4% |
| Belgian | 20 | 0.8% |
| British | 10 | 0.4% |
| Cherokee | 19 | 0.7% |
| Cheyenne | 9 | 0.4% |
| Chippewa | 16 | 0.6% |
| Danish | 6 | 0.2% |
| Dutch | 15 | 0.6% |
| English | 136 | 5.2% |
| European | 18 | 0.7% |
| French | 23 | 0.9% |
| French Canadian | 7 | 0.3% |
| German | 100 | 3.8% |
| Irish | 80 | 3.1% |
| Italian | 6 | 0.2% |
| Mexican | 248 | 9.5% |
| Native Hawaiian | 7 | 0.3% |
| Navajo | 48 | 1.8% |
| Norwegian | 7 | 0.3% |
| Portuguese | 15 | 0.6% |
| Potawatomi | 7 | 0.3% |
| Scandinavian | 33 | 1.3% |
| Scotch-Irish | 16 | 0.6% |
| Scottish | 17 | 0.6% |
| Shoshone | 222 | 8.5% |
| Subsaharan African | 6 | 0.2% |
| Swedish | 13 | 0.5% |
| Swiss | 5 | 0.2% |
| Welsh | 20 | 0.8% | View All 32 Rows |
Immigrants in Fort Hall
The most numerous immigrant groups reported in Fort Hall came from Central America (24 | 0.9%), Latin America (24 | 0.9%), and Mexico (24 | 0.9%), together accounting for 2.8% of all Fort Hall residents.
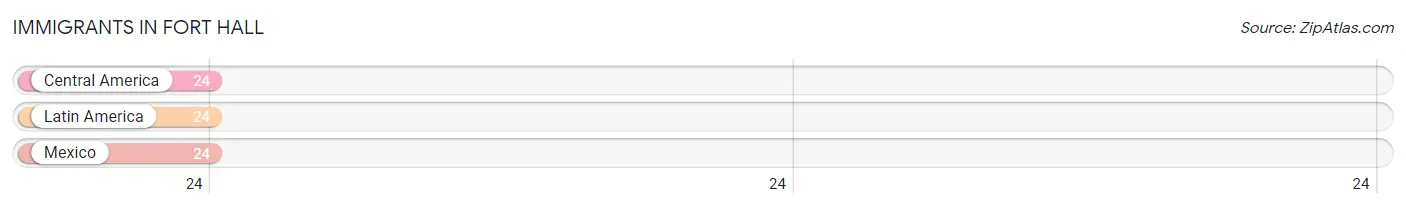
| Immigration Origin | # Population | % Population |
| Central America | 24 | 0.9% |
| Latin America | 24 | 0.9% |
| Mexico | 24 | 0.9% | View All 3 Rows |
Sex and Age in Fort Hall
Sex and Age in Fort Hall
The most populous age groups in Fort Hall are 5 to 9 Years (163 | 12.0%) for men and 25 to 29 Years (157 | 12.6%) for women.
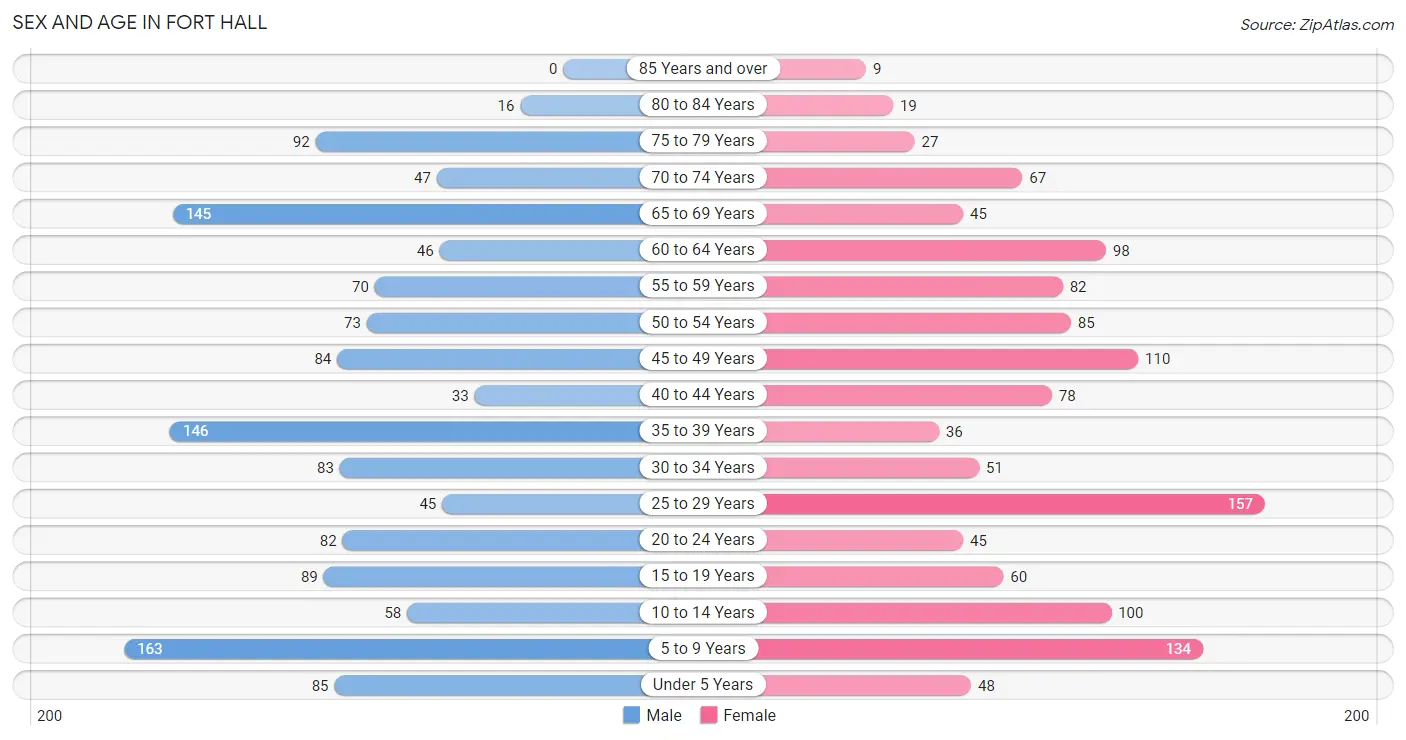
| Age Bracket | Male | Female |
| Under 5 Years | 85 (6.3%) | 48 (3.8%) |
| 5 to 9 Years | 163 (12.0%) | 134 (10.7%) |
| 10 to 14 Years | 58 (4.3%) | 100 (8.0%) |
| 15 to 19 Years | 89 (6.6%) | 60 (4.8%) |
| 20 to 24 Years | 82 (6.0%) | 45 (3.6%) |
| 25 to 29 Years | 45 (3.3%) | 157 (12.6%) |
| 30 to 34 Years | 83 (6.1%) | 51 (4.1%) |
| 35 to 39 Years | 146 (10.8%) | 36 (2.9%) |
| 40 to 44 Years | 33 (2.4%) | 78 (6.2%) |
| 45 to 49 Years | 84 (6.2%) | 110 (8.8%) |
| 50 to 54 Years | 73 (5.4%) | 85 (6.8%) |
| 55 to 59 Years | 70 (5.2%) | 82 (6.6%) |
| 60 to 64 Years | 46 (3.4%) | 98 (7.8%) |
| 65 to 69 Years | 145 (10.7%) | 45 (3.6%) |
| 70 to 74 Years | 47 (3.5%) | 67 (5.4%) |
| 75 to 79 Years | 92 (6.8%) | 27 (2.2%) |
| 80 to 84 Years | 16 (1.2%) | 19 (1.5%) |
| 85 Years and over | 0 (0.0%) | 9 (0.7%) |
| Total | 1,357 (100.0%) | 1,251 (100.0%) |
Families and Households in Fort Hall
Median Family Size in Fort Hall
The median family size in Fort Hall is 3.67 persons per family, with married-couple families (252 | 47.1%) accounting for the largest median family size of 4.16 persons per family. On the other hand, single female/mother families (205 | 38.3%) represent the smallest median family size with 2.93 persons per family.
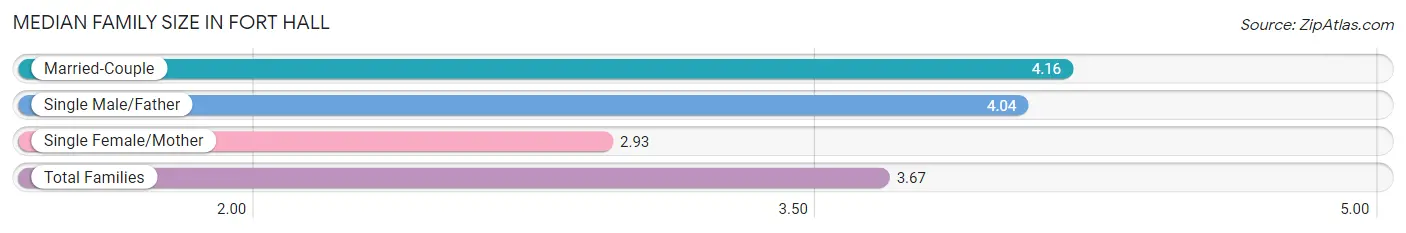
| Family Type | # Families | Family Size |
| Married-Couple | 252 (47.1%) | 4.16 |
| Single Male/Father | 78 (14.6%) | 4.04 |
| Single Female/Mother | 205 (38.3%) | 2.93 |
| Total Families | 535 (100.0%) | 3.67 |
Median Household Size in Fort Hall
The median household size in Fort Hall is 2.82 persons per household, with single male/father households (78 | 8.5%) accounting for the largest median household size of 5.12 persons per household. non-family households (385 | 41.8%) represent the smallest median household size with 1.27 persons per household.
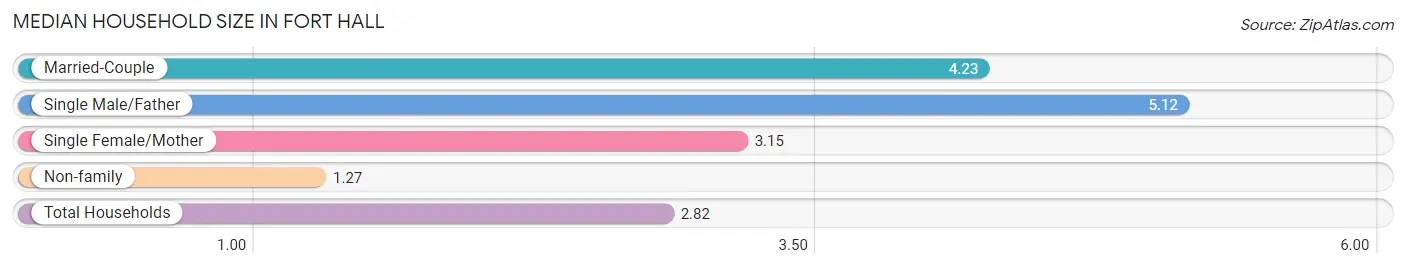
| Household Type | # Households | Household Size |
| Married-Couple | 252 (27.4%) | 4.23 |
| Single Male/Father | 78 (8.5%) | 5.12 |
| Single Female/Mother | 205 (22.3%) | 3.15 |
| Non-family | 385 (41.8%) | 1.27 |
| Total Households | 920 (100.0%) | 2.82 |
Household Size by Marriage Status in Fort Hall
Out of a total of 920 households in Fort Hall, 535 (58.2%) are family households, while 385 (41.8%) are nonfamily households. The most numerous type of family households are 2-person households, comprising 254, and the most common type of nonfamily households are 1-person households, comprising 317.
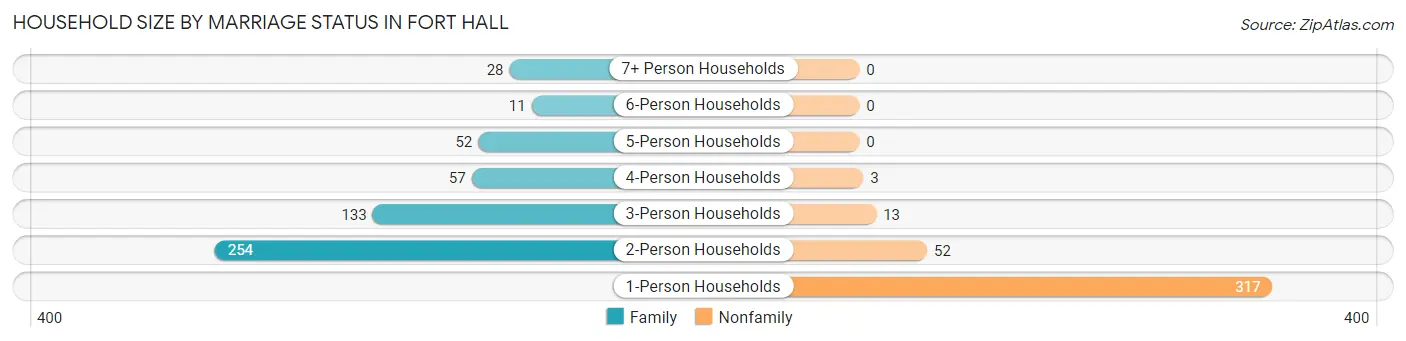
| Household Size | Family Households | Nonfamily Households |
| 1-Person Households | - | 317 (34.5%) |
| 2-Person Households | 254 (27.6%) | 52 (5.7%) |
| 3-Person Households | 133 (14.5%) | 13 (1.4%) |
| 4-Person Households | 57 (6.2%) | 3 (0.3%) |
| 5-Person Households | 52 (5.7%) | 0 (0.0%) |
| 6-Person Households | 11 (1.2%) | 0 (0.0%) |
| 7+ Person Households | 28 (3.0%) | 0 (0.0%) |
| Total | 535 (58.2%) | 385 (41.8%) |
Female Fertility in Fort Hall
Fertility by Age in Fort Hall
Average fertility rate in Fort Hall is 34.0 births per 1,000 women. Women in the age bracket of 20 to 34 years have the highest fertility rate with 55.0 births per 1,000 women. Women in the age bracket of 20 to 34 years acount for 73.7% of all women with births.
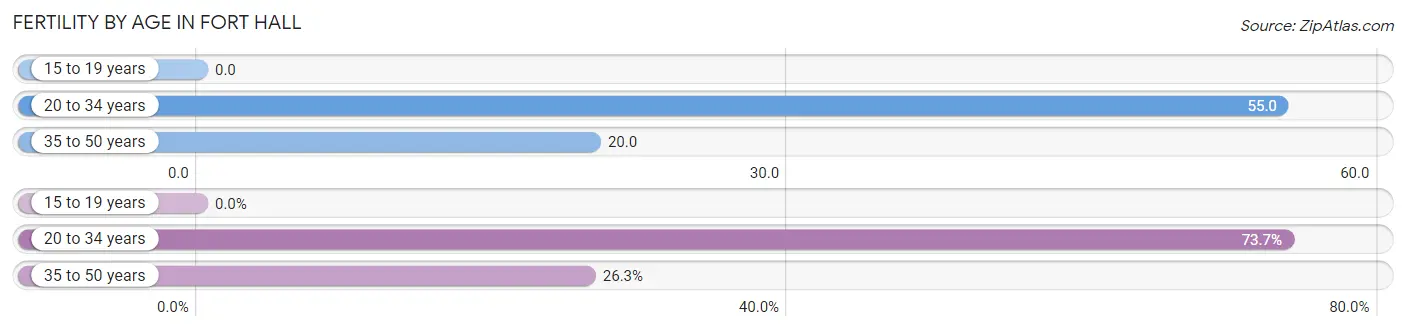
| Age Bracket | Women with Births | Births / 1,000 Women |
| 15 to 19 years | 0 (0.0%) | 0.0 |
| 20 to 34 years | 14 (73.7%) | 55.0 |
| 35 to 50 years | 5 (26.3%) | 20.0 |
| Total | 19 (100.0%) | 34.0 |
Fertility by Age by Marriage Status in Fort Hall
26.3% of women with births (19) in Fort Hall are married. The highest percentage of unmarried women with births falls into 20 to 34 years age bracket with 100.0% of them unmarried at the time of birth, while the lowest percentage of unmarried women with births belong to 35 to 50 years age bracket with 0.0% of them unmarried.
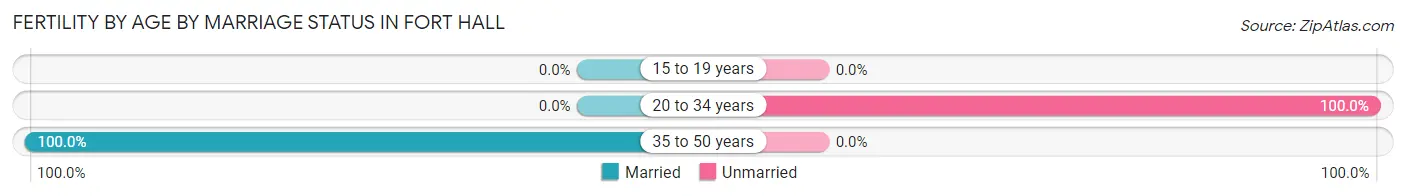
| Age Bracket | Married | Unmarried |
| 15 to 19 years | 0 (0.0%) | 0 (0.0%) |
| 20 to 34 years | 0 (0.0%) | 14 (100.0%) |
| 35 to 50 years | 5 (100.0%) | 0 (0.0%) |
| Total | 5 (26.3%) | 14 (73.7%) |
Fertility by Education in Fort Hall
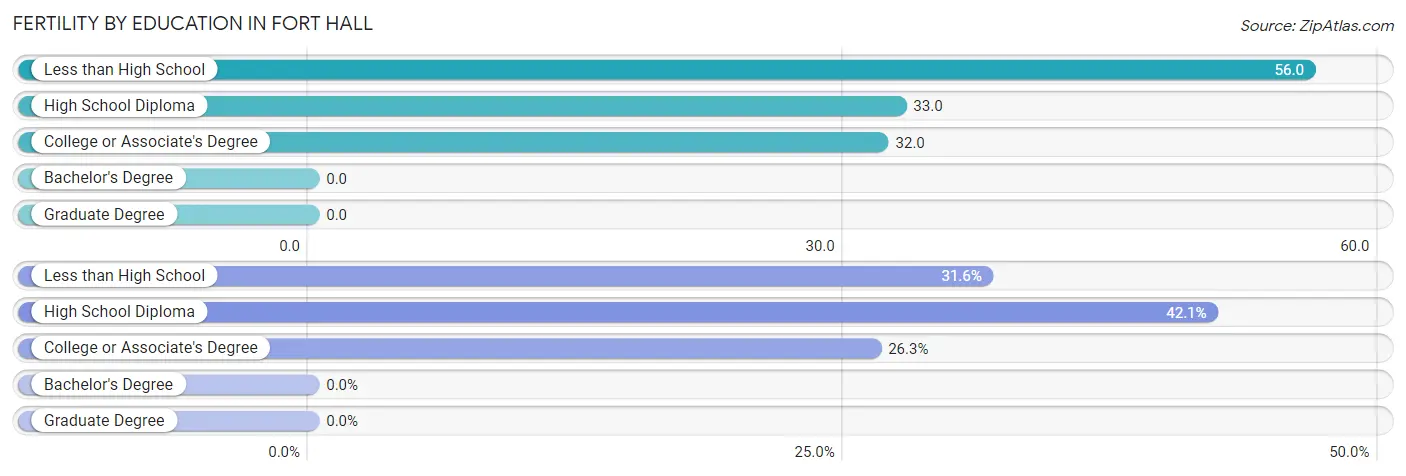
| Educational Attainment | Women with Births | Births / 1,000 Women |
| Less than High School | 6 (31.6%) | 56.0 |
| High School Diploma | 8 (42.1%) | 33.0 |
| College or Associate's Degree | 5 (26.3%) | 32.0 |
| Bachelor's Degree | 0 (0.0%) | 0.0 |
| Graduate Degree | 0 (0.0%) | 0.0 |
| Total | 19 (100.0%) | 34.0 |
Fertility by Education by Marriage Status in Fort Hall
73.7% of women with births in Fort Hall are unmarried. Women with the educational attainment of college or associate's degree are most likely to be married with 100.0% of them married at childbirth, while women with the educational attainment of less than high school are least likely to be married with 100.0% of them unmarried at childbirth.
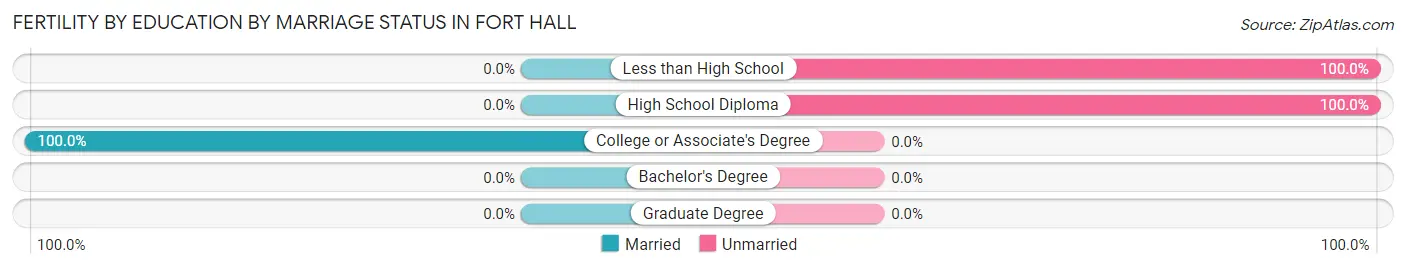
| Educational Attainment | Married | Unmarried |
| Less than High School | 0 (0.0%) | 6 (100.0%) |
| High School Diploma | 0 (0.0%) | 8 (100.0%) |
| College or Associate's Degree | 5 (100.0%) | 0 (0.0%) |
| Bachelor's Degree | 0 (0.0%) | 0 (0.0%) |
| Graduate Degree | 0 (0.0%) | 0 (0.0%) |
| Total | 5 (26.3%) | 14 (73.7%) |
Employment Characteristics in Fort Hall
Employment by Class of Employer in Fort Hall
Among the 942 employed individuals in Fort Hall, private company employees (525 | 55.7%), local government employees (137 | 14.5%), and state government employees (126 | 13.4%) make up the most common classes of employment.
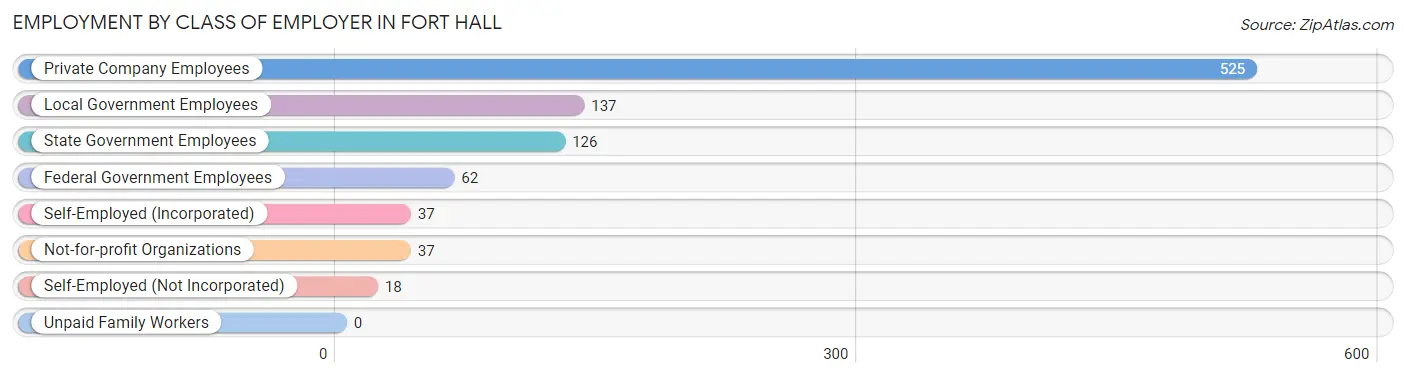
| Employer Class | # Employees | % Employees |
| Private Company Employees | 525 | 55.7% |
| Self-Employed (Incorporated) | 37 | 3.9% |
| Self-Employed (Not Incorporated) | 18 | 1.9% |
| Not-for-profit Organizations | 37 | 3.9% |
| Local Government Employees | 137 | 14.5% |
| State Government Employees | 126 | 13.4% |
| Federal Government Employees | 62 | 6.6% |
| Unpaid Family Workers | 0 | 0.0% |
| Total | 942 | 100.0% |
Employment Status by Age in Fort Hall
According to the labor force statistics for Fort Hall, out of the total population over 16 years of age (2,012), 55.5% or 1,117 individuals are in the labor force, with 12.3% or 137 of them unemployed. The age group with the highest labor force participation rate is 45 to 54 years, with 80.4% or 283 individuals in the labor force. Within the labor force, the 35 to 44 years age range has the highest percentage of unemployed individuals, with 37.4% or 85 of them being unemployed.
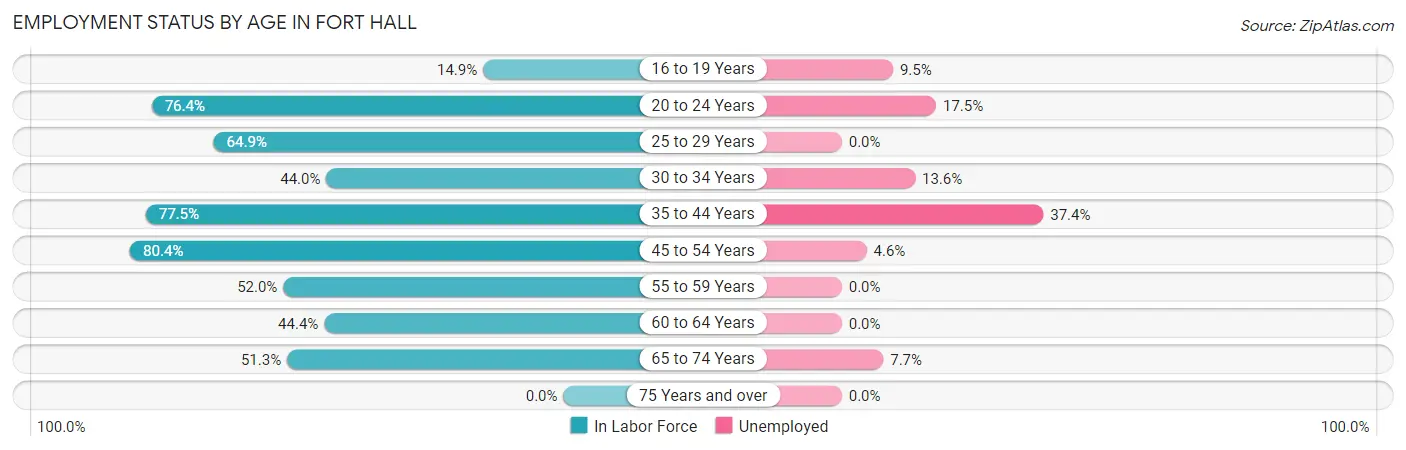
| Age Bracket | In Labor Force | Unemployed |
| 16 to 19 Years | 21 (14.9%) | 2 (9.5%) |
| 20 to 24 Years | 97 (76.4%) | 17 (17.5%) |
| 25 to 29 Years | 131 (64.9%) | 0 (0.0%) |
| 30 to 34 Years | 59 (44.0%) | 8 (13.6%) |
| 35 to 44 Years | 227 (77.5%) | 85 (37.4%) |
| 45 to 54 Years | 283 (80.4%) | 13 (4.6%) |
| 55 to 59 Years | 79 (52.0%) | 0 (0.0%) |
| 60 to 64 Years | 64 (44.4%) | 0 (0.0%) |
| 65 to 74 Years | 156 (51.3%) | 12 (7.7%) |
| 75 Years and over | 0 (0.0%) | 0 (0.0%) |
| Total | 1,117 (55.5%) | 137 (12.3%) |
Employment Status by Educational Attainment in Fort Hall
According to labor force statistics for Fort Hall, 66.0% of individuals (843) out of the total population between 25 and 64 years of age (1,277) are in the labor force, with 12.6% or 106 of them being unemployed. The group with the highest labor force participation rate are those with the educational attainment of bachelor's degree or higher, with 84.4% or 130 individuals in the labor force. Within the labor force, individuals with less than high school education have the highest percentage of unemployment, with 57.2% or 79 of them being unemployed.
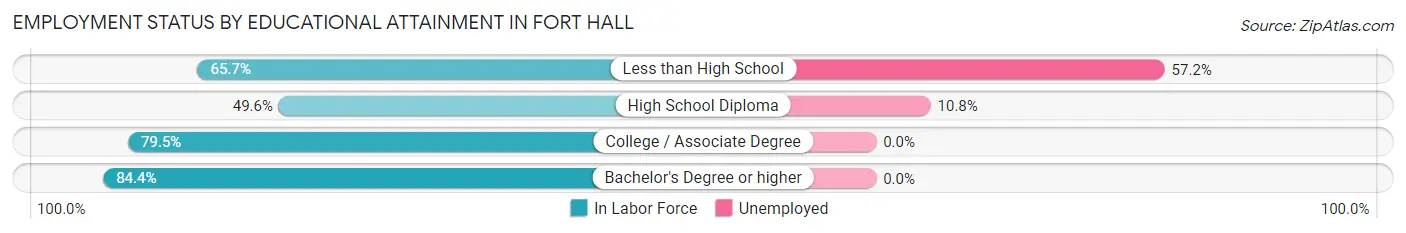
| Educational Attainment | In Labor Force | Unemployed |
| Less than High School | 138 (65.7%) | 120 (57.2%) |
| High School Diploma | 250 (49.6%) | 54 (10.8%) |
| College / Associate Degree | 325 (79.5%) | 0 (0.0%) |
| Bachelor's Degree or higher | 130 (84.4%) | 0 (0.0%) |
| Total | 843 (66.0%) | 161 (12.6%) |
Employment Occupations by Sex in Fort Hall
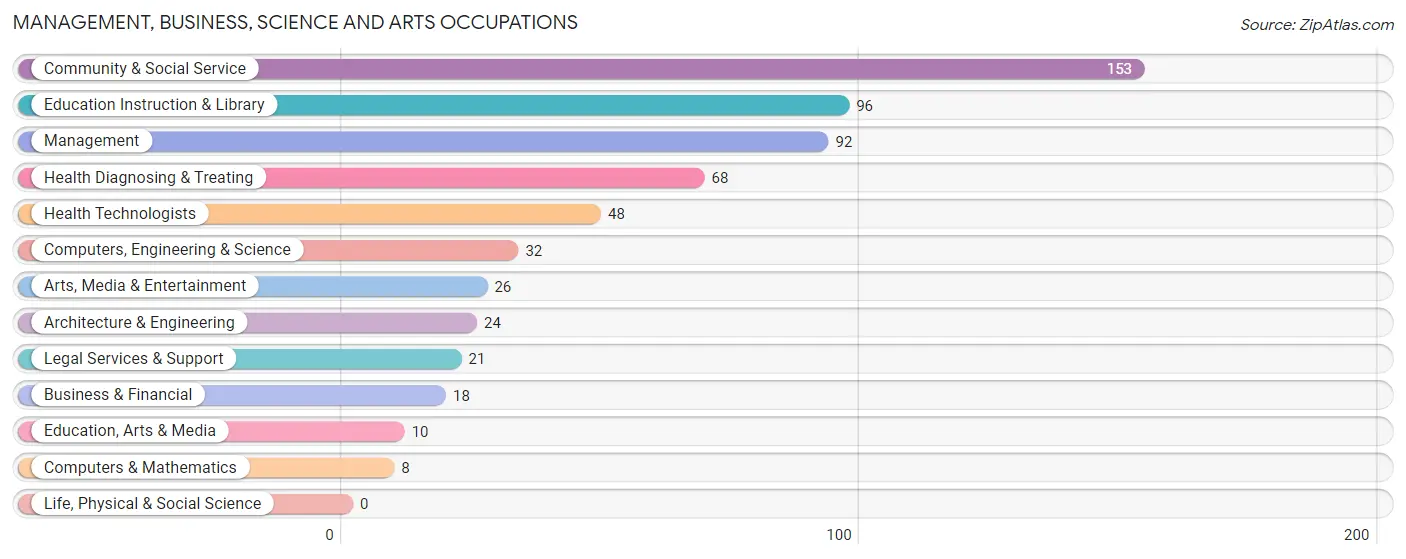
Management, Business, Science and Arts Occupations
The most common Management, Business, Science and Arts occupations in Fort Hall are Community & Social Service (153 | 15.6%), Education Instruction & Library (96 | 9.8%), Management (92 | 9.4%), Health Diagnosing & Treating (68 | 6.9%), and Health Technologists (48 | 4.9%).
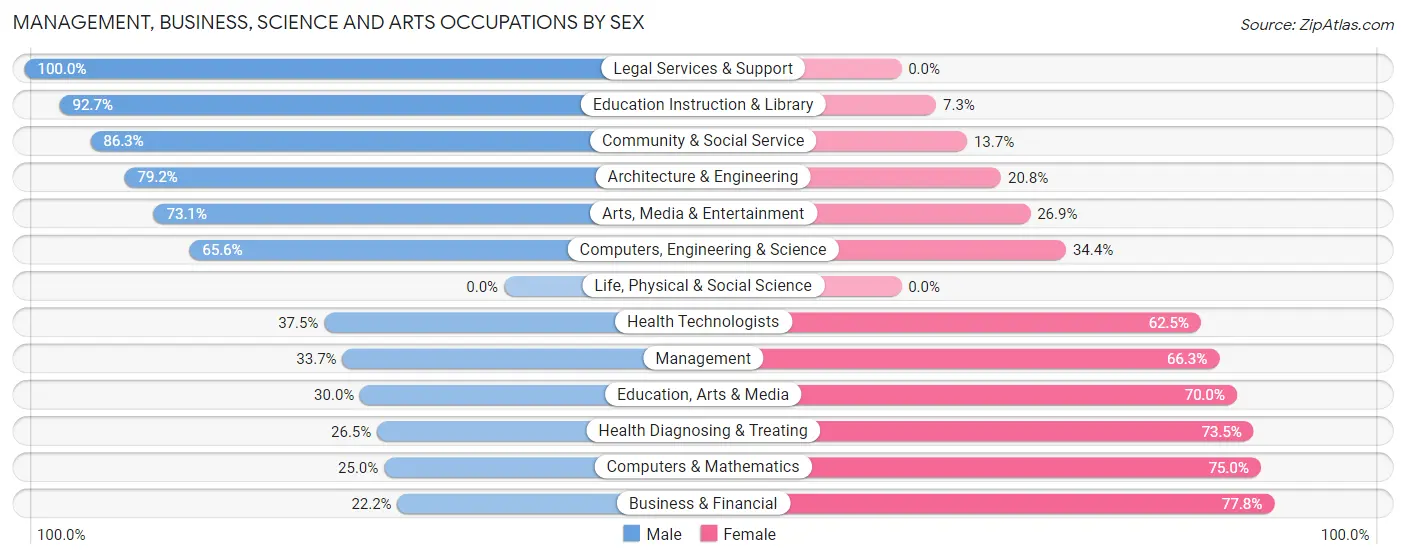
Management, Business, Science and Arts Occupations by Sex
Within the Management, Business, Science and Arts occupations in Fort Hall, the most male-oriented occupations are Legal Services & Support (100.0%), Education Instruction & Library (92.7%), and Community & Social Service (86.3%), while the most female-oriented occupations are Business & Financial (77.8%), Computers & Mathematics (75.0%), and Health Diagnosing & Treating (73.5%).
| Occupation | Male | Female |
| Management | 31 (33.7%) | 61 (66.3%) |
| Business & Financial | 4 (22.2%) | 14 (77.8%) |
| Computers, Engineering & Science | 21 (65.6%) | 11 (34.4%) |
| Computers & Mathematics | 2 (25.0%) | 6 (75.0%) |
| Architecture & Engineering | 19 (79.2%) | 5 (20.8%) |
| Life, Physical & Social Science | 0 (0.0%) | 0 (0.0%) |
| Community & Social Service | 132 (86.3%) | 21 (13.7%) |
| Education, Arts & Media | 3 (30.0%) | 7 (70.0%) |
| Legal Services & Support | 21 (100.0%) | 0 (0.0%) |
| Education Instruction & Library | 89 (92.7%) | 7 (7.3%) |
| Arts, Media & Entertainment | 19 (73.1%) | 7 (26.9%) |
| Health Diagnosing & Treating | 18 (26.5%) | 50 (73.5%) |
| Health Technologists | 18 (37.5%) | 30 (62.5%) |
| Total (Category) | 206 (56.8%) | 157 (43.2%) |
| Total (Overall) | 505 (51.5%) | 475 (48.5%) |
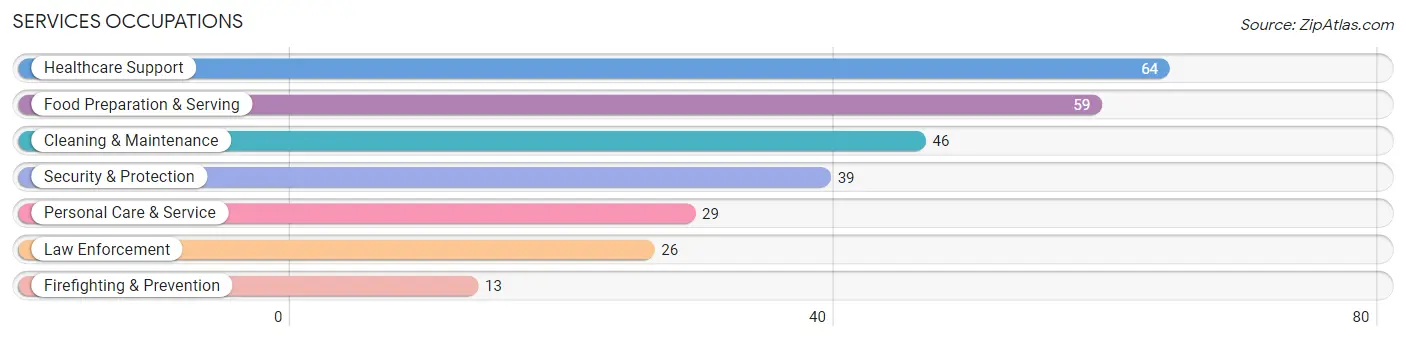
Services Occupations
The most common Services occupations in Fort Hall are Healthcare Support (64 | 6.5%), Food Preparation & Serving (59 | 6.0%), Cleaning & Maintenance (46 | 4.7%), Security & Protection (39 | 4.0%), and Personal Care & Service (29 | 3.0%).
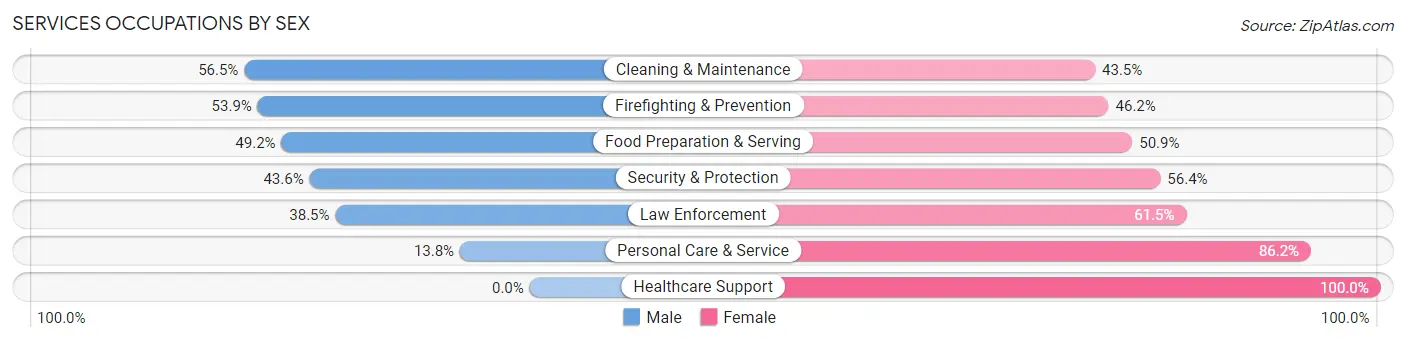
Services Occupations by Sex
Within the Services occupations in Fort Hall, the most male-oriented occupations are Cleaning & Maintenance (56.5%), Firefighting & Prevention (53.8%), and Food Preparation & Serving (49.1%), while the most female-oriented occupations are Healthcare Support (100.0%), Personal Care & Service (86.2%), and Law Enforcement (61.5%).
| Occupation | Male | Female |
| Healthcare Support | 0 (0.0%) | 64 (100.0%) |
| Security & Protection | 17 (43.6%) | 22 (56.4%) |
| Firefighting & Prevention | 7 (53.8%) | 6 (46.2%) |
| Law Enforcement | 10 (38.5%) | 16 (61.5%) |
| Food Preparation & Serving | 29 (49.1%) | 30 (50.8%) |
| Cleaning & Maintenance | 26 (56.5%) | 20 (43.5%) |
| Personal Care & Service | 4 (13.8%) | 25 (86.2%) |
| Total (Category) | 76 (32.1%) | 161 (67.9%) |
| Total (Overall) | 505 (51.5%) | 475 (48.5%) |
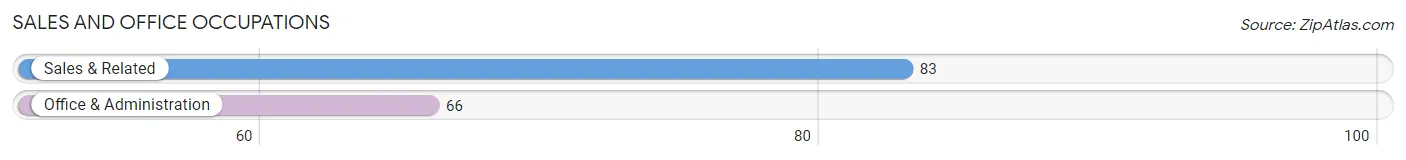
Sales and Office Occupations
The most common Sales and Office occupations in Fort Hall are Sales & Related (83 | 8.5%), and Office & Administration (66 | 6.7%).
Sales and Office Occupations by Sex
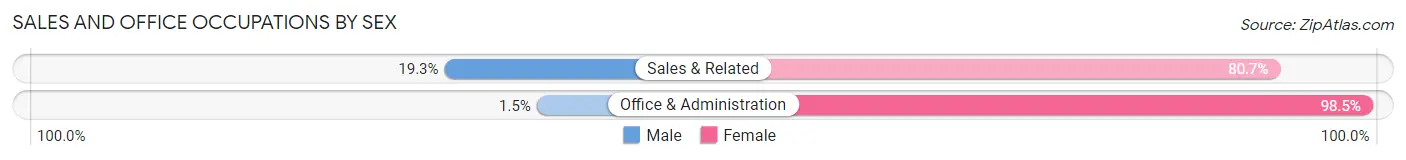
| Occupation | Male | Female |
| Sales & Related | 16 (19.3%) | 67 (80.7%) |
| Office & Administration | 1 (1.5%) | 65 (98.5%) |
| Total (Category) | 17 (11.4%) | 132 (88.6%) |
| Total (Overall) | 505 (51.5%) | 475 (48.5%) |
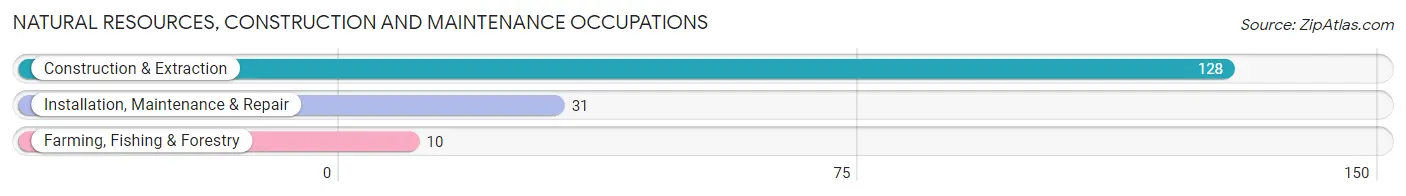
Natural Resources, Construction and Maintenance Occupations
The most common Natural Resources, Construction and Maintenance occupations in Fort Hall are Construction & Extraction (128 | 13.1%), Installation, Maintenance & Repair (31 | 3.2%), and Farming, Fishing & Forestry (10 | 1.0%).
Natural Resources, Construction and Maintenance Occupations by Sex
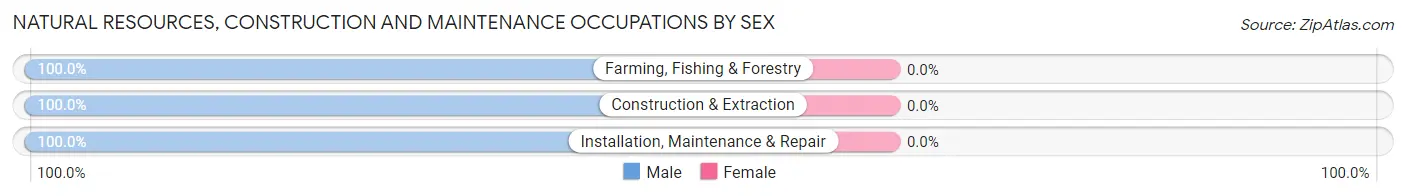
| Occupation | Male | Female |
| Farming, Fishing & Forestry | 10 (100.0%) | 0 (0.0%) |
| Construction & Extraction | 128 (100.0%) | 0 (0.0%) |
| Installation, Maintenance & Repair | 31 (100.0%) | 0 (0.0%) |
| Total (Category) | 169 (100.0%) | 0 (0.0%) |
| Total (Overall) | 505 (51.5%) | 475 (48.5%) |
Production, Transportation and Moving Occupations
The most common Production, Transportation and Moving occupations in Fort Hall are Production (25 | 2.5%), Material Moving (21 | 2.1%), and Transportation (16 | 1.6%).
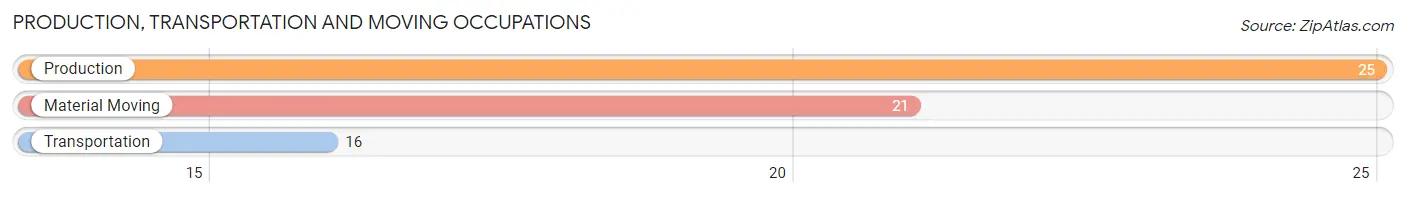
Production, Transportation and Moving Occupations by Sex
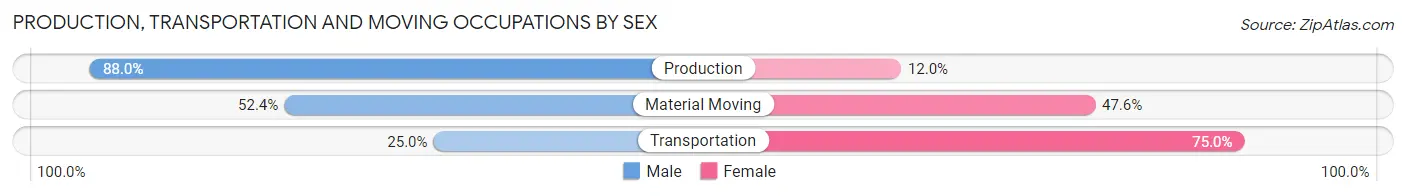
| Occupation | Male | Female |
| Production | 22 (88.0%) | 3 (12.0%) |
| Transportation | 4 (25.0%) | 12 (75.0%) |
| Material Moving | 11 (52.4%) | 10 (47.6%) |
| Total (Category) | 37 (59.7%) | 25 (40.3%) |
| Total (Overall) | 505 (51.5%) | 475 (48.5%) |
Employment Industries by Sex in Fort Hall
Employment Industries in Fort Hall
The major employment industries in Fort Hall include Educational Services (140 | 14.3%), Health Care & Social Assistance (137 | 14.0%), Arts, Entertainment & Recreation (133 | 13.6%), Public Administration (113 | 11.5%), and Construction (104 | 10.6%).
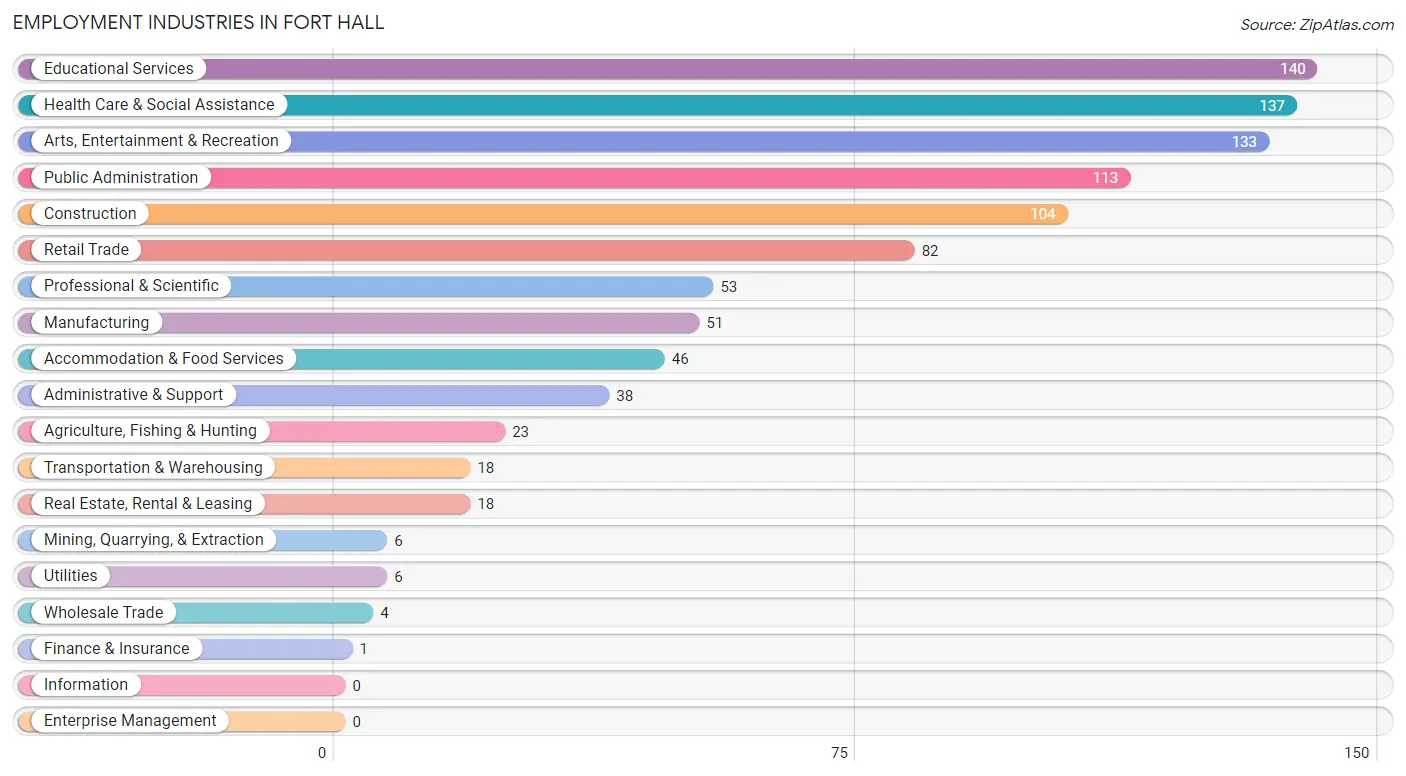
Employment Industries by Sex in Fort Hall
The Fort Hall industries that see more men than women are Mining, Quarrying, & Extraction (100.0%), Construction (100.0%), and Utilities (100.0%), whereas the industries that tend to have a higher number of women are Wholesale Trade (100.0%), Health Care & Social Assistance (97.8%), and Retail Trade (87.8%).
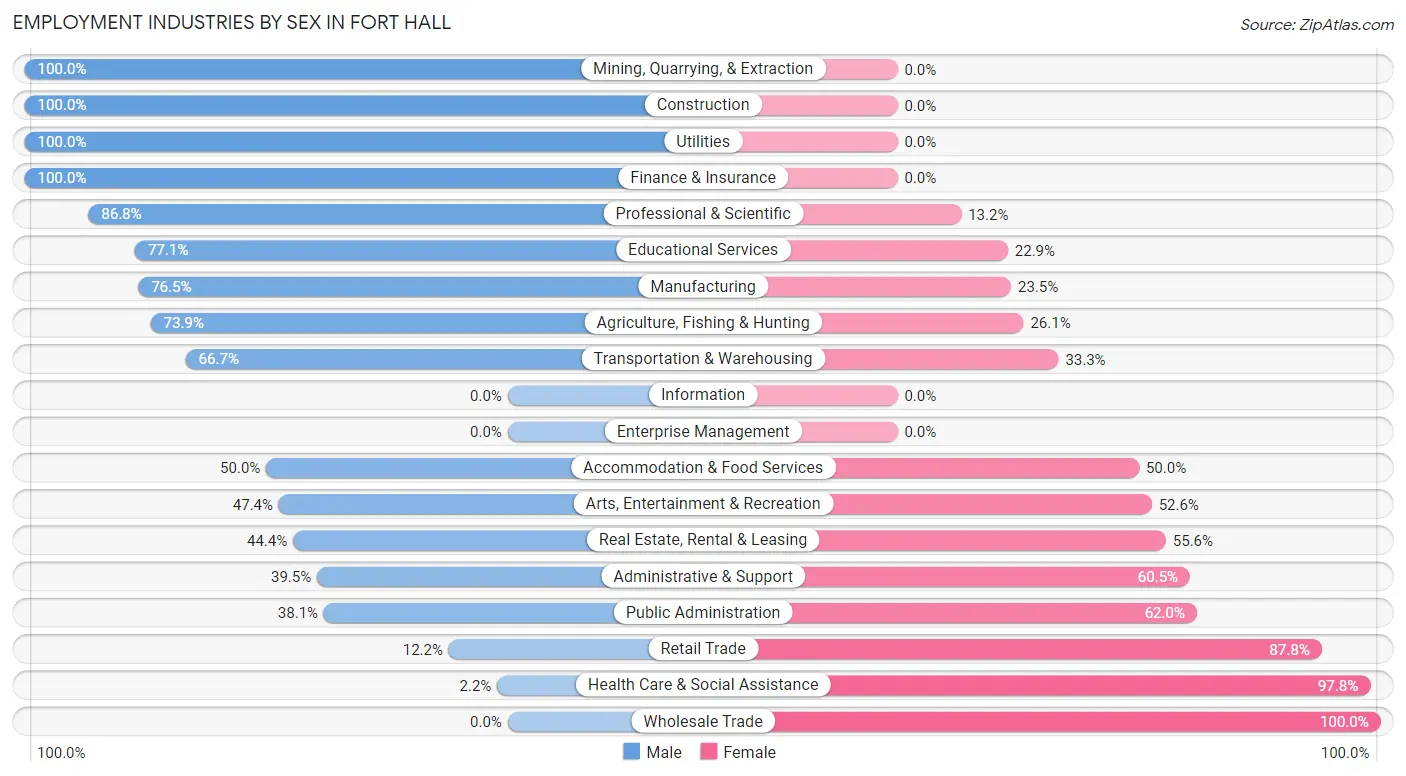
| Industry | Male | Female |
| Agriculture, Fishing & Hunting | 17 (73.9%) | 6 (26.1%) |
| Mining, Quarrying, & Extraction | 6 (100.0%) | 0 (0.0%) |
| Construction | 104 (100.0%) | 0 (0.0%) |
| Manufacturing | 39 (76.5%) | 12 (23.5%) |
| Wholesale Trade | 0 (0.0%) | 4 (100.0%) |
| Retail Trade | 10 (12.2%) | 72 (87.8%) |
| Transportation & Warehousing | 12 (66.7%) | 6 (33.3%) |
| Utilities | 6 (100.0%) | 0 (0.0%) |
| Information | 0 (0.0%) | 0 (0.0%) |
| Finance & Insurance | 1 (100.0%) | 0 (0.0%) |
| Real Estate, Rental & Leasing | 8 (44.4%) | 10 (55.6%) |
| Professional & Scientific | 46 (86.8%) | 7 (13.2%) |
| Enterprise Management | 0 (0.0%) | 0 (0.0%) |
| Administrative & Support | 15 (39.5%) | 23 (60.5%) |
| Educational Services | 108 (77.1%) | 32 (22.9%) |
| Health Care & Social Assistance | 3 (2.2%) | 134 (97.8%) |
| Arts, Entertainment & Recreation | 63 (47.4%) | 70 (52.6%) |
| Accommodation & Food Services | 23 (50.0%) | 23 (50.0%) |
| Public Administration | 43 (38.1%) | 70 (62.0%) |
| Total | 505 (51.5%) | 475 (48.5%) |
Education in Fort Hall
School Enrollment in Fort Hall
The most common levels of schooling among the 662 students in Fort Hall are middle school (172 | 26.0%), elementary school (133 | 20.1%), and high school (131 | 19.8%).
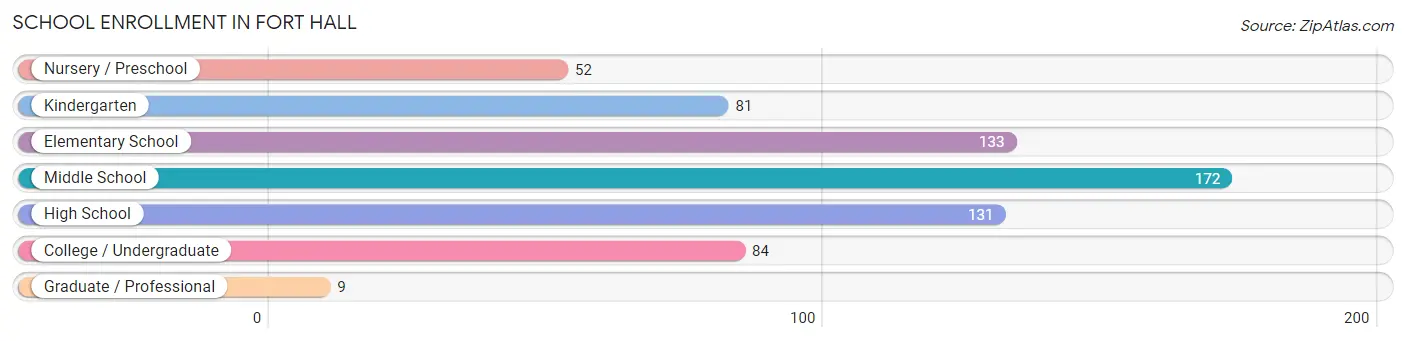
| School Level | # Students | % Students |
| Nursery / Preschool | 52 | 7.9% |
| Kindergarten | 81 | 12.2% |
| Elementary School | 133 | 20.1% |
| Middle School | 172 | 26.0% |
| High School | 131 | 19.8% |
| College / Undergraduate | 84 | 12.7% |
| Graduate / Professional | 9 | 1.4% |
| Total | 662 | 100.0% |
School Enrollment by Age by Funding Source in Fort Hall
Out of a total of 662 students who are enrolled in schools in Fort Hall, 19 (2.9%) attend a private institution, while the remaining 643 (97.1%) are enrolled in public schools. The age group of 18 to 19 year olds has the highest likelihood of being enrolled in private schools, with 14 (100.0% in the age bracket) enrolled. Conversely, the age group of 3 to 4 year olds has the lowest likelihood of being enrolled in a private school, with 13 (100.0% in the age bracket) attending a public institution.
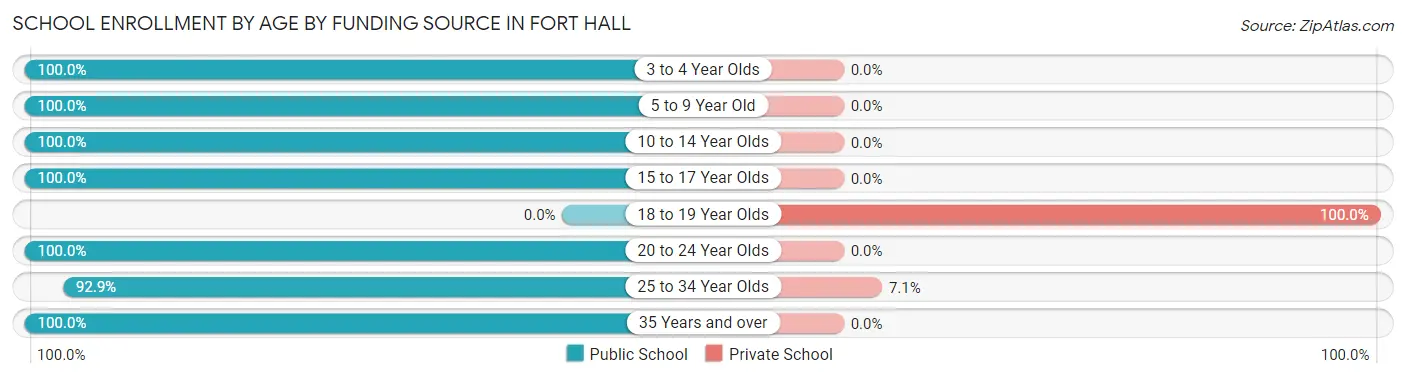
| Age Bracket | Public School | Private School |
| 3 to 4 Year Olds | 13 (100.0%) | 0 (0.0%) |
| 5 to 9 Year Old | 267 (100.0%) | 0 (0.0%) |
| 10 to 14 Year Olds | 158 (100.0%) | 0 (0.0%) |
| 15 to 17 Year Olds | 117 (100.0%) | 0 (0.0%) |
| 18 to 19 Year Olds | 0 (0.0%) | 14 (100.0%) |
| 20 to 24 Year Olds | 15 (100.0%) | 0 (0.0%) |
| 25 to 34 Year Olds | 65 (92.9%) | 5 (7.1%) |
| 35 Years and over | 8 (100.0%) | 0 (0.0%) |
| Total | 643 (97.1%) | 19 (2.9%) |
Educational Attainment by Field of Study in Fort Hall
Social sciences (111 | 35.5%), arts & humanities (48 | 15.3%), science & technology (37 | 11.8%), engineering (32 | 10.2%), and business (29 | 9.3%) are the most common fields of study among 313 individuals in Fort Hall who have obtained a bachelor's degree or higher.
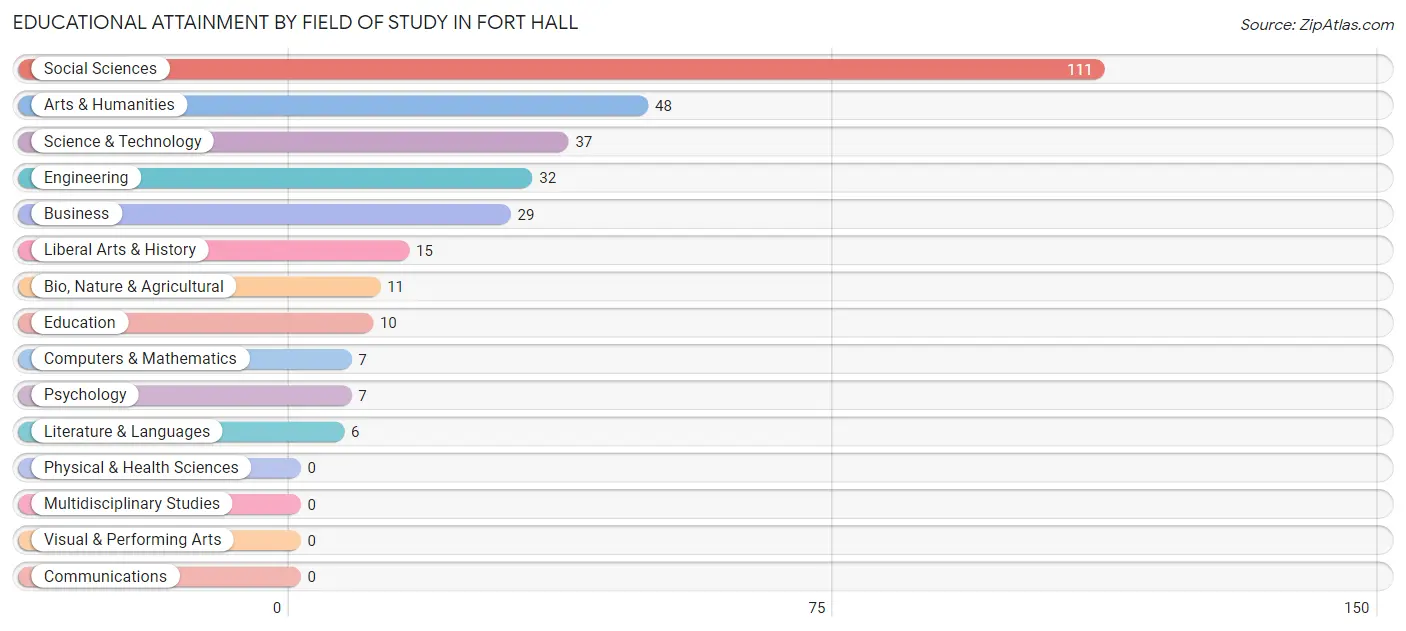
| Field of Study | # Graduates | % Graduates |
| Computers & Mathematics | 7 | 2.2% |
| Bio, Nature & Agricultural | 11 | 3.5% |
| Physical & Health Sciences | 0 | 0.0% |
| Psychology | 7 | 2.2% |
| Social Sciences | 111 | 35.5% |
| Engineering | 32 | 10.2% |
| Multidisciplinary Studies | 0 | 0.0% |
| Science & Technology | 37 | 11.8% |
| Business | 29 | 9.3% |
| Education | 10 | 3.2% |
| Literature & Languages | 6 | 1.9% |
| Liberal Arts & History | 15 | 4.8% |
| Visual & Performing Arts | 0 | 0.0% |
| Communications | 0 | 0.0% |
| Arts & Humanities | 48 | 15.3% |
| Total | 313 | 100.0% |
Transportation & Commute in Fort Hall
Vehicle Availability by Sex in Fort Hall
The most prevalent vehicle ownership categories in Fort Hall are males with 3 vehicles (144, accounting for 30.1%) and females with 3 vehicles (143, making up 31.1%).
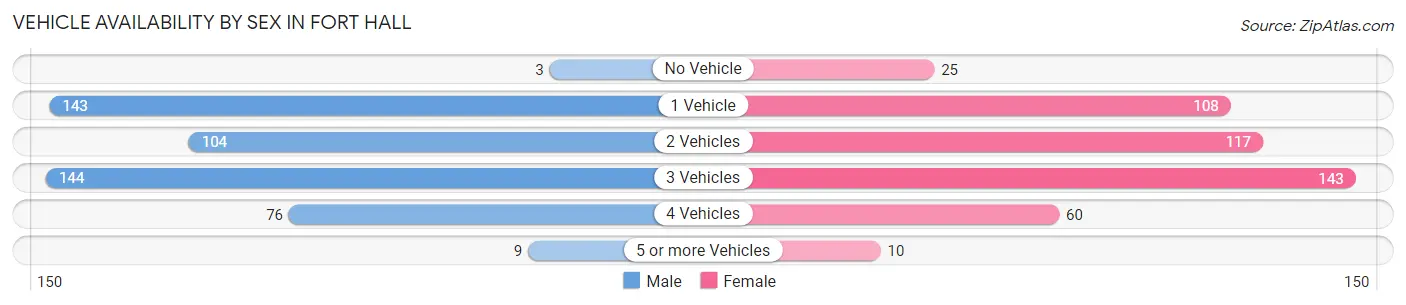
| Vehicles Available | Male | Female |
| No Vehicle | 3 (0.6%) | 25 (5.4%) |
| 1 Vehicle | 143 (29.8%) | 108 (23.3%) |
| 2 Vehicles | 104 (21.7%) | 117 (25.3%) |
| 3 Vehicles | 144 (30.1%) | 143 (30.9%) |
| 4 Vehicles | 76 (15.9%) | 60 (13.0%) |
| 5 or more Vehicles | 9 (1.9%) | 10 (2.2%) |
| Total | 479 (100.0%) | 463 (100.0%) |
Commute Time in Fort Hall
The most frequently occuring commute durations in Fort Hall are 30 to 34 minutes (172 commuters, 18.9%), 5 to 9 minutes (161 commuters, 17.6%), and 10 to 14 minutes (145 commuters, 15.9%).
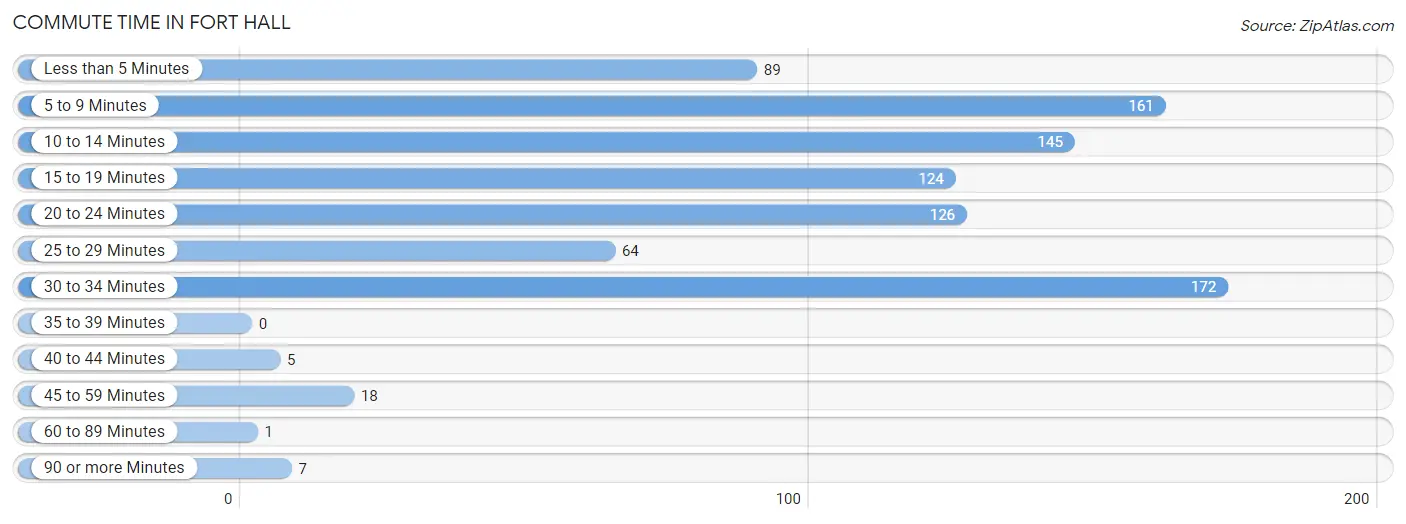
| Commute Time | # Commuters | % Commuters |
| Less than 5 Minutes | 89 | 9.8% |
| 5 to 9 Minutes | 161 | 17.6% |
| 10 to 14 Minutes | 145 | 15.9% |
| 15 to 19 Minutes | 124 | 13.6% |
| 20 to 24 Minutes | 126 | 13.8% |
| 25 to 29 Minutes | 64 | 7.0% |
| 30 to 34 Minutes | 172 | 18.9% |
| 35 to 39 Minutes | 0 | 0.0% |
| 40 to 44 Minutes | 5 | 0.5% |
| 45 to 59 Minutes | 18 | 2.0% |
| 60 to 89 Minutes | 1 | 0.1% |
| 90 or more Minutes | 7 | 0.8% |
Commute Time by Sex in Fort Hall
The most common commute times in Fort Hall are 30 to 34 minutes (149 commuters, 31.3%) for males and 10 to 14 minutes (103 commuters, 23.6%) for females.
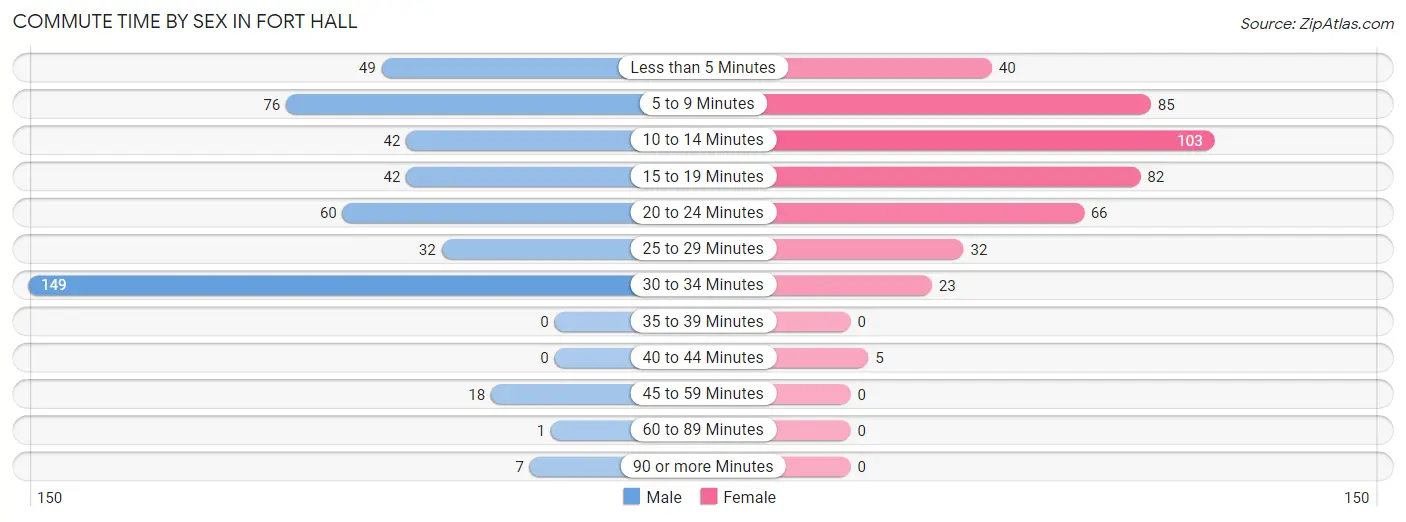
| Commute Time | Male | Female |
| Less than 5 Minutes | 49 (10.3%) | 40 (9.2%) |
| 5 to 9 Minutes | 76 (16.0%) | 85 (19.5%) |
| 10 to 14 Minutes | 42 (8.8%) | 103 (23.6%) |
| 15 to 19 Minutes | 42 (8.8%) | 82 (18.8%) |
| 20 to 24 Minutes | 60 (12.6%) | 66 (15.1%) |
| 25 to 29 Minutes | 32 (6.7%) | 32 (7.3%) |
| 30 to 34 Minutes | 149 (31.3%) | 23 (5.3%) |
| 35 to 39 Minutes | 0 (0.0%) | 0 (0.0%) |
| 40 to 44 Minutes | 0 (0.0%) | 5 (1.1%) |
| 45 to 59 Minutes | 18 (3.8%) | 0 (0.0%) |
| 60 to 89 Minutes | 1 (0.2%) | 0 (0.0%) |
| 90 or more Minutes | 7 (1.5%) | 0 (0.0%) |
Time of Departure to Work by Sex in Fort Hall
The most frequent times of departure to work in Fort Hall are 7:30 AM to 7:59 AM (188, 39.5%) for males and 7:30 AM to 7:59 AM (78, 17.9%) for females.
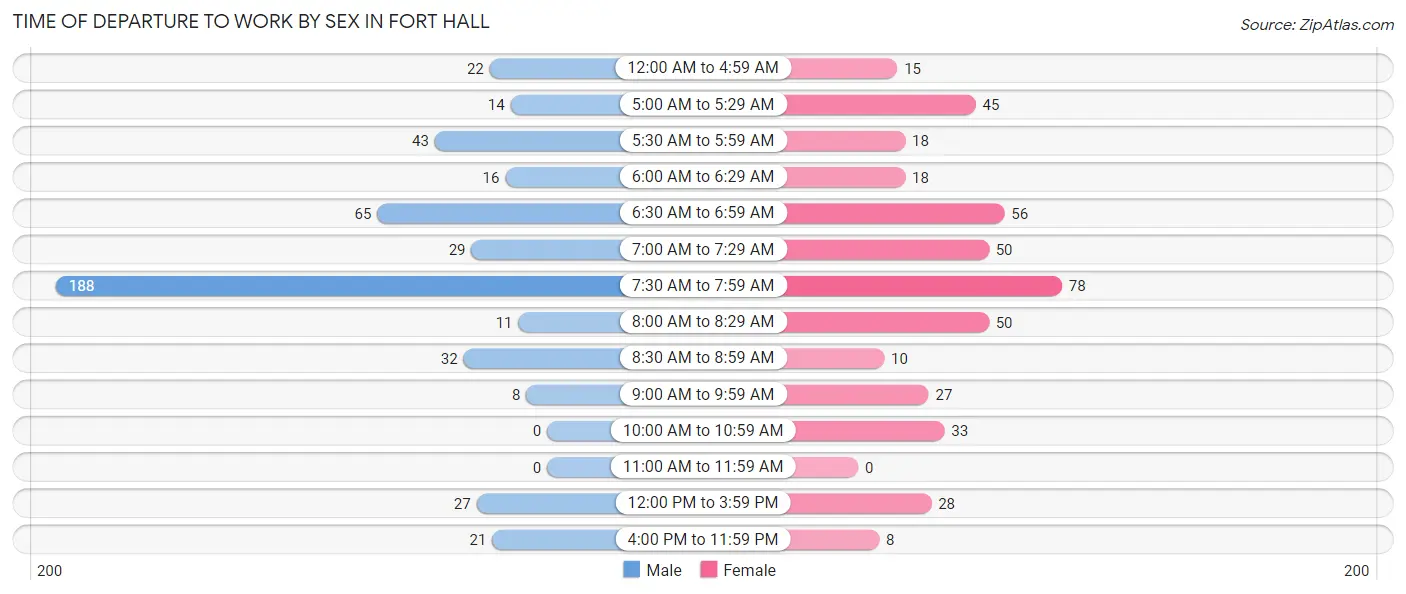
| Time of Departure | Male | Female |
| 12:00 AM to 4:59 AM | 22 (4.6%) | 15 (3.4%) |
| 5:00 AM to 5:29 AM | 14 (2.9%) | 45 (10.3%) |
| 5:30 AM to 5:59 AM | 43 (9.0%) | 18 (4.1%) |
| 6:00 AM to 6:29 AM | 16 (3.4%) | 18 (4.1%) |
| 6:30 AM to 6:59 AM | 65 (13.7%) | 56 (12.8%) |
| 7:00 AM to 7:29 AM | 29 (6.1%) | 50 (11.5%) |
| 7:30 AM to 7:59 AM | 188 (39.5%) | 78 (17.9%) |
| 8:00 AM to 8:29 AM | 11 (2.3%) | 50 (11.5%) |
| 8:30 AM to 8:59 AM | 32 (6.7%) | 10 (2.3%) |
| 9:00 AM to 9:59 AM | 8 (1.7%) | 27 (6.2%) |
| 10:00 AM to 10:59 AM | 0 (0.0%) | 33 (7.6%) |
| 11:00 AM to 11:59 AM | 0 (0.0%) | 0 (0.0%) |
| 12:00 PM to 3:59 PM | 27 (5.7%) | 28 (6.4%) |
| 4:00 PM to 11:59 PM | 21 (4.4%) | 8 (1.8%) |
| Total | 476 (100.0%) | 436 (100.0%) |
Housing Occupancy in Fort Hall
Occupancy by Ownership in Fort Hall
Of the total 920 dwellings in Fort Hall, owner-occupied units account for 722 (78.5%), while renter-occupied units make up 198 (21.5%).
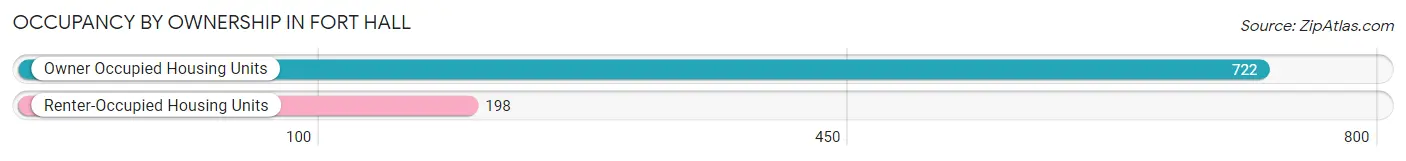
| Occupancy | # Housing Units | % Housing Units |
| Owner Occupied Housing Units | 722 | 78.5% |
| Renter-Occupied Housing Units | 198 | 21.5% |
| Total Occupied Housing Units | 920 | 100.0% |
Occupancy by Household Size in Fort Hall
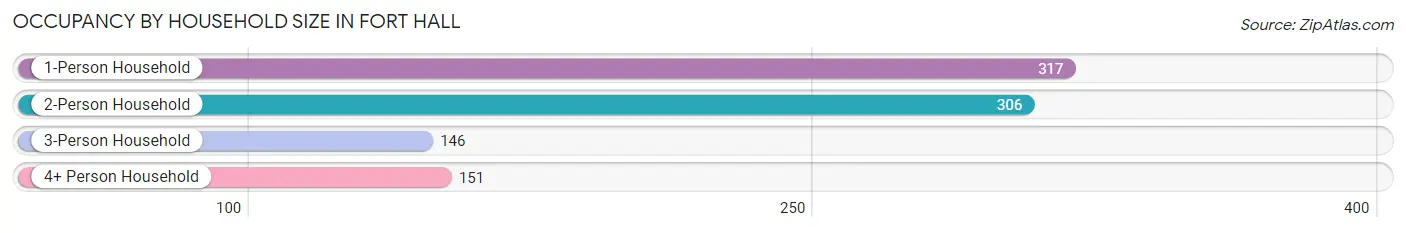
| Household Size | # Housing Units | % Housing Units |
| 1-Person Household | 317 | 34.5% |
| 2-Person Household | 306 | 33.3% |
| 3-Person Household | 146 | 15.9% |
| 4+ Person Household | 151 | 16.4% |
| Total Housing Units | 920 | 100.0% |
Occupancy by Ownership by Household Size in Fort Hall
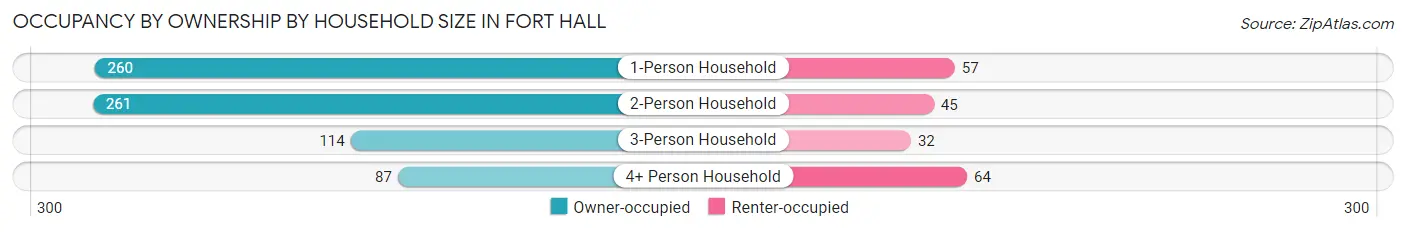
| Household Size | Owner-occupied | Renter-occupied |
| 1-Person Household | 260 (82.0%) | 57 (18.0%) |
| 2-Person Household | 261 (85.3%) | 45 (14.7%) |
| 3-Person Household | 114 (78.1%) | 32 (21.9%) |
| 4+ Person Household | 87 (57.6%) | 64 (42.4%) |
| Total Housing Units | 722 (78.5%) | 198 (21.5%) |
Occupancy by Educational Attainment in Fort Hall
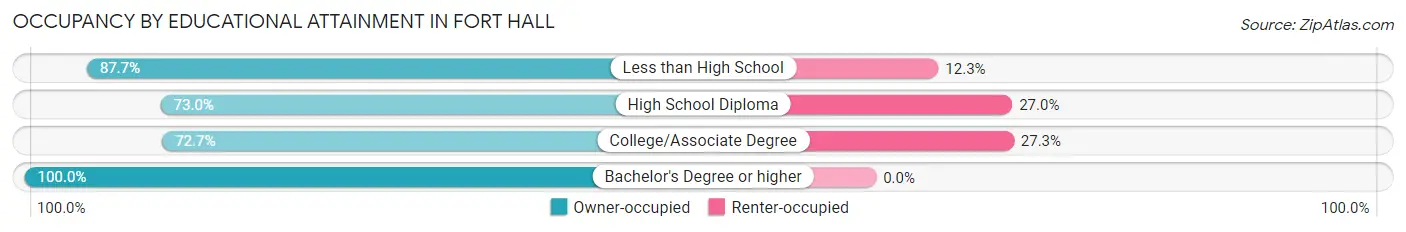
| Household Size | Owner-occupied | Renter-occupied |
| Less than High School | 135 (87.7%) | 19 (12.3%) |
| High School Diploma | 276 (73.0%) | 102 (27.0%) |
| College/Associate Degree | 205 (72.7%) | 77 (27.3%) |
| Bachelor's Degree or higher | 106 (100.0%) | 0 (0.0%) |
Occupancy by Age of Householder in Fort Hall
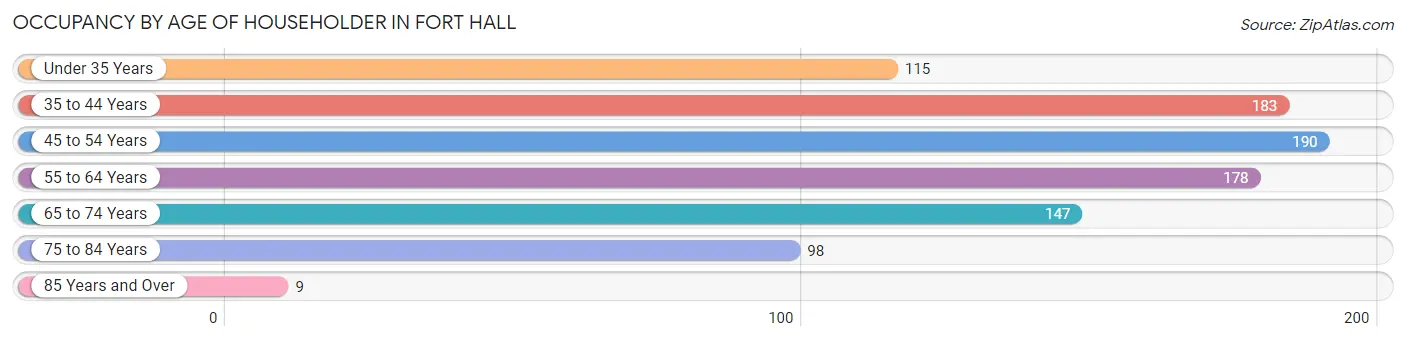
| Age Bracket | # Households | % Households |
| Under 35 Years | 115 | 12.5% |
| 35 to 44 Years | 183 | 19.9% |
| 45 to 54 Years | 190 | 20.6% |
| 55 to 64 Years | 178 | 19.4% |
| 65 to 74 Years | 147 | 16.0% |
| 75 to 84 Years | 98 | 10.6% |
| 85 Years and Over | 9 | 1.0% |
| Total | 920 | 100.0% |
Housing Finances in Fort Hall
Median Income by Occupancy in Fort Hall
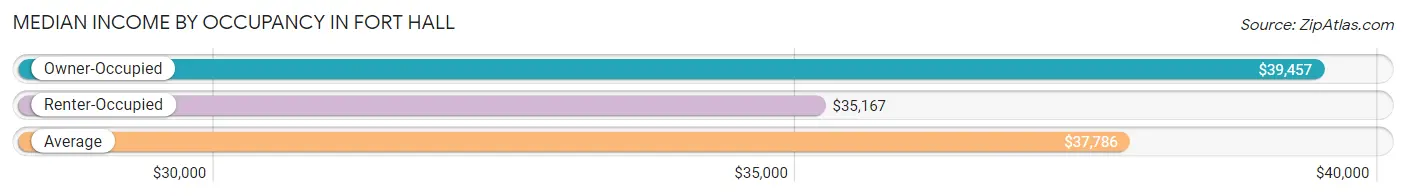
| Occupancy Type | # Households | Median Income |
| Owner-Occupied | 722 (78.5%) | $39,457 |
| Renter-Occupied | 198 (21.5%) | $35,167 |
| Average | 920 (100.0%) | $37,786 |
Occupancy by Householder Income Bracket in Fort Hall
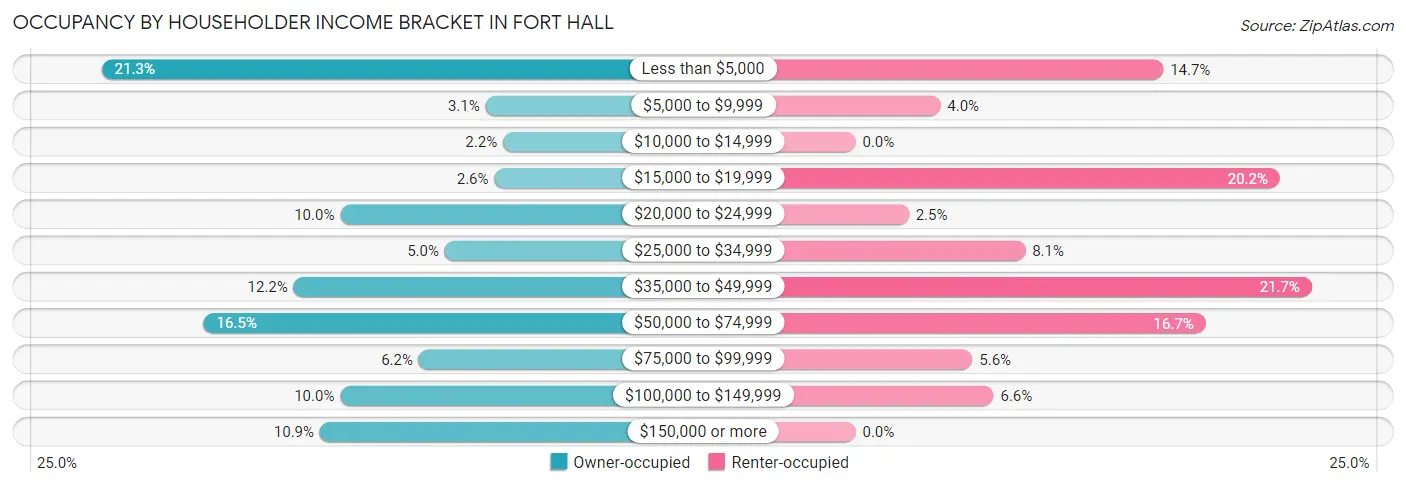
| Income Bracket | Owner-occupied | Renter-occupied |
| Less than $5,000 | 154 (21.3%) | 29 (14.6%) |
| $5,000 to $9,999 | 22 (3.0%) | 8 (4.0%) |
| $10,000 to $14,999 | 16 (2.2%) | 0 (0.0%) |
| $15,000 to $19,999 | 19 (2.6%) | 40 (20.2%) |
| $20,000 to $24,999 | 72 (10.0%) | 5 (2.5%) |
| $25,000 to $34,999 | 36 (5.0%) | 16 (8.1%) |
| $35,000 to $49,999 | 88 (12.2%) | 43 (21.7%) |
| $50,000 to $74,999 | 119 (16.5%) | 33 (16.7%) |
| $75,000 to $99,999 | 45 (6.2%) | 11 (5.6%) |
| $100,000 to $149,999 | 72 (10.0%) | 13 (6.6%) |
| $150,000 or more | 79 (10.9%) | 0 (0.0%) |
| Total | 722 (100.0%) | 198 (100.0%) |
Monthly Housing Cost Tiers in Fort Hall
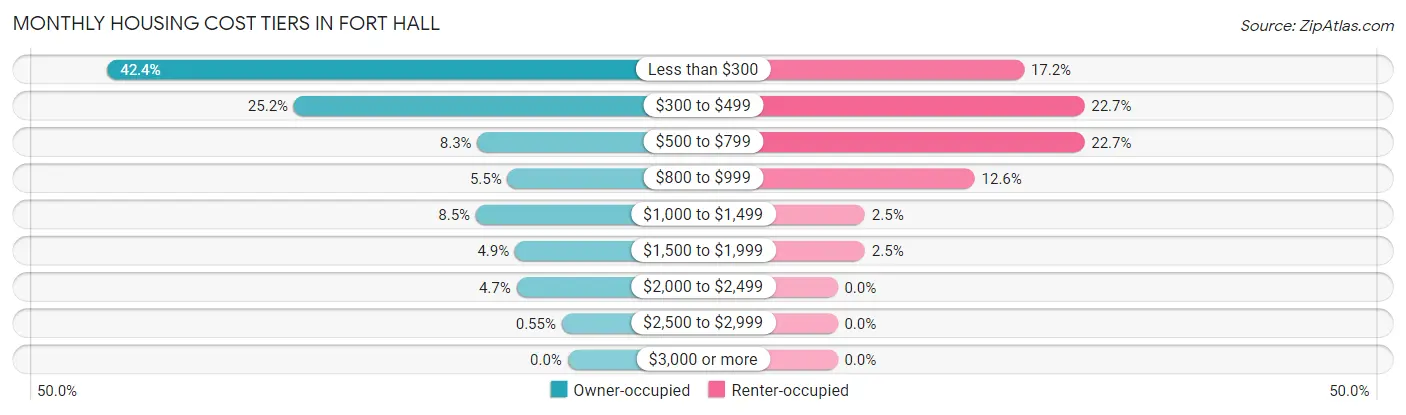
| Monthly Cost | Owner-occupied | Renter-occupied |
| Less than $300 | 306 (42.4%) | 34 (17.2%) |
| $300 to $499 | 182 (25.2%) | 45 (22.7%) |
| $500 to $799 | 60 (8.3%) | 45 (22.7%) |
| $800 to $999 | 40 (5.5%) | 25 (12.6%) |
| $1,000 to $1,499 | 61 (8.5%) | 5 (2.5%) |
| $1,500 to $1,999 | 35 (4.9%) | 5 (2.5%) |
| $2,000 to $2,499 | 34 (4.7%) | 0 (0.0%) |
| $2,500 to $2,999 | 4 (0.5%) | 0 (0.0%) |
| $3,000 or more | 0 (0.0%) | 0 (0.0%) |
| Total | 722 (100.0%) | 198 (100.0%) |
Physical Housing Characteristics in Fort Hall
Housing Structures in Fort Hall
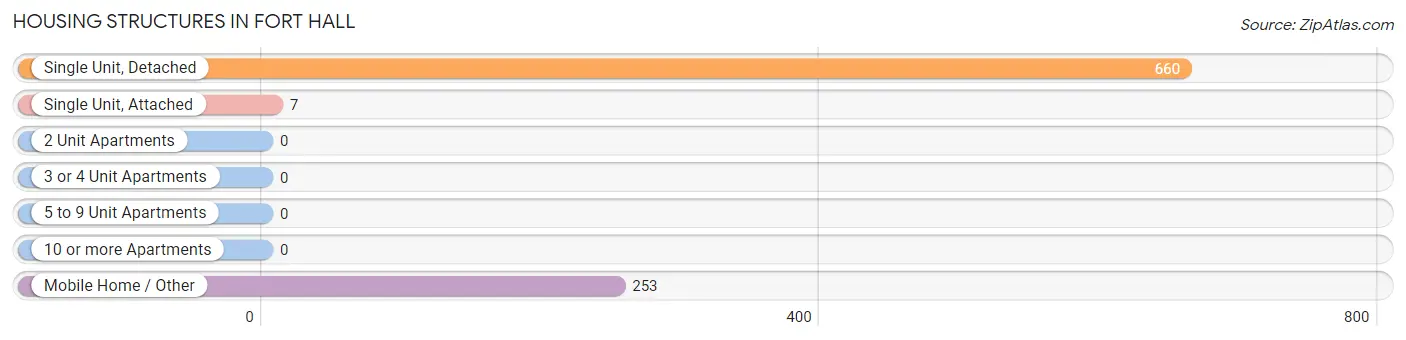
| Structure Type | # Housing Units | % Housing Units |
| Single Unit, Detached | 660 | 71.7% |
| Single Unit, Attached | 7 | 0.8% |
| 2 Unit Apartments | 0 | 0.0% |
| 3 or 4 Unit Apartments | 0 | 0.0% |
| 5 to 9 Unit Apartments | 0 | 0.0% |
| 10 or more Apartments | 0 | 0.0% |
| Mobile Home / Other | 253 | 27.5% |
| Total | 920 | 100.0% |
Housing Structures by Occupancy in Fort Hall
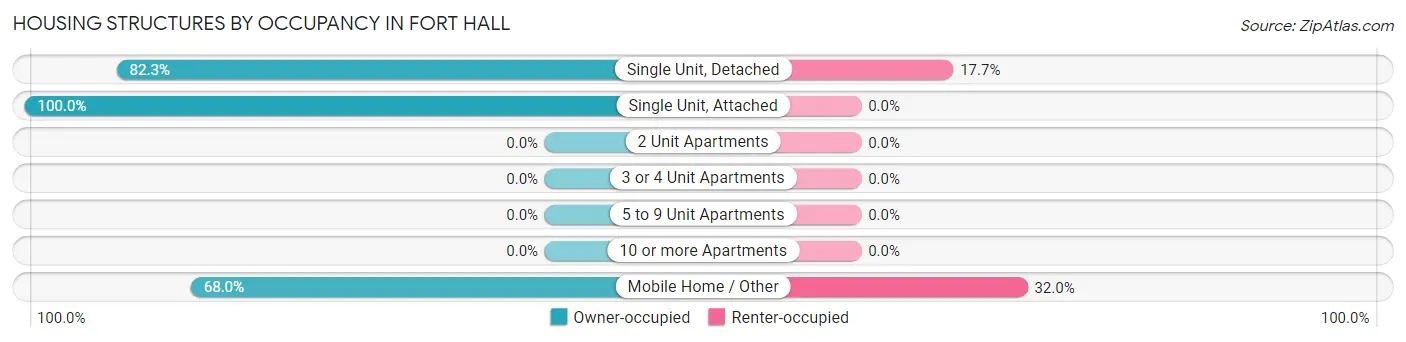
| Structure Type | Owner-occupied | Renter-occupied |
| Single Unit, Detached | 543 (82.3%) | 117 (17.7%) |
| Single Unit, Attached | 7 (100.0%) | 0 (0.0%) |
| 2 Unit Apartments | 0 (0.0%) | 0 (0.0%) |
| 3 or 4 Unit Apartments | 0 (0.0%) | 0 (0.0%) |
| 5 to 9 Unit Apartments | 0 (0.0%) | 0 (0.0%) |
| 10 or more Apartments | 0 (0.0%) | 0 (0.0%) |
| Mobile Home / Other | 172 (68.0%) | 81 (32.0%) |
| Total | 722 (78.5%) | 198 (21.5%) |
Housing Structures by Number of Rooms in Fort Hall
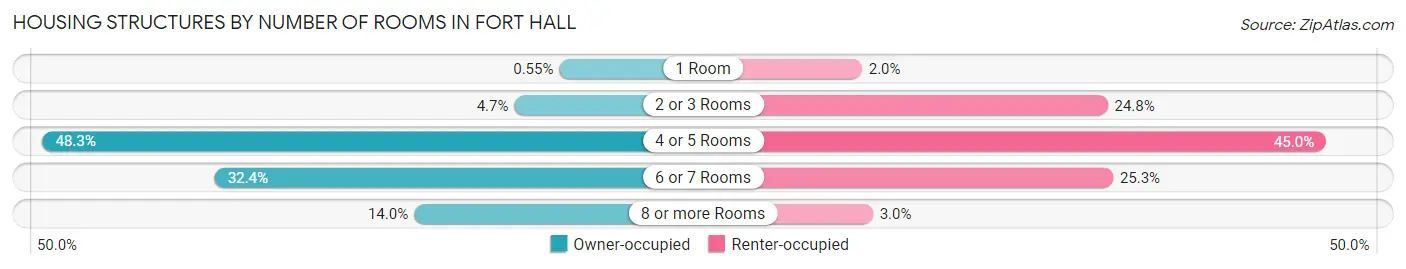
| Number of Rooms | Owner-occupied | Renter-occupied |
| 1 Room | 4 (0.5%) | 4 (2.0%) |
| 2 or 3 Rooms | 34 (4.7%) | 49 (24.7%) |
| 4 or 5 Rooms | 349 (48.3%) | 89 (45.0%) |
| 6 or 7 Rooms | 234 (32.4%) | 50 (25.3%) |
| 8 or more Rooms | 101 (14.0%) | 6 (3.0%) |
| Total | 722 (100.0%) | 198 (100.0%) |
Housing Structure by Heating Type in Fort Hall
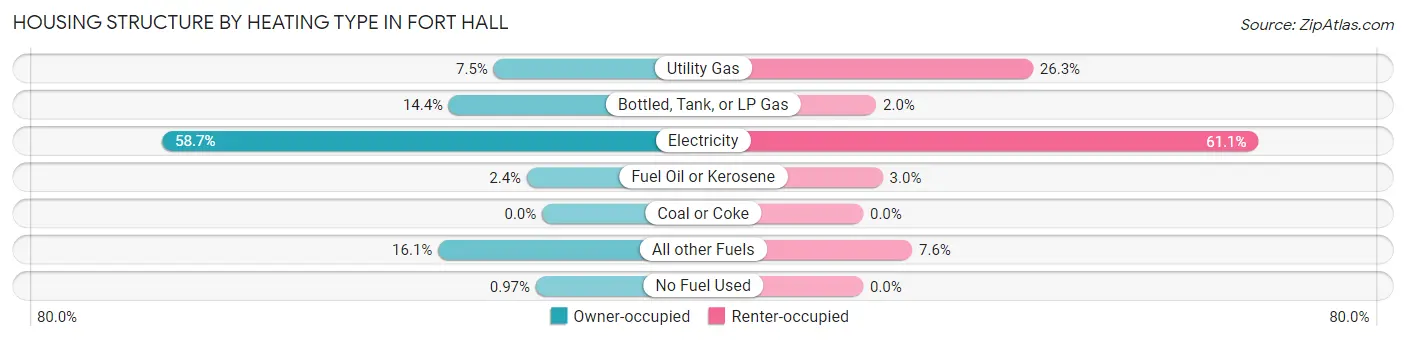
| Heating Type | Owner-occupied | Renter-occupied |
| Utility Gas | 54 (7.5%) | 52 (26.3%) |
| Bottled, Tank, or LP Gas | 104 (14.4%) | 4 (2.0%) |
| Electricity | 424 (58.7%) | 121 (61.1%) |
| Fuel Oil or Kerosene | 17 (2.4%) | 6 (3.0%) |
| Coal or Coke | 0 (0.0%) | 0 (0.0%) |
| All other Fuels | 116 (16.1%) | 15 (7.6%) |
| No Fuel Used | 7 (1.0%) | 0 (0.0%) |
| Total | 722 (100.0%) | 198 (100.0%) |
Household Vehicle Usage in Fort Hall
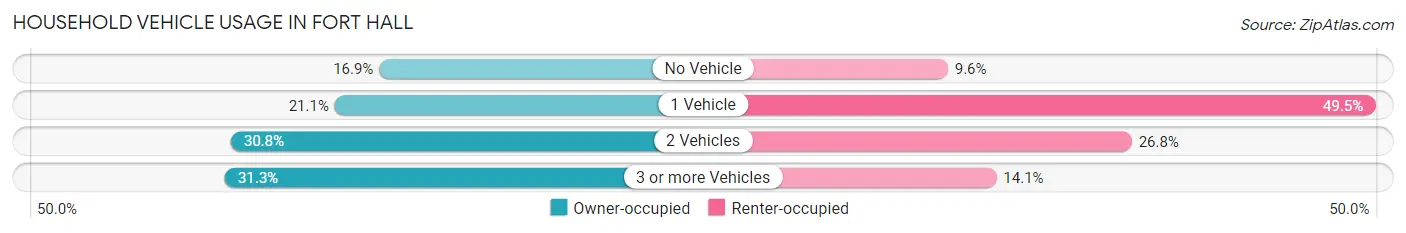
| Vehicles per Household | Owner-occupied | Renter-occupied |
| No Vehicle | 122 (16.9%) | 19 (9.6%) |
| 1 Vehicle | 152 (21.0%) | 98 (49.5%) |
| 2 Vehicles | 222 (30.7%) | 53 (26.8%) |
| 3 or more Vehicles | 226 (31.3%) | 28 (14.1%) |
| Total | 722 (100.0%) | 198 (100.0%) |
Real Estate & Mortgages in Fort Hall
Real Estate and Mortgage Overview in Fort Hall
| Characteristic | Without Mortgage | With Mortgage |
| Housing Units | 527 | 195 |
| Median Property Value | $142,800 | $244,600 |
| Median Household Income | $33,882 | $43 |
| Monthly Housing Costs | $279 | $0 |
| Real Estate Taxes | $956 | $73 |
Property Value by Mortgage Status in Fort Hall
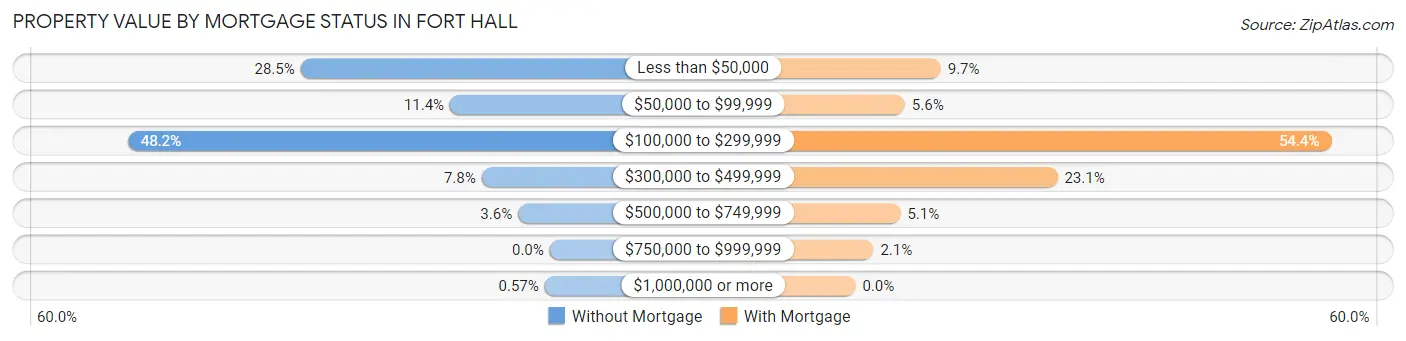
| Property Value | Without Mortgage | With Mortgage |
| Less than $50,000 | 150 (28.5%) | 19 (9.7%) |
| $50,000 to $99,999 | 60 (11.4%) | 11 (5.6%) |
| $100,000 to $299,999 | 254 (48.2%) | 106 (54.4%) |
| $300,000 to $499,999 | 41 (7.8%) | 45 (23.1%) |
| $500,000 to $749,999 | 19 (3.6%) | 10 (5.1%) |
| $750,000 to $999,999 | 0 (0.0%) | 4 (2.1%) |
| $1,000,000 or more | 3 (0.6%) | 0 (0.0%) |
| Total | 527 (100.0%) | 195 (100.0%) |
Household Income by Mortgage Status in Fort Hall
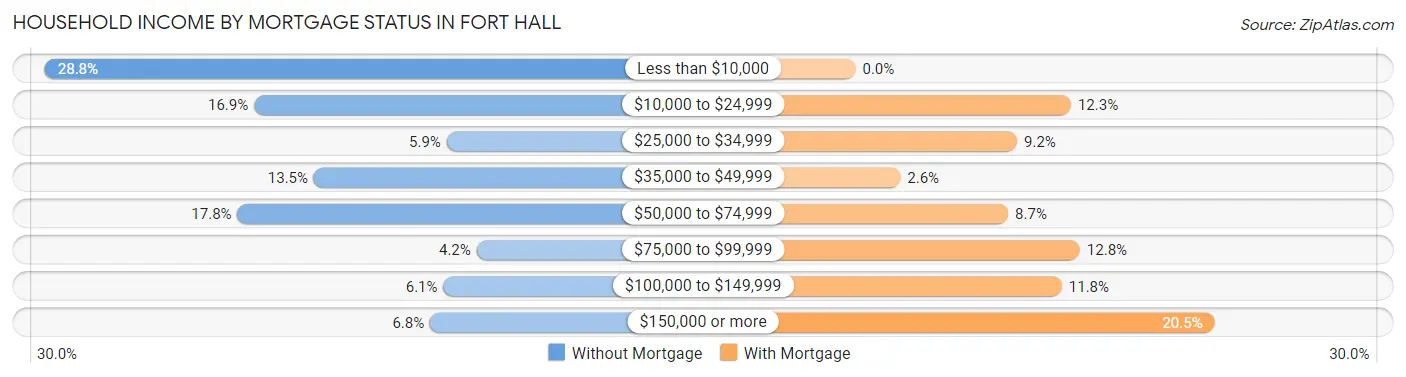
| Household Income | Without Mortgage | With Mortgage |
| Less than $10,000 | 152 (28.8%) | 0 (0.0%) |
| $10,000 to $24,999 | 89 (16.9%) | 24 (12.3%) |
| $25,000 to $34,999 | 31 (5.9%) | 18 (9.2%) |
| $35,000 to $49,999 | 71 (13.5%) | 5 (2.6%) |
| $50,000 to $74,999 | 94 (17.8%) | 17 (8.7%) |
| $75,000 to $99,999 | 22 (4.2%) | 25 (12.8%) |
| $100,000 to $149,999 | 32 (6.1%) | 23 (11.8%) |
| $150,000 or more | 36 (6.8%) | 40 (20.5%) |
| Total | 527 (100.0%) | 195 (100.0%) |
Property Value to Household Income Ratio in Fort Hall
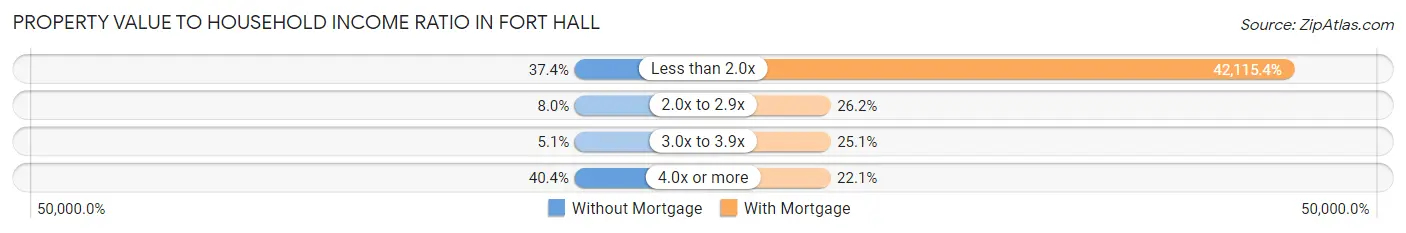
| Value-to-Income Ratio | Without Mortgage | With Mortgage |
| Less than 2.0x | 197 (37.4%) | 82,125 (42,115.4%) |
| 2.0x to 2.9x | 42 (8.0%) | 51 (26.2%) |
| 3.0x to 3.9x | 27 (5.1%) | 49 (25.1%) |
| 4.0x or more | 213 (40.4%) | 43 (22.1%) |
| Total | 527 (100.0%) | 195 (100.0%) |
Real Estate Taxes by Mortgage Status in Fort Hall
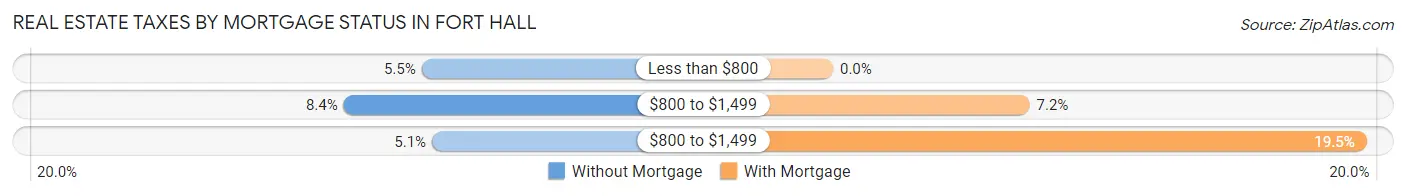
| Property Taxes | Without Mortgage | With Mortgage |
| Less than $800 | 29 (5.5%) | 0 (0.0%) |
| $800 to $1,499 | 44 (8.4%) | 14 (7.2%) |
| $800 to $1,499 | 27 (5.1%) | 38 (19.5%) |
| Total | 527 (100.0%) | 195 (100.0%) |
Health & Disability in Fort Hall
Health Insurance Coverage by Age in Fort Hall
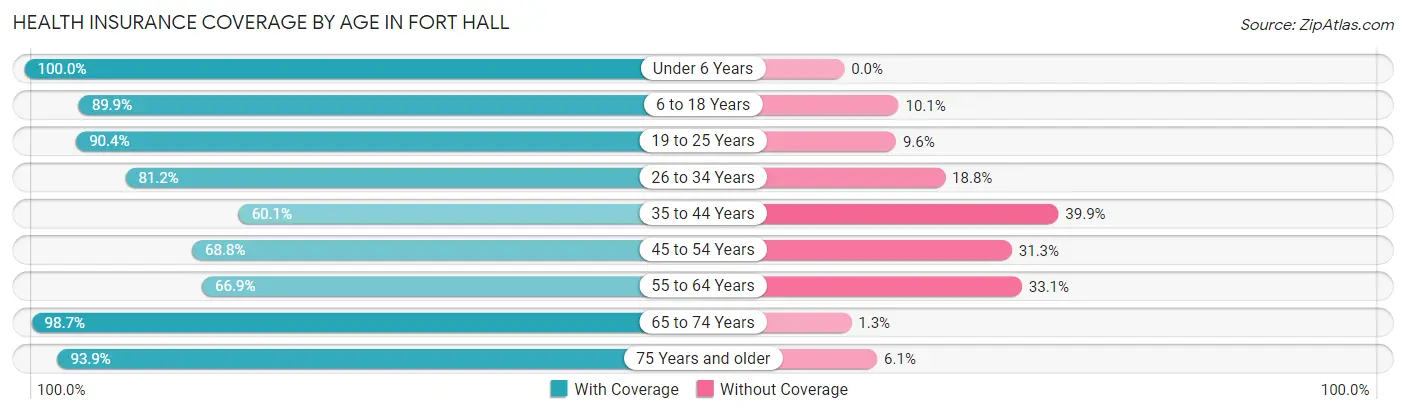
| Age Bracket | With Coverage | Without Coverage |
| Under 6 Years | 227 (100.0%) | 0 (0.0%) |
| 6 to 18 Years | 444 (89.9%) | 50 (10.1%) |
| 19 to 25 Years | 150 (90.4%) | 16 (9.6%) |
| 26 to 34 Years | 246 (81.2%) | 57 (18.8%) |
| 35 to 44 Years | 176 (60.1%) | 117 (39.9%) |
| 45 to 54 Years | 242 (68.8%) | 110 (31.2%) |
| 55 to 64 Years | 198 (66.9%) | 98 (33.1%) |
| 65 to 74 Years | 300 (98.7%) | 4 (1.3%) |
| 75 Years and older | 153 (93.9%) | 10 (6.1%) |
| Total | 2,136 (82.2%) | 462 (17.8%) |
Health Insurance Coverage by Citizenship Status in Fort Hall
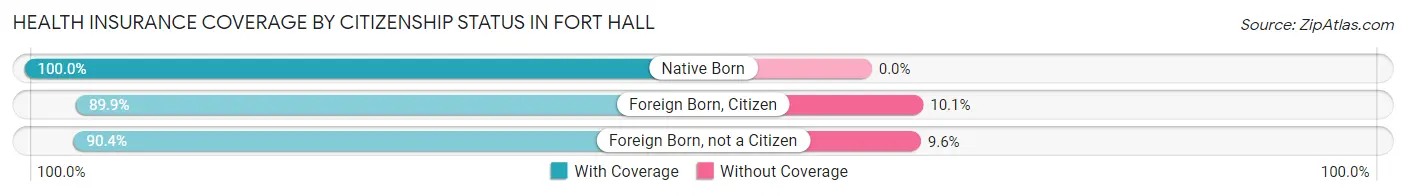
| Citizenship Status | With Coverage | Without Coverage |
| Native Born | 227 (100.0%) | 0 (0.0%) |
| Foreign Born, Citizen | 444 (89.9%) | 50 (10.1%) |
| Foreign Born, not a Citizen | 150 (90.4%) | 16 (9.6%) |
Health Insurance Coverage by Household Income in Fort Hall
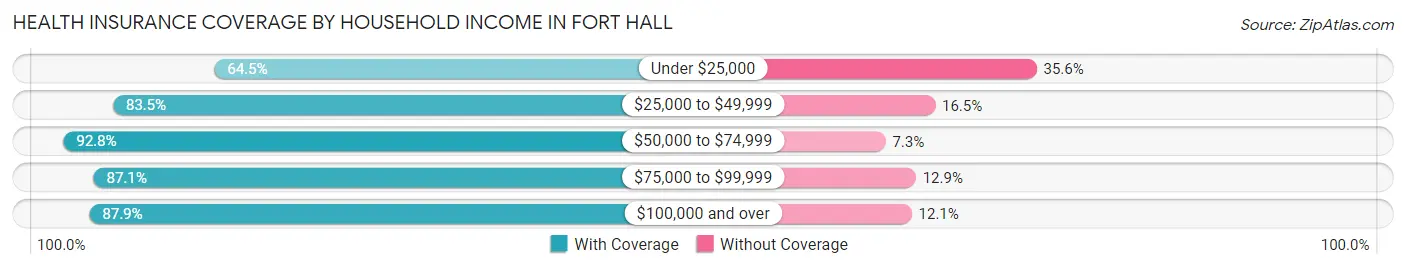
| Household Income | With Coverage | Without Coverage |
| Under $25,000 | 437 (64.4%) | 241 (35.5%) |
| $25,000 to $49,999 | 308 (83.5%) | 61 (16.5%) |
| $50,000 to $74,999 | 563 (92.7%) | 44 (7.2%) |
| $75,000 to $99,999 | 155 (87.1%) | 23 (12.9%) |
| $100,000 and over | 673 (87.9%) | 93 (12.1%) |
Public vs Private Health Insurance Coverage by Age in Fort Hall
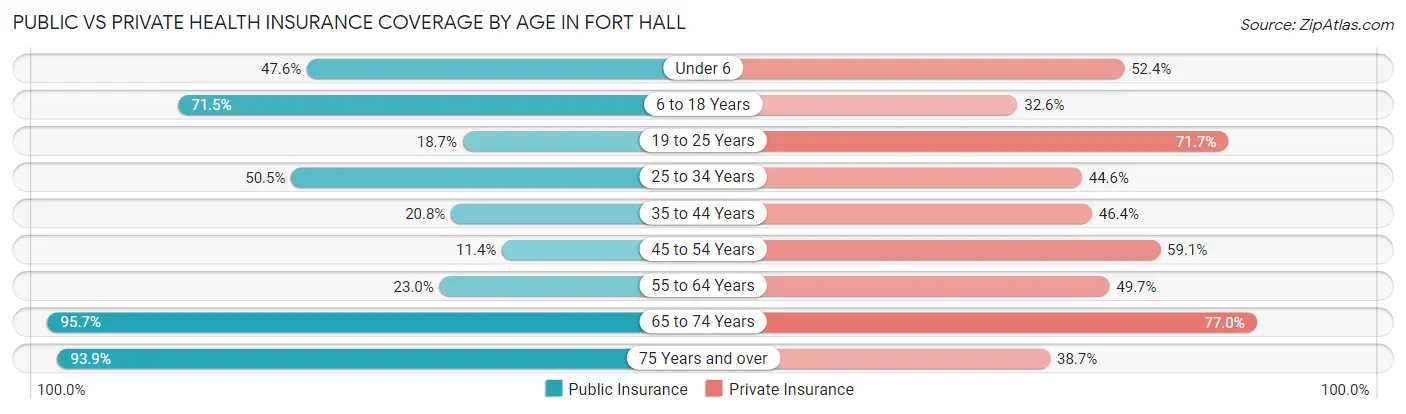
| Age Bracket | Public Insurance | Private Insurance |
| Under 6 | 108 (47.6%) | 119 (52.4%) |
| 6 to 18 Years | 353 (71.5%) | 161 (32.6%) |
| 19 to 25 Years | 31 (18.7%) | 119 (71.7%) |
| 25 to 34 Years | 153 (50.5%) | 135 (44.6%) |
| 35 to 44 Years | 61 (20.8%) | 136 (46.4%) |
| 45 to 54 Years | 40 (11.4%) | 208 (59.1%) |
| 55 to 64 Years | 68 (23.0%) | 147 (49.7%) |
| 65 to 74 Years | 291 (95.7%) | 234 (77.0%) |
| 75 Years and over | 153 (93.9%) | 63 (38.7%) |
| Total | 1,258 (48.4%) | 1,322 (50.9%) |
Disability Status by Sex by Age in Fort Hall
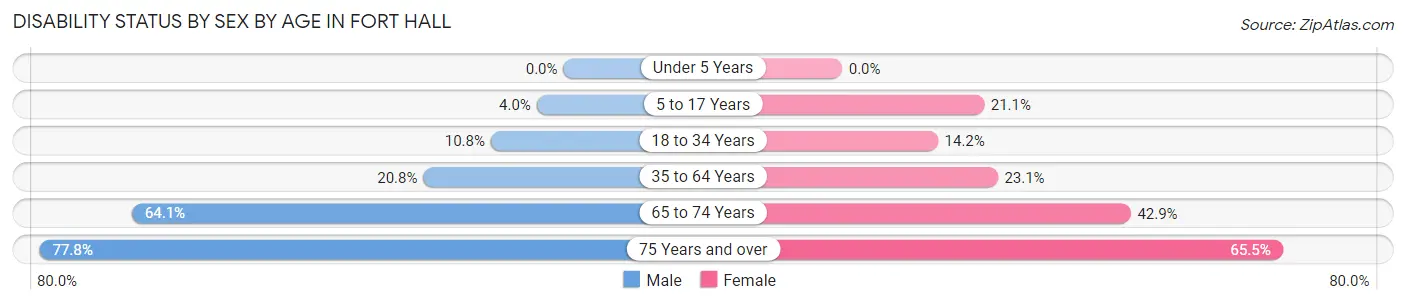
| Age Bracket | Male | Female |
| Under 5 Years | 0 (0.0%) | 0 (0.0%) |
| 5 to 17 Years | 11 (4.0%) | 62 (21.1%) |
| 18 to 34 Years | 25 (10.8%) | 36 (14.2%) |
| 35 to 64 Years | 94 (20.8%) | 113 (23.1%) |
| 65 to 74 Years | 123 (64.1%) | 48 (42.9%) |
| 75 Years and over | 84 (77.8%) | 36 (65.4%) |
Disability Class by Sex by Age in Fort Hall
Disability Class: Hearing Difficulty
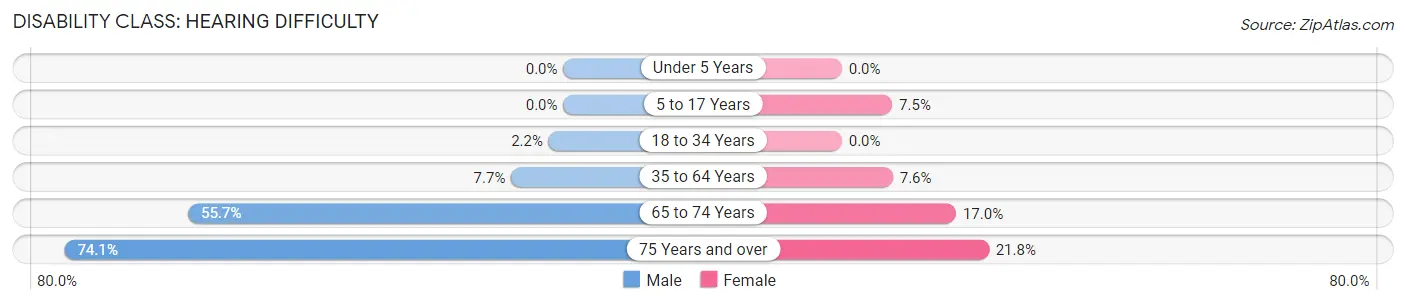
| Age Bracket | Male | Female |
| Under 5 Years | 0 (0.0%) | 0 (0.0%) |
| 5 to 17 Years | 0 (0.0%) | 22 (7.5%) |
| 18 to 34 Years | 5 (2.2%) | 0 (0.0%) |
| 35 to 64 Years | 35 (7.7%) | 37 (7.6%) |
| 65 to 74 Years | 107 (55.7%) | 19 (17.0%) |
| 75 Years and over | 80 (74.1%) | 12 (21.8%) |
Disability Class: Vision Difficulty
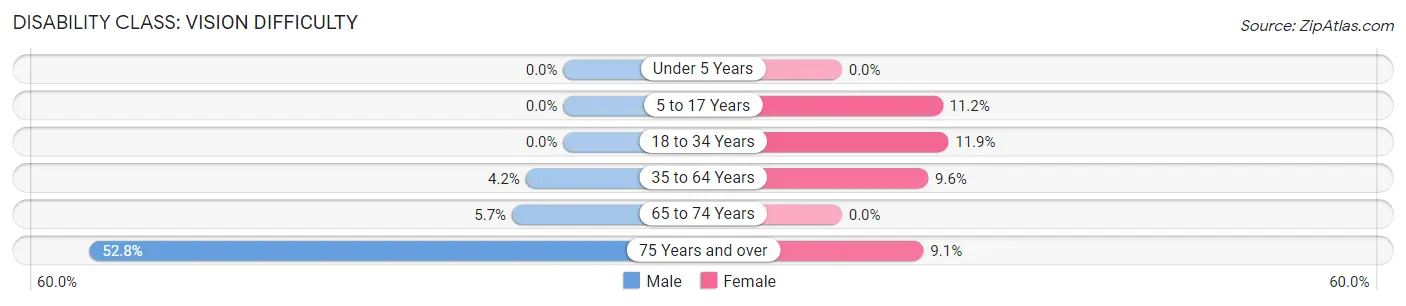
| Age Bracket | Male | Female |
| Under 5 Years | 0 (0.0%) | 0 (0.0%) |
| 5 to 17 Years | 0 (0.0%) | 33 (11.2%) |
| 18 to 34 Years | 0 (0.0%) | 30 (11.9%) |
| 35 to 64 Years | 19 (4.2%) | 47 (9.6%) |
| 65 to 74 Years | 11 (5.7%) | 0 (0.0%) |
| 75 Years and over | 57 (52.8%) | 5 (9.1%) |
Disability Class: Cognitive Difficulty
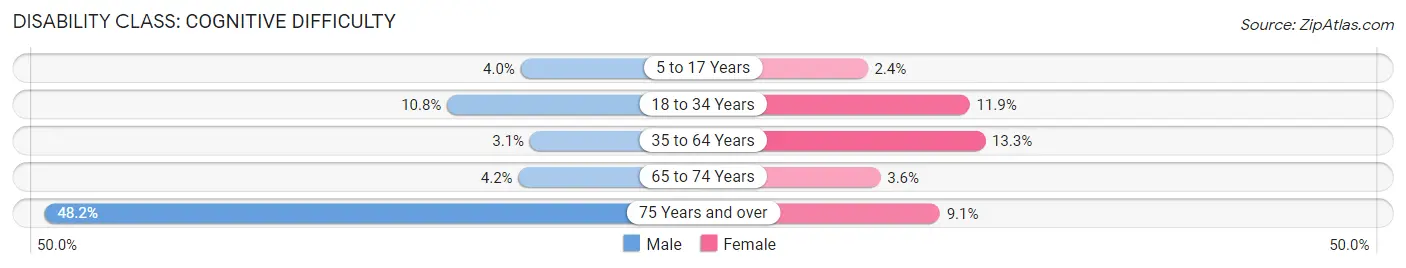
| Age Bracket | Male | Female |
| 5 to 17 Years | 11 (4.0%) | 7 (2.4%) |
| 18 to 34 Years | 25 (10.8%) | 30 (11.9%) |
| 35 to 64 Years | 14 (3.1%) | 65 (13.3%) |
| 65 to 74 Years | 8 (4.2%) | 4 (3.6%) |
| 75 Years and over | 52 (48.1%) | 5 (9.1%) |
Disability Class: Ambulatory Difficulty
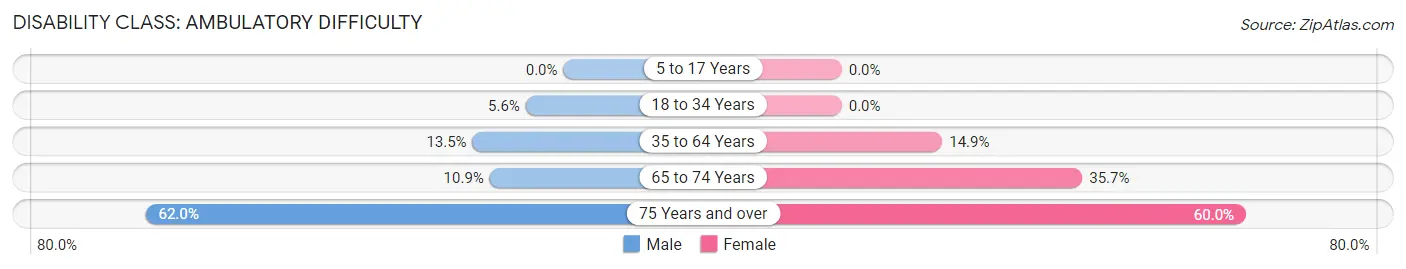
| Age Bracket | Male | Female |
| 5 to 17 Years | 0 (0.0%) | 0 (0.0%) |
| 18 to 34 Years | 13 (5.6%) | 0 (0.0%) |
| 35 to 64 Years | 61 (13.5%) | 73 (14.9%) |
| 65 to 74 Years | 21 (10.9%) | 40 (35.7%) |
| 75 Years and over | 67 (62.0%) | 33 (60.0%) |
Disability Class: Self-Care Difficulty
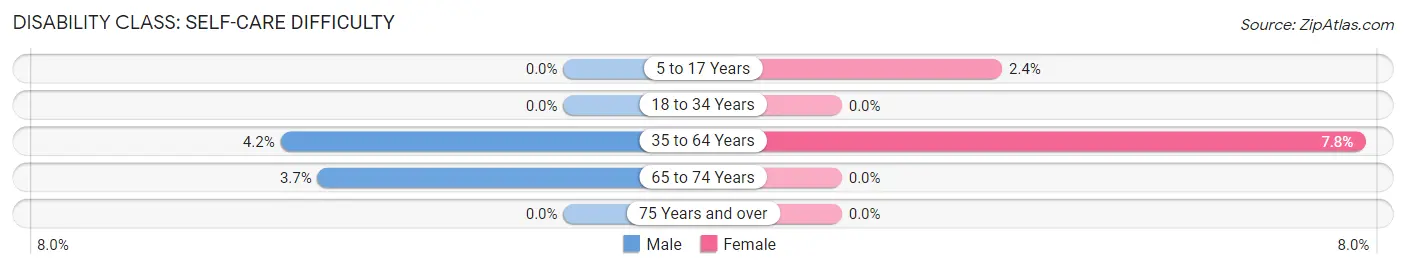
| Age Bracket | Male | Female |
| 5 to 17 Years | 0 (0.0%) | 7 (2.4%) |
| 18 to 34 Years | 0 (0.0%) | 0 (0.0%) |
| 35 to 64 Years | 19 (4.2%) | 38 (7.8%) |
| 65 to 74 Years | 7 (3.6%) | 0 (0.0%) |
| 75 Years and over | 0 (0.0%) | 0 (0.0%) |
Technology Access in Fort Hall
Computing Device Access in Fort Hall
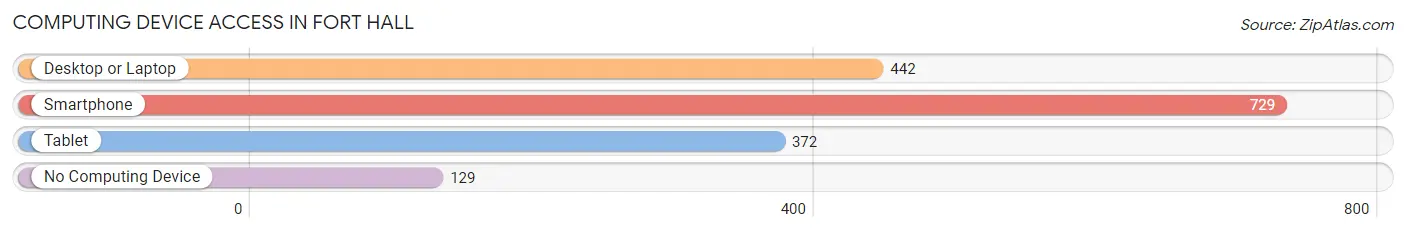
| Device Type | # Households | % Households |
| Desktop or Laptop | 442 | 48.0% |
| Smartphone | 729 | 79.2% |
| Tablet | 372 | 40.4% |
| No Computing Device | 129 | 14.0% |
| Total | 920 | 100.0% |
Internet Access in Fort Hall
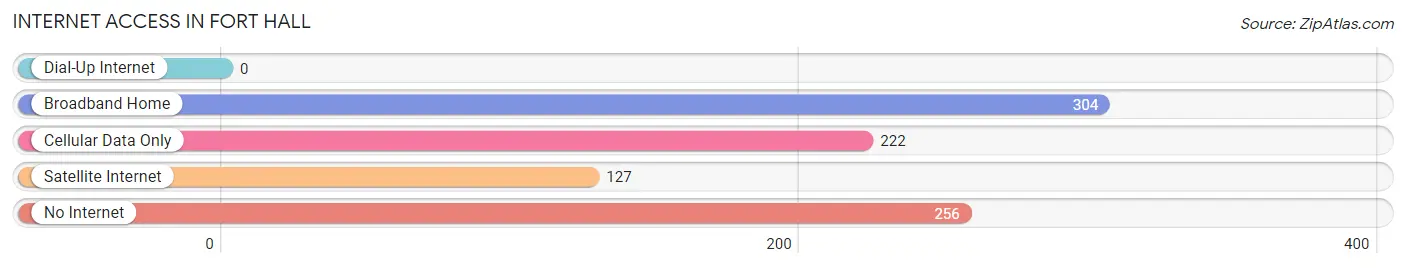
| Internet Type | # Households | % Households |
| Dial-Up Internet | 0 | 0.0% |
| Broadband Home | 304 | 33.0% |
| Cellular Data Only | 222 | 24.1% |
| Satellite Internet | 127 | 13.8% |
| No Internet | 256 | 27.8% |
| Total | 920 | 100.0% |
Fort Hall Summary
Fort Hall is a small city located in the southeastern corner of the state of Idaho, United States. It is situated in the Snake River Plain, a region of the Great Basin, and is part of the Pocatello metropolitan area. The city is located on the Fort Hall Indian Reservation, which is home to the Shoshone-Bannock Tribes. The city was named after the nearby Fort Hall, a trading post established by the Hudson's Bay Company in 1834.
History
The area that is now Fort Hall was originally inhabited by the Shoshone-Bannock Tribes, who had lived in the region for thousands of years. The first Europeans to visit the area were members of the Lewis and Clark Expedition, who arrived in 1805. In 1834, the Hudson's Bay Company established a trading post in the area, which was named Fort Hall. The post was used to trade with the local tribes, and it became an important hub for the fur trade in the region.
In 1868, the United States government signed a treaty with the Shoshone-Bannock Tribes, which established the Fort Hall Indian Reservation. The reservation was established to provide a permanent home for the tribes, and it was also used to protect their traditional lands. The city of Fort Hall was established in 1878, and it quickly became an important trading center for the reservation.
Geography
Fort Hall is located in the southeastern corner of the state of Idaho, in the Snake River Plain region of the Great Basin. The city is situated at an elevation of 4,717 feet (1,437 m) above sea level. The city is located on the Fort Hall Indian Reservation, which covers an area of 1,845 square miles (4,788 km2). The reservation is bordered by the Snake River to the west, the Portneuf River to the north, and the Blackfoot River to the east.
The city of Fort Hall is located at the intersection of Interstate 15 and U.S. Route 91. The city is located approximately 20 miles (32 km) south of Pocatello, the largest city in the region. The city is also located approximately 50 miles (80 km) north of the Idaho-Utah border.
Economy
The economy of Fort Hall is largely based on the Fort Hall Indian Reservation. The reservation is home to the Shoshone-Bannock Tribes, and it is the largest employer in the city. The reservation is home to several businesses, including a casino, a hotel, and a golf course. The reservation also has a large agricultural sector, and it is home to several farms and ranches.
The city of Fort Hall is also home to several businesses, including a grocery store, a gas station, and several restaurants. The city is also home to a branch of the Idaho State University, which offers a variety of degree programs.
Demographics
As of the 2010 census, the city of Fort Hall had a population of 1,945. The population of the city is predominantly Native American, with the Shoshone-Bannock Tribes making up the majority of the population. The city also has a small Hispanic population, as well as a small population of African Americans. The median household income in the city is $30,000, and the median home value is $90,000.
Common Questions
What is Per Capita Income in Fort Hall?
Per Capita income in Fort Hall is $21,978.
What is the Median Family Income in Fort Hall?
Median Family Income in Fort Hall is $49,050.
What is the Median Household income in Fort Hall?
Median Household Income in Fort Hall is $37,786.
What is Income or Wage Gap in Fort Hall?
Income or Wage Gap in Fort Hall is 34.3%.
Women in Fort Hall earn 65.7 cents for every dollar earned by a man.
What is Inequality or Gini Index in Fort Hall?
Inequality or Gini Index in Fort Hall is 0.52.
What is the Total Population of Fort Hall?
Total Population of Fort Hall is 2,608.
What is the Total Male Population of Fort Hall?
Total Male Population of Fort Hall is 1,357.
What is the Total Female Population of Fort Hall?
Total Female Population of Fort Hall is 1,251.
What is the Ratio of Males per 100 Females in Fort Hall?
There are 108.47 Males per 100 Females in Fort Hall.
What is the Ratio of Females per 100 Males in Fort Hall?
There are 92.19 Females per 100 Males in Fort Hall.
What is the Median Population Age in Fort Hall?
Median Population Age in Fort Hall is 36.8 Years.
What is the Average Family Size in Fort Hall
Average Family Size in Fort Hall is 3.7 People.
What is the Average Household Size in Fort Hall
Average Household Size in Fort Hall is 2.8 People.
How Large is the Labor Force in Fort Hall?
There are 1,117 People in the Labor Forcein in Fort Hall.
What is the Percentage of People in the Labor Force in Fort Hall?
55.5% of People are in the Labor Force in Fort Hall.
What is the Unemployment Rate in Fort Hall?
Unemployment Rate in Fort Hall is 12.3%.