Challis, ID Map & Demographics
Challis Map
Challis Overview
$22,174
PER CAPITA INCOME
$61,875
AVG FAMILY INCOME
$35,921
AVG HOUSEHOLD INCOME
17.2%
WAGE / INCOME GAP [ % ]
82.8¢/ $1
WAGE / INCOME GAP [ $ ]
0.41
INEQUALITY / GINI INDEX
840
TOTAL POPULATION
442
MALE POPULATION
398
FEMALE POPULATION
111.06
MALES / 100 FEMALES
90.05
FEMALES / 100 MALES
38.5
MEDIAN AGE
3.6
AVG FAMILY SIZE
2.3
AVG HOUSEHOLD SIZE
373
LABOR FORCE [ PEOPLE ]
58.8%
PERCENT IN LABOR FORCE
1.3%
UNEMPLOYMENT RATE
Challis Zip Codes
Challis Area Codes
Income in Challis
Income Overview in Challis
Per Capita Income in Challis is $22,174, while median incomes of families and households are $61,875 and $35,921 respectively.
| Characteristic | Number | Measure |
| Per Capita Income | 840 | $22,174 |
| Median Family Income | 162 | $61,875 |
| Mean Family Income | 162 | $61,134 |
| Median Household Income | 348 | $35,921 |
| Mean Household Income | 348 | $47,082 |
| Income Deficit | 162 | $0 |
| Wage / Income Gap (%) | 840 | 17.24% |
| Wage / Income Gap ($) | 840 | 82.76¢ per $1 |
| Gini / Inequality Index | 840 | 0.41 |
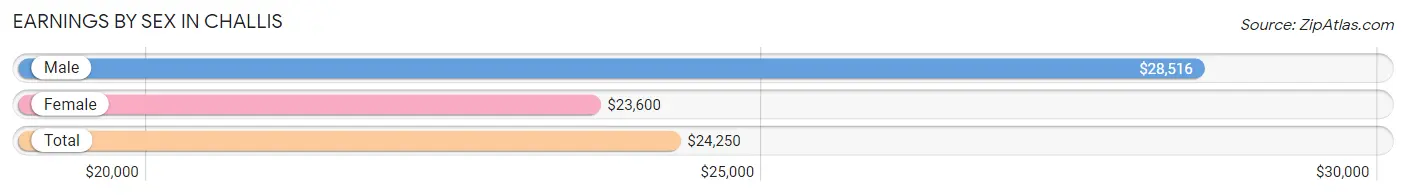
Earnings by Sex in Challis
Average Earnings in Challis are $24,250, $28,516 for men and $23,600 for women, a difference of 17.2%.
| Sex | Number | Average Earnings |
| Male | 177 (43.1%) | $28,516 |
| Female | 234 (56.9%) | $23,600 |
| Total | 411 (100.0%) | $24,250 |
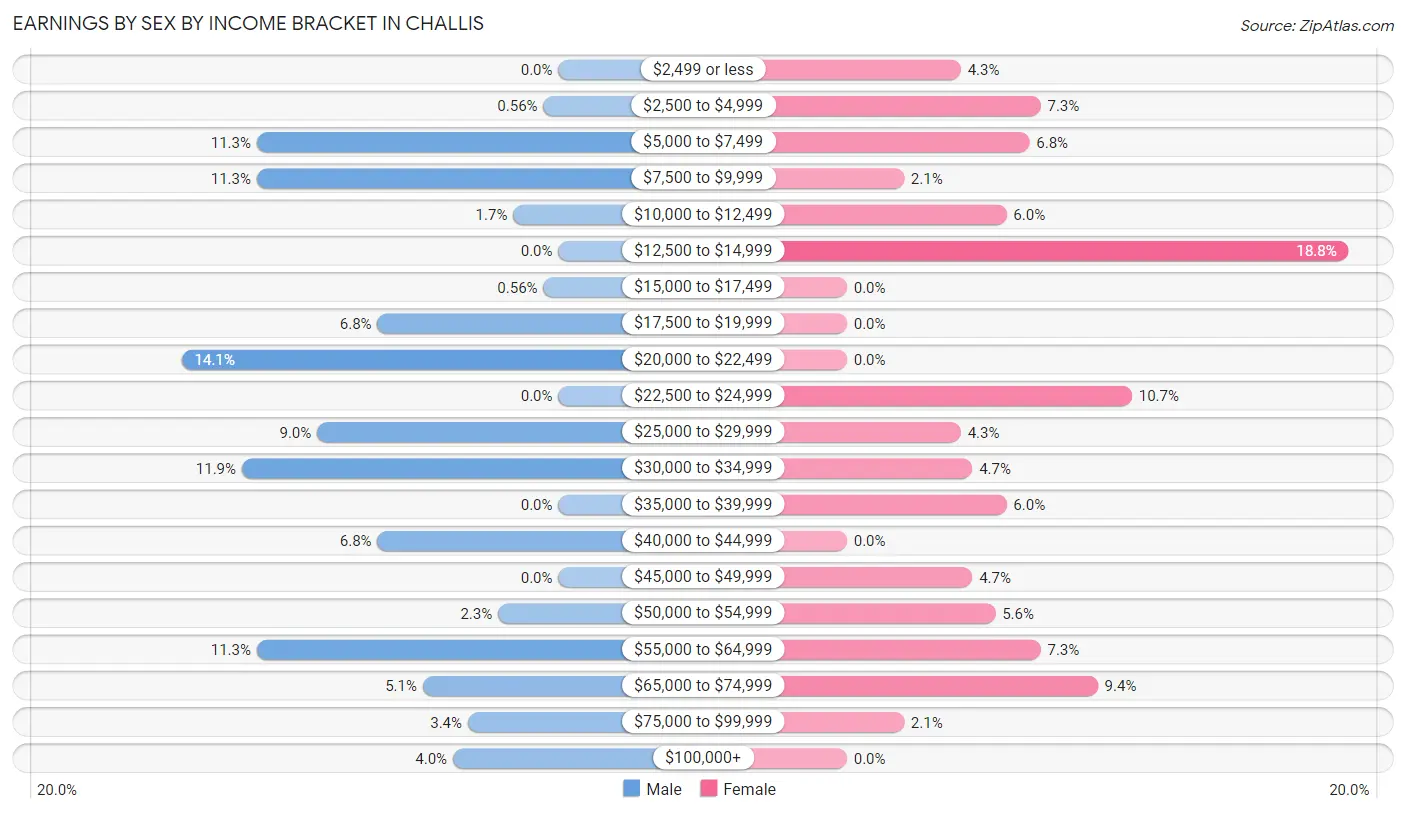
Earnings by Sex by Income Bracket in Challis
The most common earnings brackets in Challis are $20,000 to $22,499 for men (25 | 14.1%) and $12,500 to $14,999 for women (44 | 18.8%).
| Income | Male | Female |
| $2,499 or less | 0 (0.0%) | 10 (4.3%) |
| $2,500 to $4,999 | 1 (0.6%) | 17 (7.3%) |
| $5,000 to $7,499 | 20 (11.3%) | 16 (6.8%) |
| $7,500 to $9,999 | 20 (11.3%) | 5 (2.1%) |
| $10,000 to $12,499 | 3 (1.7%) | 14 (6.0%) |
| $12,500 to $14,999 | 0 (0.0%) | 44 (18.8%) |
| $15,000 to $17,499 | 1 (0.6%) | 0 (0.0%) |
| $17,500 to $19,999 | 12 (6.8%) | 0 (0.0%) |
| $20,000 to $22,499 | 25 (14.1%) | 0 (0.0%) |
| $22,500 to $24,999 | 0 (0.0%) | 25 (10.7%) |
| $25,000 to $29,999 | 16 (9.0%) | 10 (4.3%) |
| $30,000 to $34,999 | 21 (11.9%) | 11 (4.7%) |
| $35,000 to $39,999 | 0 (0.0%) | 14 (6.0%) |
| $40,000 to $44,999 | 12 (6.8%) | 0 (0.0%) |
| $45,000 to $49,999 | 0 (0.0%) | 11 (4.7%) |
| $50,000 to $54,999 | 4 (2.3%) | 13 (5.6%) |
| $55,000 to $64,999 | 20 (11.3%) | 17 (7.3%) |
| $65,000 to $74,999 | 9 (5.1%) | 22 (9.4%) |
| $75,000 to $99,999 | 6 (3.4%) | 5 (2.1%) |
| $100,000+ | 7 (4.0%) | 0 (0.0%) |
| Total | 177 (100.0%) | 234 (100.0%) |
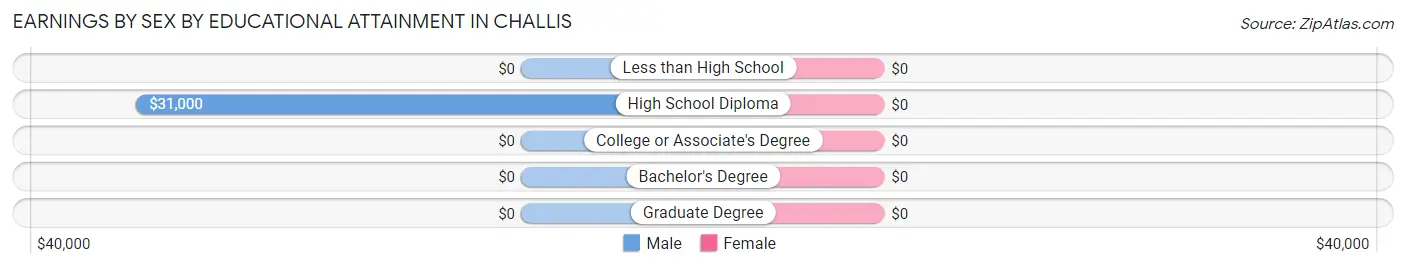
Earnings by Sex by Educational Attainment in Challis
| Educational Attainment | Male Income | Female Income |
| Less than High School | - | - |
| High School Diploma | $31,000 | $0 |
| College or Associate's Degree | - | - |
| Bachelor's Degree | - | - |
| Graduate Degree | - | - |
| Total | $29,922 | $24,306 |
Family Income in Challis
Family Income Brackets in Challis
According to the Challis family income data, there are 49 families falling into the $50,000 to $74,999 income range, which is the most common income bracket and makes up 30.2% of all families.
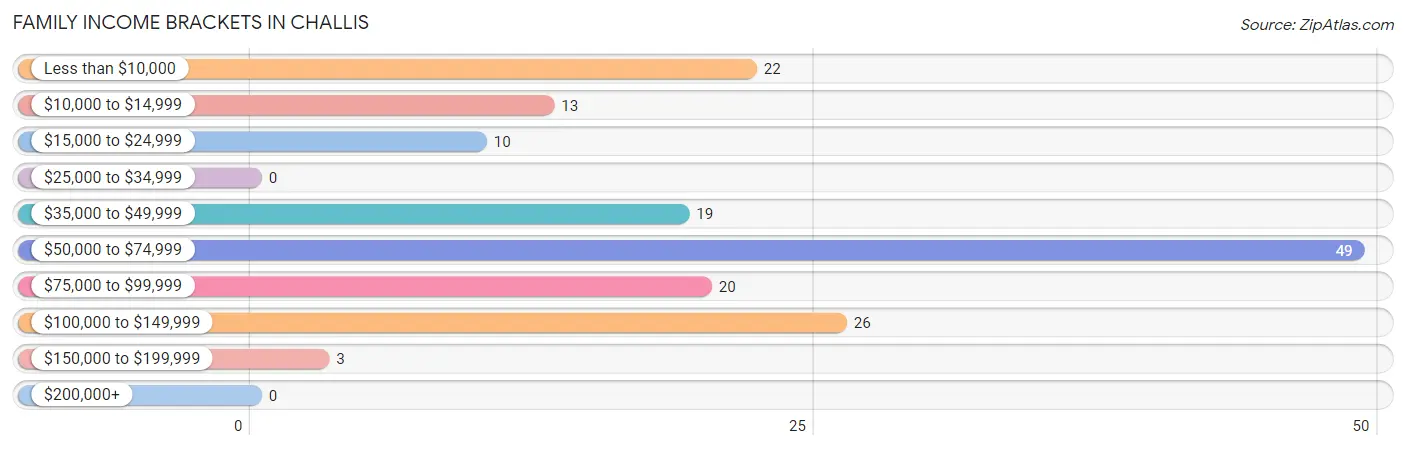
| Income Bracket | # Families | % Families |
| Less than $10,000 | 22 | 13.6% |
| $10,000 to $14,999 | 13 | 8.0% |
| $15,000 to $24,999 | 10 | 6.2% |
| $25,000 to $34,999 | 0 | 0.0% |
| $35,000 to $49,999 | 19 | 11.7% |
| $50,000 to $74,999 | 49 | 30.2% |
| $75,000 to $99,999 | 20 | 12.3% |
| $100,000 to $149,999 | 26 | 16.0% |
| $150,000 to $199,999 | 3 | 1.9% |
| $200,000+ | 0 | 0.0% |
Family Income by Famaliy Size in Challis
5-person families (21 | 13.0%) account for the highest median family income in Challis with $102,250 per family, while 3-person families (30 | 18.5%) have the highest median income of $29,444 per family member.
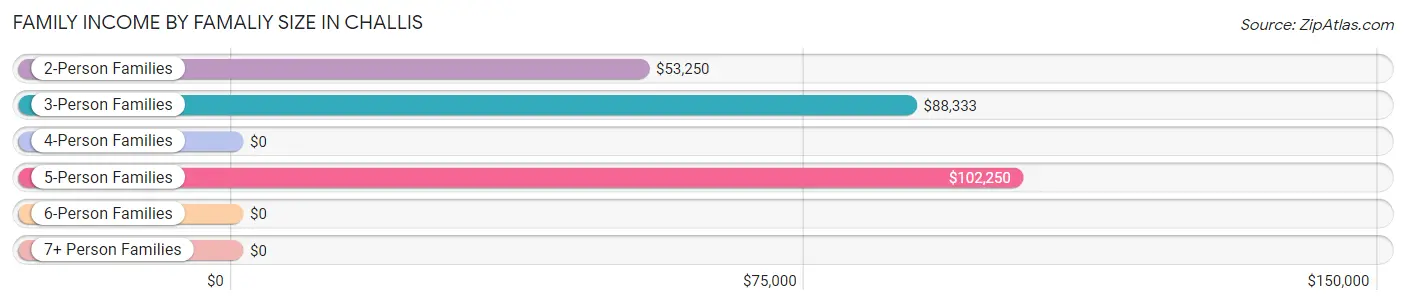
| Income Bracket | # Families | Median Income |
| 2-Person Families | 75 (46.3%) | $53,250 |
| 3-Person Families | 30 (18.5%) | $88,333 |
| 4-Person Families | 36 (22.2%) | $0 |
| 5-Person Families | 21 (13.0%) | $102,250 |
| 6-Person Families | 0 (0.0%) | $0 |
| 7+ Person Families | 0 (0.0%) | $0 |
| Total | 162 (100.0%) | $61,875 |
Family Income by Number of Earners in Challis
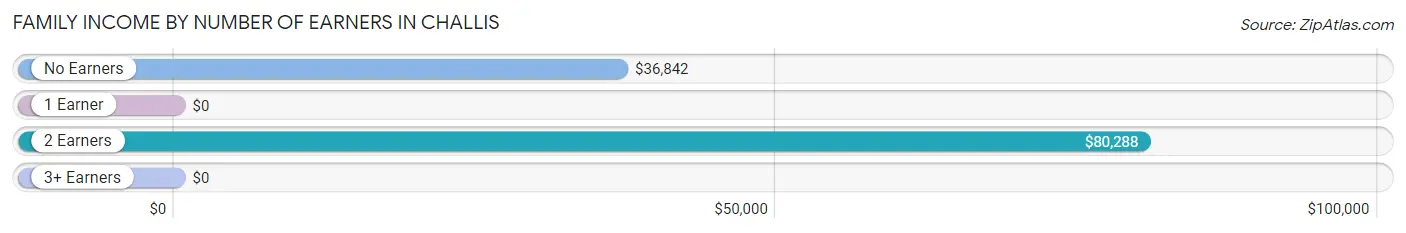
| Number of Earners | # Families | Median Income |
| No Earners | 38 (23.5%) | $36,842 |
| 1 Earner | 43 (26.5%) | $0 |
| 2 Earners | 81 (50.0%) | $80,288 |
| 3+ Earners | 0 (0.0%) | $0 |
| Total | 162 (100.0%) | $61,875 |
Household Income in Challis
Household Income Brackets in Challis
With 75 households falling in the category, the $50,000 to $74,999 income range is the most frequent in Challis, accounting for 21.5% of all households.
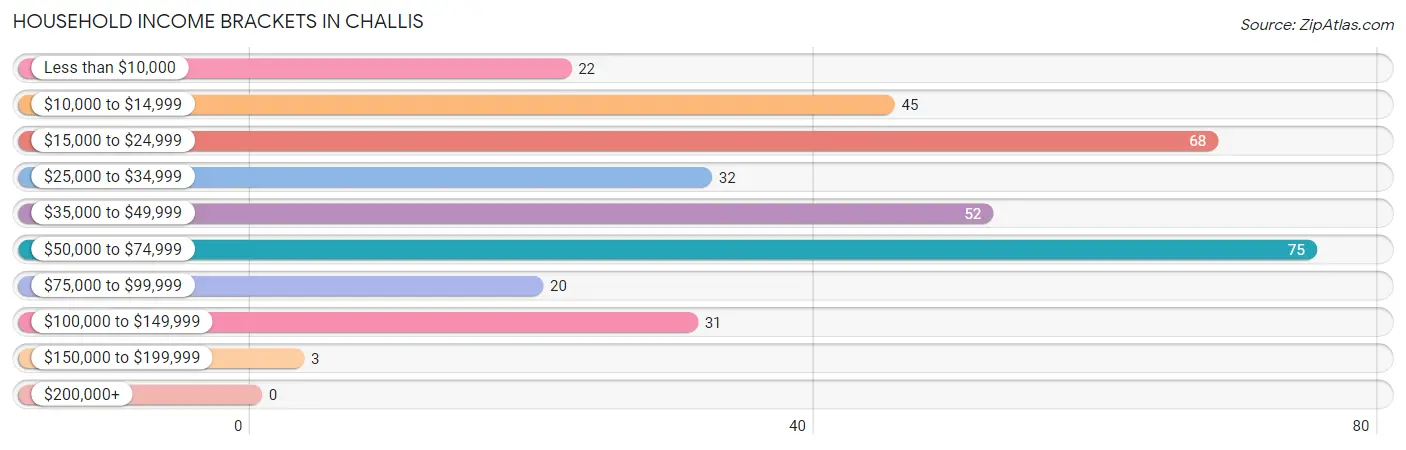
| Income Bracket | # Households | % Households |
| Less than $10,000 | 22 | 6.3% |
| $10,000 to $14,999 | 45 | 12.9% |
| $15,000 to $24,999 | 68 | 19.5% |
| $25,000 to $34,999 | 32 | 9.2% |
| $35,000 to $49,999 | 52 | 14.9% |
| $50,000 to $74,999 | 75 | 21.6% |
| $75,000 to $99,999 | 20 | 5.7% |
| $100,000 to $149,999 | 31 | 8.9% |
| $150,000 to $199,999 | 3 | 0.9% |
| $200,000+ | 0 | 0.0% |
Household Income by Householder Age in Challis
The median household income in Challis is $35,921, with the highest median household income of $54,167 found in the 25 to 44 years age bracket for the primary householder. A total of 110 households (31.6%) fall into this category. Meanwhile, the 15 to 24 years age bracket for the primary householder has the lowest median household income of $0, with 23 households (6.6%) in this group.
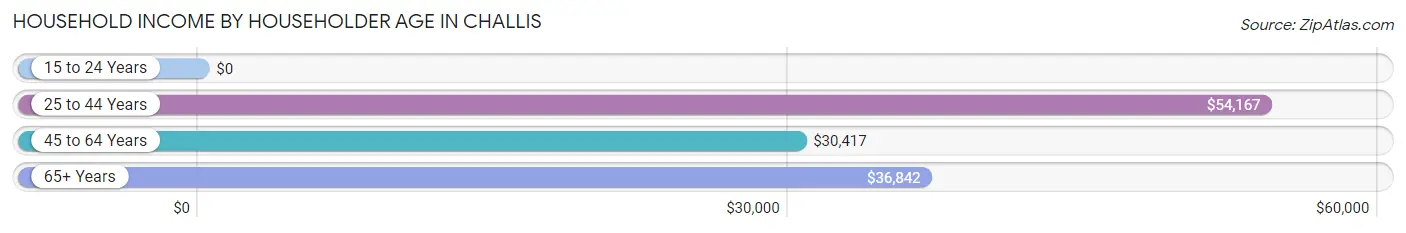
| Income Bracket | # Households | Median Income |
| 15 to 24 Years | 23 (6.6%) | $0 |
| 25 to 44 Years | 110 (31.6%) | $54,167 |
| 45 to 64 Years | 159 (45.7%) | $30,417 |
| 65+ Years | 56 (16.1%) | $36,842 |
| Total | 348 (100.0%) | $35,921 |
Poverty in Challis
Income Below Poverty by Sex and Age in Challis
With 25.5% poverty level for males and 32.2% for females among the residents of Challis, 18 to 24 year old males and 16 and 17 year old females are the most vulnerable to poverty, with 18 males (100.0%) and 18 females (100.0%) in their respective age groups living below the poverty level.
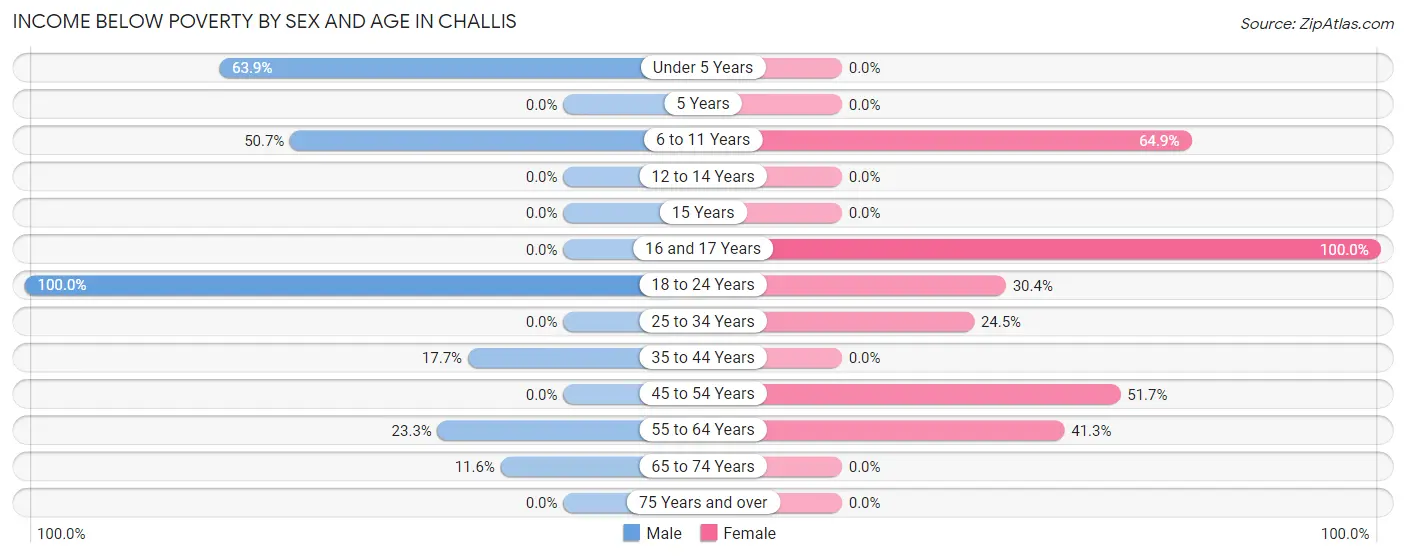
| Age Bracket | Male | Female |
| Under 5 Years | 23 (63.9%) | 0 (0.0%) |
| 5 Years | 0 (0.0%) | 0 (0.0%) |
| 6 to 11 Years | 36 (50.7%) | 24 (64.9%) |
| 12 to 14 Years | 0 (0.0%) | 0 (0.0%) |
| 15 Years | 0 (0.0%) | 0 (0.0%) |
| 16 and 17 Years | 0 (0.0%) | 18 (100.0%) |
| 18 to 24 Years | 18 (100.0%) | 7 (30.4%) |
| 25 to 34 Years | 0 (0.0%) | 13 (24.5%) |
| 35 to 44 Years | 14 (17.7%) | 0 (0.0%) |
| 45 to 54 Years | 0 (0.0%) | 46 (51.7%) |
| 55 to 64 Years | 14 (23.3%) | 19 (41.3%) |
| 65 to 74 Years | 5 (11.6%) | 0 (0.0%) |
| 75 Years and over | 0 (0.0%) | 0 (0.0%) |
| Total | 110 (25.5%) | 127 (32.2%) |
Income Above Poverty by Sex and Age in Challis
According to the poverty statistics in Challis, males aged 12 to 14 years and females aged under 5 years are the age groups that are most secure financially, with 100.0% of males and 100.0% of females in these age groups living above the poverty line.
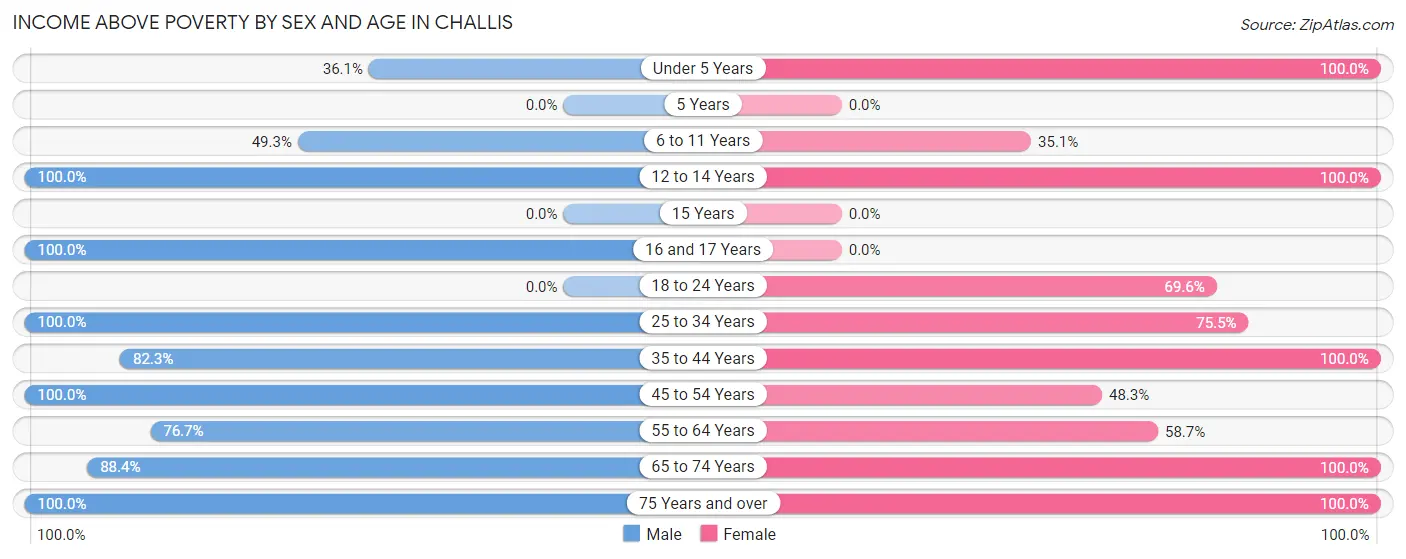
| Age Bracket | Male | Female |
| Under 5 Years | 13 (36.1%) | 27 (100.0%) |
| 5 Years | 0 (0.0%) | 0 (0.0%) |
| 6 to 11 Years | 35 (49.3%) | 13 (35.1%) |
| 12 to 14 Years | 27 (100.0%) | 8 (100.0%) |
| 15 Years | 0 (0.0%) | 0 (0.0%) |
| 16 and 17 Years | 23 (100.0%) | 0 (0.0%) |
| 18 to 24 Years | 0 (0.0%) | 16 (69.6%) |
| 25 to 34 Years | 20 (100.0%) | 40 (75.5%) |
| 35 to 44 Years | 65 (82.3%) | 43 (100.0%) |
| 45 to 54 Years | 43 (100.0%) | 43 (48.3%) |
| 55 to 64 Years | 46 (76.7%) | 27 (58.7%) |
| 65 to 74 Years | 38 (88.4%) | 41 (100.0%) |
| 75 Years and over | 11 (100.0%) | 9 (100.0%) |
| Total | 321 (74.5%) | 267 (67.8%) |
Income Below Poverty Among Married-Couple Families in Challis
The poverty statistics for married-couple families in Challis show that 18.8% or 27 of the total 144 families live below the poverty line. Families with 1 or 2 children have the highest poverty rate of 31.9%, comprising of 15 families. On the other hand, families with 3 or 4 children have the lowest poverty rate of 0.0%, which includes 0 families.
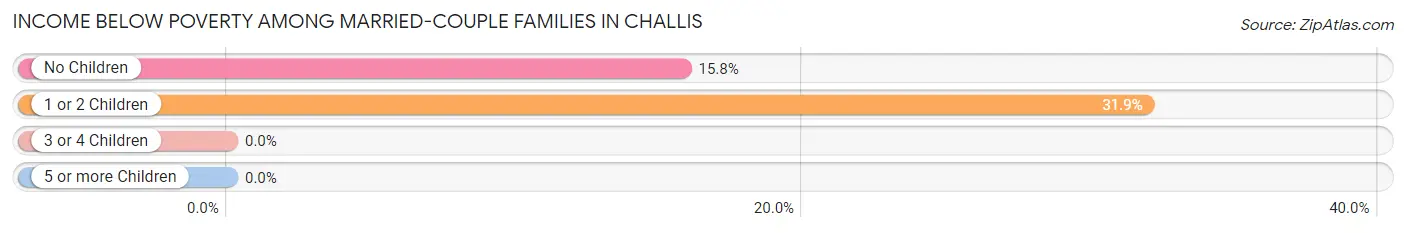
| Children | Above Poverty | Below Poverty |
| No Children | 64 (84.2%) | 12 (15.8%) |
| 1 or 2 Children | 32 (68.1%) | 15 (31.9%) |
| 3 or 4 Children | 21 (100.0%) | 0 (0.0%) |
| 5 or more Children | 0 (0.0%) | 0 (0.0%) |
| Total | 117 (81.2%) | 27 (18.8%) |
Income Below Poverty Among Single-Parent Households in Challis
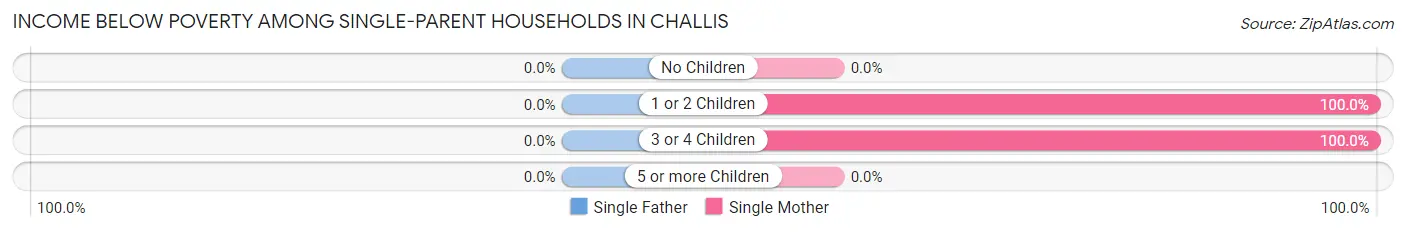
| Children | Single Father | Single Mother |
| No Children | 0 (0.0%) | 0 (0.0%) |
| 1 or 2 Children | 0 (0.0%) | 5 (100.0%) |
| 3 or 4 Children | 0 (0.0%) | 13 (100.0%) |
| 5 or more Children | 0 (0.0%) | 0 (0.0%) |
| Total | 0 (0.0%) | 18 (100.0%) |
Income Below Poverty Among Married-Couple vs Single-Parent Households in Challis
The poverty data for Challis shows that 27 of the married-couple family households (18.8%) and 18 of the single-parent households (100.0%) are living below the poverty level. Within the married-couple family households, those with 1 or 2 children have the highest poverty rate, with 15 households (31.9%) falling below the poverty line. Among the single-parent households, those with 1 or 2 children have the highest poverty rate, with 5 household (100.0%) living below poverty.
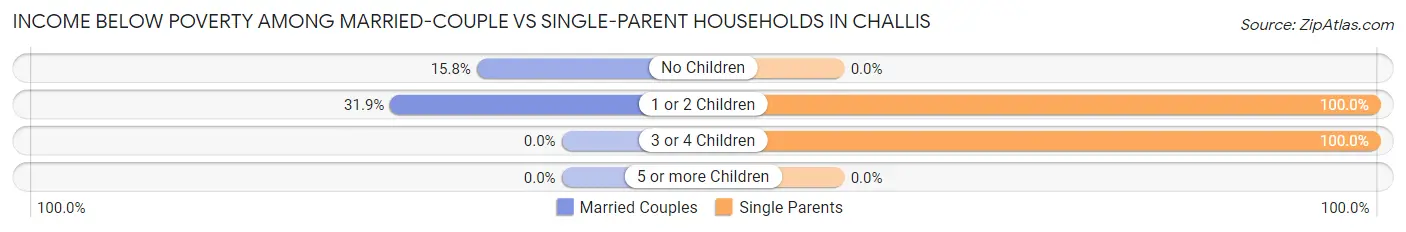
| Children | Married-Couple Families | Single-Parent Households |
| No Children | 12 (15.8%) | 0 (0.0%) |
| 1 or 2 Children | 15 (31.9%) | 5 (100.0%) |
| 3 or 4 Children | 0 (0.0%) | 13 (100.0%) |
| 5 or more Children | 0 (0.0%) | 0 (0.0%) |
| Total | 27 (18.8%) | 18 (100.0%) |
Race in Challis
The most populous races in Challis are White / Caucasian (738 | 87.9%), Hispanic or Latino (70 | 8.3%), and Some other Race (42 | 5.0%).
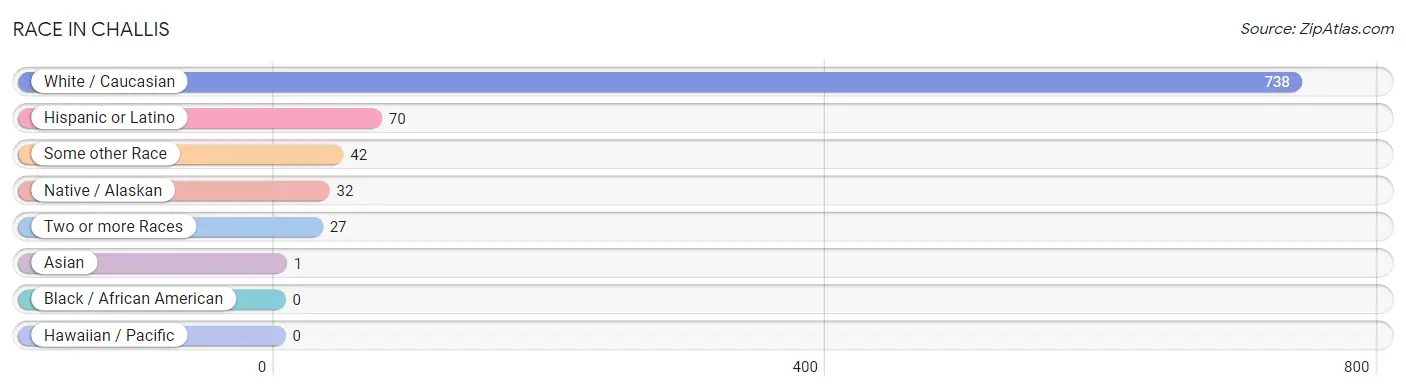
| Race | # Population | % Population |
| Asian | 1 | 0.1% |
| Black / African American | 0 | 0.0% |
| Hawaiian / Pacific | 0 | 0.0% |
| Hispanic or Latino | 70 | 8.3% |
| Native / Alaskan | 32 | 3.8% |
| White / Caucasian | 738 | 87.9% |
| Two or more Races | 27 | 3.2% |
| Some other Race | 42 | 5.0% |
| Total | 840 | 100.0% |
Ancestry in Challis
The most populous ancestries reported in Challis are German (256 | 30.5%), English (205 | 24.4%), British (61 | 7.3%), American (57 | 6.8%), and Irish (52 | 6.2%), together accounting for 75.1% of all Challis residents.
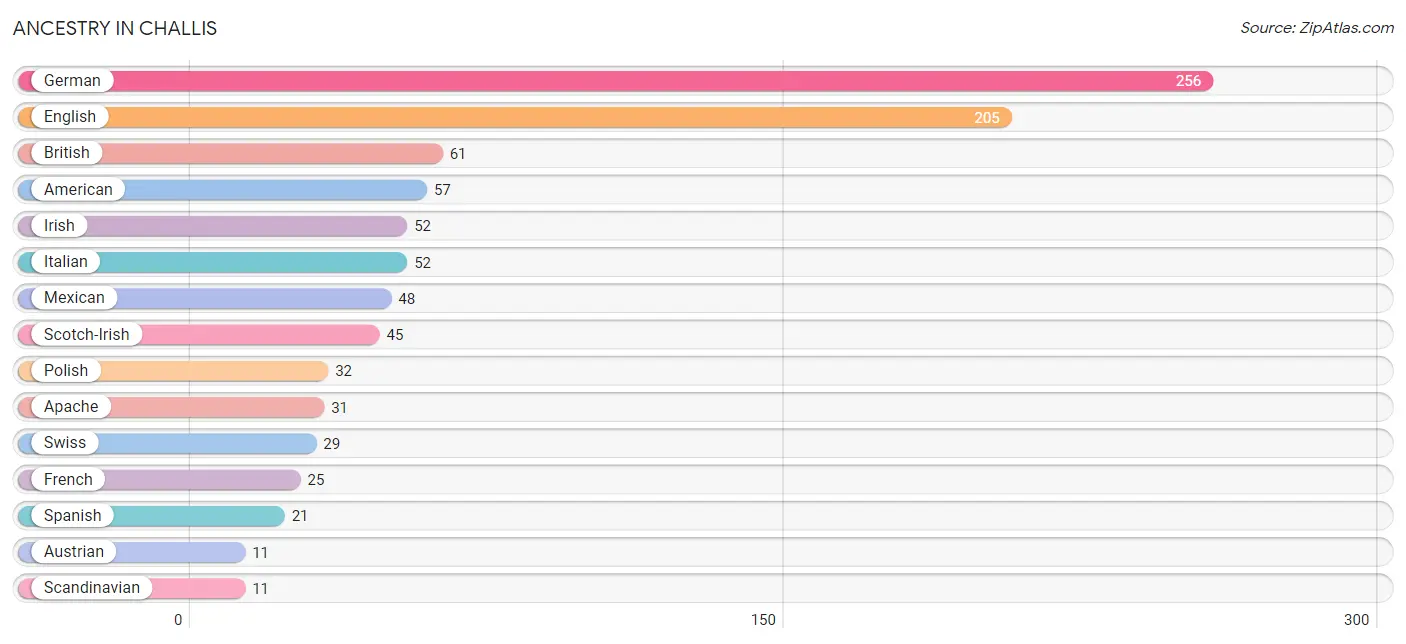
| Ancestry | # Population | % Population |
| American | 57 | 6.8% |
| Apache | 31 | 3.7% |
| Austrian | 11 | 1.3% |
| British | 61 | 7.3% |
| Burmese | 1 | 0.1% |
| Dutch | 5 | 0.6% |
| English | 205 | 24.4% |
| European | 6 | 0.7% |
| Finnish | 2 | 0.2% |
| French | 25 | 3.0% |
| French Canadian | 1 | 0.1% |
| German | 256 | 30.5% |
| Irish | 52 | 6.2% |
| Italian | 52 | 6.2% |
| Mexican | 48 | 5.7% |
| Norwegian | 4 | 0.5% |
| Polish | 32 | 3.8% |
| Scandinavian | 11 | 1.3% |
| Scotch-Irish | 45 | 5.4% |
| Sioux | 1 | 0.1% |
| Spanish | 21 | 2.5% |
| Swedish | 5 | 0.6% |
| Swiss | 29 | 3.5% |
| Welsh | 3 | 0.4% | View All 24 Rows |
Immigrants in Challis
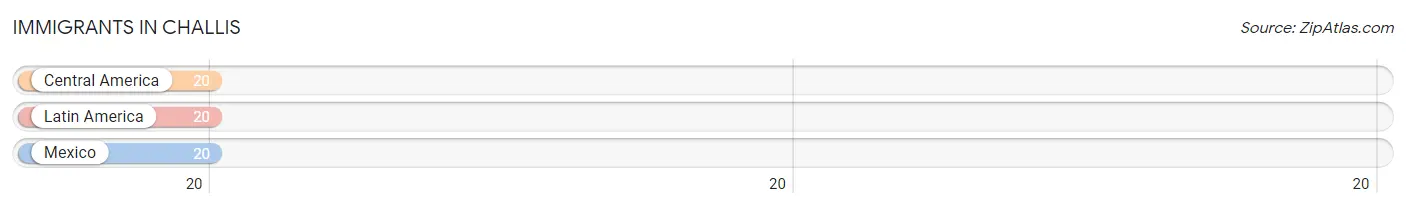
The most numerous immigrant groups reported in Challis came from Central America (20 | 2.4%), Latin America (20 | 2.4%), and Mexico (20 | 2.4%), together accounting for 7.1% of all Challis residents.
| Immigration Origin | # Population | % Population |
| Central America | 20 | 2.4% |
| Latin America | 20 | 2.4% |
| Mexico | 20 | 2.4% | View All 3 Rows |
Sex and Age in Challis
Sex and Age in Challis
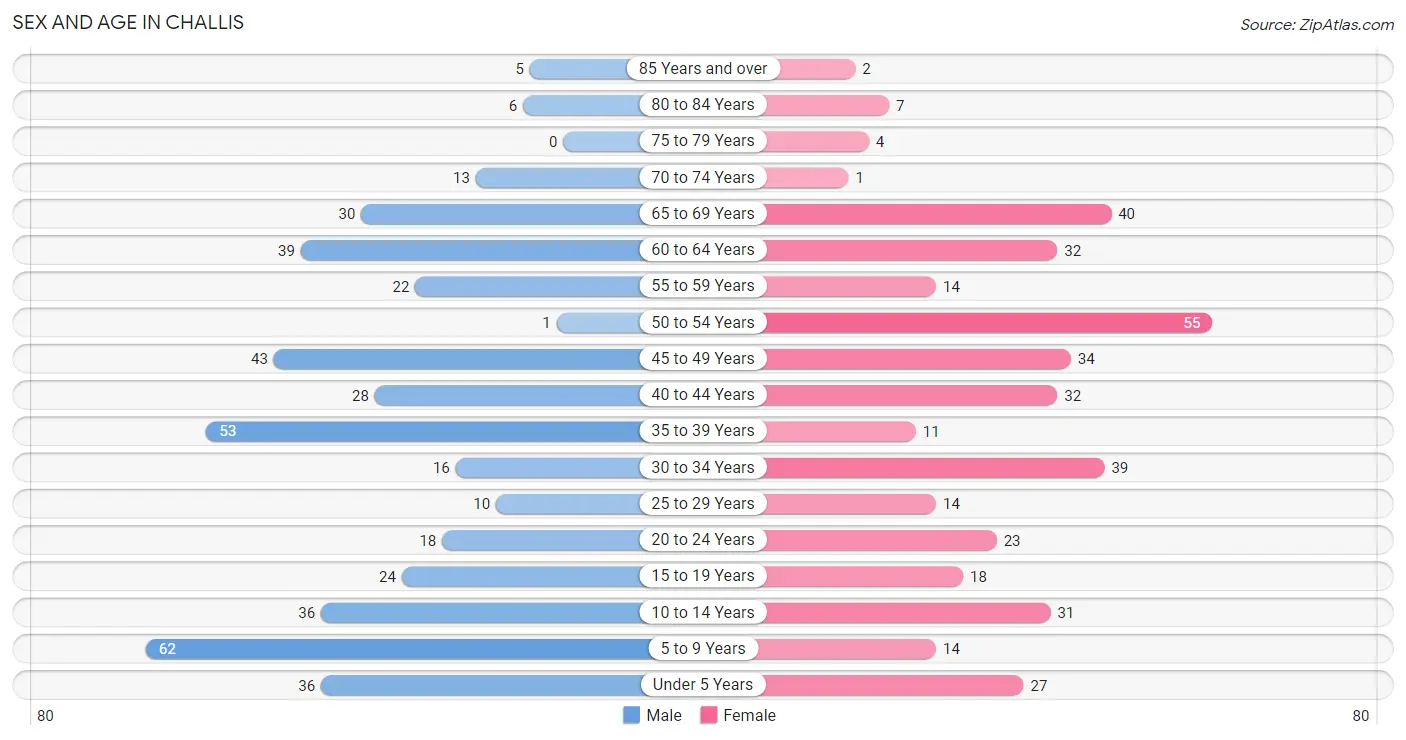
The most populous age groups in Challis are 5 to 9 Years (62 | 14.0%) for men and 50 to 54 Years (55 | 13.8%) for women.
| Age Bracket | Male | Female |
| Under 5 Years | 36 (8.1%) | 27 (6.8%) |
| 5 to 9 Years | 62 (14.0%) | 14 (3.5%) |
| 10 to 14 Years | 36 (8.1%) | 31 (7.8%) |
| 15 to 19 Years | 24 (5.4%) | 18 (4.5%) |
| 20 to 24 Years | 18 (4.1%) | 23 (5.8%) |
| 25 to 29 Years | 10 (2.3%) | 14 (3.5%) |
| 30 to 34 Years | 16 (3.6%) | 39 (9.8%) |
| 35 to 39 Years | 53 (12.0%) | 11 (2.8%) |
| 40 to 44 Years | 28 (6.3%) | 32 (8.0%) |
| 45 to 49 Years | 43 (9.7%) | 34 (8.5%) |
| 50 to 54 Years | 1 (0.2%) | 55 (13.8%) |
| 55 to 59 Years | 22 (5.0%) | 14 (3.5%) |
| 60 to 64 Years | 39 (8.8%) | 32 (8.0%) |
| 65 to 69 Years | 30 (6.8%) | 40 (10.1%) |
| 70 to 74 Years | 13 (2.9%) | 1 (0.3%) |
| 75 to 79 Years | 0 (0.0%) | 4 (1.0%) |
| 80 to 84 Years | 6 (1.4%) | 7 (1.8%) |
| 85 Years and over | 5 (1.1%) | 2 (0.5%) |
| Total | 442 (100.0%) | 398 (100.0%) |
Families and Households in Challis
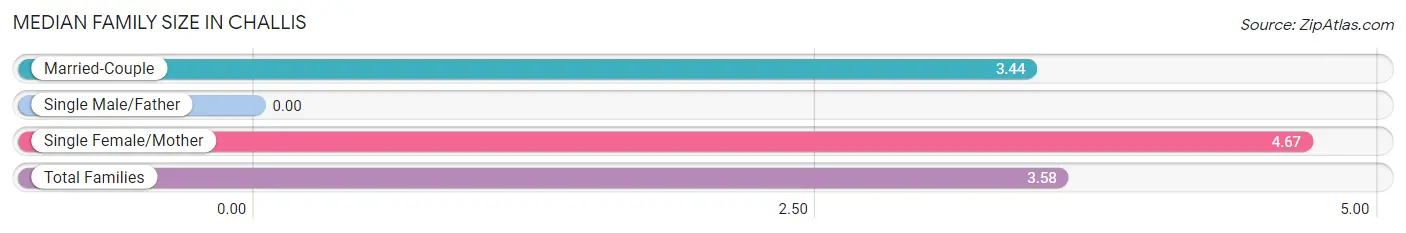
Median Family Size in Challis
| Family Type | # Families | Family Size |
| Married-Couple | 144 (88.9%) | 3.44 |
| Single Male/Father | 0 (0.0%) | - |
| Single Female/Mother | 18 (11.1%) | 4.67 |
| Total Families | 162 (100.0%) | 3.58 |
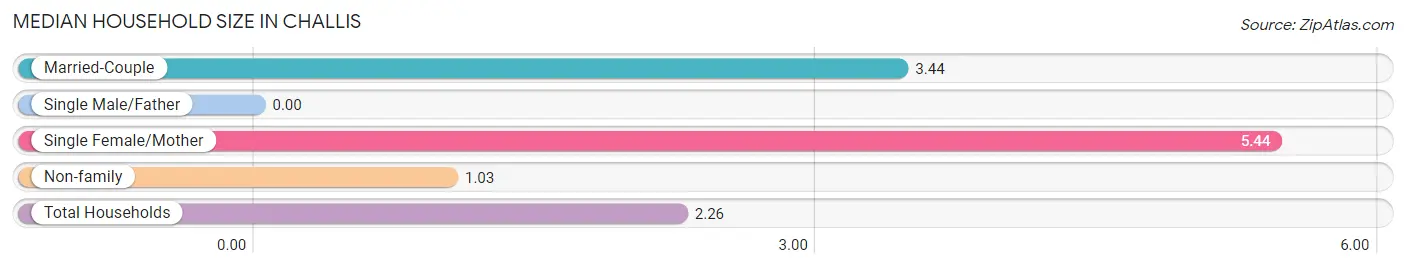
Median Household Size in Challis
| Household Type | # Households | Household Size |
| Married-Couple | 144 (41.4%) | 3.44 |
| Single Male/Father | 0 (0.0%) | - |
| Single Female/Mother | 18 (5.2%) | 5.44 |
| Non-family | 186 (53.4%) | 1.03 |
| Total Households | 348 (100.0%) | 2.26 |
Household Size by Marriage Status in Challis
Out of a total of 348 households in Challis, 162 (46.6%) are family households, while 186 (53.4%) are nonfamily households. The most numerous type of family households are 2-person households, comprising 75, and the most common type of nonfamily households are 1-person households, comprising 181.
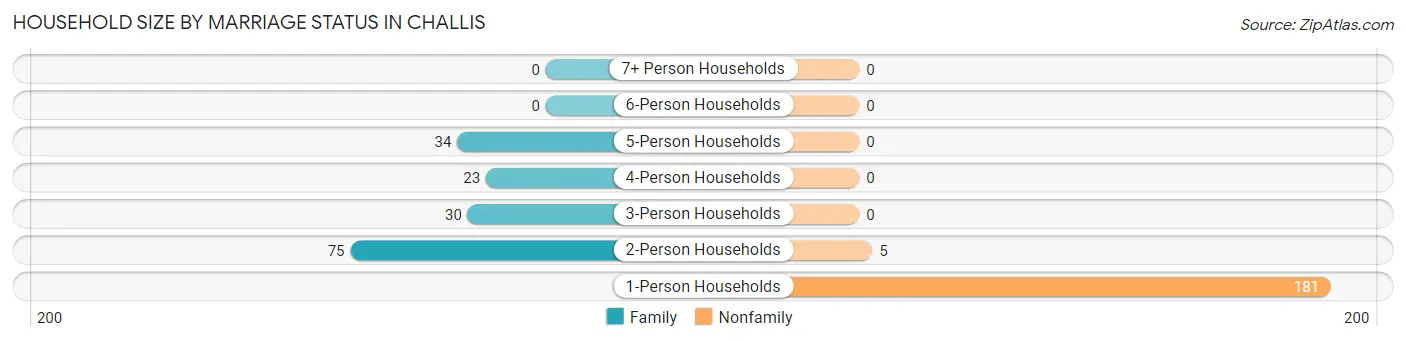
| Household Size | Family Households | Nonfamily Households |
| 1-Person Households | - | 181 (52.0%) |
| 2-Person Households | 75 (21.5%) | 5 (1.4%) |
| 3-Person Households | 30 (8.6%) | 0 (0.0%) |
| 4-Person Households | 23 (6.6%) | 0 (0.0%) |
| 5-Person Households | 34 (9.8%) | 0 (0.0%) |
| 6-Person Households | 0 (0.0%) | 0 (0.0%) |
| 7+ Person Households | 0 (0.0%) | 0 (0.0%) |
| Total | 162 (46.6%) | 186 (53.4%) |
Female Fertility in Challis
Fertility by Age in Challis
Average fertility rate in Challis is 54.0 births per 1,000 women. Women in the age bracket of 20 to 34 years have the highest fertility rate with 145.0 births per 1,000 women. Women in the age bracket of 20 to 34 years acount for 100.0% of all women with births.
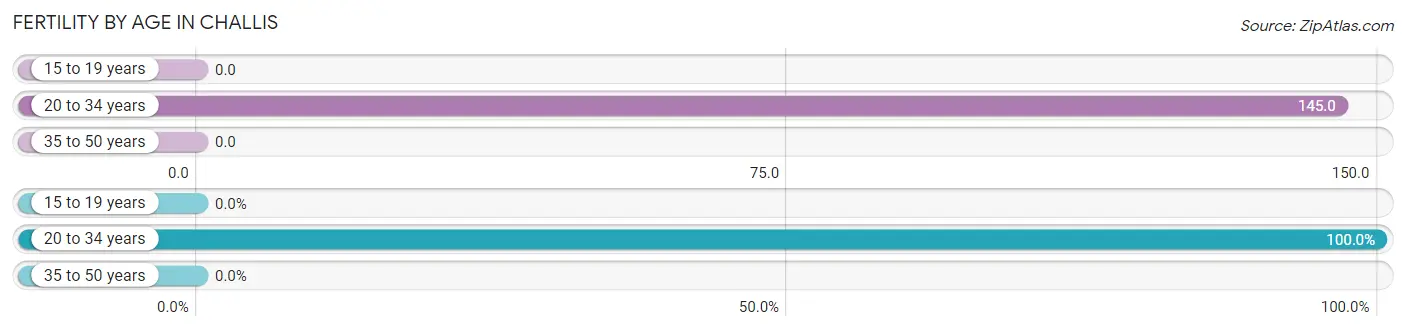
| Age Bracket | Women with Births | Births / 1,000 Women |
| 15 to 19 years | 0 (0.0%) | 0.0 |
| 20 to 34 years | 11 (100.0%) | 145.0 |
| 35 to 50 years | 0 (0.0%) | 0.0 |
| Total | 11 (100.0%) | 54.0 |
Fertility by Age by Marriage Status in Challis
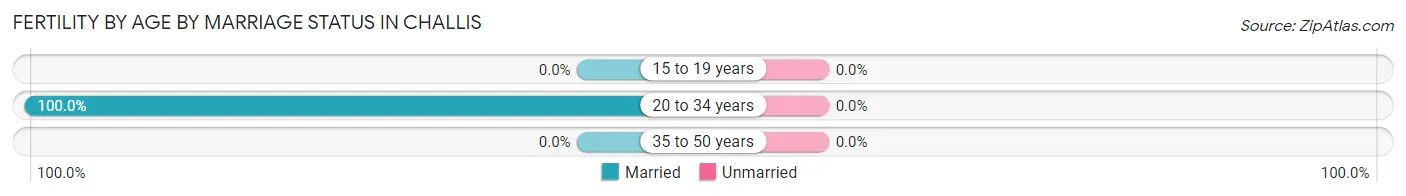
| Age Bracket | Married | Unmarried |
| 15 to 19 years | 0 (0.0%) | 0 (0.0%) |
| 20 to 34 years | 11 (100.0%) | 0 (0.0%) |
| 35 to 50 years | 0 (0.0%) | 0 (0.0%) |
| Total | 11 (100.0%) | 0 (0.0%) |
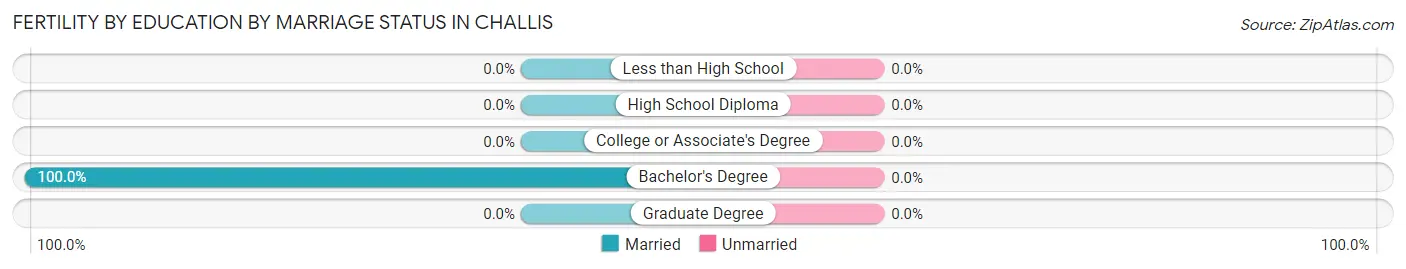
Fertility by Education in Challis
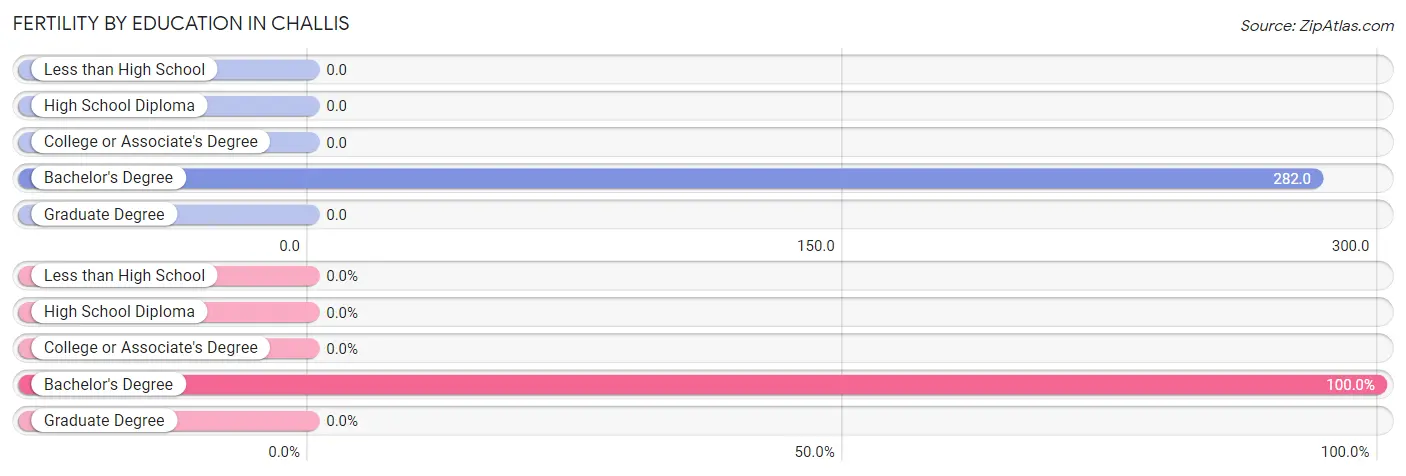
| Educational Attainment | Women with Births | Births / 1,000 Women |
| Less than High School | 0 (0.0%) | 0.0 |
| High School Diploma | 0 (0.0%) | 0.0 |
| College or Associate's Degree | 0 (0.0%) | 0.0 |
| Bachelor's Degree | 11 (100.0%) | 282.0 |
| Graduate Degree | 0 (0.0%) | 0.0 |
| Total | 11 (100.0%) | 54.0 |
Fertility by Education by Marriage Status in Challis
| Educational Attainment | Married | Unmarried |
| Less than High School | 0 (0.0%) | 0 (0.0%) |
| High School Diploma | 0 (0.0%) | 0 (0.0%) |
| College or Associate's Degree | 0 (0.0%) | 0 (0.0%) |
| Bachelor's Degree | 11 (100.0%) | 0 (0.0%) |
| Graduate Degree | 0 (0.0%) | 0 (0.0%) |
| Total | 11 (100.0%) | 0 (0.0%) |
Employment Characteristics in Challis
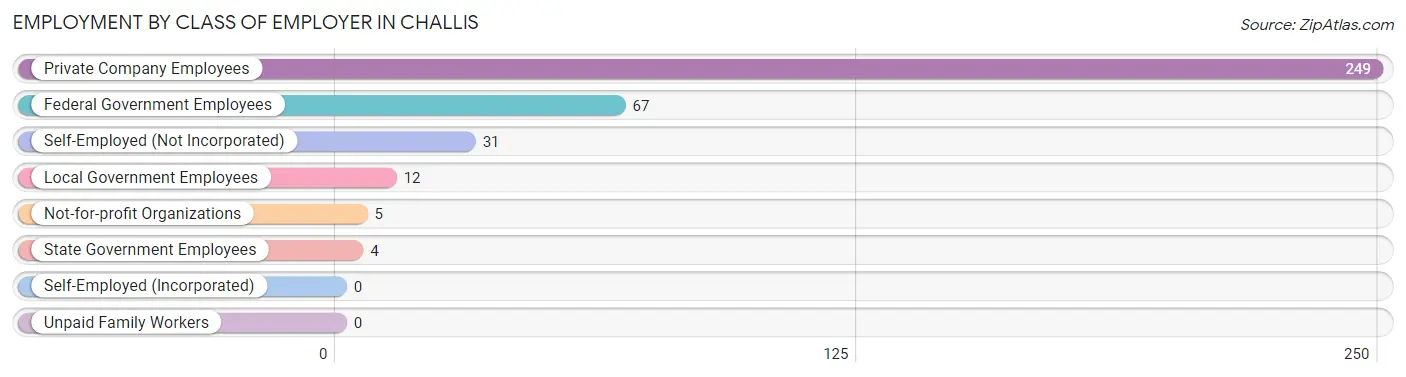
Employment by Class of Employer in Challis
Among the 368 employed individuals in Challis, private company employees (249 | 67.7%), federal government employees (67 | 18.2%), and self-employed (not incorporated) (31 | 8.4%) make up the most common classes of employment.
| Employer Class | # Employees | % Employees |
| Private Company Employees | 249 | 67.7% |
| Self-Employed (Incorporated) | 0 | 0.0% |
| Self-Employed (Not Incorporated) | 31 | 8.4% |
| Not-for-profit Organizations | 5 | 1.4% |
| Local Government Employees | 12 | 3.3% |
| State Government Employees | 4 | 1.1% |
| Federal Government Employees | 67 | 18.2% |
| Unpaid Family Workers | 0 | 0.0% |
| Total | 368 | 100.0% |
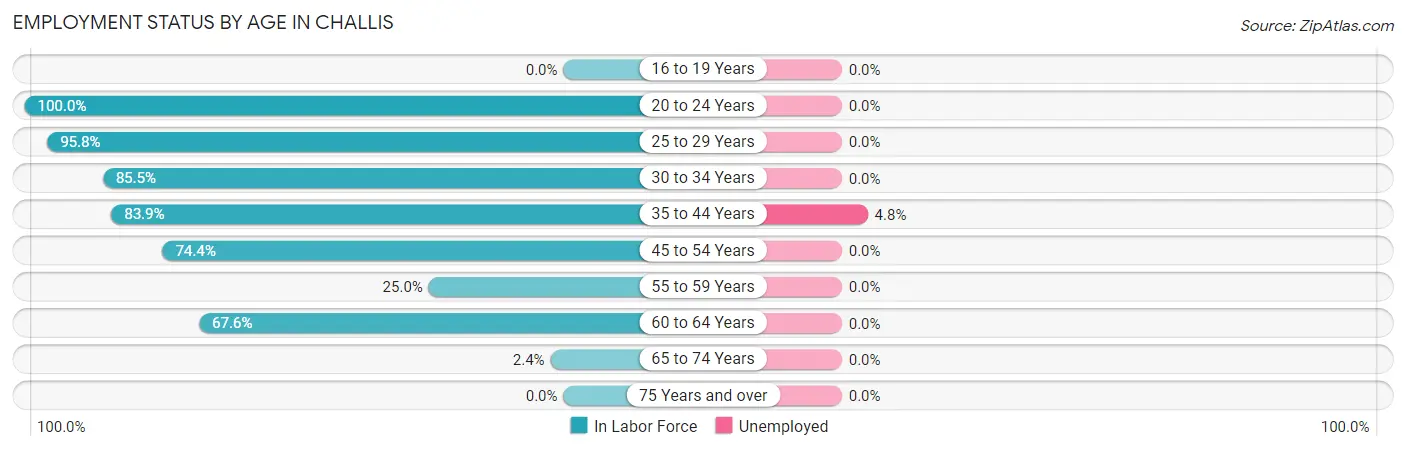
Employment Status by Age in Challis
According to the labor force statistics for Challis, out of the total population over 16 years of age (634), 58.8% or 373 individuals are in the labor force, with 1.3% or 5 of them unemployed. The age group with the highest labor force participation rate is 20 to 24 years, with 100.0% or 41 individuals in the labor force. Within the labor force, the 35 to 44 years age range has the highest percentage of unemployed individuals, with 4.8% or 5 of them being unemployed.
| Age Bracket | In Labor Force | Unemployed |
| 16 to 19 Years | 0 (0.0%) | 0 (0.0%) |
| 20 to 24 Years | 41 (100.0%) | 0 (0.0%) |
| 25 to 29 Years | 23 (95.8%) | 0 (0.0%) |
| 30 to 34 Years | 47 (85.5%) | 0 (0.0%) |
| 35 to 44 Years | 104 (83.9%) | 5 (4.8%) |
| 45 to 54 Years | 99 (74.4%) | 0 (0.0%) |
| 55 to 59 Years | 9 (25.0%) | 0 (0.0%) |
| 60 to 64 Years | 48 (67.6%) | 0 (0.0%) |
| 65 to 74 Years | 2 (2.4%) | 0 (0.0%) |
| 75 Years and over | 0 (0.0%) | 0 (0.0%) |
| Total | 373 (58.8%) | 5 (1.3%) |
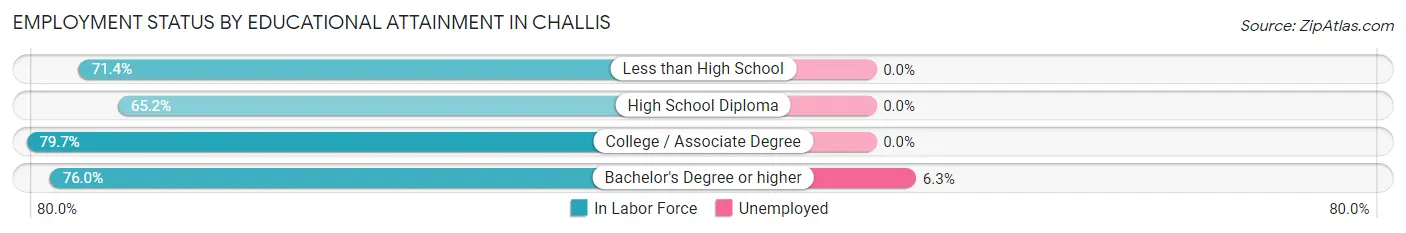
Employment Status by Educational Attainment in Challis
According to labor force statistics for Challis, 74.5% of individuals (330) out of the total population between 25 and 64 years of age (443) are in the labor force, with 1.5% or 5 of them being unemployed. The group with the highest labor force participation rate are those with the educational attainment of college / associate degree, with 79.7% or 153 individuals in the labor force. Within the labor force, individuals with bachelor's degree or higher education have the highest percentage of unemployment, with 6.3% or 5 of them being unemployed.
| Educational Attainment | In Labor Force | Unemployed |
| Less than High School | 25 (71.4%) | 0 (0.0%) |
| High School Diploma | 73 (65.2%) | 0 (0.0%) |
| College / Associate Degree | 153 (79.7%) | 0 (0.0%) |
| Bachelor's Degree or higher | 79 (76.0%) | 7 (6.3%) |
| Total | 330 (74.5%) | 7 (1.5%) |
Employment Occupations by Sex in Challis
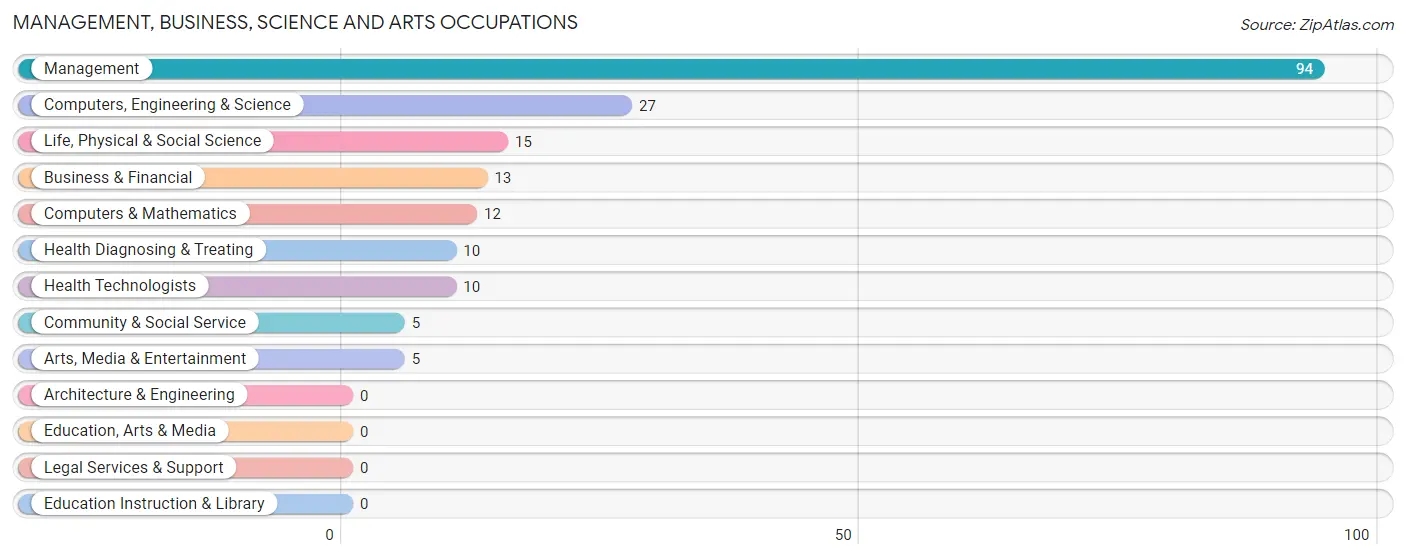
Management, Business, Science and Arts Occupations
The most common Management, Business, Science and Arts occupations in Challis are Management (94 | 25.5%), Computers, Engineering & Science (27 | 7.3%), Life, Physical & Social Science (15 | 4.1%), Business & Financial (13 | 3.5%), and Computers & Mathematics (12 | 3.3%).
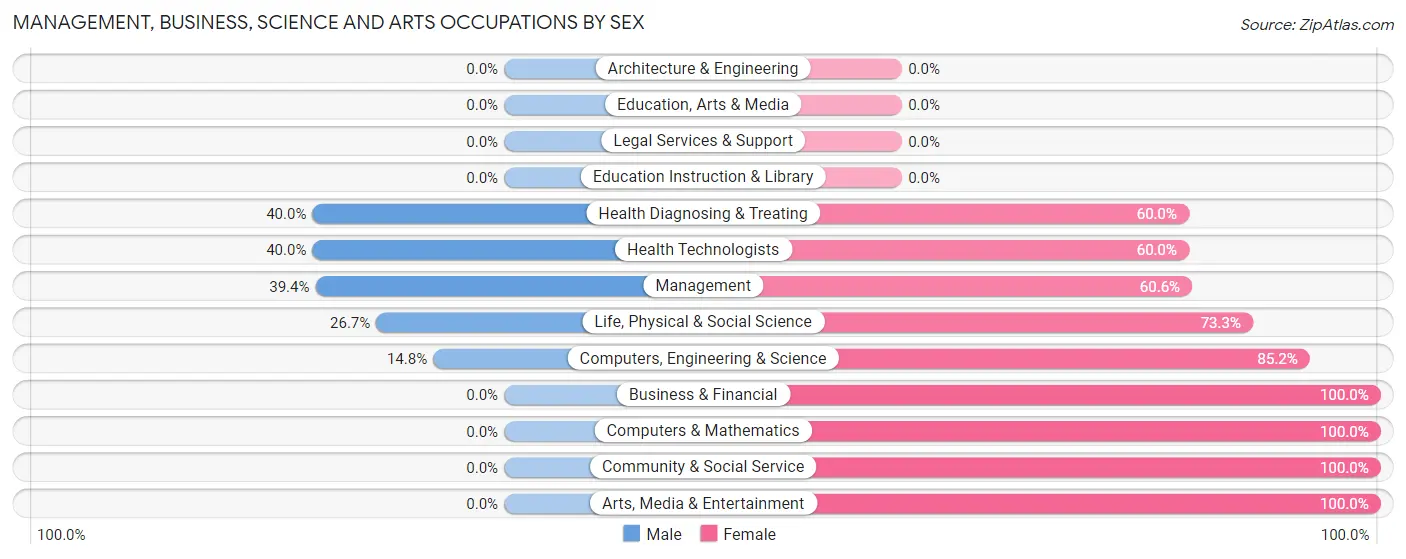
Management, Business, Science and Arts Occupations by Sex
Within the Management, Business, Science and Arts occupations in Challis, the most male-oriented occupations are Health Diagnosing & Treating (40.0%), Health Technologists (40.0%), and Management (39.4%), while the most female-oriented occupations are Business & Financial (100.0%), Computers & Mathematics (100.0%), and Community & Social Service (100.0%).
| Occupation | Male | Female |
| Management | 37 (39.4%) | 57 (60.6%) |
| Business & Financial | 0 (0.0%) | 13 (100.0%) |
| Computers, Engineering & Science | 4 (14.8%) | 23 (85.2%) |
| Computers & Mathematics | 0 (0.0%) | 12 (100.0%) |
| Architecture & Engineering | 0 (0.0%) | 0 (0.0%) |
| Life, Physical & Social Science | 4 (26.7%) | 11 (73.3%) |
| Community & Social Service | 0 (0.0%) | 5 (100.0%) |
| Education, Arts & Media | 0 (0.0%) | 0 (0.0%) |
| Legal Services & Support | 0 (0.0%) | 0 (0.0%) |
| Education Instruction & Library | 0 (0.0%) | 0 (0.0%) |
| Arts, Media & Entertainment | 0 (0.0%) | 5 (100.0%) |
| Health Diagnosing & Treating | 4 (40.0%) | 6 (60.0%) |
| Health Technologists | 4 (40.0%) | 6 (60.0%) |
| Total (Category) | 45 (30.2%) | 104 (69.8%) |
| Total (Overall) | 159 (43.2%) | 209 (56.8%) |
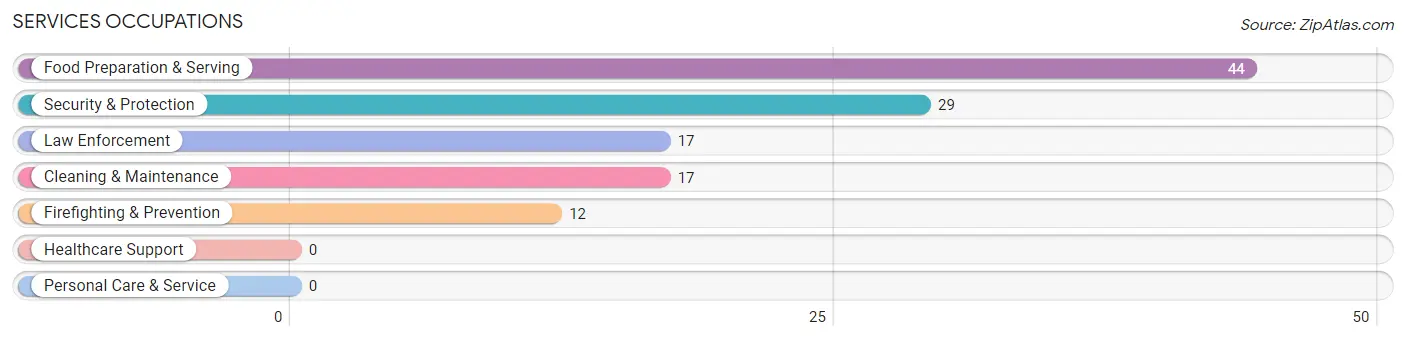
Services Occupations
The most common Services occupations in Challis are Food Preparation & Serving (44 | 12.0%), Security & Protection (29 | 7.9%), Law Enforcement (17 | 4.6%), Cleaning & Maintenance (17 | 4.6%), and Firefighting & Prevention (12 | 3.3%).
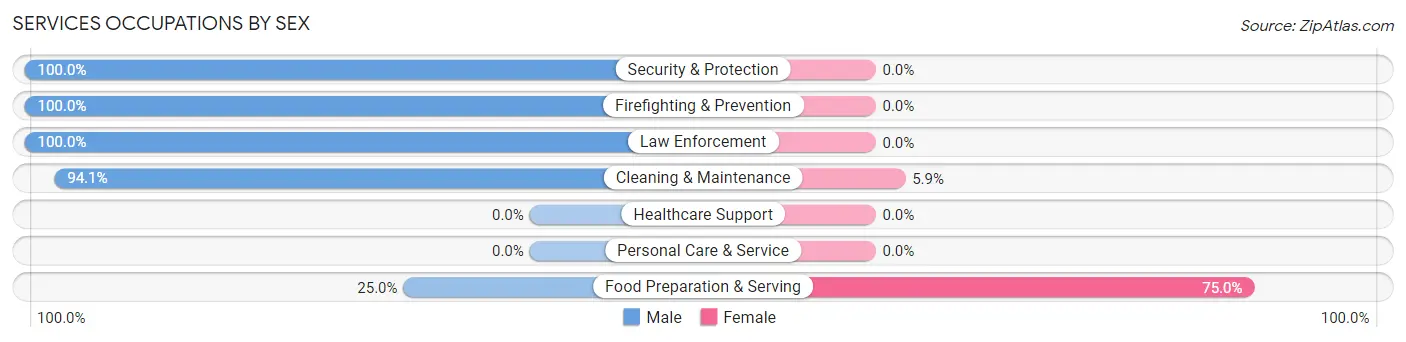
Services Occupations by Sex
Within the Services occupations in Challis, the most male-oriented occupations are Security & Protection (100.0%), Firefighting & Prevention (100.0%), and Law Enforcement (100.0%), while the most female-oriented occupations are Food Preparation & Serving (75.0%), and Cleaning & Maintenance (5.9%).
| Occupation | Male | Female |
| Healthcare Support | 0 (0.0%) | 0 (0.0%) |
| Security & Protection | 29 (100.0%) | 0 (0.0%) |
| Firefighting & Prevention | 12 (100.0%) | 0 (0.0%) |
| Law Enforcement | 17 (100.0%) | 0 (0.0%) |
| Food Preparation & Serving | 11 (25.0%) | 33 (75.0%) |
| Cleaning & Maintenance | 16 (94.1%) | 1 (5.9%) |
| Personal Care & Service | 0 (0.0%) | 0 (0.0%) |
| Total (Category) | 56 (62.2%) | 34 (37.8%) |
| Total (Overall) | 159 (43.2%) | 209 (56.8%) |
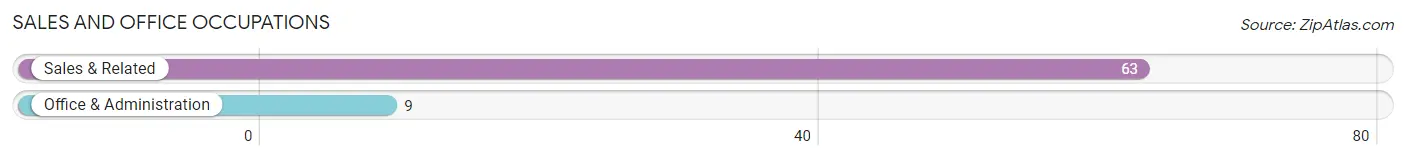
Sales and Office Occupations
The most common Sales and Office occupations in Challis are Sales & Related (63 | 17.1%), and Office & Administration (9 | 2.5%).
Sales and Office Occupations by Sex
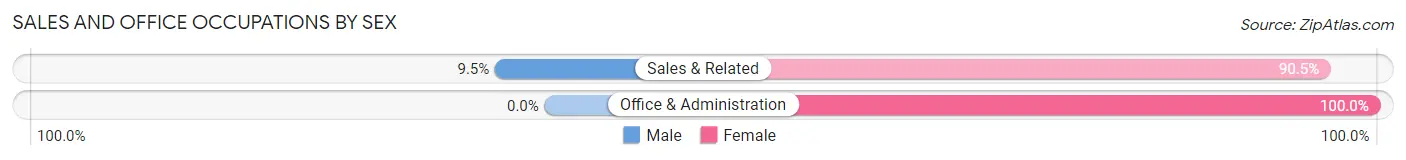
| Occupation | Male | Female |
| Sales & Related | 6 (9.5%) | 57 (90.5%) |
| Office & Administration | 0 (0.0%) | 9 (100.0%) |
| Total (Category) | 6 (8.3%) | 66 (91.7%) |
| Total (Overall) | 159 (43.2%) | 209 (56.8%) |
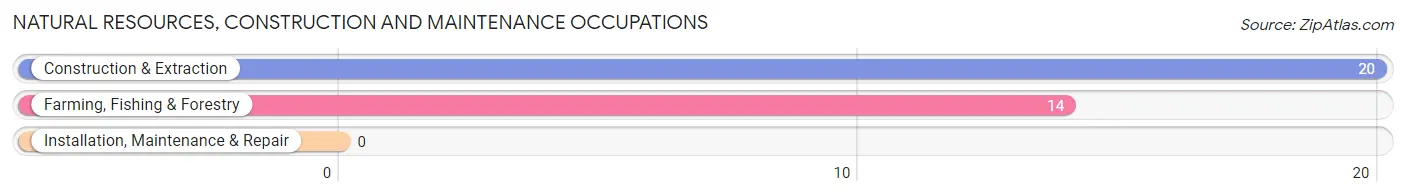
Natural Resources, Construction and Maintenance Occupations
The most common Natural Resources, Construction and Maintenance occupations in Challis are Construction & Extraction (20 | 5.4%), and Farming, Fishing & Forestry (14 | 3.8%).
Natural Resources, Construction and Maintenance Occupations by Sex
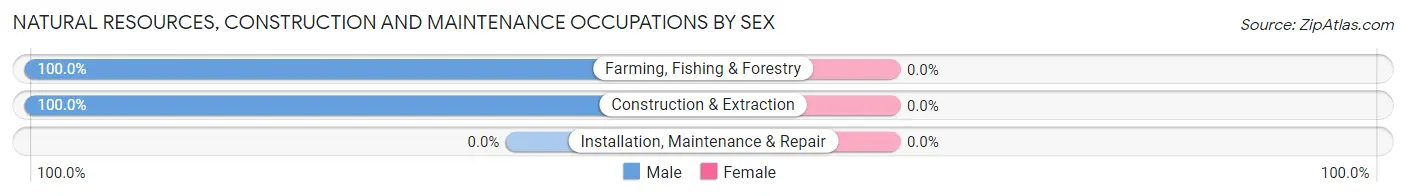
| Occupation | Male | Female |
| Farming, Fishing & Forestry | 14 (100.0%) | 0 (0.0%) |
| Construction & Extraction | 20 (100.0%) | 0 (0.0%) |
| Installation, Maintenance & Repair | 0 (0.0%) | 0 (0.0%) |
| Total (Category) | 34 (100.0%) | 0 (0.0%) |
| Total (Overall) | 159 (43.2%) | 209 (56.8%) |
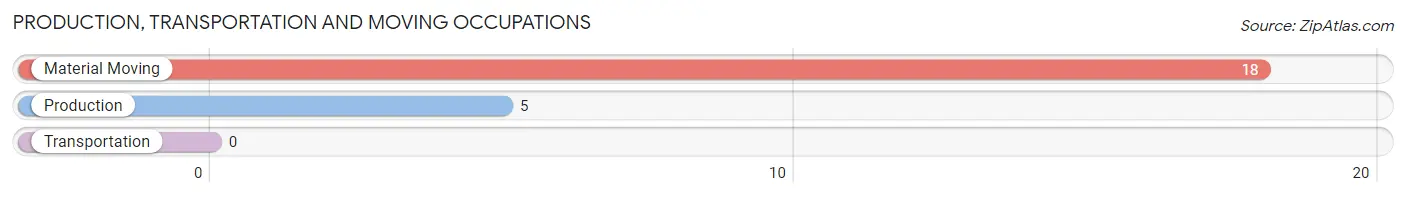
Production, Transportation and Moving Occupations
The most common Production, Transportation and Moving occupations in Challis are Material Moving (18 | 4.9%), and Production (5 | 1.4%).
Production, Transportation and Moving Occupations by Sex
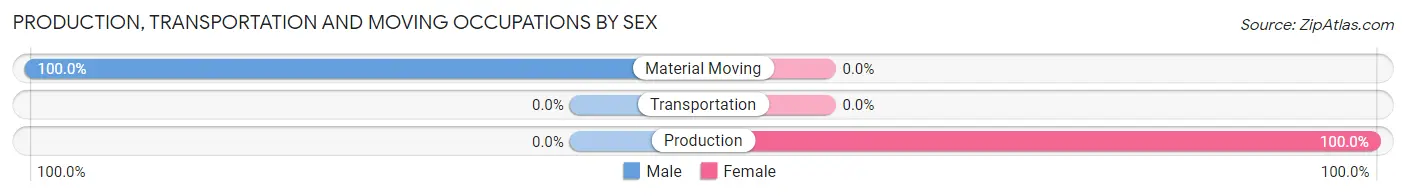
| Occupation | Male | Female |
| Production | 0 (0.0%) | 5 (100.0%) |
| Transportation | 0 (0.0%) | 0 (0.0%) |
| Material Moving | 18 (100.0%) | 0 (0.0%) |
| Total (Category) | 18 (78.3%) | 5 (21.7%) |
| Total (Overall) | 159 (43.2%) | 209 (56.8%) |
Employment Industries by Sex in Challis
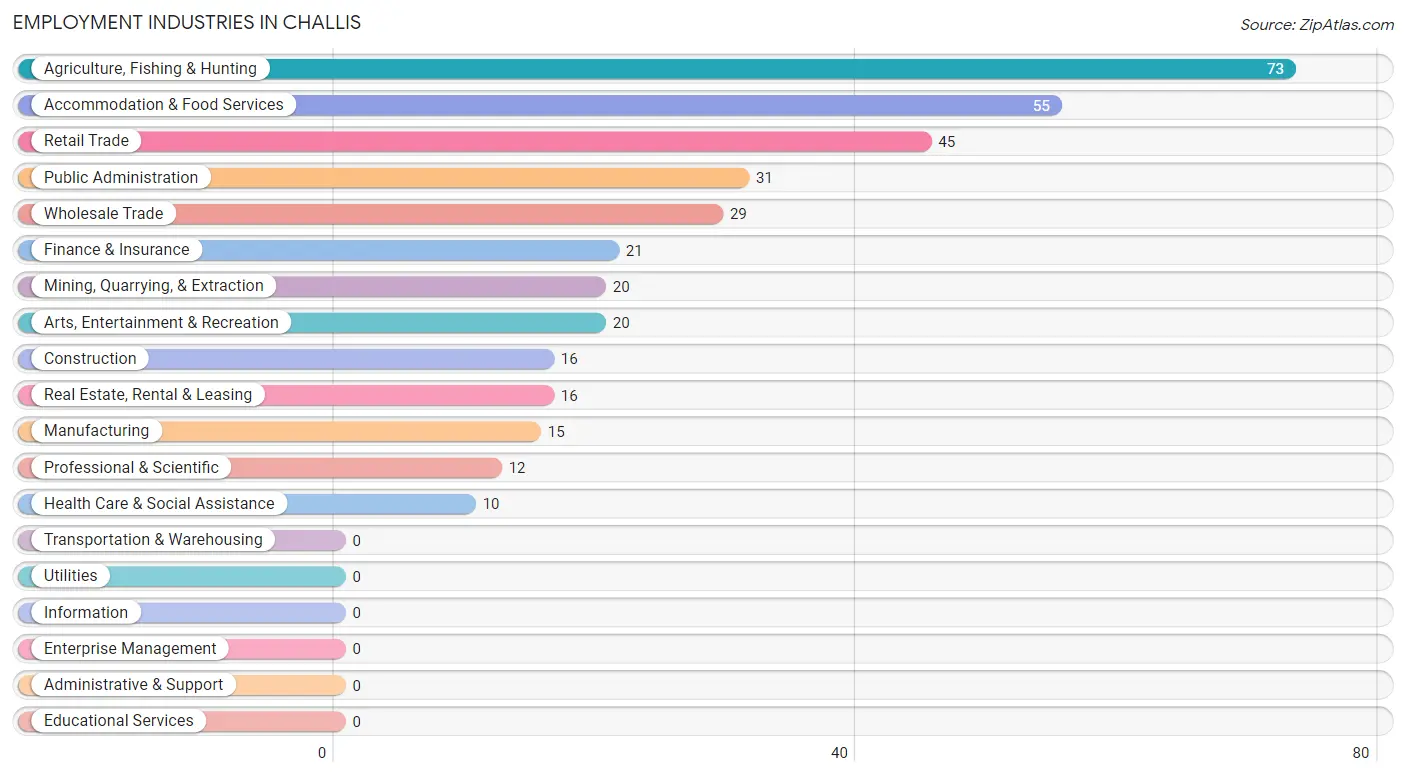
Employment Industries in Challis
The major employment industries in Challis include Agriculture, Fishing & Hunting (73 | 19.8%), Accommodation & Food Services (55 | 14.9%), Retail Trade (45 | 12.2%), Public Administration (31 | 8.4%), and Wholesale Trade (29 | 7.9%).
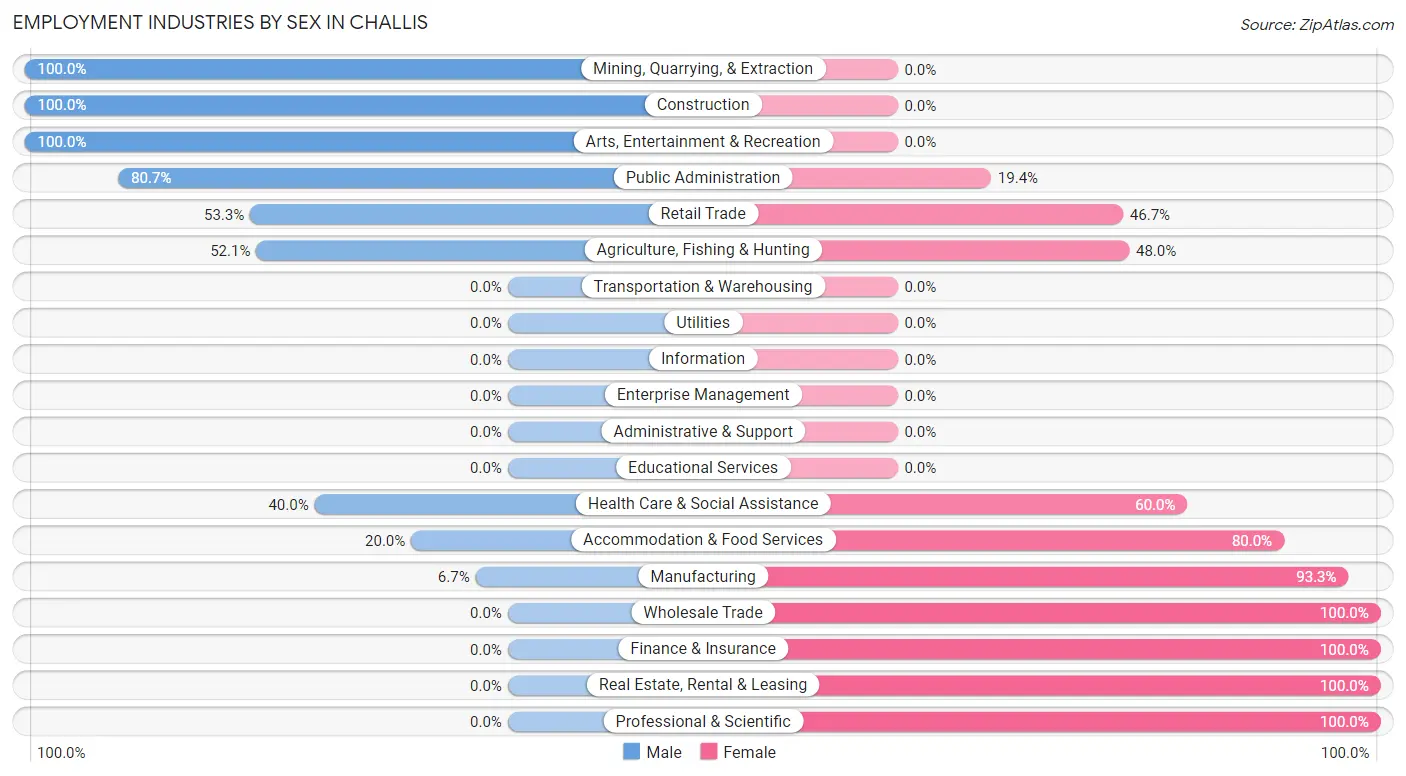
Employment Industries by Sex in Challis
The Challis industries that see more men than women are Mining, Quarrying, & Extraction (100.0%), Construction (100.0%), and Arts, Entertainment & Recreation (100.0%), whereas the industries that tend to have a higher number of women are Wholesale Trade (100.0%), Finance & Insurance (100.0%), and Real Estate, Rental & Leasing (100.0%).
| Industry | Male | Female |
| Agriculture, Fishing & Hunting | 38 (52.0%) | 35 (47.9%) |
| Mining, Quarrying, & Extraction | 20 (100.0%) | 0 (0.0%) |
| Construction | 16 (100.0%) | 0 (0.0%) |
| Manufacturing | 1 (6.7%) | 14 (93.3%) |
| Wholesale Trade | 0 (0.0%) | 29 (100.0%) |
| Retail Trade | 24 (53.3%) | 21 (46.7%) |
| Transportation & Warehousing | 0 (0.0%) | 0 (0.0%) |
| Utilities | 0 (0.0%) | 0 (0.0%) |
| Information | 0 (0.0%) | 0 (0.0%) |
| Finance & Insurance | 0 (0.0%) | 21 (100.0%) |
| Real Estate, Rental & Leasing | 0 (0.0%) | 16 (100.0%) |
| Professional & Scientific | 0 (0.0%) | 12 (100.0%) |
| Enterprise Management | 0 (0.0%) | 0 (0.0%) |
| Administrative & Support | 0 (0.0%) | 0 (0.0%) |
| Educational Services | 0 (0.0%) | 0 (0.0%) |
| Health Care & Social Assistance | 4 (40.0%) | 6 (60.0%) |
| Arts, Entertainment & Recreation | 20 (100.0%) | 0 (0.0%) |
| Accommodation & Food Services | 11 (20.0%) | 44 (80.0%) |
| Public Administration | 25 (80.6%) | 6 (19.4%) |
| Total | 159 (43.2%) | 209 (56.8%) |
Education in Challis
School Enrollment in Challis
The most common levels of schooling among the 170 students in Challis are elementary school (92 | 54.1%), middle school (33 | 19.4%), and high school (29 | 17.1%).
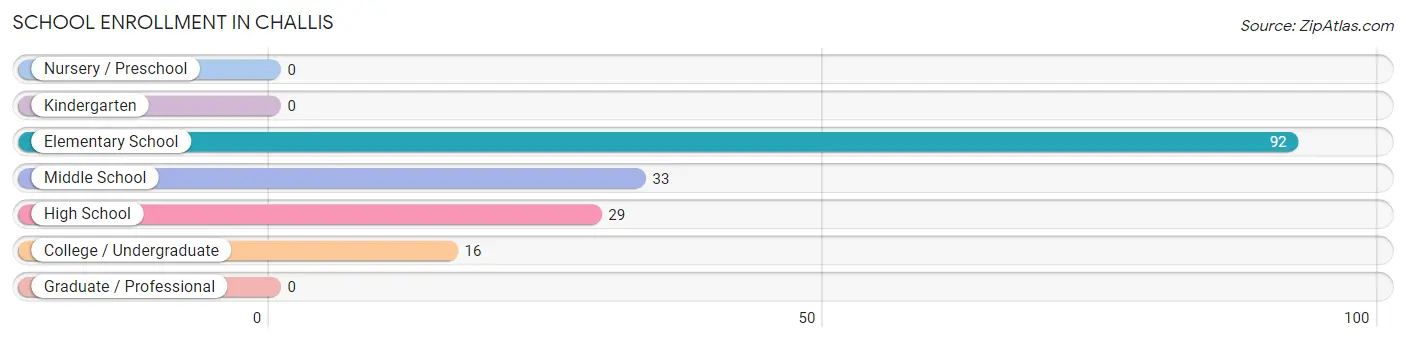
| School Level | # Students | % Students |
| Nursery / Preschool | 0 | 0.0% |
| Kindergarten | 0 | 0.0% |
| Elementary School | 92 | 54.1% |
| Middle School | 33 | 19.4% |
| High School | 29 | 17.1% |
| College / Undergraduate | 16 | 9.4% |
| Graduate / Professional | 0 | 0.0% |
| Total | 170 | 100.0% |
School Enrollment by Age by Funding Source in Challis
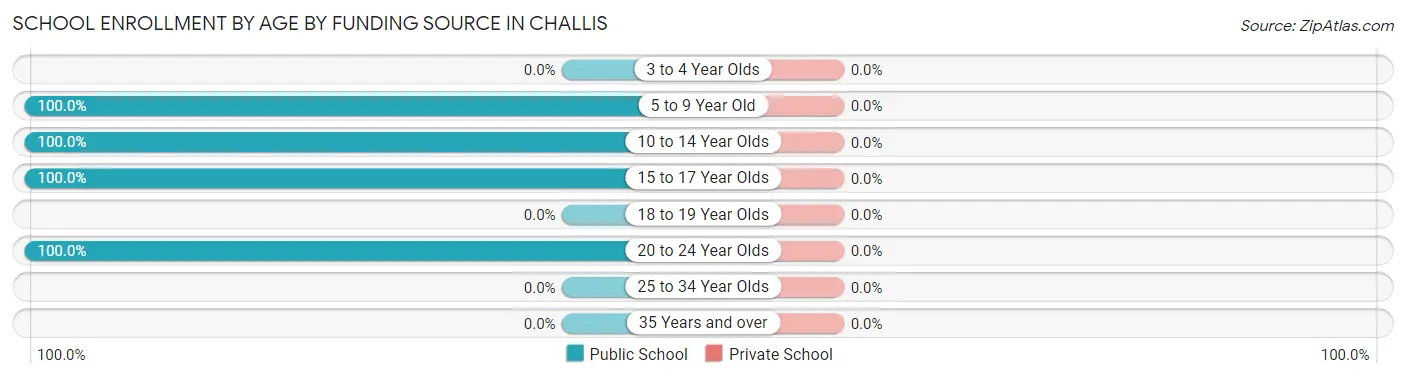
| Age Bracket | Public School | Private School |
| 3 to 4 Year Olds | 0 (0.0%) | 0 (0.0%) |
| 5 to 9 Year Old | 69 (100.0%) | 0 (0.0%) |
| 10 to 14 Year Olds | 62 (100.0%) | 0 (0.0%) |
| 15 to 17 Year Olds | 23 (100.0%) | 0 (0.0%) |
| 18 to 19 Year Olds | 0 (0.0%) | 0 (0.0%) |
| 20 to 24 Year Olds | 16 (100.0%) | 0 (0.0%) |
| 25 to 34 Year Olds | 0 (0.0%) | 0 (0.0%) |
| 35 Years and over | 0 (0.0%) | 0 (0.0%) |
| Total | 170 (100.0%) | 0 (0.0%) |
Educational Attainment by Field of Study in Challis
Bio, nature & agricultural (53 | 39.0%), arts & humanities (21 | 15.4%), education (17 | 12.5%), physical & health sciences (16 | 11.8%), and science & technology (11 | 8.1%) are the most common fields of study among 136 individuals in Challis who have obtained a bachelor's degree or higher.
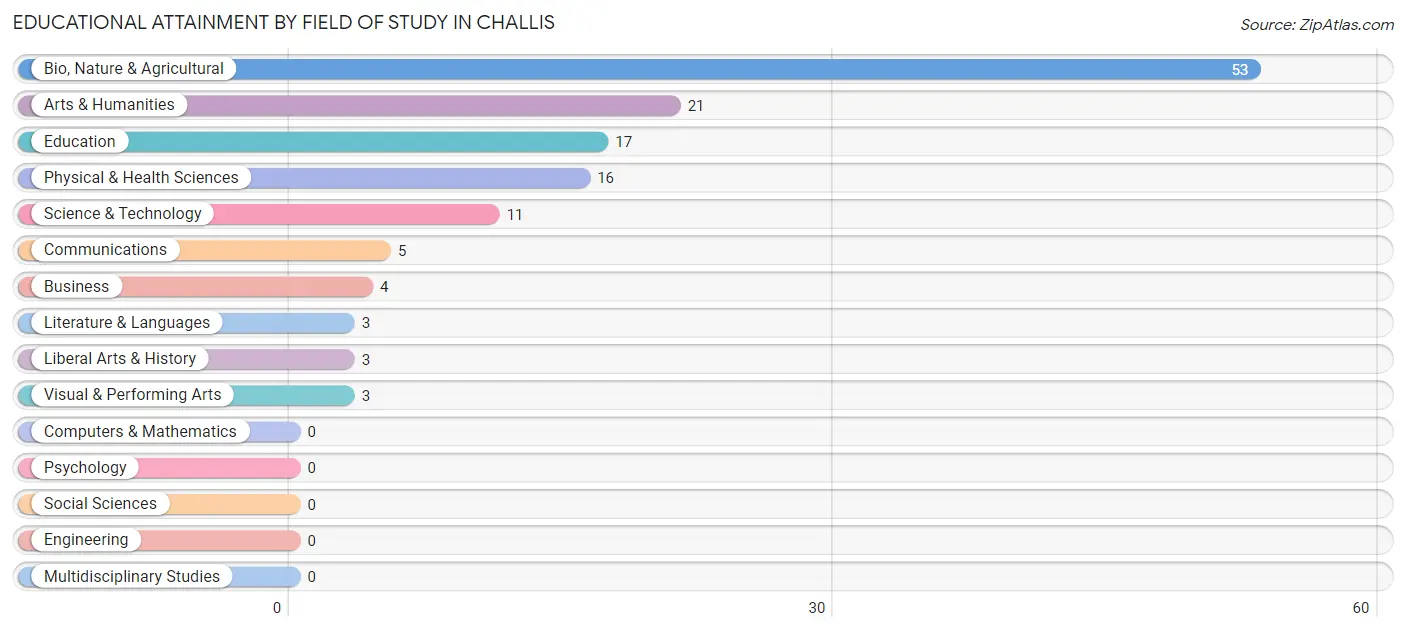
| Field of Study | # Graduates | % Graduates |
| Computers & Mathematics | 0 | 0.0% |
| Bio, Nature & Agricultural | 53 | 39.0% |
| Physical & Health Sciences | 16 | 11.8% |
| Psychology | 0 | 0.0% |
| Social Sciences | 0 | 0.0% |
| Engineering | 0 | 0.0% |
| Multidisciplinary Studies | 0 | 0.0% |
| Science & Technology | 11 | 8.1% |
| Business | 4 | 2.9% |
| Education | 17 | 12.5% |
| Literature & Languages | 3 | 2.2% |
| Liberal Arts & History | 3 | 2.2% |
| Visual & Performing Arts | 3 | 2.2% |
| Communications | 5 | 3.7% |
| Arts & Humanities | 21 | 15.4% |
| Total | 136 | 100.0% |
Transportation & Commute in Challis
Vehicle Availability by Sex in Challis
The most prevalent vehicle ownership categories in Challis are males with 2 vehicles (43, accounting for 36.1%) and females with 2 vehicles (52, making up 20.6%).
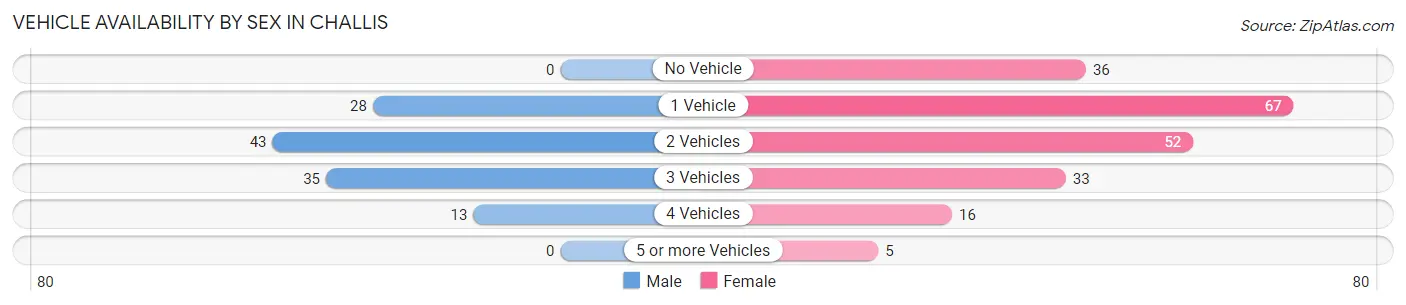
| Vehicles Available | Male | Female |
| No Vehicle | 0 (0.0%) | 36 (17.2%) |
| 1 Vehicle | 28 (23.5%) | 67 (32.1%) |
| 2 Vehicles | 43 (36.1%) | 52 (24.9%) |
| 3 Vehicles | 35 (29.4%) | 33 (15.8%) |
| 4 Vehicles | 13 (10.9%) | 16 (7.7%) |
| 5 or more Vehicles | 0 (0.0%) | 5 (2.4%) |
| Total | 119 (100.0%) | 209 (100.0%) |
Commute Time in Challis
The most frequently occuring commute durations in Challis are 5 to 9 minutes (140 commuters, 46.2%), less than 5 minutes (85 commuters, 28.1%), and 20 to 24 minutes (24 commuters, 7.9%).
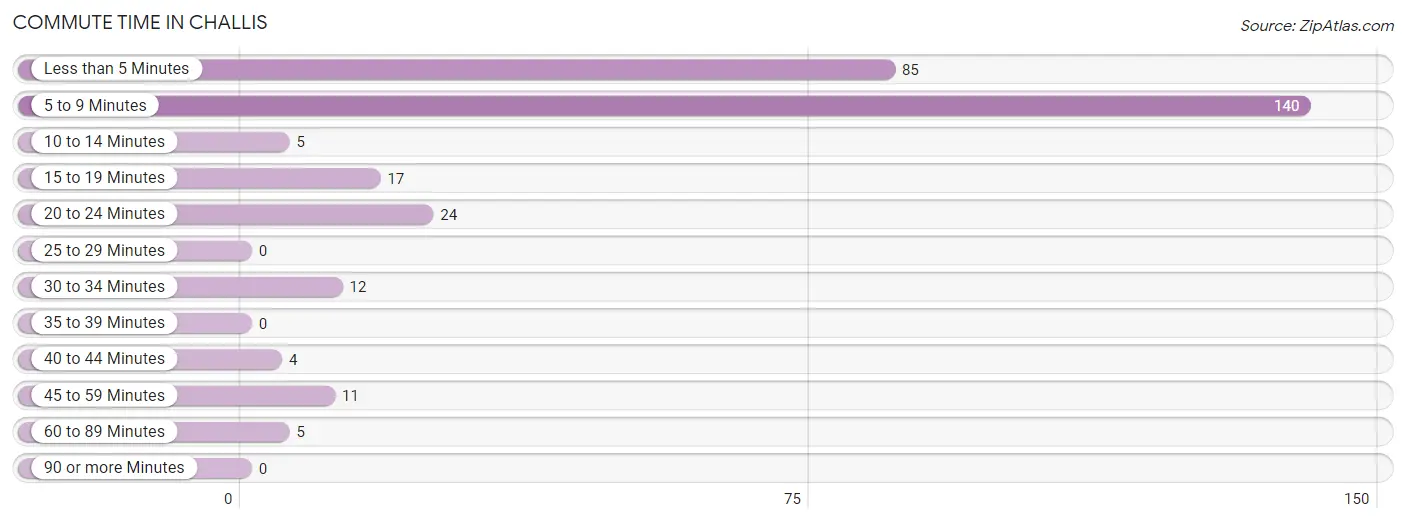
| Commute Time | # Commuters | % Commuters |
| Less than 5 Minutes | 85 | 28.1% |
| 5 to 9 Minutes | 140 | 46.2% |
| 10 to 14 Minutes | 5 | 1.7% |
| 15 to 19 Minutes | 17 | 5.6% |
| 20 to 24 Minutes | 24 | 7.9% |
| 25 to 29 Minutes | 0 | 0.0% |
| 30 to 34 Minutes | 12 | 4.0% |
| 35 to 39 Minutes | 0 | 0.0% |
| 40 to 44 Minutes | 4 | 1.3% |
| 45 to 59 Minutes | 11 | 3.6% |
| 60 to 89 Minutes | 5 | 1.7% |
| 90 or more Minutes | 0 | 0.0% |
Commute Time by Sex in Challis
The most common commute times in Challis are 5 to 9 minutes (63 commuters, 45.3%) for males and 5 to 9 minutes (77 commuters, 46.9%) for females.
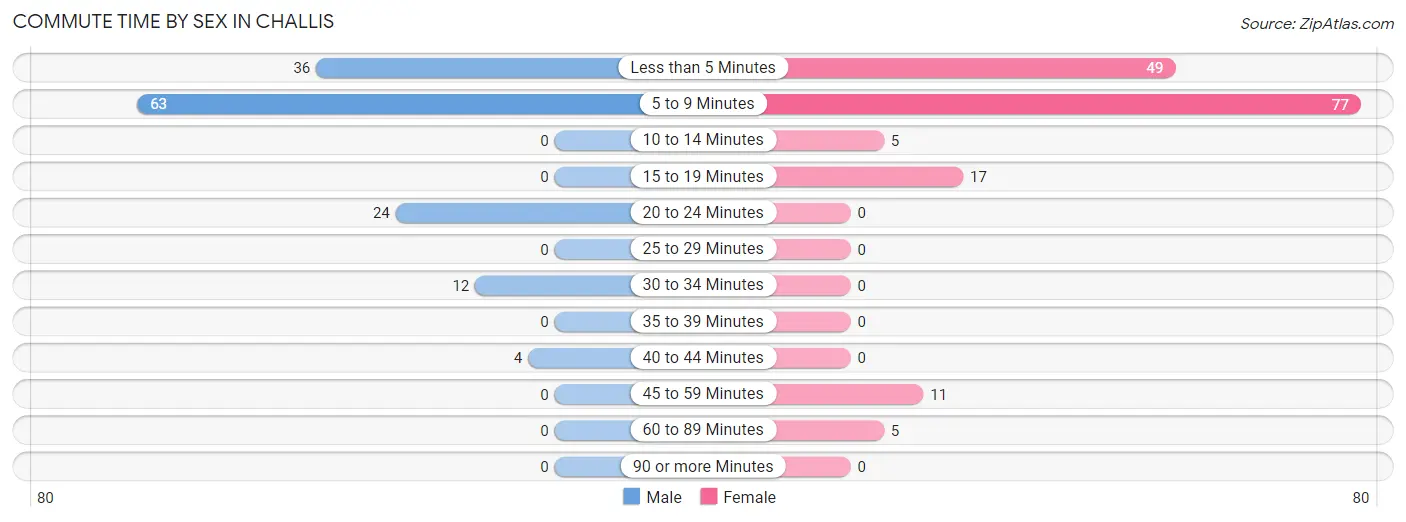
| Commute Time | Male | Female |
| Less than 5 Minutes | 36 (25.9%) | 49 (29.9%) |
| 5 to 9 Minutes | 63 (45.3%) | 77 (46.9%) |
| 10 to 14 Minutes | 0 (0.0%) | 5 (3.0%) |
| 15 to 19 Minutes | 0 (0.0%) | 17 (10.4%) |
| 20 to 24 Minutes | 24 (17.3%) | 0 (0.0%) |
| 25 to 29 Minutes | 0 (0.0%) | 0 (0.0%) |
| 30 to 34 Minutes | 12 (8.6%) | 0 (0.0%) |
| 35 to 39 Minutes | 0 (0.0%) | 0 (0.0%) |
| 40 to 44 Minutes | 4 (2.9%) | 0 (0.0%) |
| 45 to 59 Minutes | 0 (0.0%) | 11 (6.7%) |
| 60 to 89 Minutes | 0 (0.0%) | 5 (3.0%) |
| 90 or more Minutes | 0 (0.0%) | 0 (0.0%) |
Time of Departure to Work by Sex in Challis
The most frequent times of departure to work in Challis are 12:00 PM to 3:59 PM (51, 36.7%) for males and 7:30 AM to 7:59 AM (42, 25.6%) for females.
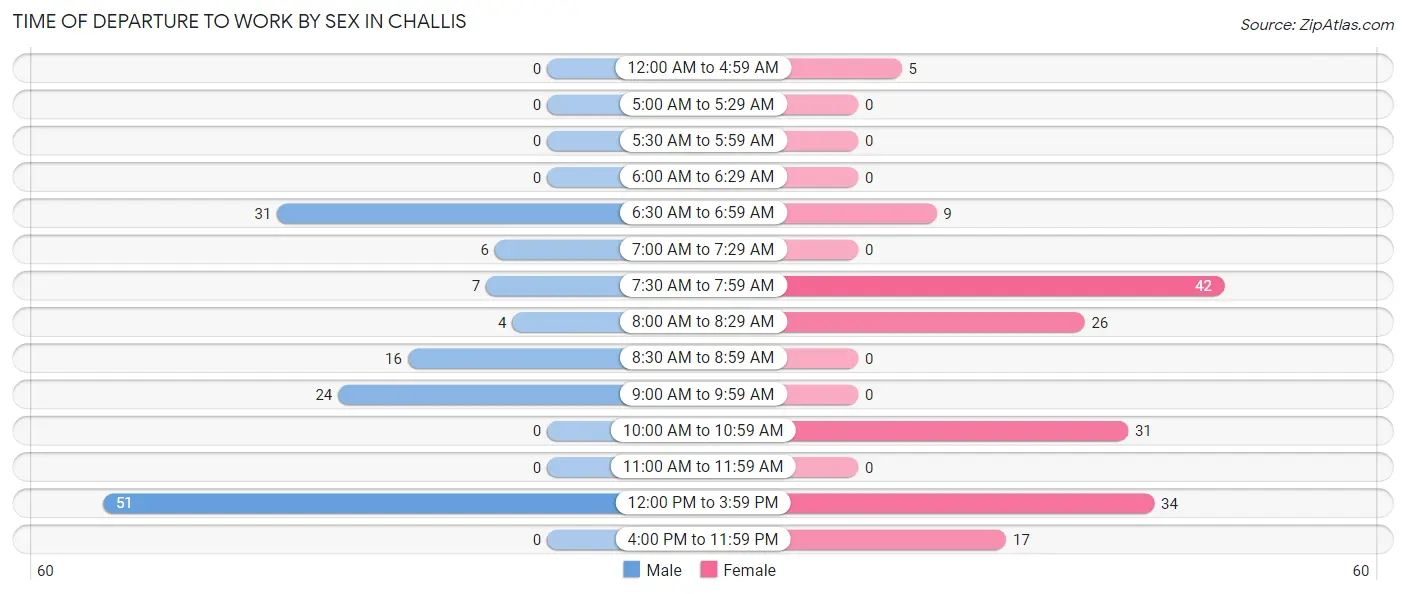
| Time of Departure | Male | Female |
| 12:00 AM to 4:59 AM | 0 (0.0%) | 5 (3.0%) |
| 5:00 AM to 5:29 AM | 0 (0.0%) | 0 (0.0%) |
| 5:30 AM to 5:59 AM | 0 (0.0%) | 0 (0.0%) |
| 6:00 AM to 6:29 AM | 0 (0.0%) | 0 (0.0%) |
| 6:30 AM to 6:59 AM | 31 (22.3%) | 9 (5.5%) |
| 7:00 AM to 7:29 AM | 6 (4.3%) | 0 (0.0%) |
| 7:30 AM to 7:59 AM | 7 (5.0%) | 42 (25.6%) |
| 8:00 AM to 8:29 AM | 4 (2.9%) | 26 (15.9%) |
| 8:30 AM to 8:59 AM | 16 (11.5%) | 0 (0.0%) |
| 9:00 AM to 9:59 AM | 24 (17.3%) | 0 (0.0%) |
| 10:00 AM to 10:59 AM | 0 (0.0%) | 31 (18.9%) |
| 11:00 AM to 11:59 AM | 0 (0.0%) | 0 (0.0%) |
| 12:00 PM to 3:59 PM | 51 (36.7%) | 34 (20.7%) |
| 4:00 PM to 11:59 PM | 0 (0.0%) | 17 (10.4%) |
| Total | 139 (100.0%) | 164 (100.0%) |
Housing Occupancy in Challis
Occupancy by Ownership in Challis
Of the total 348 dwellings in Challis, owner-occupied units account for 187 (53.7%), while renter-occupied units make up 161 (46.3%).
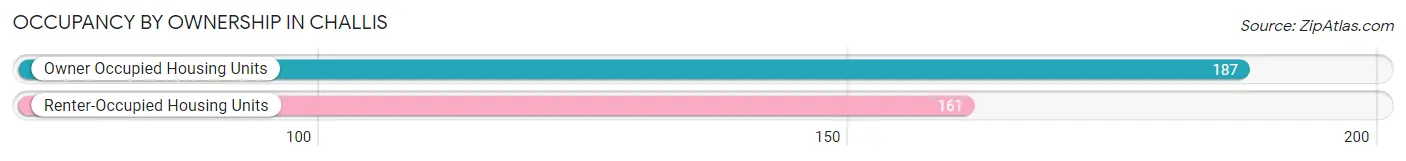
| Occupancy | # Housing Units | % Housing Units |
| Owner Occupied Housing Units | 187 | 53.7% |
| Renter-Occupied Housing Units | 161 | 46.3% |
| Total Occupied Housing Units | 348 | 100.0% |
Occupancy by Household Size in Challis
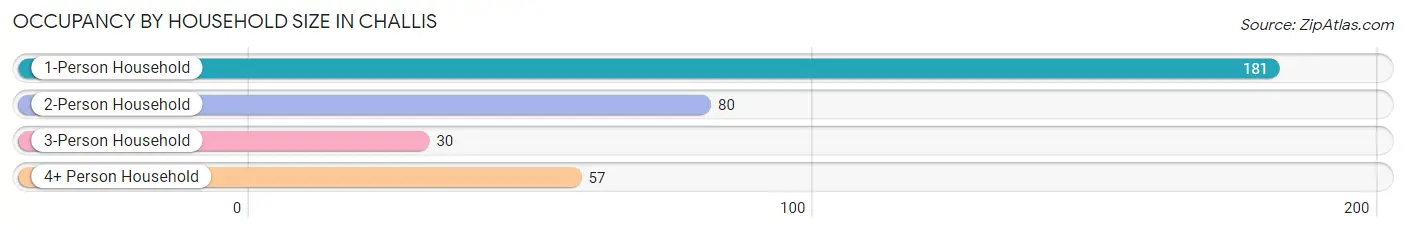
| Household Size | # Housing Units | % Housing Units |
| 1-Person Household | 181 | 52.0% |
| 2-Person Household | 80 | 23.0% |
| 3-Person Household | 30 | 8.6% |
| 4+ Person Household | 57 | 16.4% |
| Total Housing Units | 348 | 100.0% |
Occupancy by Ownership by Household Size in Challis
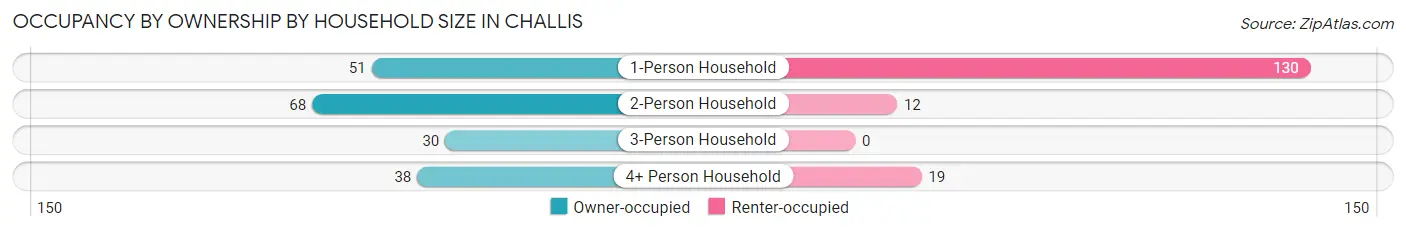
| Household Size | Owner-occupied | Renter-occupied |
| 1-Person Household | 51 (28.2%) | 130 (71.8%) |
| 2-Person Household | 68 (85.0%) | 12 (15.0%) |
| 3-Person Household | 30 (100.0%) | 0 (0.0%) |
| 4+ Person Household | 38 (66.7%) | 19 (33.3%) |
| Total Housing Units | 187 (53.7%) | 161 (46.3%) |
Occupancy by Educational Attainment in Challis
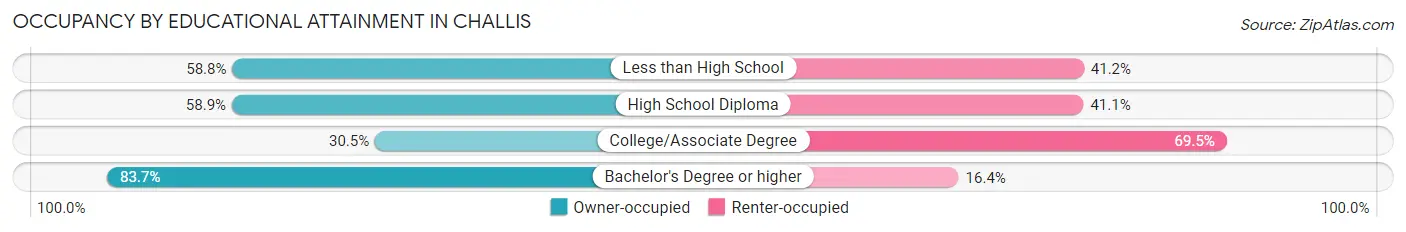
| Household Size | Owner-occupied | Renter-occupied |
| Less than High School | 10 (58.8%) | 7 (41.2%) |
| High School Diploma | 43 (58.9%) | 30 (41.1%) |
| College/Associate Degree | 47 (30.5%) | 107 (69.5%) |
| Bachelor's Degree or higher | 87 (83.7%) | 17 (16.4%) |
Occupancy by Age of Householder in Challis
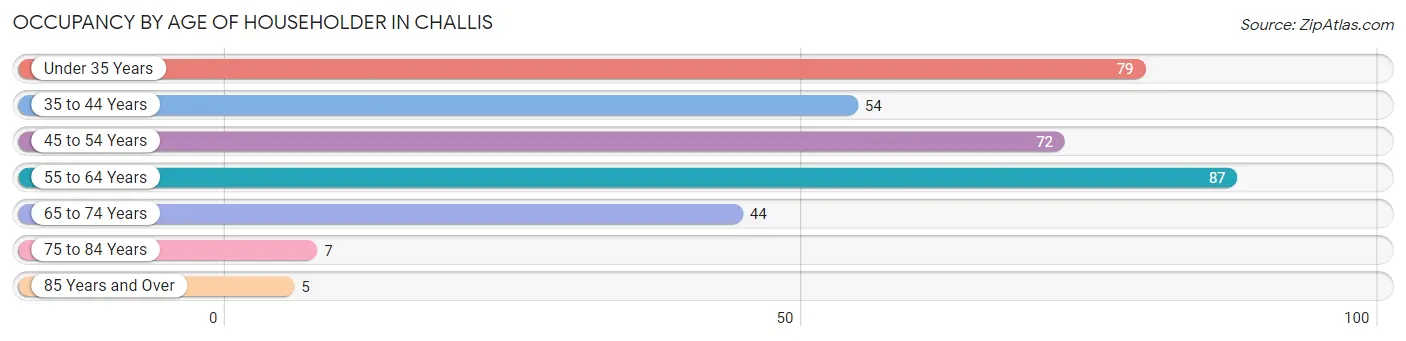
| Age Bracket | # Households | % Households |
| Under 35 Years | 79 | 22.7% |
| 35 to 44 Years | 54 | 15.5% |
| 45 to 54 Years | 72 | 20.7% |
| 55 to 64 Years | 87 | 25.0% |
| 65 to 74 Years | 44 | 12.6% |
| 75 to 84 Years | 7 | 2.0% |
| 85 Years and Over | 5 | 1.4% |
| Total | 348 | 100.0% |
Housing Finances in Challis
Median Income by Occupancy in Challis

| Occupancy Type | # Households | Median Income |
| Owner-Occupied | 187 (53.7%) | $63,750 |
| Renter-Occupied | 161 (46.3%) | $19,567 |
| Average | 348 (100.0%) | $35,921 |
Occupancy by Householder Income Bracket in Challis
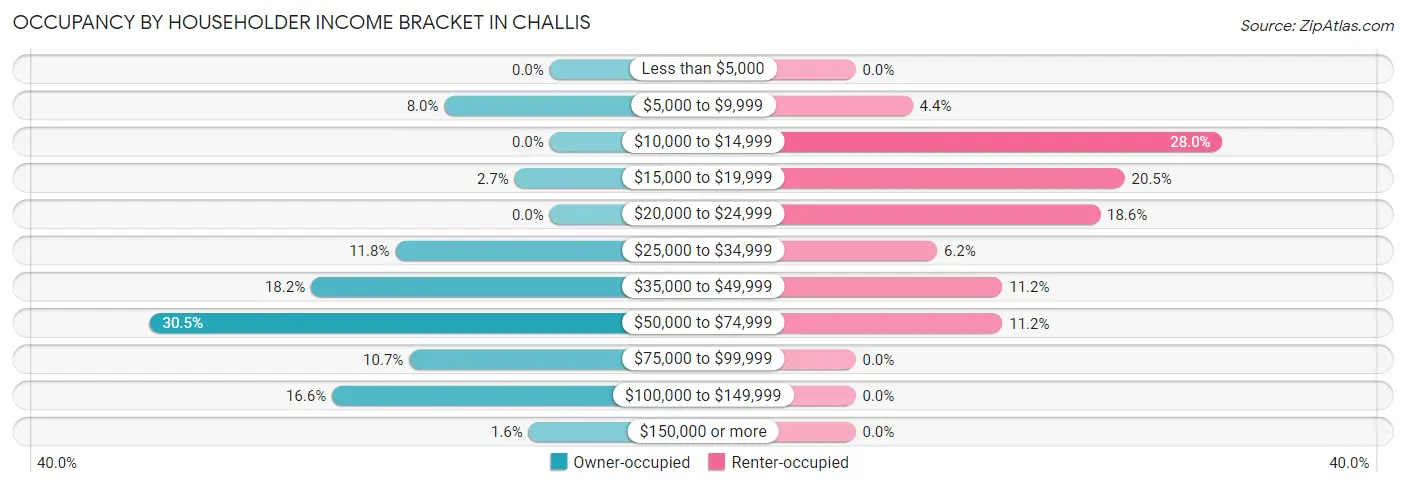
| Income Bracket | Owner-occupied | Renter-occupied |
| Less than $5,000 | 0 (0.0%) | 0 (0.0%) |
| $5,000 to $9,999 | 15 (8.0%) | 7 (4.3%) |
| $10,000 to $14,999 | 0 (0.0%) | 45 (28.0%) |
| $15,000 to $19,999 | 5 (2.7%) | 33 (20.5%) |
| $20,000 to $24,999 | 0 (0.0%) | 30 (18.6%) |
| $25,000 to $34,999 | 22 (11.8%) | 10 (6.2%) |
| $35,000 to $49,999 | 34 (18.2%) | 18 (11.2%) |
| $50,000 to $74,999 | 57 (30.5%) | 18 (11.2%) |
| $75,000 to $99,999 | 20 (10.7%) | 0 (0.0%) |
| $100,000 to $149,999 | 31 (16.6%) | 0 (0.0%) |
| $150,000 or more | 3 (1.6%) | 0 (0.0%) |
| Total | 187 (100.0%) | 161 (100.0%) |
Monthly Housing Cost Tiers in Challis
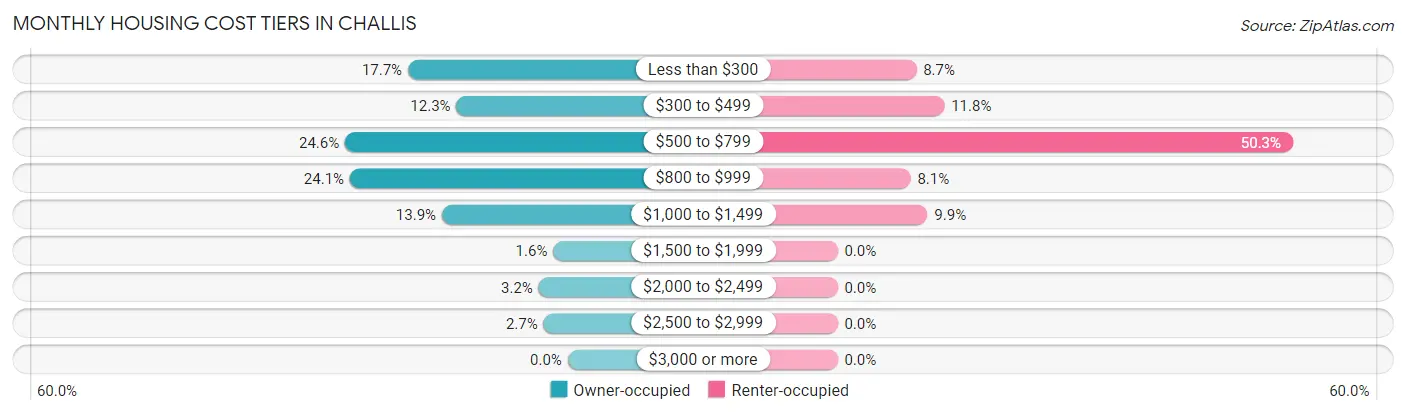
| Monthly Cost | Owner-occupied | Renter-occupied |
| Less than $300 | 33 (17.6%) | 14 (8.7%) |
| $300 to $499 | 23 (12.3%) | 19 (11.8%) |
| $500 to $799 | 46 (24.6%) | 81 (50.3%) |
| $800 to $999 | 45 (24.1%) | 13 (8.1%) |
| $1,000 to $1,499 | 26 (13.9%) | 16 (9.9%) |
| $1,500 to $1,999 | 3 (1.6%) | 0 (0.0%) |
| $2,000 to $2,499 | 6 (3.2%) | 0 (0.0%) |
| $2,500 to $2,999 | 5 (2.7%) | 0 (0.0%) |
| $3,000 or more | 0 (0.0%) | 0 (0.0%) |
| Total | 187 (100.0%) | 161 (100.0%) |
Physical Housing Characteristics in Challis
Housing Structures in Challis
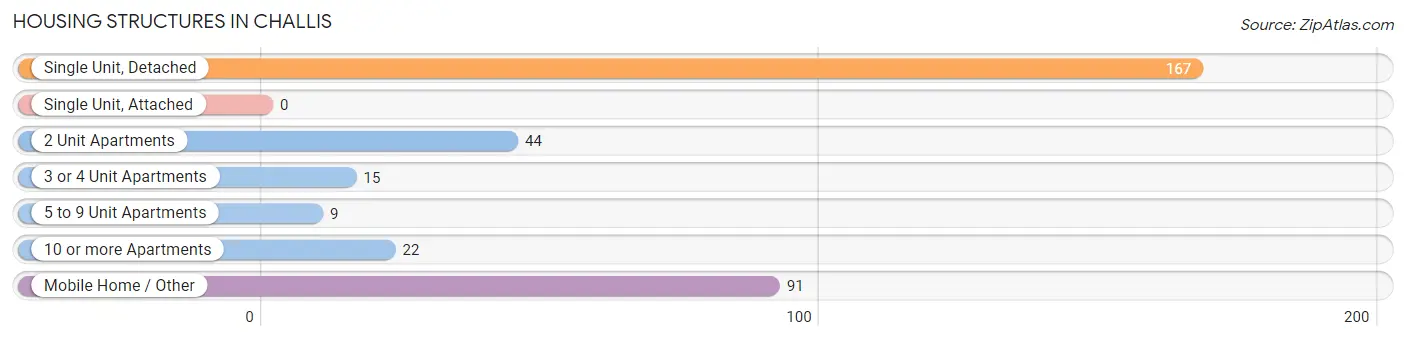
| Structure Type | # Housing Units | % Housing Units |
| Single Unit, Detached | 167 | 48.0% |
| Single Unit, Attached | 0 | 0.0% |
| 2 Unit Apartments | 44 | 12.6% |
| 3 or 4 Unit Apartments | 15 | 4.3% |
| 5 to 9 Unit Apartments | 9 | 2.6% |
| 10 or more Apartments | 22 | 6.3% |
| Mobile Home / Other | 91 | 26.2% |
| Total | 348 | 100.0% |
Housing Structures by Occupancy in Challis
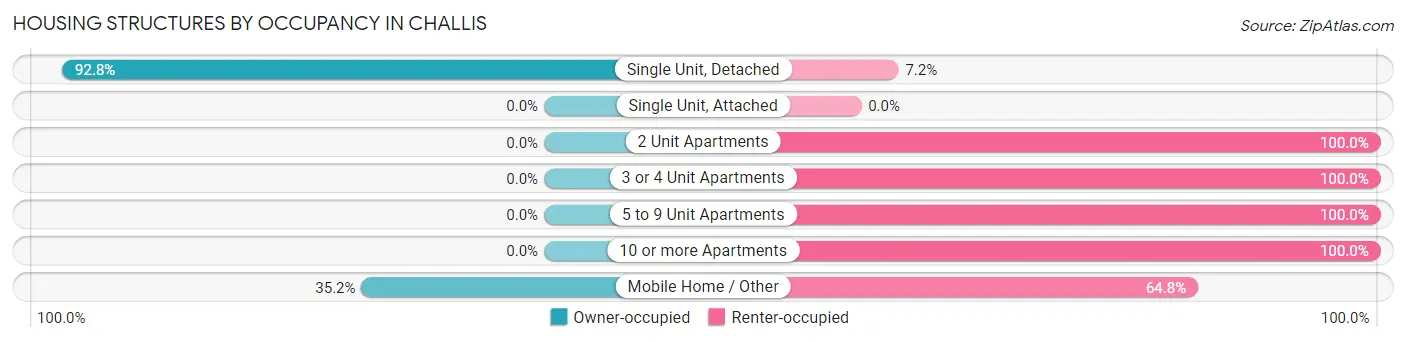
| Structure Type | Owner-occupied | Renter-occupied |
| Single Unit, Detached | 155 (92.8%) | 12 (7.2%) |
| Single Unit, Attached | 0 (0.0%) | 0 (0.0%) |
| 2 Unit Apartments | 0 (0.0%) | 44 (100.0%) |
| 3 or 4 Unit Apartments | 0 (0.0%) | 15 (100.0%) |
| 5 to 9 Unit Apartments | 0 (0.0%) | 9 (100.0%) |
| 10 or more Apartments | 0 (0.0%) | 22 (100.0%) |
| Mobile Home / Other | 32 (35.2%) | 59 (64.8%) |
| Total | 187 (53.7%) | 161 (46.3%) |
Housing Structures by Number of Rooms in Challis
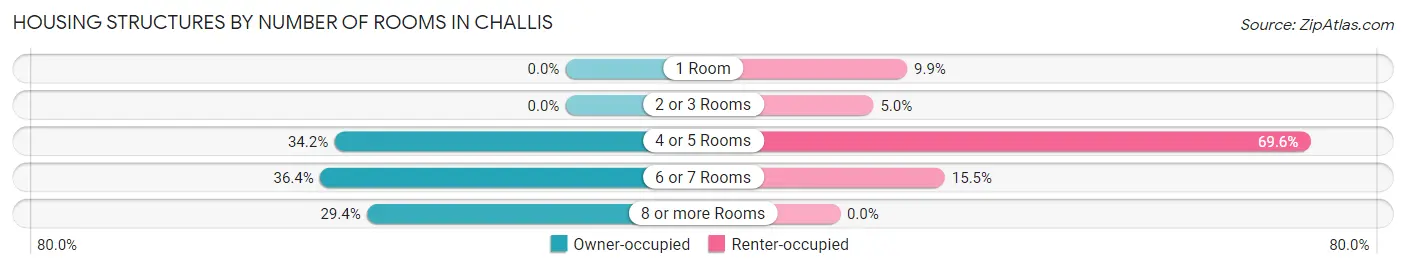
| Number of Rooms | Owner-occupied | Renter-occupied |
| 1 Room | 0 (0.0%) | 16 (9.9%) |
| 2 or 3 Rooms | 0 (0.0%) | 8 (5.0%) |
| 4 or 5 Rooms | 64 (34.2%) | 112 (69.6%) |
| 6 or 7 Rooms | 68 (36.4%) | 25 (15.5%) |
| 8 or more Rooms | 55 (29.4%) | 0 (0.0%) |
| Total | 187 (100.0%) | 161 (100.0%) |
Housing Structure by Heating Type in Challis
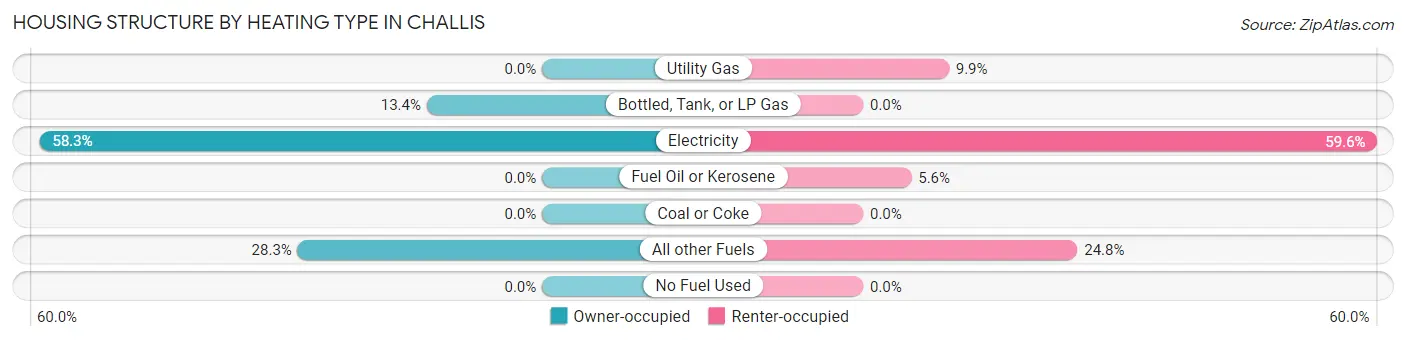
| Heating Type | Owner-occupied | Renter-occupied |
| Utility Gas | 0 (0.0%) | 16 (9.9%) |
| Bottled, Tank, or LP Gas | 25 (13.4%) | 0 (0.0%) |
| Electricity | 109 (58.3%) | 96 (59.6%) |
| Fuel Oil or Kerosene | 0 (0.0%) | 9 (5.6%) |
| Coal or Coke | 0 (0.0%) | 0 (0.0%) |
| All other Fuels | 53 (28.3%) | 40 (24.8%) |
| No Fuel Used | 0 (0.0%) | 0 (0.0%) |
| Total | 187 (100.0%) | 161 (100.0%) |
Household Vehicle Usage in Challis
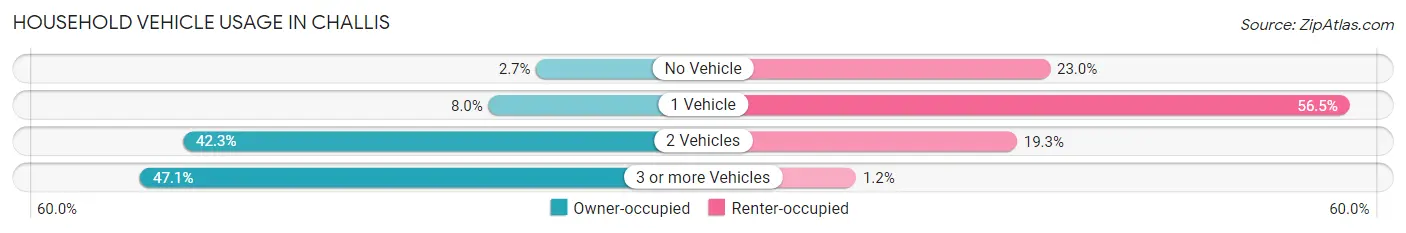
| Vehicles per Household | Owner-occupied | Renter-occupied |
| No Vehicle | 5 (2.7%) | 37 (23.0%) |
| 1 Vehicle | 15 (8.0%) | 91 (56.5%) |
| 2 Vehicles | 79 (42.2%) | 31 (19.3%) |
| 3 or more Vehicles | 88 (47.1%) | 2 (1.2%) |
| Total | 187 (100.0%) | 161 (100.0%) |
Real Estate & Mortgages in Challis
Real Estate and Mortgage Overview in Challis
| Characteristic | Without Mortgage | With Mortgage |
| Housing Units | 61 | 126 |
| Median Property Value | $135,400 | $191,900 |
| Median Household Income | $54,250 | $3 |
| Monthly Housing Costs | $293 | $0 |
| Real Estate Taxes | $474 | $0 |
Property Value by Mortgage Status in Challis
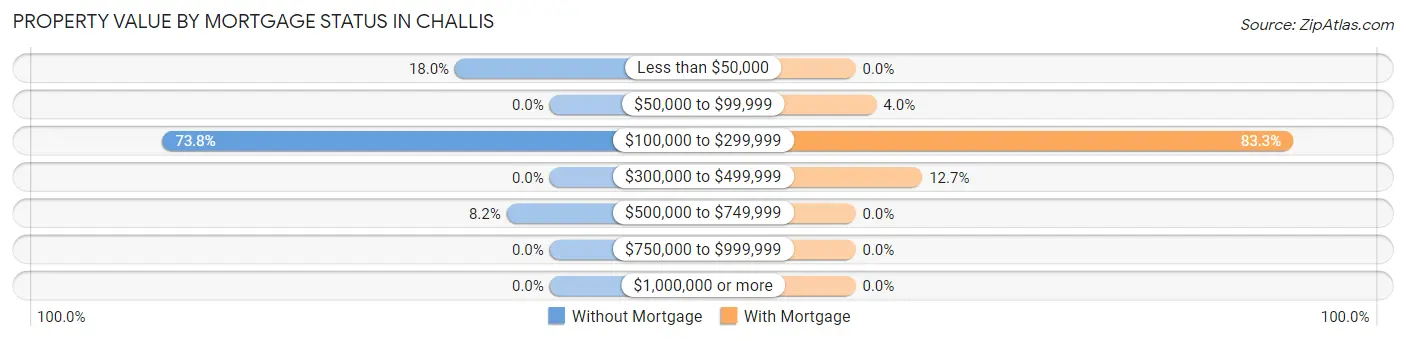
| Property Value | Without Mortgage | With Mortgage |
| Less than $50,000 | 11 (18.0%) | 0 (0.0%) |
| $50,000 to $99,999 | 0 (0.0%) | 5 (4.0%) |
| $100,000 to $299,999 | 45 (73.8%) | 105 (83.3%) |
| $300,000 to $499,999 | 0 (0.0%) | 16 (12.7%) |
| $500,000 to $749,999 | 5 (8.2%) | 0 (0.0%) |
| $750,000 to $999,999 | 0 (0.0%) | 0 (0.0%) |
| $1,000,000 or more | 0 (0.0%) | 0 (0.0%) |
| Total | 61 (100.0%) | 126 (100.0%) |
Household Income by Mortgage Status in Challis
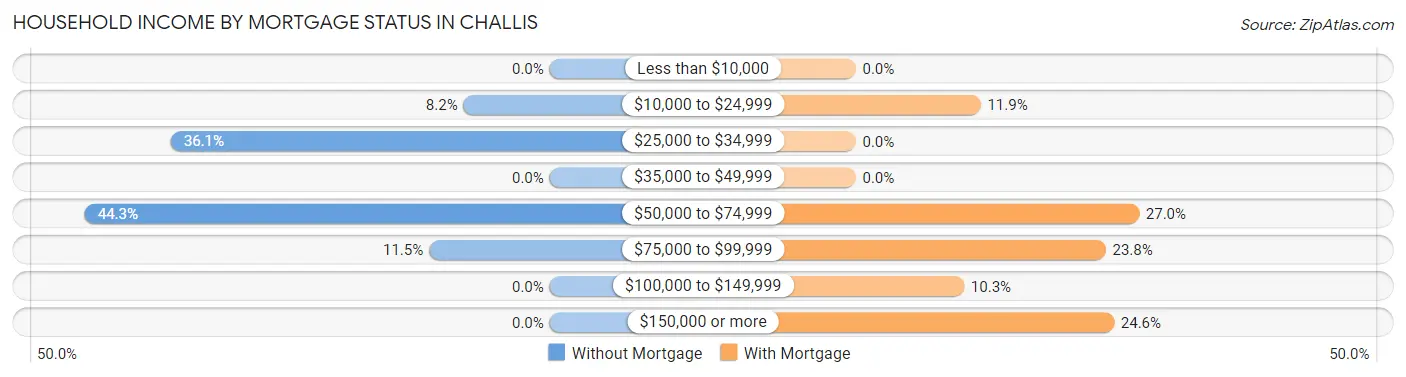
| Household Income | Without Mortgage | With Mortgage |
| Less than $10,000 | 0 (0.0%) | 0 (0.0%) |
| $10,000 to $24,999 | 5 (8.2%) | 15 (11.9%) |
| $25,000 to $34,999 | 22 (36.1%) | 0 (0.0%) |
| $35,000 to $49,999 | 0 (0.0%) | 0 (0.0%) |
| $50,000 to $74,999 | 27 (44.3%) | 34 (27.0%) |
| $75,000 to $99,999 | 7 (11.5%) | 30 (23.8%) |
| $100,000 to $149,999 | 0 (0.0%) | 13 (10.3%) |
| $150,000 or more | 0 (0.0%) | 31 (24.6%) |
| Total | 61 (100.0%) | 126 (100.0%) |
Property Value to Household Income Ratio in Challis
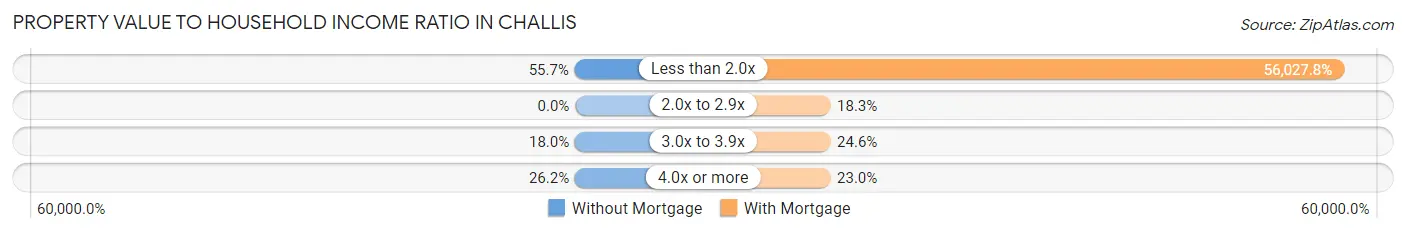
| Value-to-Income Ratio | Without Mortgage | With Mortgage |
| Less than 2.0x | 34 (55.7%) | 70,595 (56,027.8%) |
| 2.0x to 2.9x | 0 (0.0%) | 23 (18.2%) |
| 3.0x to 3.9x | 11 (18.0%) | 31 (24.6%) |
| 4.0x or more | 16 (26.2%) | 29 (23.0%) |
| Total | 61 (100.0%) | 126 (100.0%) |
Real Estate Taxes by Mortgage Status in Challis
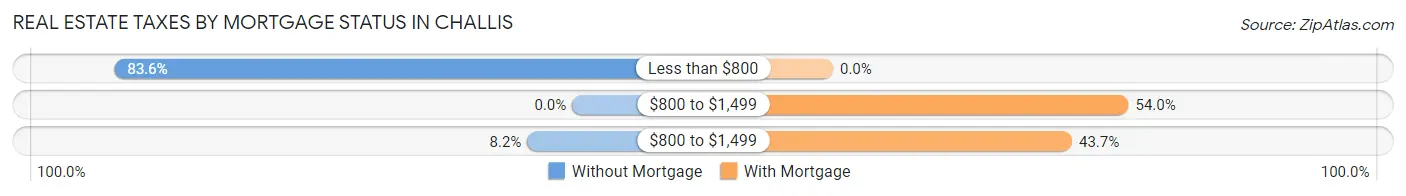
| Property Taxes | Without Mortgage | With Mortgage |
| Less than $800 | 51 (83.6%) | 0 (0.0%) |
| $800 to $1,499 | 0 (0.0%) | 68 (54.0%) |
| $800 to $1,499 | 5 (8.2%) | 55 (43.6%) |
| Total | 61 (100.0%) | 126 (100.0%) |
Health & Disability in Challis
Health Insurance Coverage by Age in Challis
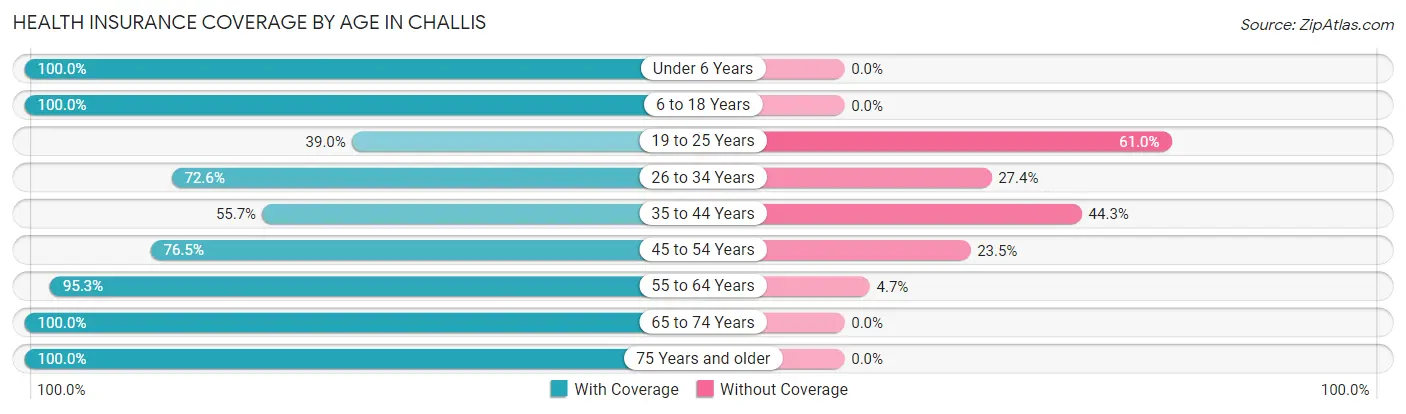
| Age Bracket | With Coverage | Without Coverage |
| Under 6 Years | 63 (100.0%) | 0 (0.0%) |
| 6 to 18 Years | 184 (100.0%) | 0 (0.0%) |
| 19 to 25 Years | 16 (39.0%) | 25 (61.0%) |
| 26 to 34 Years | 53 (72.6%) | 20 (27.4%) |
| 35 to 44 Years | 68 (55.7%) | 54 (44.3%) |
| 45 to 54 Years | 101 (76.5%) | 31 (23.5%) |
| 55 to 64 Years | 101 (95.3%) | 5 (4.7%) |
| 65 to 74 Years | 84 (100.0%) | 0 (0.0%) |
| 75 Years and older | 20 (100.0%) | 0 (0.0%) |
| Total | 690 (83.6%) | 135 (16.4%) |
Health Insurance Coverage by Citizenship Status in Challis
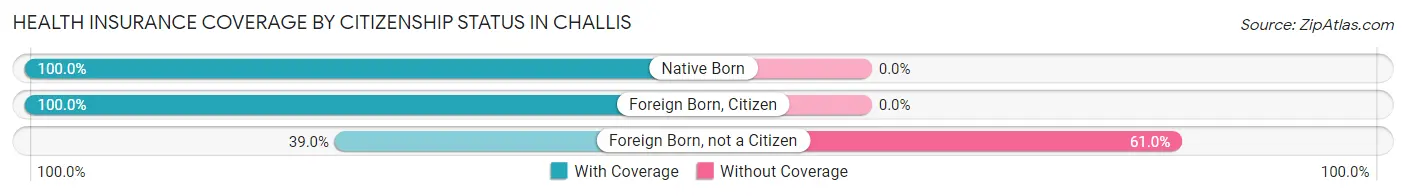
| Citizenship Status | With Coverage | Without Coverage |
| Native Born | 63 (100.0%) | 0 (0.0%) |
| Foreign Born, Citizen | 184 (100.0%) | 0 (0.0%) |
| Foreign Born, not a Citizen | 16 (39.0%) | 25 (61.0%) |
Health Insurance Coverage by Household Income in Challis
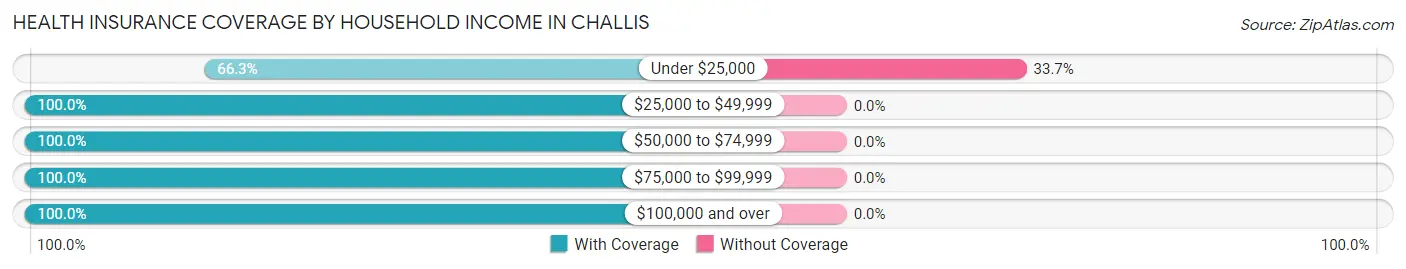
| Household Income | With Coverage | Without Coverage |
| Under $25,000 | 187 (66.3%) | 95 (33.7%) |
| $25,000 to $49,999 | 102 (100.0%) | 0 (0.0%) |
| $50,000 to $74,999 | 165 (100.0%) | 0 (0.0%) |
| $75,000 to $99,999 | 77 (100.0%) | 0 (0.0%) |
| $100,000 and over | 159 (100.0%) | 0 (0.0%) |
Public vs Private Health Insurance Coverage by Age in Challis
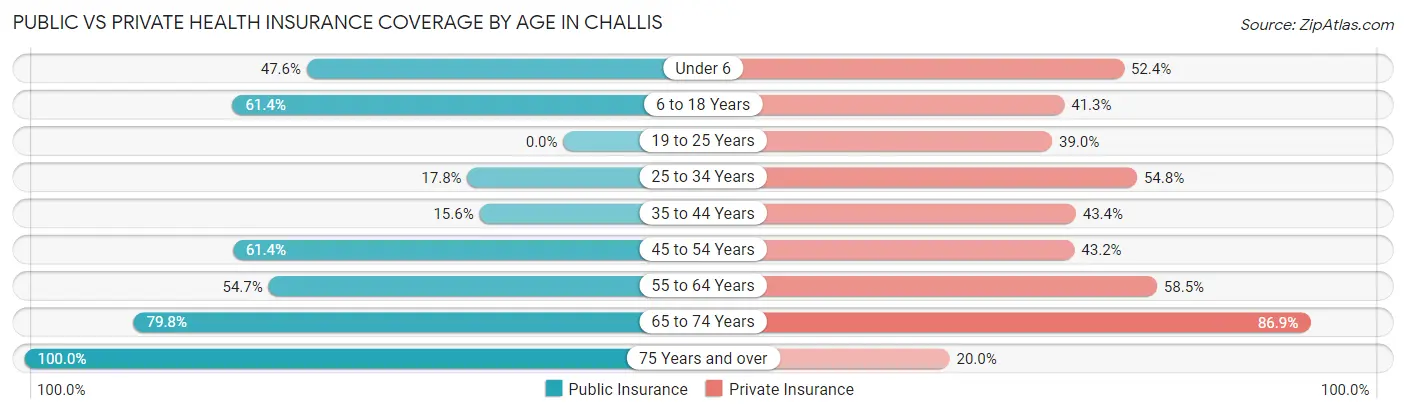
| Age Bracket | Public Insurance | Private Insurance |
| Under 6 | 30 (47.6%) | 33 (52.4%) |
| 6 to 18 Years | 113 (61.4%) | 76 (41.3%) |
| 19 to 25 Years | 0 (0.0%) | 16 (39.0%) |
| 25 to 34 Years | 13 (17.8%) | 40 (54.8%) |
| 35 to 44 Years | 19 (15.6%) | 53 (43.4%) |
| 45 to 54 Years | 81 (61.4%) | 57 (43.2%) |
| 55 to 64 Years | 58 (54.7%) | 62 (58.5%) |
| 65 to 74 Years | 67 (79.8%) | 73 (86.9%) |
| 75 Years and over | 20 (100.0%) | 4 (20.0%) |
| Total | 401 (48.6%) | 414 (50.2%) |
Disability Status by Sex by Age in Challis
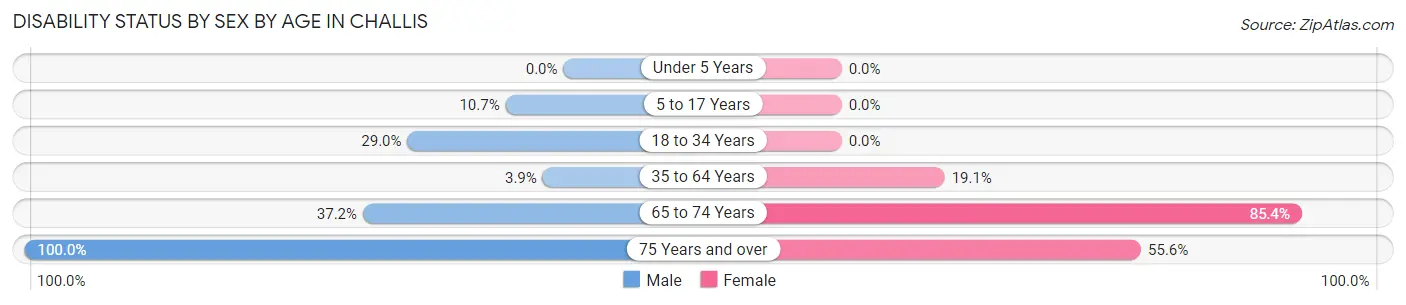
| Age Bracket | Male | Female |
| Under 5 Years | 0 (0.0%) | 0 (0.0%) |
| 5 to 17 Years | 13 (10.7%) | 0 (0.0%) |
| 18 to 34 Years | 11 (28.9%) | 0 (0.0%) |
| 35 to 64 Years | 7 (3.8%) | 34 (19.1%) |
| 65 to 74 Years | 16 (37.2%) | 35 (85.4%) |
| 75 Years and over | 11 (100.0%) | 5 (55.6%) |
Disability Class by Sex by Age in Challis
Disability Class: Hearing Difficulty
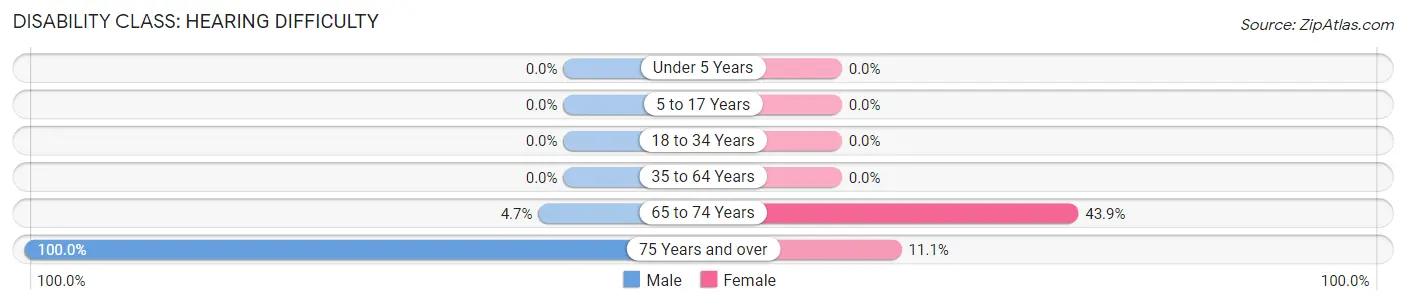
| Age Bracket | Male | Female |
| Under 5 Years | 0 (0.0%) | 0 (0.0%) |
| 5 to 17 Years | 0 (0.0%) | 0 (0.0%) |
| 18 to 34 Years | 0 (0.0%) | 0 (0.0%) |
| 35 to 64 Years | 0 (0.0%) | 0 (0.0%) |
| 65 to 74 Years | 2 (4.6%) | 18 (43.9%) |
| 75 Years and over | 11 (100.0%) | 1 (11.1%) |
Disability Class: Vision Difficulty
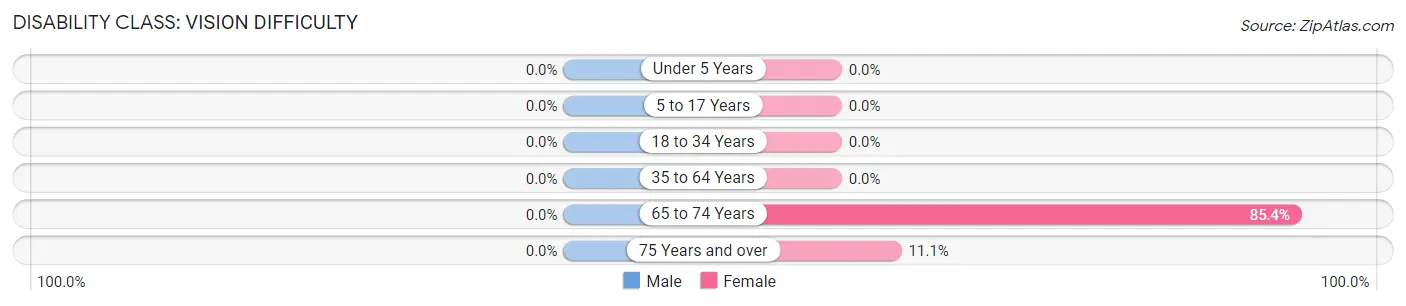
| Age Bracket | Male | Female |
| Under 5 Years | 0 (0.0%) | 0 (0.0%) |
| 5 to 17 Years | 0 (0.0%) | 0 (0.0%) |
| 18 to 34 Years | 0 (0.0%) | 0 (0.0%) |
| 35 to 64 Years | 0 (0.0%) | 0 (0.0%) |
| 65 to 74 Years | 0 (0.0%) | 35 (85.4%) |
| 75 Years and over | 0 (0.0%) | 1 (11.1%) |
Disability Class: Cognitive Difficulty
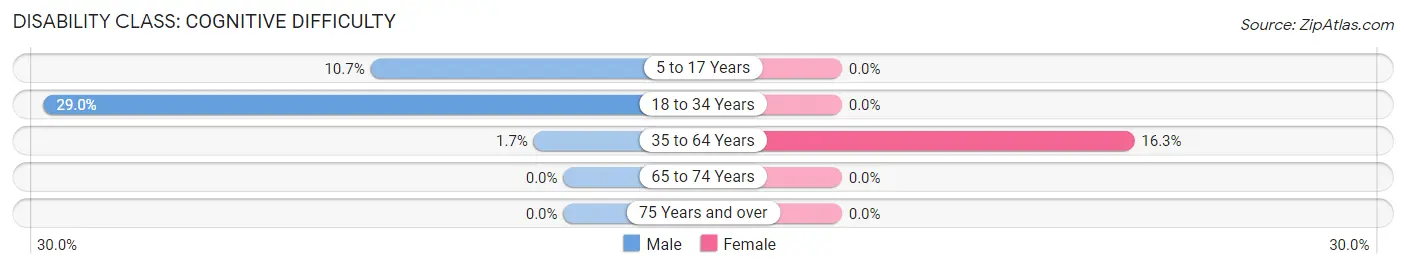
| Age Bracket | Male | Female |
| 5 to 17 Years | 13 (10.7%) | 0 (0.0%) |
| 18 to 34 Years | 11 (28.9%) | 0 (0.0%) |
| 35 to 64 Years | 3 (1.7%) | 29 (16.3%) |
| 65 to 74 Years | 0 (0.0%) | 0 (0.0%) |
| 75 Years and over | 0 (0.0%) | 0 (0.0%) |
Disability Class: Ambulatory Difficulty
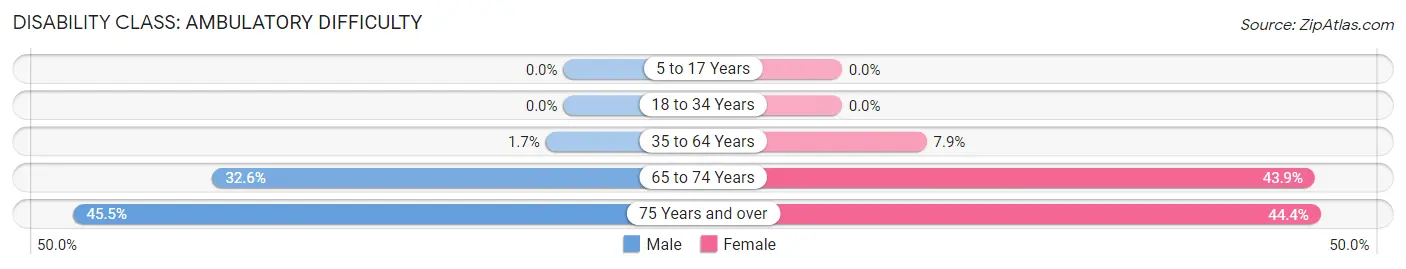
| Age Bracket | Male | Female |
| 5 to 17 Years | 0 (0.0%) | 0 (0.0%) |
| 18 to 34 Years | 0 (0.0%) | 0 (0.0%) |
| 35 to 64 Years | 3 (1.7%) | 14 (7.9%) |
| 65 to 74 Years | 14 (32.6%) | 18 (43.9%) |
| 75 Years and over | 5 (45.5%) | 4 (44.4%) |
Disability Class: Self-Care Difficulty
| Age Bracket | Male | Female |
| 5 to 17 Years | 0 (0.0%) | 0 (0.0%) |
| 18 to 34 Years | 0 (0.0%) | 0 (0.0%) |
| 35 to 64 Years | 4 (2.2%) | 0 (0.0%) |
| 65 to 74 Years | 0 (0.0%) | 0 (0.0%) |
| 75 Years and over | 0 (0.0%) | 0 (0.0%) |
Technology Access in Challis
Computing Device Access in Challis
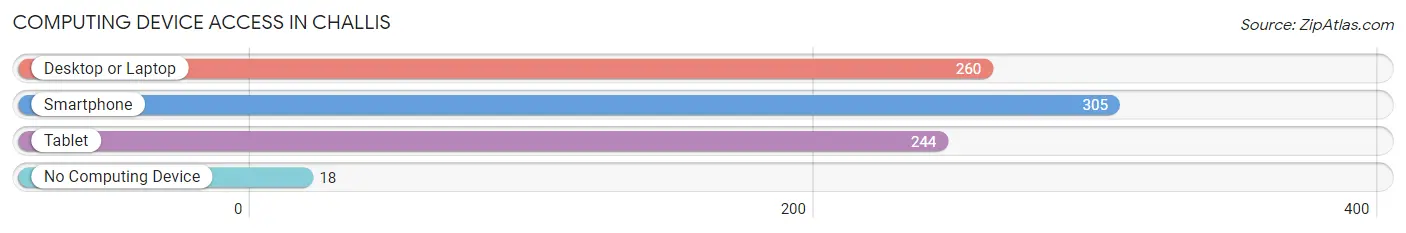
| Device Type | # Households | % Households |
| Desktop or Laptop | 260 | 74.7% |
| Smartphone | 305 | 87.6% |
| Tablet | 244 | 70.1% |
| No Computing Device | 18 | 5.2% |
| Total | 348 | 100.0% |
Internet Access in Challis
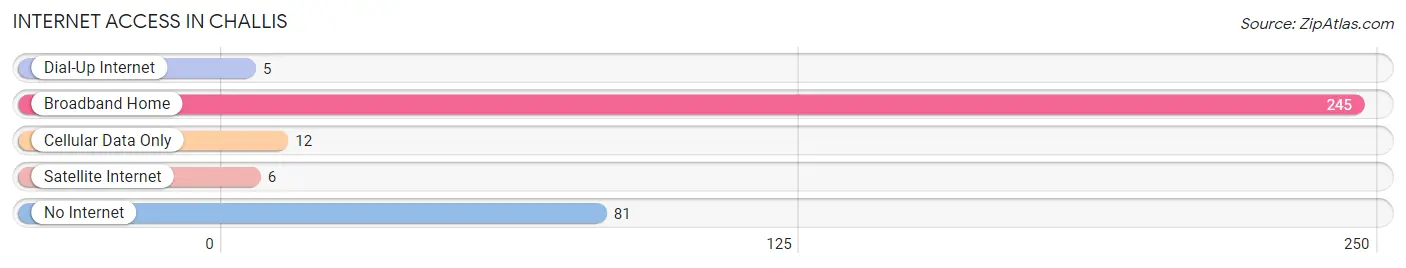
| Internet Type | # Households | % Households |
| Dial-Up Internet | 5 | 1.4% |
| Broadband Home | 245 | 70.4% |
| Cellular Data Only | 12 | 3.5% |
| Satellite Internet | 6 | 1.7% |
| No Internet | 81 | 23.3% |
| Total | 348 | 100.0% |
Challis Summary
Challis is a small town located in Custer County, Idaho, United States. It is situated in the Salmon River Mountains, at an elevation of 5,945 feet (1,812 m). The population was 817 at the 2010 census.
History
The area around Challis was first explored by fur trappers in the early 1800s. The town was founded in 1878 by a group of miners who were searching for gold. The town was named after a local rancher, William Challis, who had a ranch nearby.
The town grew quickly, and by 1880 it had a population of over 500. The town was incorporated in 1883.
In the late 1800s, Challis was a major center for mining and ranching. The town was also a stop on the Oregon Short Line Railroad, which connected it to the rest of the country.
In the early 1900s, the town began to decline as the mining industry declined. The railroad was abandoned in the 1930s, and the population of the town dropped to just over 200 by 1940.
Geography
Challis is located in the Salmon River Mountains, at an elevation of 5,945 feet (1,812 m). The town is situated on the banks of the Salmon River, which flows through the town.
The town is surrounded by mountains, including the Lost River Range to the east, the Lemhi Range to the west, and the White Cloud Mountains to the south.
The climate in Challis is semi-arid, with hot summers and cold winters. The average annual precipitation is 11.5 inches (292 mm).
Economy
The economy of Challis is largely based on tourism and agriculture. The town is a popular destination for outdoor recreation, such as fishing, hunting, and camping.
The town is also home to several small businesses including restaurants stores and a hotel
Demographics
As of the 2010 census, there were 817 people living in Challis. The racial makeup of the town was 95.2% White, 0.2% African American, 0.7% Native American, 0.2% Asian, 0.2% Pacific Islander, 0.7% from other races, and 2.8% from two or more races.
The median household income in Challis was $31,250, and the median family income was $37,500. The per capita income was $17,818. About 15.2% of the population was below the poverty line.
Common Questions
What is Per Capita Income in Challis?
Per Capita income in Challis is $22,174.
What is the Median Family Income in Challis?
Median Family Income in Challis is $61,875.
What is the Median Household income in Challis?
Median Household Income in Challis is $35,921.
What is Income or Wage Gap in Challis?
Income or Wage Gap in Challis is 17.2%.
Women in Challis earn 82.8 cents for every dollar earned by a man.
What is Inequality or Gini Index in Challis?
Inequality or Gini Index in Challis is 0.41.
What is the Total Population of Challis?
Total Population of Challis is 840.
What is the Total Male Population of Challis?
Total Male Population of Challis is 442.
What is the Total Female Population of Challis?
Total Female Population of Challis is 398.
What is the Ratio of Males per 100 Females in Challis?
There are 111.06 Males per 100 Females in Challis.
What is the Ratio of Females per 100 Males in Challis?
There are 90.05 Females per 100 Males in Challis.
What is the Median Population Age in Challis?
Median Population Age in Challis is 38.5 Years.
What is the Average Family Size in Challis
Average Family Size in Challis is 3.6 People.
What is the Average Household Size in Challis
Average Household Size in Challis is 2.3 People.
How Large is the Labor Force in Challis?
There are 373 People in the Labor Forcein in Challis.
What is the Percentage of People in the Labor Force in Challis?
58.8% of People are in the Labor Force in Challis.
What is the Unemployment Rate in Challis?
Unemployment Rate in Challis is 1.3%.