Reubens, ID Map & Demographics
Reubens Map
Reubens Overview
$24,661
PER CAPITA INCOME
$71,250
AVG FAMILY INCOME
$70,938
AVG HOUSEHOLD INCOME
43.1%
WAGE / INCOME GAP [ % ]
56.9¢/ $1
WAGE / INCOME GAP [ $ ]
0.22
INEQUALITY / GINI INDEX
72
TOTAL POPULATION
34
MALE POPULATION
38
FEMALE POPULATION
89.47
MALES / 100 FEMALES
111.76
FEMALES / 100 MALES
28.2
MEDIAN AGE
3.2
AVG FAMILY SIZE
3.1
AVG HOUSEHOLD SIZE
34
LABOR FORCE [ PEOPLE ]
73.9%
PERCENT IN LABOR FORCE
Reubens Zip Codes
Reubens Area Codes
Income in Reubens
Income Overview in Reubens
Per Capita Income in Reubens is $24,661, while median incomes of families and households are $71,250 and $70,938 respectively.
| Characteristic | Number | Measure |
| Per Capita Income | 72 | $24,661 |
| Median Family Income | 19 | $71,250 |
| Mean Family Income | 19 | $76,953 |
| Median Household Income | 23 | $70,938 |
| Mean Household Income | 23 | $79,157 |
| Income Deficit | 19 | $0 |
| Wage / Income Gap (%) | 72 | 43.11% |
| Wage / Income Gap ($) | 72 | 56.89¢ per $1 |
| Gini / Inequality Index | 72 | 0.22 |
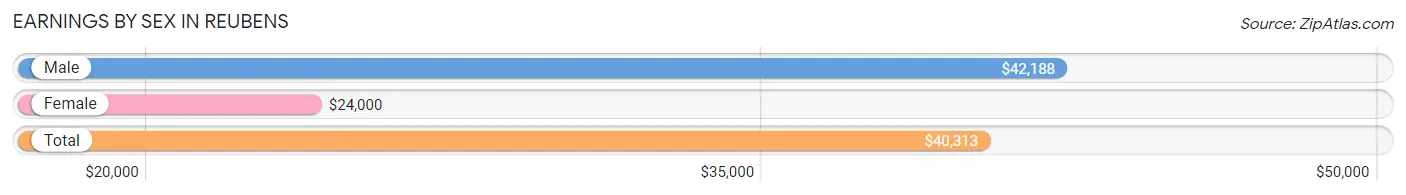
Earnings by Sex in Reubens
Average Earnings in Reubens are $40,313, $42,188 for men and $24,000 for women, a difference of 43.1%.
| Sex | Number | Average Earnings |
| Male | 19 (54.3%) | $42,188 |
| Female | 16 (45.7%) | $24,000 |
| Total | 35 (100.0%) | $40,313 |
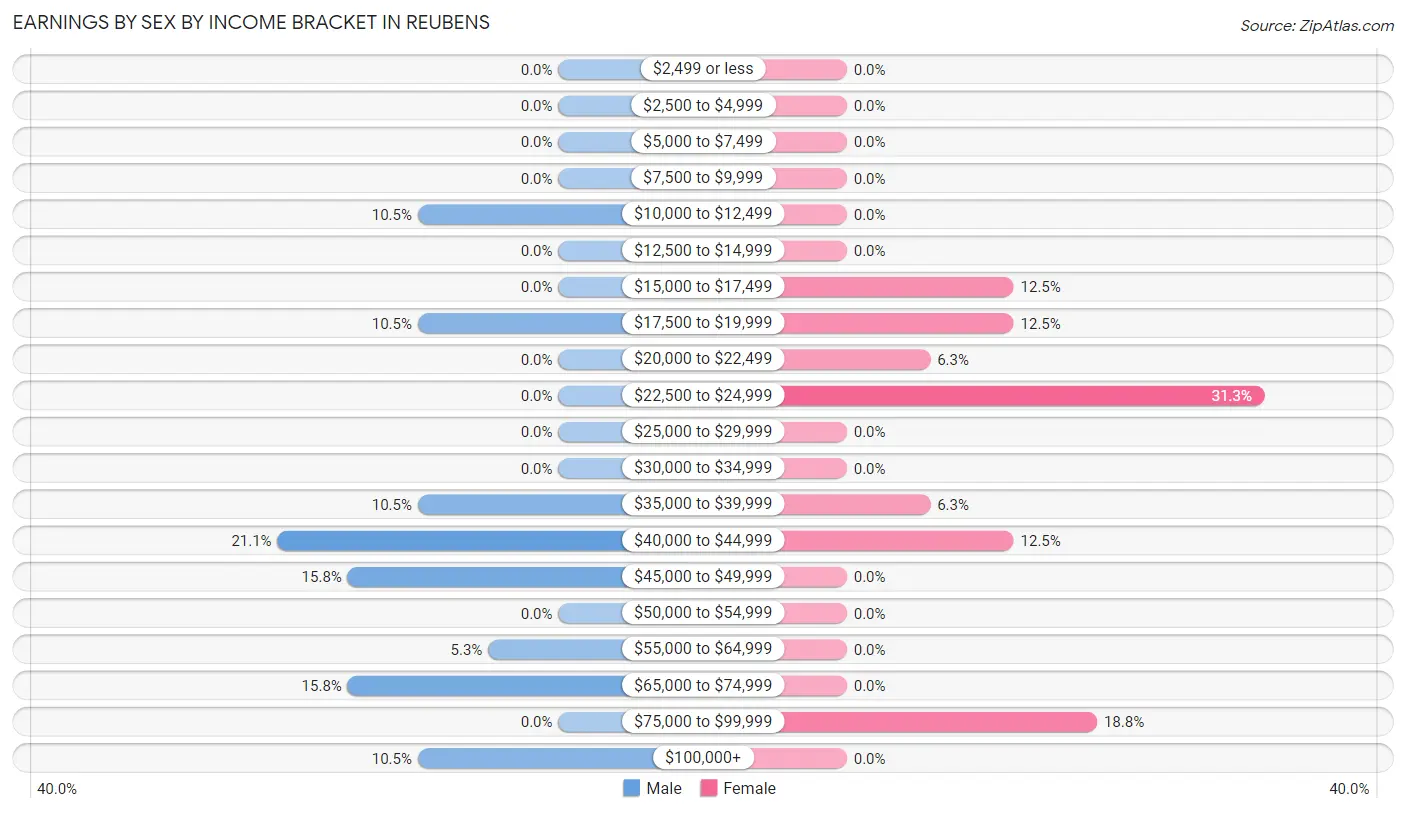
Earnings by Sex by Income Bracket in Reubens
The most common earnings brackets in Reubens are $40,000 to $44,999 for men (4 | 21.0%) and $22,500 to $24,999 for women (5 | 31.2%).
| Income | Male | Female |
| $2,499 or less | 0 (0.0%) | 0 (0.0%) |
| $2,500 to $4,999 | 0 (0.0%) | 0 (0.0%) |
| $5,000 to $7,499 | 0 (0.0%) | 0 (0.0%) |
| $7,500 to $9,999 | 0 (0.0%) | 0 (0.0%) |
| $10,000 to $12,499 | 2 (10.5%) | 0 (0.0%) |
| $12,500 to $14,999 | 0 (0.0%) | 0 (0.0%) |
| $15,000 to $17,499 | 0 (0.0%) | 2 (12.5%) |
| $17,500 to $19,999 | 2 (10.5%) | 2 (12.5%) |
| $20,000 to $22,499 | 0 (0.0%) | 1 (6.2%) |
| $22,500 to $24,999 | 0 (0.0%) | 5 (31.2%) |
| $25,000 to $29,999 | 0 (0.0%) | 0 (0.0%) |
| $30,000 to $34,999 | 0 (0.0%) | 0 (0.0%) |
| $35,000 to $39,999 | 2 (10.5%) | 1 (6.2%) |
| $40,000 to $44,999 | 4 (21.0%) | 2 (12.5%) |
| $45,000 to $49,999 | 3 (15.8%) | 0 (0.0%) |
| $50,000 to $54,999 | 0 (0.0%) | 0 (0.0%) |
| $55,000 to $64,999 | 1 (5.3%) | 0 (0.0%) |
| $65,000 to $74,999 | 3 (15.8%) | 0 (0.0%) |
| $75,000 to $99,999 | 0 (0.0%) | 3 (18.8%) |
| $100,000+ | 2 (10.5%) | 0 (0.0%) |
| Total | 19 (100.0%) | 16 (100.0%) |
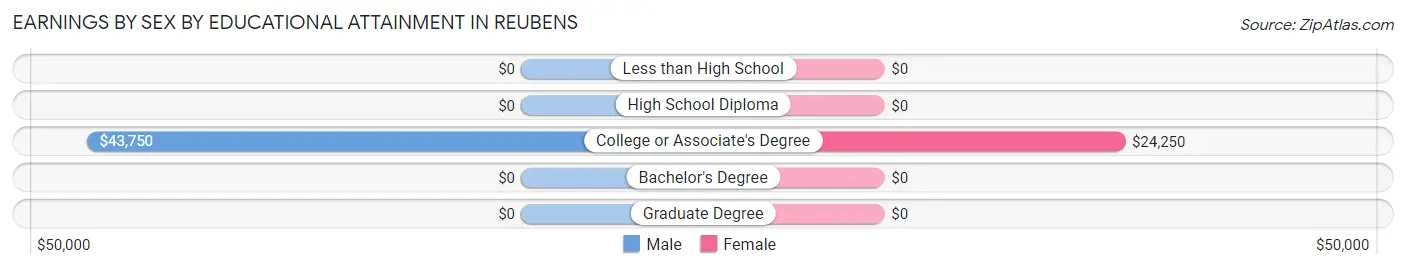
Earnings by Sex by Educational Attainment in Reubens
Average earnings in Reubens are $46,250 for men and $24,000 for women, a difference of 48.1%. Men with an educational attainment of college or associate's degree enjoy the highest average annual earnings of $43,750, while those with college or associate's degree education earn the least with $43,750. Women with an educational attainment of college or associate's degree earn the most with the average annual earnings of $24,250, while those with college or associate's degree education have the smallest earnings of $24,250.
| Educational Attainment | Male Income | Female Income |
| Less than High School | - | - |
| High School Diploma | - | - |
| College or Associate's Degree | $43,750 | $24,250 |
| Bachelor's Degree | - | - |
| Graduate Degree | - | - |
| Total | $46,250 | $24,000 |
Family Income in Reubens
Family Income Brackets in Reubens
According to the Reubens family income data, there are 7 families falling into the $35,000 to $49,999 income range, which is the most common income bracket and makes up 36.8% of all families.
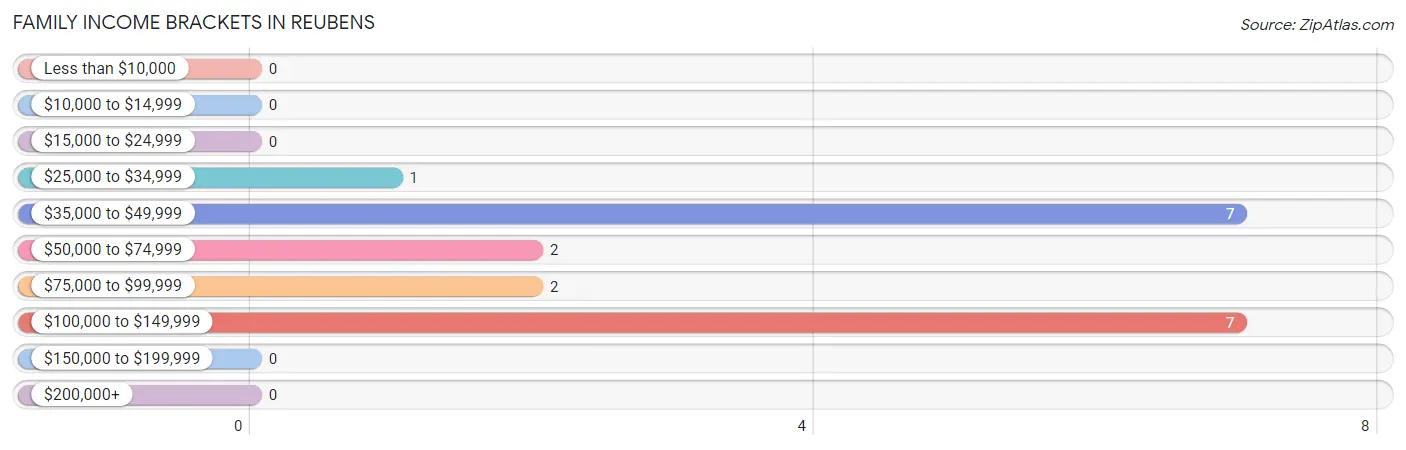
| Income Bracket | # Families | % Families |
| Less than $10,000 | 0 | 0.0% |
| $10,000 to $14,999 | 0 | 0.0% |
| $15,000 to $24,999 | 0 | 0.0% |
| $25,000 to $34,999 | 1 | 5.3% |
| $35,000 to $49,999 | 7 | 36.8% |
| $50,000 to $74,999 | 2 | 10.5% |
| $75,000 to $99,999 | 2 | 10.5% |
| $100,000 to $149,999 | 7 | 36.8% |
| $150,000 to $199,999 | 0 | 0.0% |
| $200,000+ | 0 | 0.0% |
Family Income by Famaliy Size in Reubens
2-person families (8 | 42.1%) account for the highest median family income in Reubens with $52,500 per family, while 2-person families (8 | 42.1%) have the highest median income of $26,250 per family member.
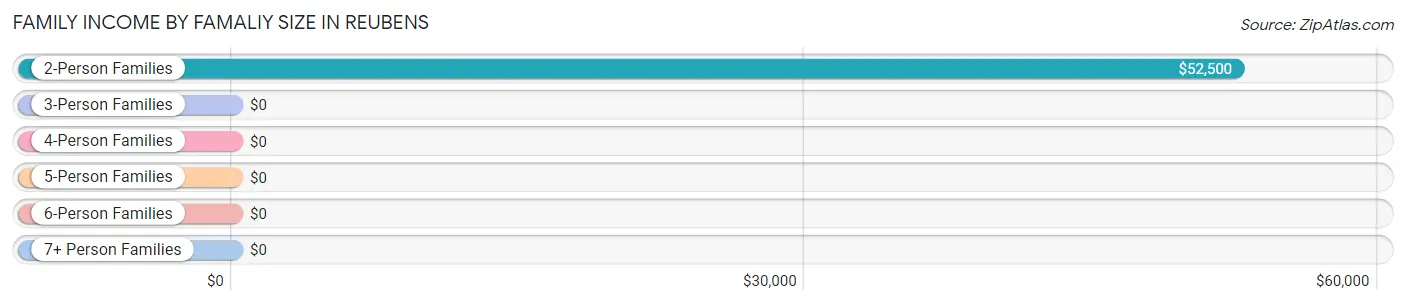
| Income Bracket | # Families | Median Income |
| 2-Person Families | 8 (42.1%) | $52,500 |
| 3-Person Families | 5 (26.3%) | $0 |
| 4-Person Families | 0 (0.0%) | $0 |
| 5-Person Families | 6 (31.6%) | $0 |
| 6-Person Families | 0 (0.0%) | $0 |
| 7+ Person Families | 0 (0.0%) | $0 |
| Total | 19 (100.0%) | $71,250 |
Family Income by Number of Earners in Reubens
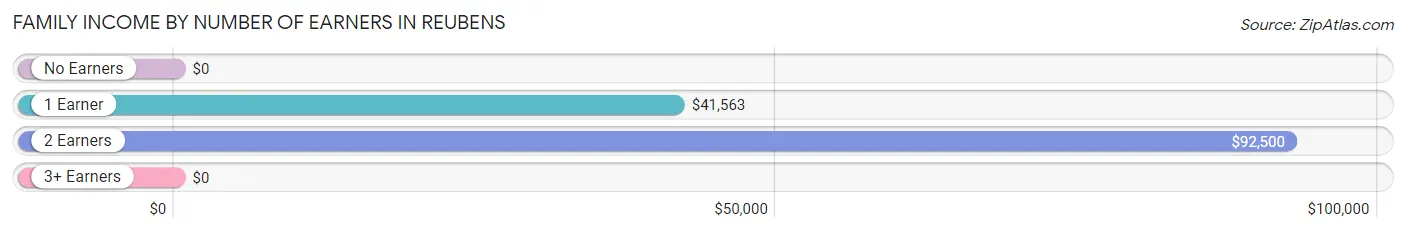
| Number of Earners | # Families | Median Income |
| No Earners | 0 (0.0%) | $0 |
| 1 Earner | 11 (57.9%) | $41,563 |
| 2 Earners | 8 (42.1%) | $92,500 |
| 3+ Earners | 0 (0.0%) | $0 |
| Total | 19 (100.0%) | $71,250 |
Household Income in Reubens
Household Income Brackets in Reubens
With 11 households falling in the category, the $50,000 to $74,999 income range is the most frequent in Reubens, accounting for 47.8% of all households.
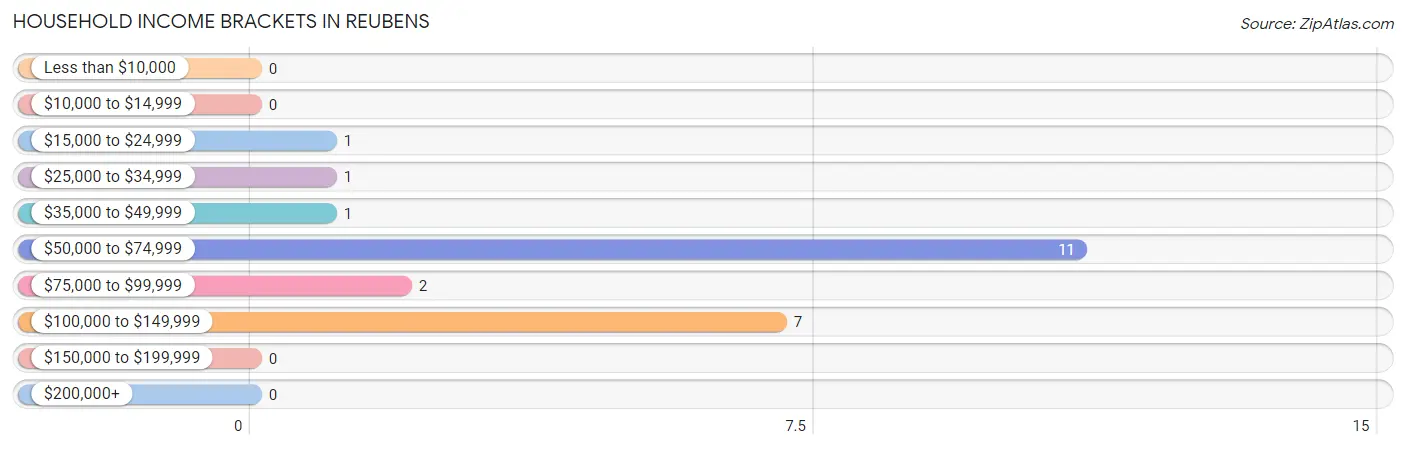
| Income Bracket | # Households | % Households |
| Less than $10,000 | 0 | 0.0% |
| $10,000 to $14,999 | 0 | 0.0% |
| $15,000 to $24,999 | 1 | 4.3% |
| $25,000 to $34,999 | 1 | 4.3% |
| $35,000 to $49,999 | 1 | 4.3% |
| $50,000 to $74,999 | 11 | 47.8% |
| $75,000 to $99,999 | 2 | 8.7% |
| $100,000 to $149,999 | 7 | 30.4% |
| $150,000 to $199,999 | 0 | 0.0% |
| $200,000+ | 0 | 0.0% |
Household Income by Householder Age in Reubens
The median household income in Reubens is $70,938, with the highest median household income of $84,375 found in the 25 to 44 years age bracket for the primary householder. A total of 11 households (47.8%) fall into this category. Meanwhile, the 15 to 24 years age bracket for the primary householder has the lowest median household income of $0, with 2 households (8.7%) in this group.
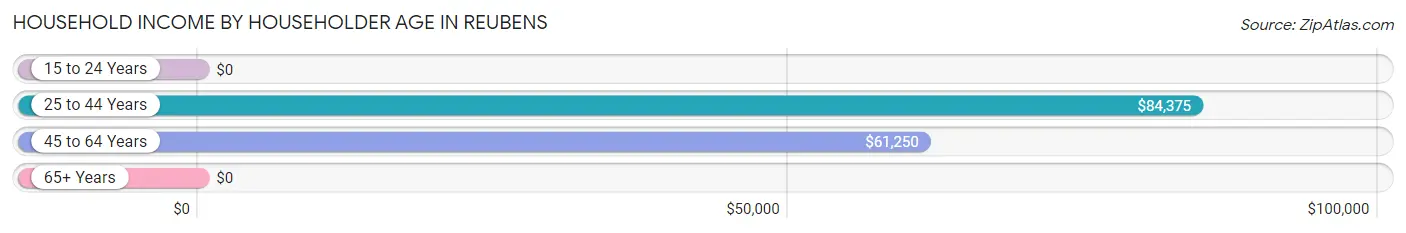
| Income Bracket | # Households | Median Income |
| 15 to 24 Years | 2 (8.7%) | $0 |
| 25 to 44 Years | 11 (47.8%) | $84,375 |
| 45 to 64 Years | 7 (30.4%) | $61,250 |
| 65+ Years | 3 (13.0%) | $0 |
| Total | 23 (100.0%) | $70,938 |
Poverty in Reubens
Income Below Poverty by Sex and Age in Reubens
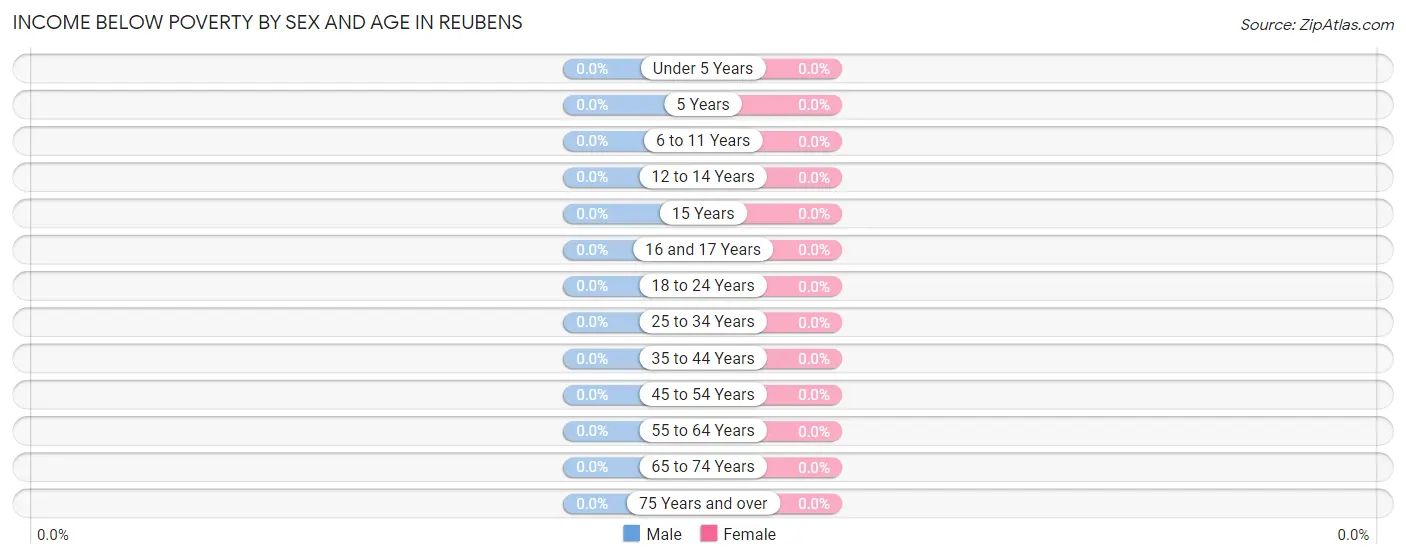
| Age Bracket | Male | Female |
| Under 5 Years | 0 (0.0%) | 0 (0.0%) |
| 5 Years | 0 (0.0%) | 0 (0.0%) |
| 6 to 11 Years | 0 (0.0%) | 0 (0.0%) |
| 12 to 14 Years | 0 (0.0%) | 0 (0.0%) |
| 15 Years | 0 (0.0%) | 0 (0.0%) |
| 16 and 17 Years | 0 (0.0%) | 0 (0.0%) |
| 18 to 24 Years | 0 (0.0%) | 0 (0.0%) |
| 25 to 34 Years | 0 (0.0%) | 0 (0.0%) |
| 35 to 44 Years | 0 (0.0%) | 0 (0.0%) |
| 45 to 54 Years | 0 (0.0%) | 0 (0.0%) |
| 55 to 64 Years | 0 (0.0%) | 0 (0.0%) |
| 65 to 74 Years | 0 (0.0%) | 0 (0.0%) |
| 75 Years and over | 0 (0.0%) | 0 (0.0%) |
| Total | 0 (0.0%) | 0 (0.0%) |
Income Above Poverty by Sex and Age in Reubens
According to the poverty statistics in Reubens, males aged 5 years and females aged under 5 years are the age groups that are most secure financially, with 100.0% of males and 100.0% of females in these age groups living above the poverty line.
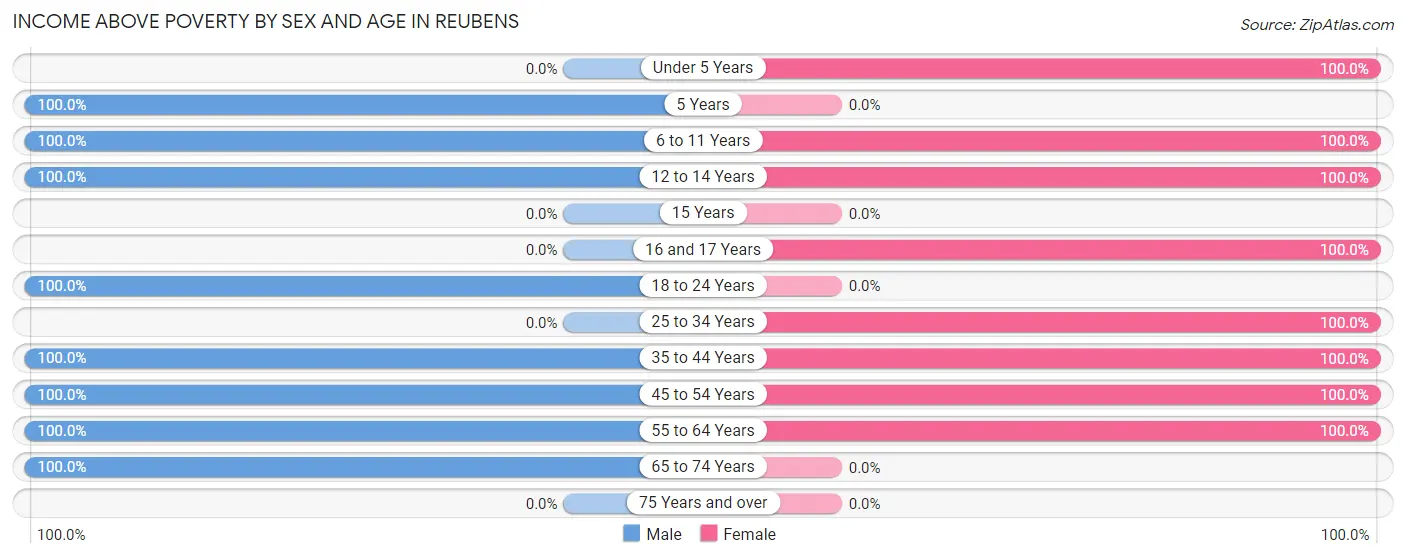
| Age Bracket | Male | Female |
| Under 5 Years | 0 (0.0%) | 2 (100.0%) |
| 5 Years | 2 (100.0%) | 0 (0.0%) |
| 6 to 11 Years | 3 (100.0%) | 4 (100.0%) |
| 12 to 14 Years | 6 (100.0%) | 9 (100.0%) |
| 15 Years | 0 (0.0%) | 0 (0.0%) |
| 16 and 17 Years | 0 (0.0%) | 3 (100.0%) |
| 18 to 24 Years | 4 (100.0%) | 0 (0.0%) |
| 25 to 34 Years | 0 (0.0%) | 9 (100.0%) |
| 35 to 44 Years | 11 (100.0%) | 2 (100.0%) |
| 45 to 54 Years | 2 (100.0%) | 3 (100.0%) |
| 55 to 64 Years | 2 (100.0%) | 6 (100.0%) |
| 65 to 74 Years | 4 (100.0%) | 0 (0.0%) |
| 75 Years and over | 0 (0.0%) | 0 (0.0%) |
| Total | 34 (100.0%) | 38 (100.0%) |
Income Below Poverty Among Married-Couple Families in Reubens
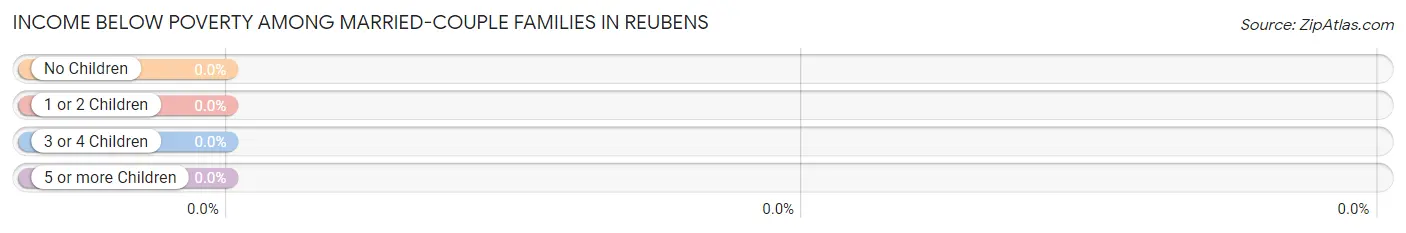
| Children | Above Poverty | Below Poverty |
| No Children | 5 (100.0%) | 0 (0.0%) |
| 1 or 2 Children | 2 (100.0%) | 0 (0.0%) |
| 3 or 4 Children | 2 (100.0%) | 0 (0.0%) |
| 5 or more Children | 0 (0.0%) | 0 (0.0%) |
| Total | 9 (100.0%) | 0 (0.0%) |
Income Below Poverty Among Single-Parent Households in Reubens
| Children | Single Father | Single Mother |
| No Children | 0 (0.0%) | 0 (0.0%) |
| 1 or 2 Children | 0 (0.0%) | 0 (0.0%) |
| 3 or 4 Children | 0 (0.0%) | 0 (0.0%) |
| 5 or more Children | 0 (0.0%) | 0 (0.0%) |
| Total | 0 (0.0%) | 0 (0.0%) |
Income Below Poverty Among Married-Couple vs Single-Parent Households in Reubens
| Children | Married-Couple Families | Single-Parent Households |
| No Children | 0 (0.0%) | 0 (0.0%) |
| 1 or 2 Children | 0 (0.0%) | 0 (0.0%) |
| 3 or 4 Children | 0 (0.0%) | 0 (0.0%) |
| 5 or more Children | 0 (0.0%) | 0 (0.0%) |
| Total | 0 (0.0%) | 0 (0.0%) |
Race in Reubens
The most populous races in Reubens are White / Caucasian (64 | 88.9%), and Two or more Races (8 | 11.1%).
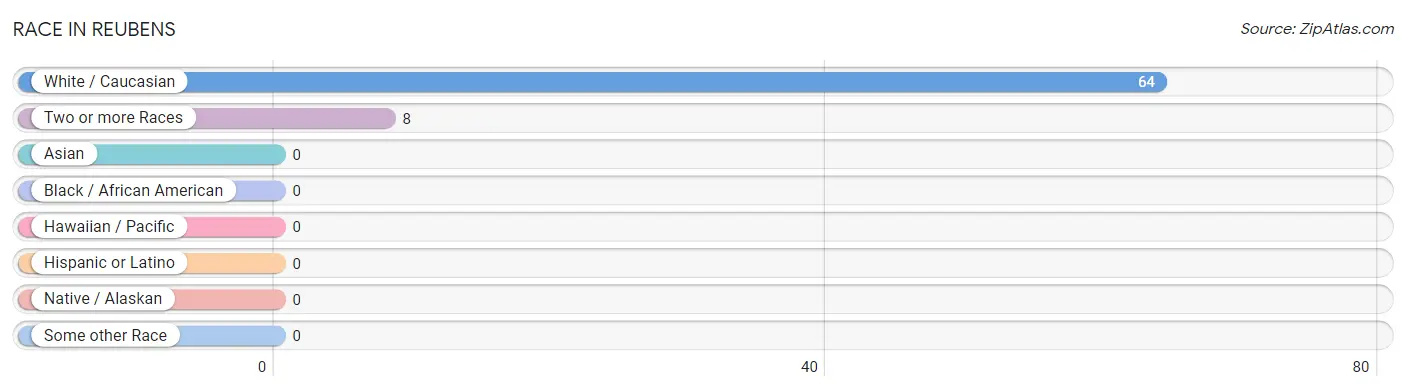
| Race | # Population | % Population |
| Asian | 0 | 0.0% |
| Black / African American | 0 | 0.0% |
| Hawaiian / Pacific | 0 | 0.0% |
| Hispanic or Latino | 0 | 0.0% |
| Native / Alaskan | 0 | 0.0% |
| White / Caucasian | 64 | 88.9% |
| Two or more Races | 8 | 11.1% |
| Some other Race | 0 | 0.0% |
| Total | 72 | 100.0% |
Ancestry in Reubens
The most populous ancestries reported in Reubens are American (6 | 8.3%), English (4 | 5.6%), French (2 | 2.8%), German (1 | 1.4%), and Irish (1 | 1.4%), together accounting for 19.4% of all Reubens residents.
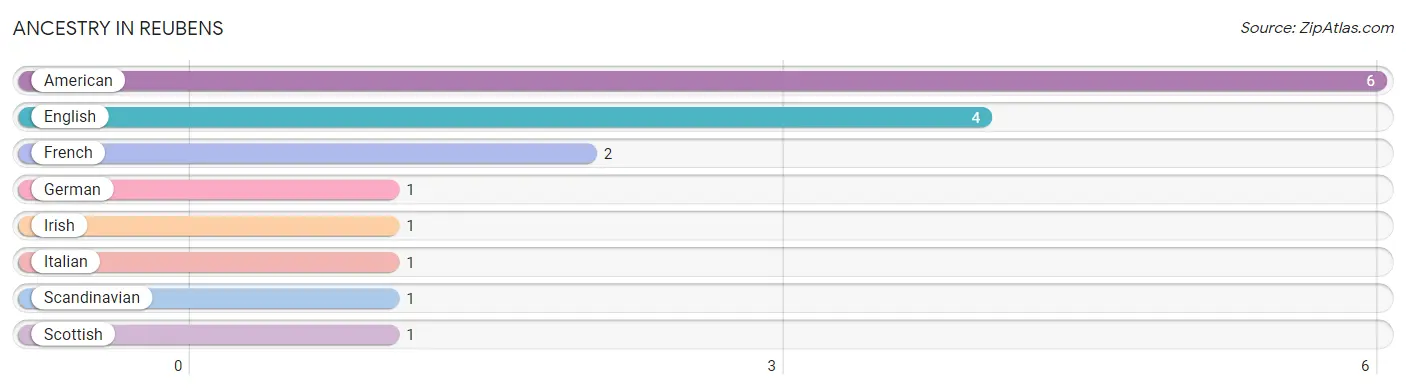
| Ancestry | # Population | % Population |
| American | 6 | 8.3% |
| English | 4 | 5.6% |
| French | 2 | 2.8% |
| German | 1 | 1.4% |
| Irish | 1 | 1.4% |
| Italian | 1 | 1.4% |
| Scandinavian | 1 | 1.4% |
| Scottish | 1 | 1.4% | View All 8 Rows |
Immigrants in Reubens

| Immigration Origin | # Population | % Population | View All 0 Rows |
Sex and Age in Reubens
Sex and Age in Reubens
The most populous age groups in Reubens are 10 to 14 Years (9 | 26.5%) for men and 10 to 14 Years (9 | 23.7%) for women.
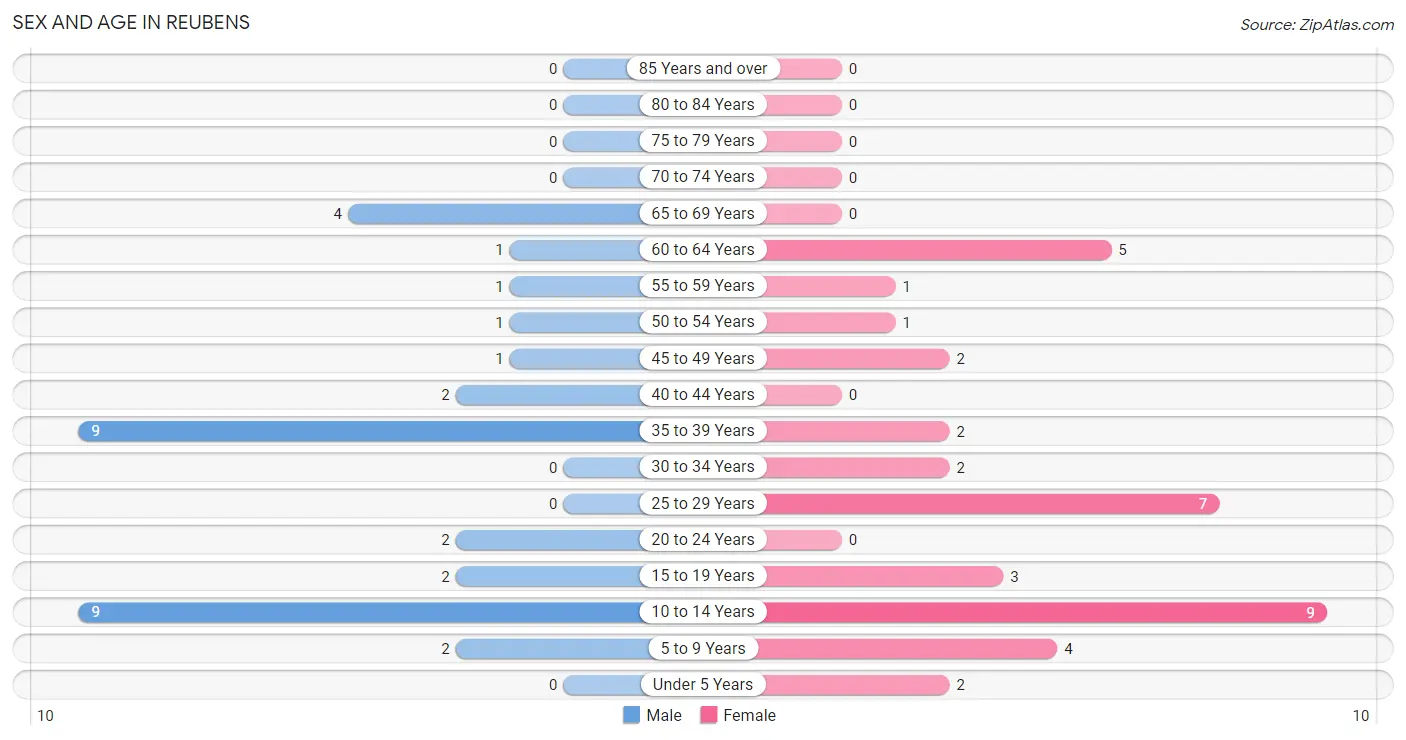
| Age Bracket | Male | Female |
| Under 5 Years | 0 (0.0%) | 2 (5.3%) |
| 5 to 9 Years | 2 (5.9%) | 4 (10.5%) |
| 10 to 14 Years | 9 (26.5%) | 9 (23.7%) |
| 15 to 19 Years | 2 (5.9%) | 3 (7.9%) |
| 20 to 24 Years | 2 (5.9%) | 0 (0.0%) |
| 25 to 29 Years | 0 (0.0%) | 7 (18.4%) |
| 30 to 34 Years | 0 (0.0%) | 2 (5.3%) |
| 35 to 39 Years | 9 (26.5%) | 2 (5.3%) |
| 40 to 44 Years | 2 (5.9%) | 0 (0.0%) |
| 45 to 49 Years | 1 (2.9%) | 2 (5.3%) |
| 50 to 54 Years | 1 (2.9%) | 1 (2.6%) |
| 55 to 59 Years | 1 (2.9%) | 1 (2.6%) |
| 60 to 64 Years | 1 (2.9%) | 5 (13.2%) |
| 65 to 69 Years | 4 (11.8%) | 0 (0.0%) |
| 70 to 74 Years | 0 (0.0%) | 0 (0.0%) |
| 75 to 79 Years | 0 (0.0%) | 0 (0.0%) |
| 80 to 84 Years | 0 (0.0%) | 0 (0.0%) |
| 85 Years and over | 0 (0.0%) | 0 (0.0%) |
| Total | 34 (100.0%) | 38 (100.0%) |
Families and Households in Reubens
Median Family Size in Reubens
The median family size in Reubens is 3.21 persons per family, with married-couple families (9 | 47.4%) accounting for the largest median family size of 3.22 persons per family. On the other hand, single female/mother families (1 | 5.3%) represent the smallest median family size with 3.00 persons per family.
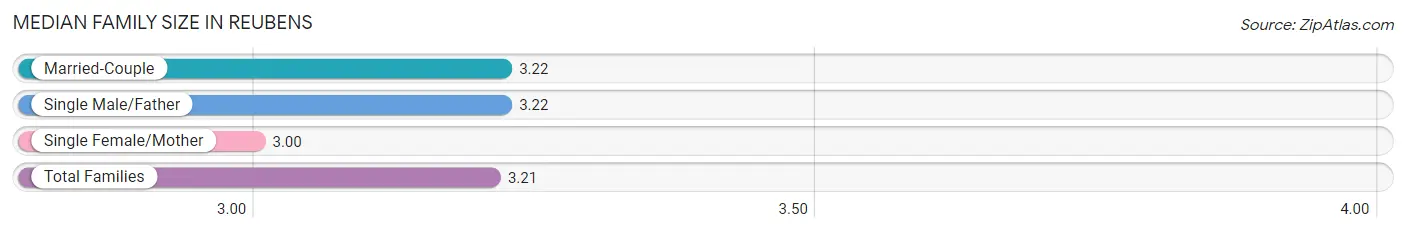
| Family Type | # Families | Family Size |
| Married-Couple | 9 (47.4%) | 3.22 |
| Single Male/Father | 9 (47.4%) | 3.22 |
| Single Female/Mother | 1 (5.3%) | 3.00 |
| Total Families | 19 (100.0%) | 3.21 |
Median Household Size in Reubens
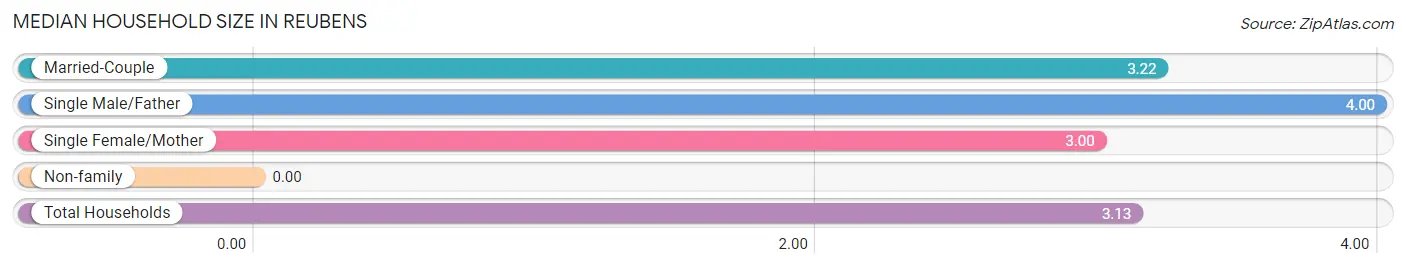
| Household Type | # Households | Household Size |
| Married-Couple | 9 (39.1%) | 3.22 |
| Single Male/Father | 9 (39.1%) | 4.00 |
| Single Female/Mother | 1 (4.3%) | 3.00 |
| Non-family | 4 (17.4%) | - |
| Total Households | 23 (100.0%) | 3.13 |
Household Size by Marriage Status in Reubens
Out of a total of 23 households in Reubens, 19 (82.6%) are family households, while 4 (17.4%) are nonfamily households. The most numerous type of family households are 3-person households, comprising 7, and the most common type of nonfamily households are 1-person households, comprising 4.
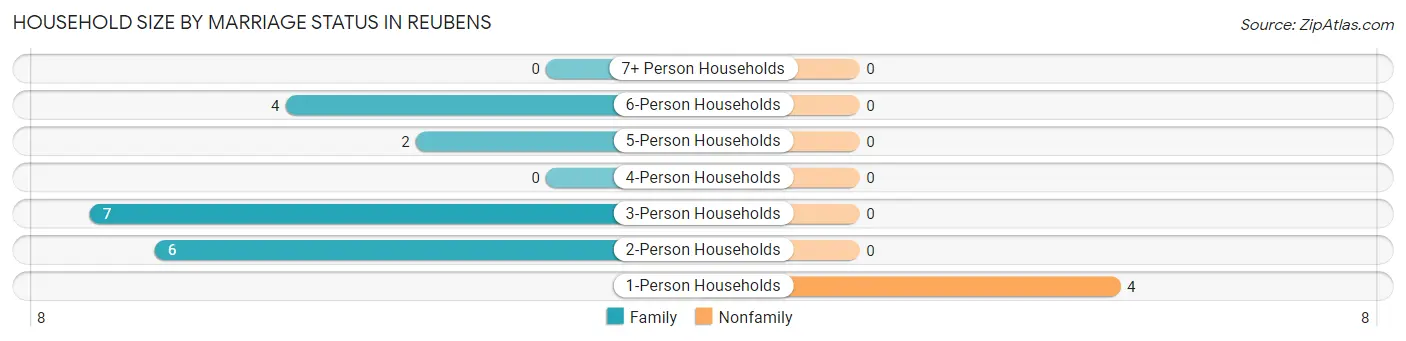
| Household Size | Family Households | Nonfamily Households |
| 1-Person Households | - | 4 (17.4%) |
| 2-Person Households | 6 (26.1%) | 0 (0.0%) |
| 3-Person Households | 7 (30.4%) | 0 (0.0%) |
| 4-Person Households | 0 (0.0%) | 0 (0.0%) |
| 5-Person Households | 2 (8.7%) | 0 (0.0%) |
| 6-Person Households | 4 (17.4%) | 0 (0.0%) |
| 7+ Person Households | 0 (0.0%) | 0 (0.0%) |
| Total | 19 (82.6%) | 4 (17.4%) |
Female Fertility in Reubens
Fertility by Age in Reubens
| Age Bracket | Women with Births | Births / 1,000 Women |
| 15 to 19 years | 0 (0.0%) | 0.0 |
| 20 to 34 years | 0 (0.0%) | 0.0 |
| 35 to 50 years | 0 (0.0%) | 0.0 |
| Total | 0 (0.0%) | 0.0 |
Fertility by Age by Marriage Status in Reubens
| Age Bracket | Married | Unmarried |
| 15 to 19 years | 0 (0.0%) | 0 (0.0%) |
| 20 to 34 years | 0 (0.0%) | 0 (0.0%) |
| 35 to 50 years | 0 (0.0%) | 0 (0.0%) |
| Total | 0 (0.0%) | 0 (0.0%) |
Fertility by Education in Reubens
| Educational Attainment | Women with Births | Births / 1,000 Women |
| Less than High School | 0 (0.0%) | 0.0 |
| High School Diploma | 0 (0.0%) | 0.0 |
| College or Associate's Degree | 0 (0.0%) | 0.0 |
| Bachelor's Degree | 0 (0.0%) | 0.0 |
| Graduate Degree | 0 (0.0%) | 0.0 |
| Total | 0 (0.0%) | 0.0 |
Fertility by Education by Marriage Status in Reubens
| Educational Attainment | Married | Unmarried |
| Less than High School | 0 (0.0%) | 0 (0.0%) |
| High School Diploma | 0 (0.0%) | 0 (0.0%) |
| College or Associate's Degree | 0 (0.0%) | 0 (0.0%) |
| Bachelor's Degree | 0 (0.0%) | 0 (0.0%) |
| Graduate Degree | 0 (0.0%) | 0 (0.0%) |
| Total | 0 (0.0%) | 0 (0.0%) |
Employment Characteristics in Reubens
Employment by Class of Employer in Reubens
Among the 34 employed individuals in Reubens, private company employees (14 | 41.2%), federal government employees (6 | 17.6%), and not-for-profit organizations (5 | 14.7%) make up the most common classes of employment.
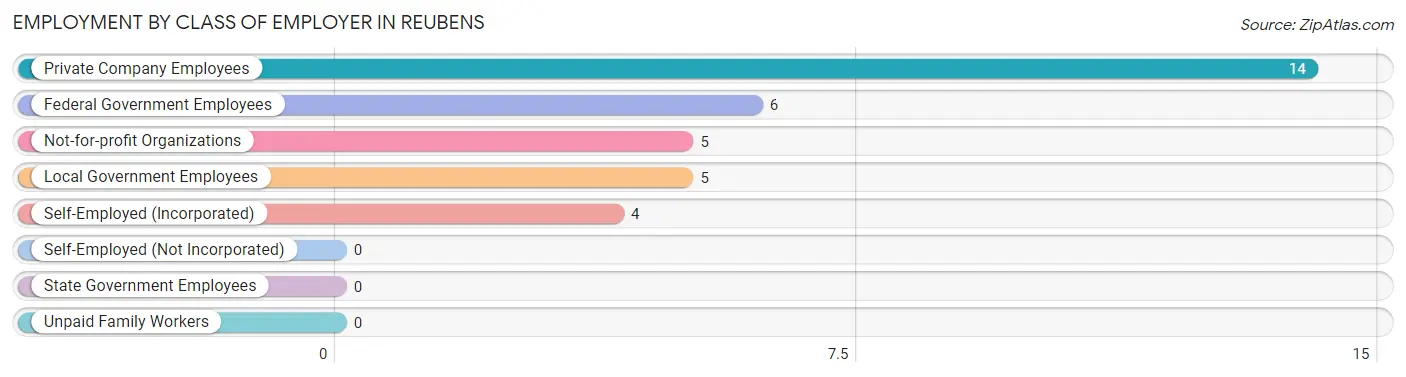
| Employer Class | # Employees | % Employees |
| Private Company Employees | 14 | 41.2% |
| Self-Employed (Incorporated) | 4 | 11.8% |
| Self-Employed (Not Incorporated) | 0 | 0.0% |
| Not-for-profit Organizations | 5 | 14.7% |
| Local Government Employees | 5 | 14.7% |
| State Government Employees | 0 | 0.0% |
| Federal Government Employees | 6 | 17.6% |
| Unpaid Family Workers | 0 | 0.0% |
| Total | 34 | 100.0% |
Employment Status by Age in Reubens
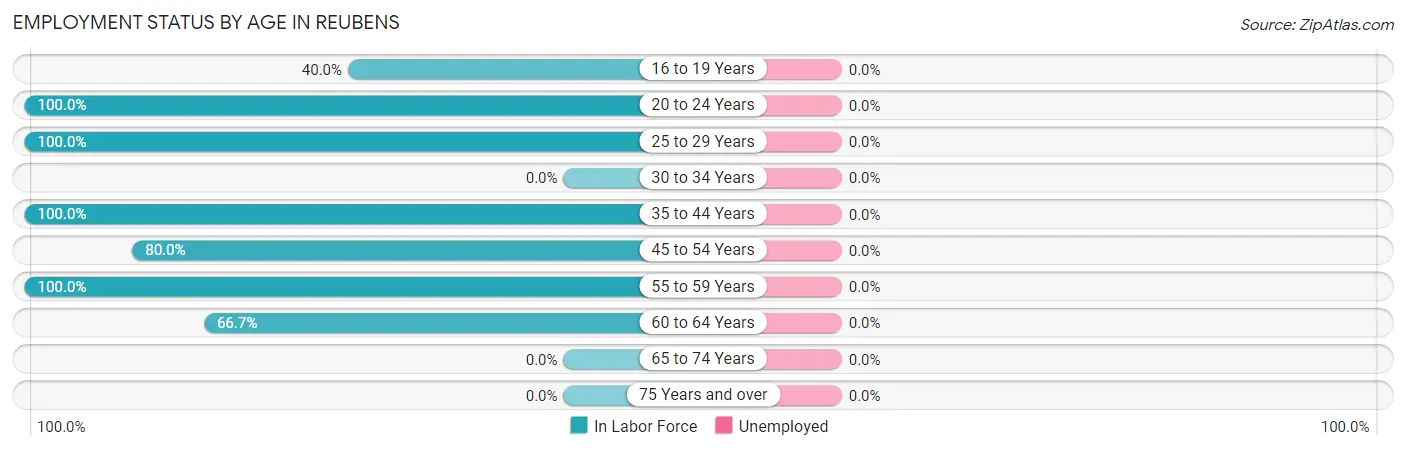
| Age Bracket | In Labor Force | Unemployed |
| 16 to 19 Years | 2 (40.0%) | 0 (0.0%) |
| 20 to 24 Years | 2 (100.0%) | 0 (0.0%) |
| 25 to 29 Years | 7 (100.0%) | 0 (0.0%) |
| 30 to 34 Years | 0 (0.0%) | 0 (0.0%) |
| 35 to 44 Years | 13 (100.0%) | 0 (0.0%) |
| 45 to 54 Years | 4 (80.0%) | 0 (0.0%) |
| 55 to 59 Years | 2 (100.0%) | 0 (0.0%) |
| 60 to 64 Years | 4 (66.7%) | 0 (0.0%) |
| 65 to 74 Years | 0 (0.0%) | 0 (0.0%) |
| 75 Years and over | 0 (0.0%) | 0 (0.0%) |
| Total | 34 (73.9%) | 0 (0.0%) |
Employment Status by Educational Attainment in Reubens
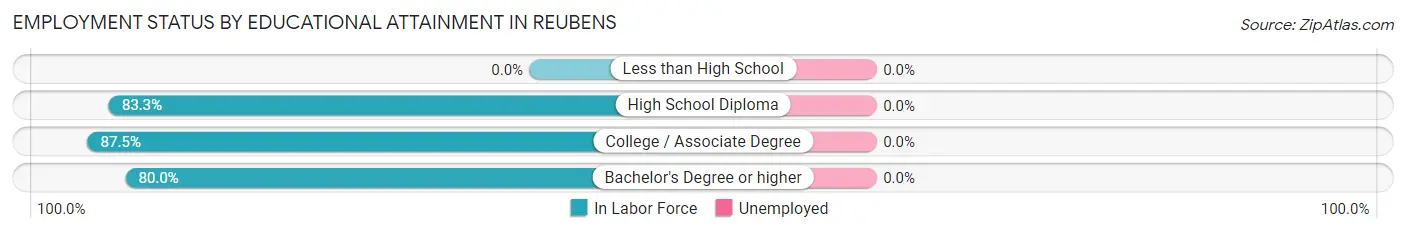
| Educational Attainment | In Labor Force | Unemployed |
| Less than High School | 0 (0.0%) | 0 (0.0%) |
| High School Diploma | 5 (83.3%) | 0 (0.0%) |
| College / Associate Degree | 21 (87.5%) | 0 (0.0%) |
| Bachelor's Degree or higher | 4 (80.0%) | 0 (0.0%) |
| Total | 30 (85.7%) | 0 (0.0%) |
Employment Occupations by Sex in Reubens
Management, Business, Science and Arts Occupations
The most common Management, Business, Science and Arts occupations in Reubens are Health Diagnosing & Treating (3 | 8.8%), Health Technologists (3 | 8.8%), Management (1 | 2.9%), Business & Financial (1 | 2.9%), and Computers, Engineering & Science (1 | 2.9%).
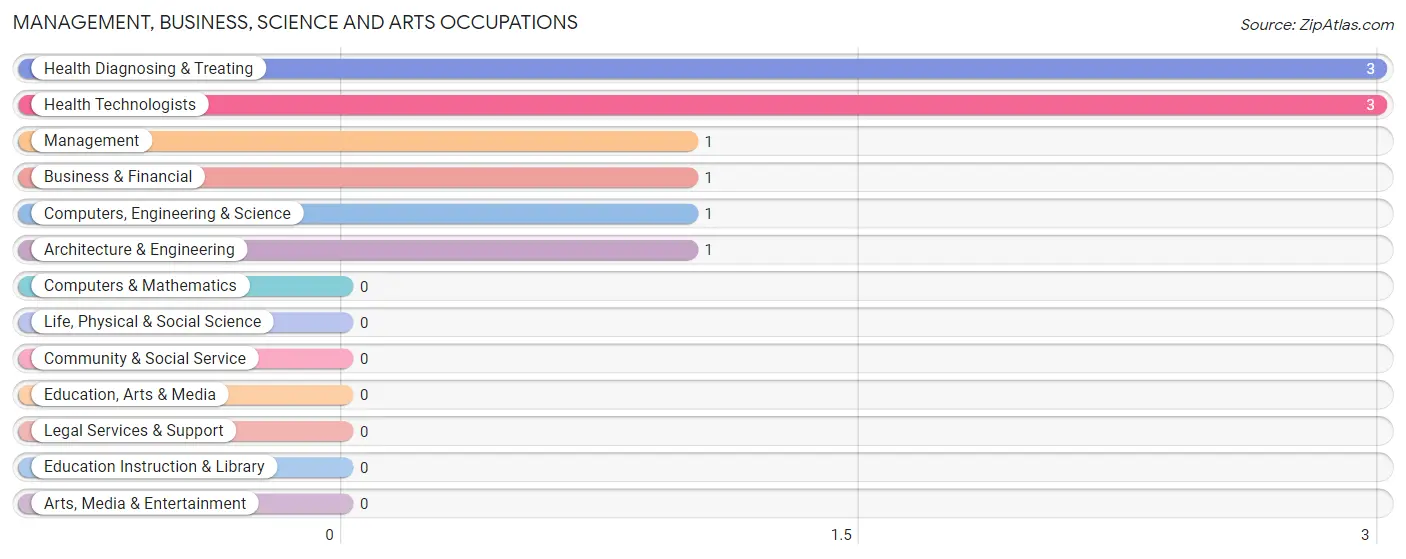
Management, Business, Science and Arts Occupations by Sex
Within the Management, Business, Science and Arts occupations in Reubens, the most male-oriented occupations are Management (100.0%), Computers, Engineering & Science (100.0%), and Architecture & Engineering (100.0%), while the most female-oriented occupations are Business & Financial (100.0%), Health Diagnosing & Treating (100.0%), and Health Technologists (100.0%).
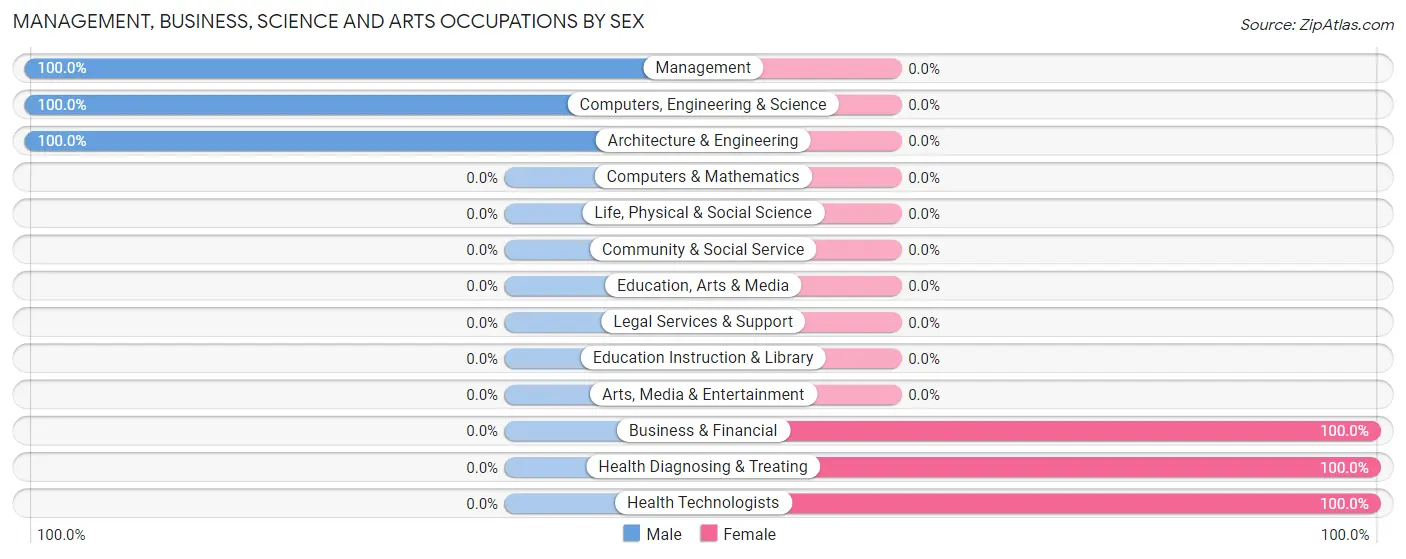
| Occupation | Male | Female |
| Management | 1 (100.0%) | 0 (0.0%) |
| Business & Financial | 0 (0.0%) | 1 (100.0%) |
| Computers, Engineering & Science | 1 (100.0%) | 0 (0.0%) |
| Computers & Mathematics | 0 (0.0%) | 0 (0.0%) |
| Architecture & Engineering | 1 (100.0%) | 0 (0.0%) |
| Life, Physical & Social Science | 0 (0.0%) | 0 (0.0%) |
| Community & Social Service | 0 (0.0%) | 0 (0.0%) |
| Education, Arts & Media | 0 (0.0%) | 0 (0.0%) |
| Legal Services & Support | 0 (0.0%) | 0 (0.0%) |
| Education Instruction & Library | 0 (0.0%) | 0 (0.0%) |
| Arts, Media & Entertainment | 0 (0.0%) | 0 (0.0%) |
| Health Diagnosing & Treating | 0 (0.0%) | 3 (100.0%) |
| Health Technologists | 0 (0.0%) | 3 (100.0%) |
| Total (Category) | 2 (33.3%) | 4 (66.7%) |
| Total (Overall) | 18 (52.9%) | 16 (47.1%) |
Services Occupations
The most common Services occupations in Reubens are Healthcare Support (8 | 23.5%), and Food Preparation & Serving (3 | 8.8%).
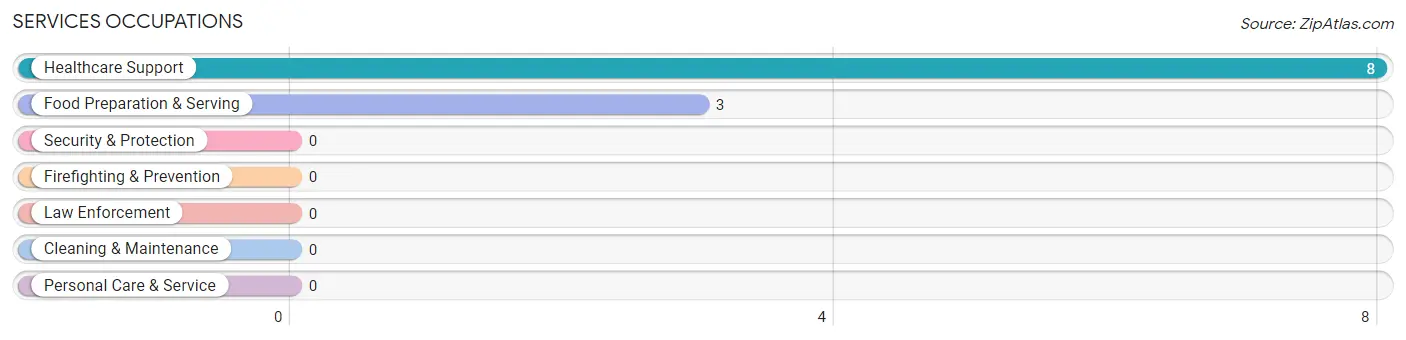
Services Occupations by Sex
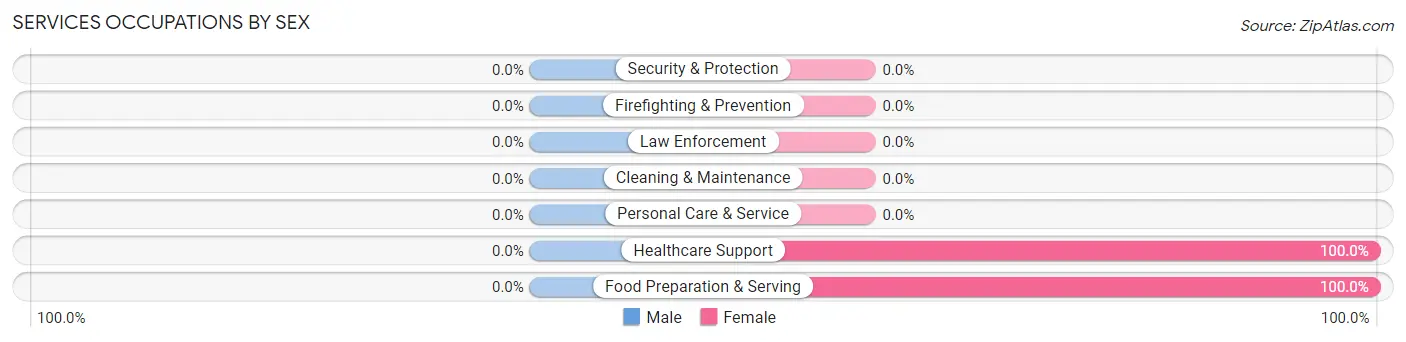
| Occupation | Male | Female |
| Healthcare Support | 0 (0.0%) | 8 (100.0%) |
| Security & Protection | 0 (0.0%) | 0 (0.0%) |
| Firefighting & Prevention | 0 (0.0%) | 0 (0.0%) |
| Law Enforcement | 0 (0.0%) | 0 (0.0%) |
| Food Preparation & Serving | 0 (0.0%) | 3 (100.0%) |
| Cleaning & Maintenance | 0 (0.0%) | 0 (0.0%) |
| Personal Care & Service | 0 (0.0%) | 0 (0.0%) |
| Total (Category) | 0 (0.0%) | 11 (100.0%) |
| Total (Overall) | 18 (52.9%) | 16 (47.1%) |
Sales and Office Occupations
The most common Sales and Office occupations in Reubens are , and Office & Administration (1 | 2.9%).
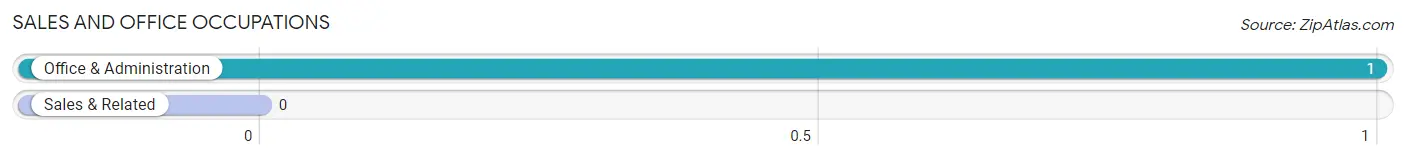
Sales and Office Occupations by Sex
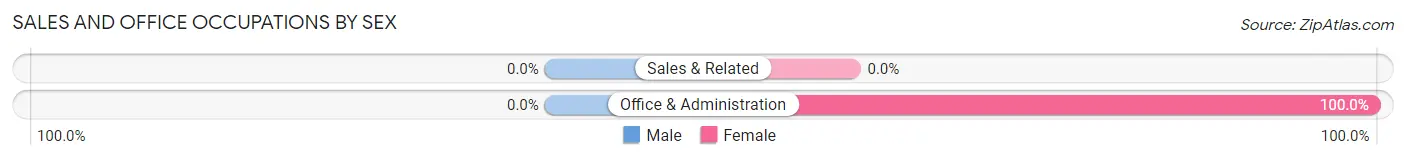
| Occupation | Male | Female |
| Sales & Related | 0 (0.0%) | 0 (0.0%) |
| Office & Administration | 0 (0.0%) | 1 (100.0%) |
| Total (Category) | 0 (0.0%) | 1 (100.0%) |
| Total (Overall) | 18 (52.9%) | 16 (47.1%) |
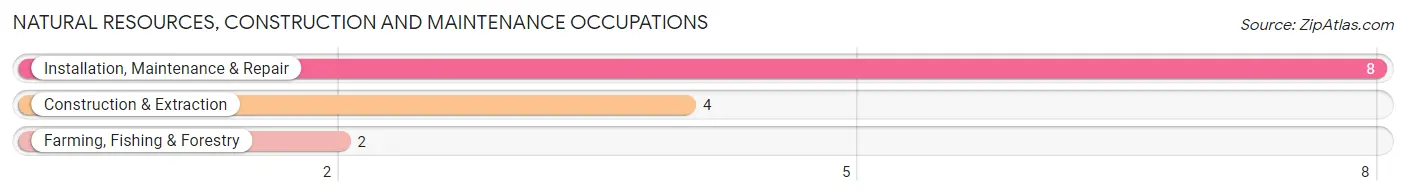
Natural Resources, Construction and Maintenance Occupations
The most common Natural Resources, Construction and Maintenance occupations in Reubens are Installation, Maintenance & Repair (8 | 23.5%), Construction & Extraction (4 | 11.8%), and Farming, Fishing & Forestry (2 | 5.9%).
Natural Resources, Construction and Maintenance Occupations by Sex
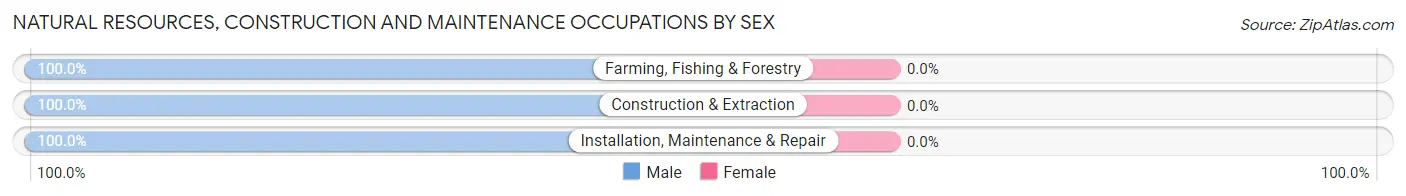
| Occupation | Male | Female |
| Farming, Fishing & Forestry | 2 (100.0%) | 0 (0.0%) |
| Construction & Extraction | 4 (100.0%) | 0 (0.0%) |
| Installation, Maintenance & Repair | 8 (100.0%) | 0 (0.0%) |
| Total (Category) | 14 (100.0%) | 0 (0.0%) |
| Total (Overall) | 18 (52.9%) | 16 (47.1%) |
Production, Transportation and Moving Occupations
The most common Production, Transportation and Moving occupations in Reubens are , and Production (2 | 5.9%).
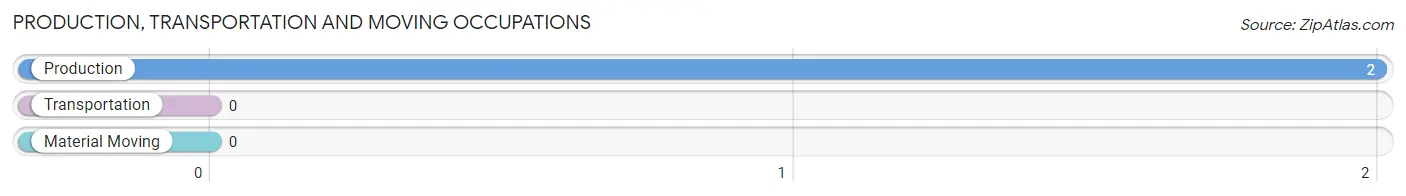
Production, Transportation and Moving Occupations by Sex
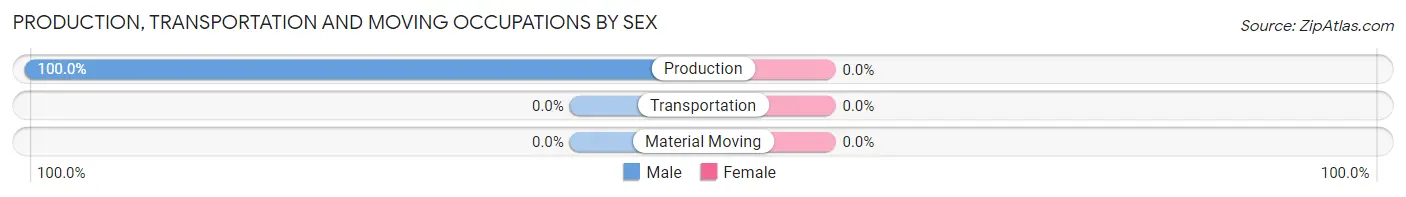
| Occupation | Male | Female |
| Production | 2 (100.0%) | 0 (0.0%) |
| Transportation | 0 (0.0%) | 0 (0.0%) |
| Material Moving | 0 (0.0%) | 0 (0.0%) |
| Total (Category) | 2 (100.0%) | 0 (0.0%) |
| Total (Overall) | 18 (52.9%) | 16 (47.1%) |
Employment Industries by Sex in Reubens
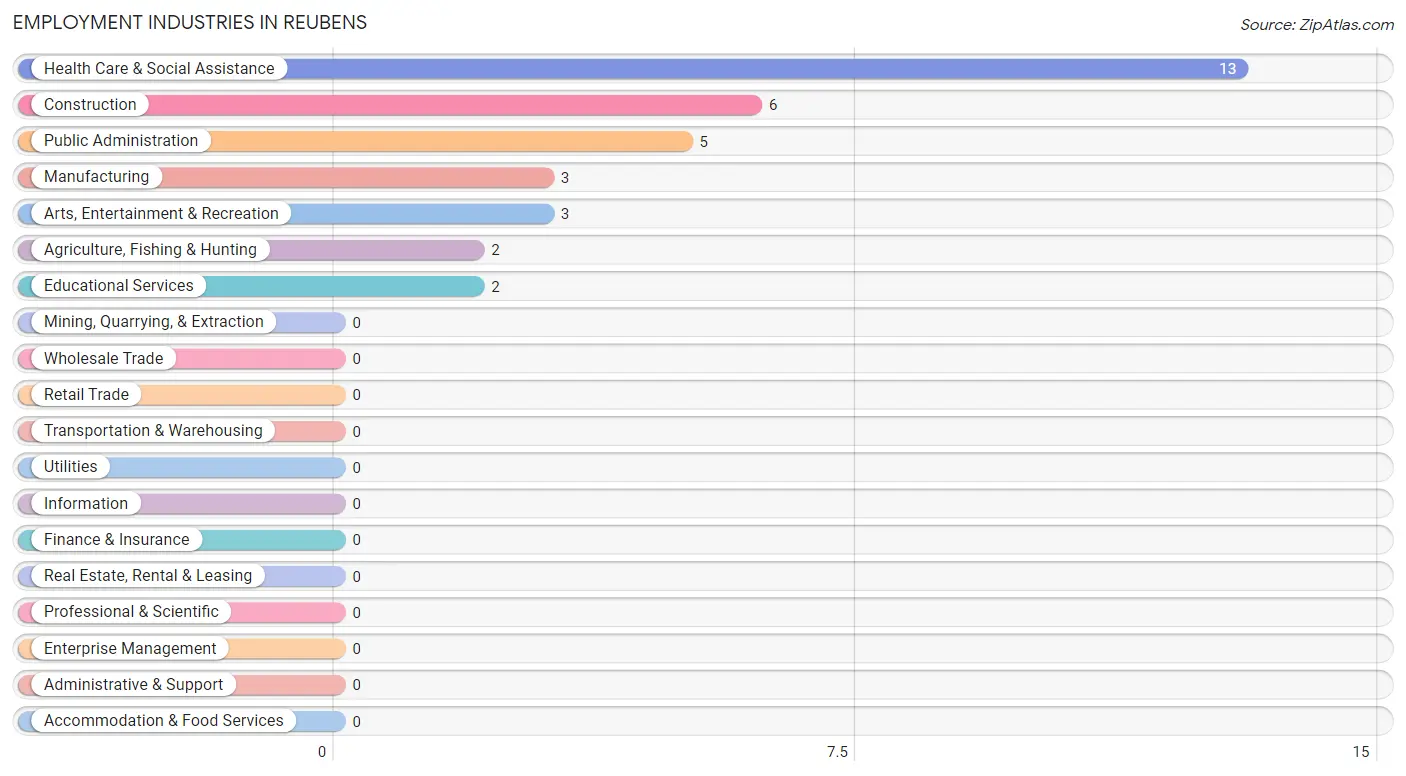
Employment Industries in Reubens
The major employment industries in Reubens include Health Care & Social Assistance (13 | 38.2%), Construction (6 | 17.6%), Public Administration (5 | 14.7%), Manufacturing (3 | 8.8%), and Arts, Entertainment & Recreation (3 | 8.8%).
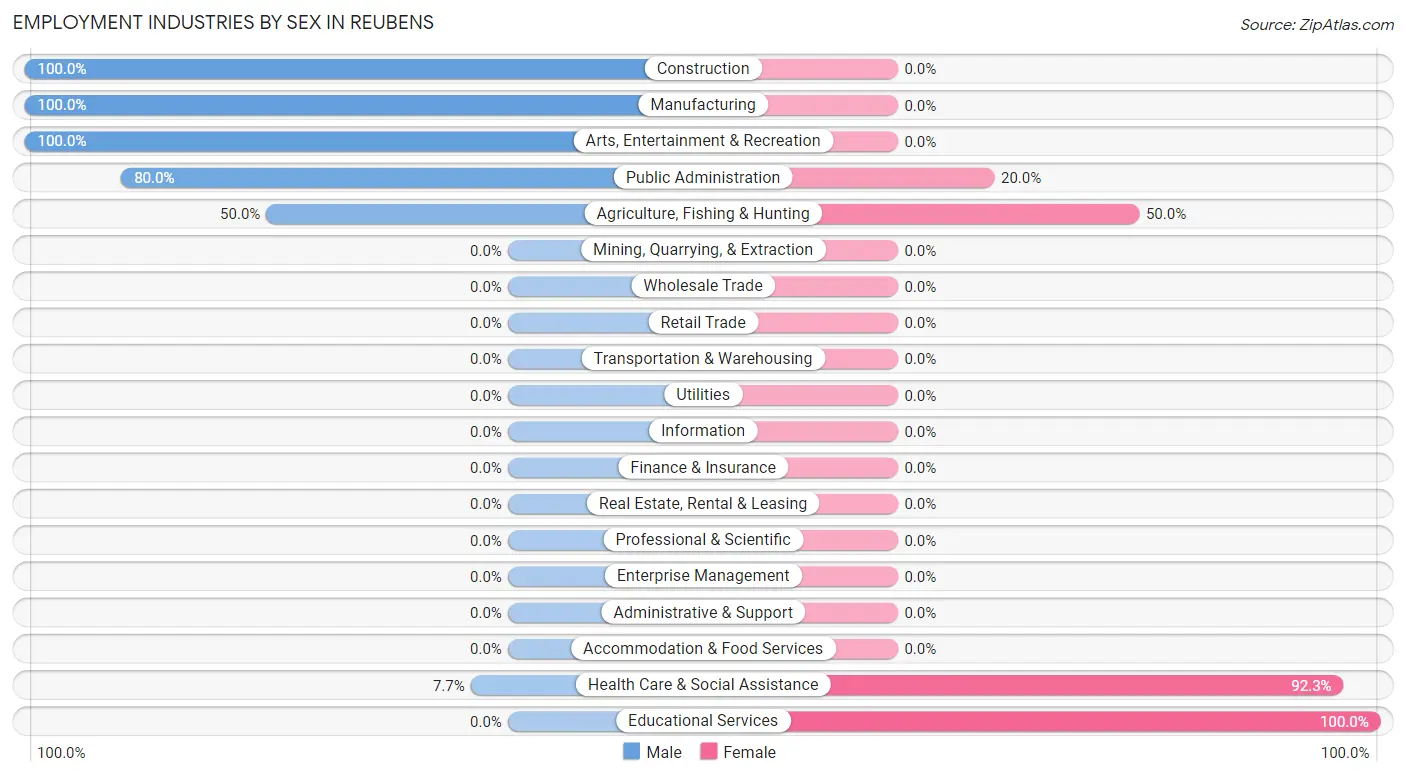
Employment Industries by Sex in Reubens
The Reubens industries that see more men than women are Construction (100.0%), Manufacturing (100.0%), and Arts, Entertainment & Recreation (100.0%), whereas the industries that tend to have a higher number of women are Educational Services (100.0%), Health Care & Social Assistance (92.3%), and Agriculture, Fishing & Hunting (50.0%).
| Industry | Male | Female |
| Agriculture, Fishing & Hunting | 1 (50.0%) | 1 (50.0%) |
| Mining, Quarrying, & Extraction | 0 (0.0%) | 0 (0.0%) |
| Construction | 6 (100.0%) | 0 (0.0%) |
| Manufacturing | 3 (100.0%) | 0 (0.0%) |
| Wholesale Trade | 0 (0.0%) | 0 (0.0%) |
| Retail Trade | 0 (0.0%) | 0 (0.0%) |
| Transportation & Warehousing | 0 (0.0%) | 0 (0.0%) |
| Utilities | 0 (0.0%) | 0 (0.0%) |
| Information | 0 (0.0%) | 0 (0.0%) |
| Finance & Insurance | 0 (0.0%) | 0 (0.0%) |
| Real Estate, Rental & Leasing | 0 (0.0%) | 0 (0.0%) |
| Professional & Scientific | 0 (0.0%) | 0 (0.0%) |
| Enterprise Management | 0 (0.0%) | 0 (0.0%) |
| Administrative & Support | 0 (0.0%) | 0 (0.0%) |
| Educational Services | 0 (0.0%) | 2 (100.0%) |
| Health Care & Social Assistance | 1 (7.7%) | 12 (92.3%) |
| Arts, Entertainment & Recreation | 3 (100.0%) | 0 (0.0%) |
| Accommodation & Food Services | 0 (0.0%) | 0 (0.0%) |
| Public Administration | 4 (80.0%) | 1 (20.0%) |
| Total | 18 (52.9%) | 16 (47.1%) |
Education in Reubens
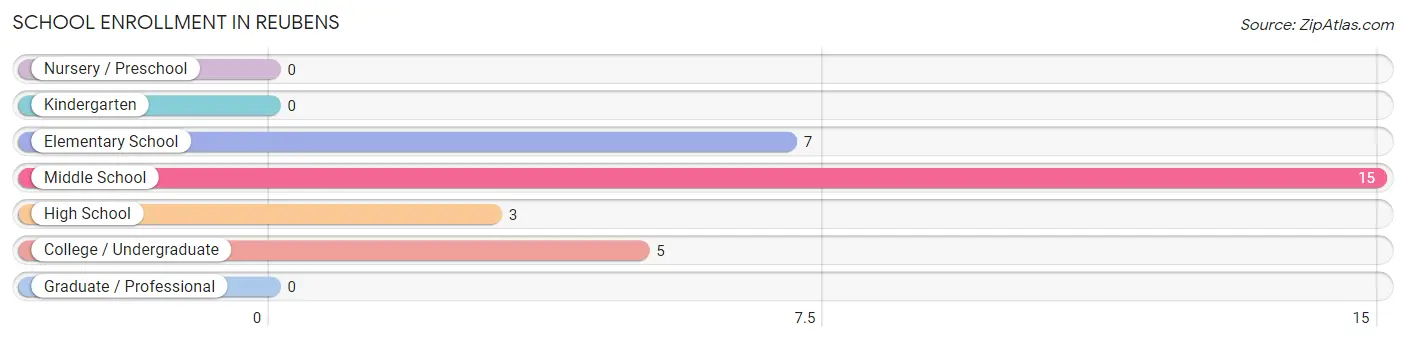
School Enrollment in Reubens
The most common levels of schooling among the 30 students in Reubens are middle school (15 | 50.0%), elementary school (7 | 23.3%), and college / undergraduate (5 | 16.7%).
| School Level | # Students | % Students |
| Nursery / Preschool | 0 | 0.0% |
| Kindergarten | 0 | 0.0% |
| Elementary School | 7 | 23.3% |
| Middle School | 15 | 50.0% |
| High School | 3 | 10.0% |
| College / Undergraduate | 5 | 16.7% |
| Graduate / Professional | 0 | 0.0% |
| Total | 30 | 100.0% |
School Enrollment by Age by Funding Source in Reubens
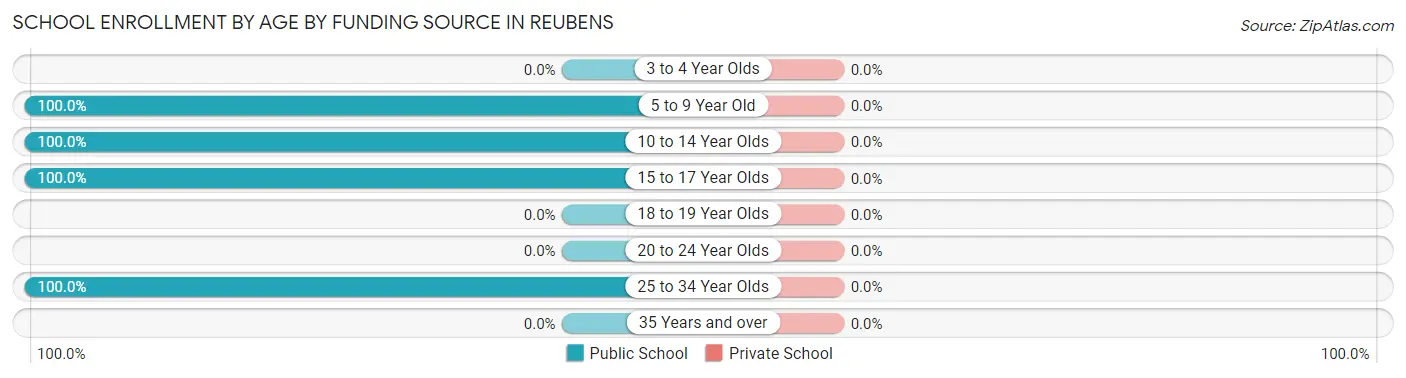
| Age Bracket | Public School | Private School |
| 3 to 4 Year Olds | 0 (0.0%) | 0 (0.0%) |
| 5 to 9 Year Old | 4 (100.0%) | 0 (0.0%) |
| 10 to 14 Year Olds | 18 (100.0%) | 0 (0.0%) |
| 15 to 17 Year Olds | 3 (100.0%) | 0 (0.0%) |
| 18 to 19 Year Olds | 0 (0.0%) | 0 (0.0%) |
| 20 to 24 Year Olds | 0 (0.0%) | 0 (0.0%) |
| 25 to 34 Year Olds | 5 (100.0%) | 0 (0.0%) |
| 35 Years and over | 0 (0.0%) | 0 (0.0%) |
| Total | 30 (100.0%) | 0 (0.0%) |
Educational Attainment by Field of Study in Reubens
Science & technology (3 | 42.9%), bio, nature & agricultural (2 | 28.6%), engineering (1 | 14.3%), and education (1 | 14.3%) are the most common fields of study among 7 individuals in Reubens who have obtained a bachelor's degree or higher.
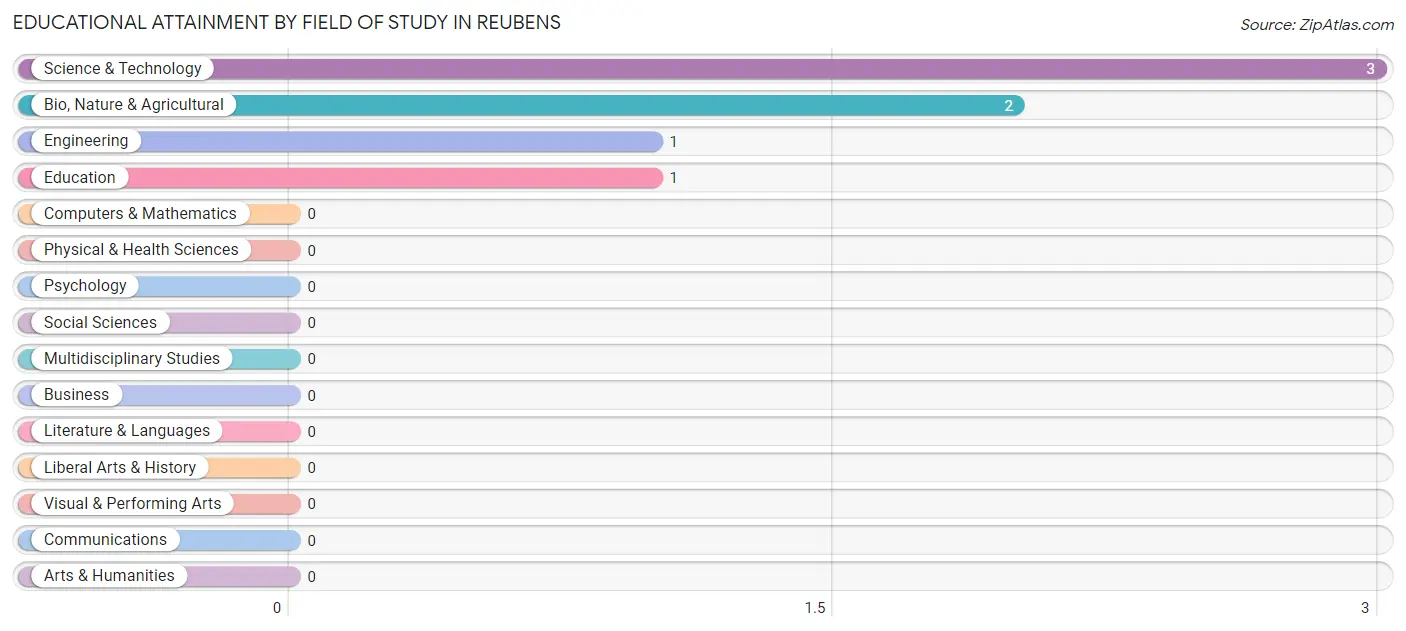
| Field of Study | # Graduates | % Graduates |
| Computers & Mathematics | 0 | 0.0% |
| Bio, Nature & Agricultural | 2 | 28.6% |
| Physical & Health Sciences | 0 | 0.0% |
| Psychology | 0 | 0.0% |
| Social Sciences | 0 | 0.0% |
| Engineering | 1 | 14.3% |
| Multidisciplinary Studies | 0 | 0.0% |
| Science & Technology | 3 | 42.9% |
| Business | 0 | 0.0% |
| Education | 1 | 14.3% |
| Literature & Languages | 0 | 0.0% |
| Liberal Arts & History | 0 | 0.0% |
| Visual & Performing Arts | 0 | 0.0% |
| Communications | 0 | 0.0% |
| Arts & Humanities | 0 | 0.0% |
| Total | 7 | 100.0% |
Transportation & Commute in Reubens
Vehicle Availability by Sex in Reubens
The most prevalent vehicle ownership categories in Reubens are males with 4 vehicles (7, accounting for 38.9%) and females with 4 vehicles (4, making up 43.8%).
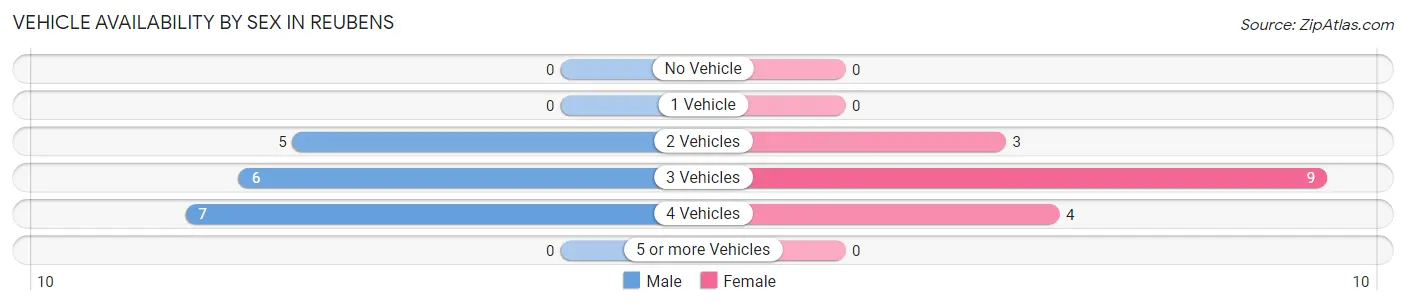
| Vehicles Available | Male | Female |
| No Vehicle | 0 (0.0%) | 0 (0.0%) |
| 1 Vehicle | 0 (0.0%) | 0 (0.0%) |
| 2 Vehicles | 5 (27.8%) | 3 (18.8%) |
| 3 Vehicles | 6 (33.3%) | 9 (56.2%) |
| 4 Vehicles | 7 (38.9%) | 4 (25.0%) |
| 5 or more Vehicles | 0 (0.0%) | 0 (0.0%) |
| Total | 18 (100.0%) | 16 (100.0%) |
Commute Time in Reubens
The most frequently occuring commute durations in Reubens are 10 to 14 minutes (6 commuters, 18.2%), 30 to 34 minutes (6 commuters, 18.2%), and 35 to 39 minutes (5 commuters, 15.1%).
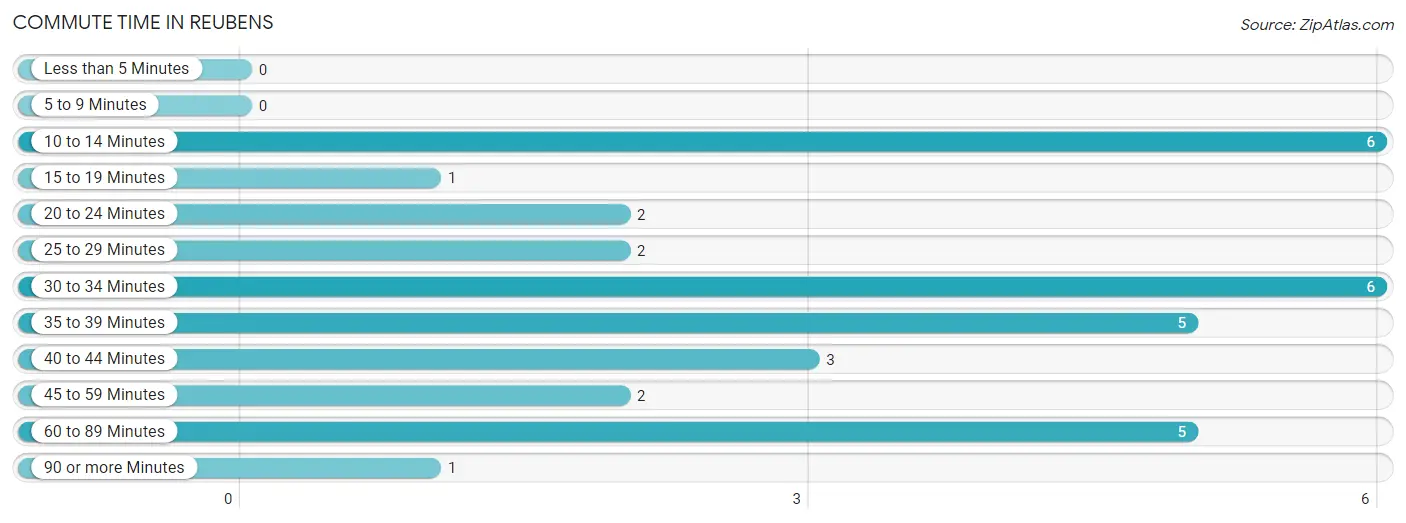
| Commute Time | # Commuters | % Commuters |
| Less than 5 Minutes | 0 | 0.0% |
| 5 to 9 Minutes | 0 | 0.0% |
| 10 to 14 Minutes | 6 | 18.2% |
| 15 to 19 Minutes | 1 | 3.0% |
| 20 to 24 Minutes | 2 | 6.1% |
| 25 to 29 Minutes | 2 | 6.1% |
| 30 to 34 Minutes | 6 | 18.2% |
| 35 to 39 Minutes | 5 | 15.1% |
| 40 to 44 Minutes | 3 | 9.1% |
| 45 to 59 Minutes | 2 | 6.1% |
| 60 to 89 Minutes | 5 | 15.1% |
| 90 or more Minutes | 1 | 3.0% |
Commute Time by Sex in Reubens
The most common commute times in Reubens are 30 to 34 minutes (6 commuters, 33.3%) for males and 60 to 89 minutes (5 commuters, 33.3%) for females.
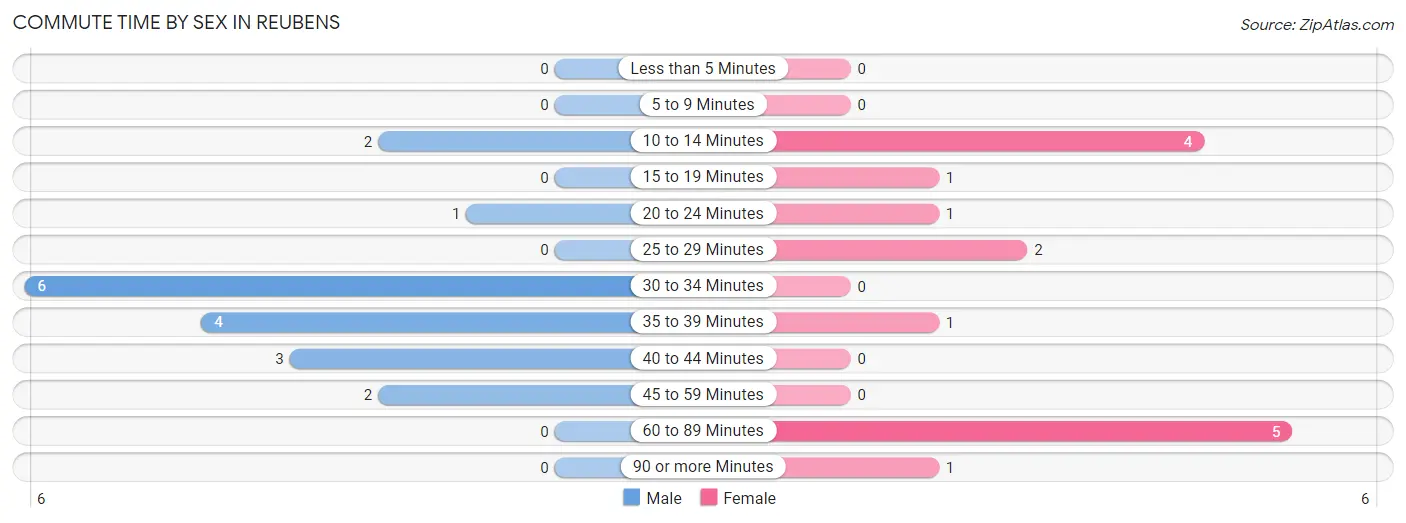
| Commute Time | Male | Female |
| Less than 5 Minutes | 0 (0.0%) | 0 (0.0%) |
| 5 to 9 Minutes | 0 (0.0%) | 0 (0.0%) |
| 10 to 14 Minutes | 2 (11.1%) | 4 (26.7%) |
| 15 to 19 Minutes | 0 (0.0%) | 1 (6.7%) |
| 20 to 24 Minutes | 1 (5.6%) | 1 (6.7%) |
| 25 to 29 Minutes | 0 (0.0%) | 2 (13.3%) |
| 30 to 34 Minutes | 6 (33.3%) | 0 (0.0%) |
| 35 to 39 Minutes | 4 (22.2%) | 1 (6.7%) |
| 40 to 44 Minutes | 3 (16.7%) | 0 (0.0%) |
| 45 to 59 Minutes | 2 (11.1%) | 0 (0.0%) |
| 60 to 89 Minutes | 0 (0.0%) | 5 (33.3%) |
| 90 or more Minutes | 0 (0.0%) | 1 (6.7%) |
Time of Departure to Work by Sex in Reubens
The most frequent times of departure to work in Reubens are 12:00 AM to 4:59 AM (7, 38.9%) for males and 12:00 AM to 4:59 AM (6, 40.0%) for females.
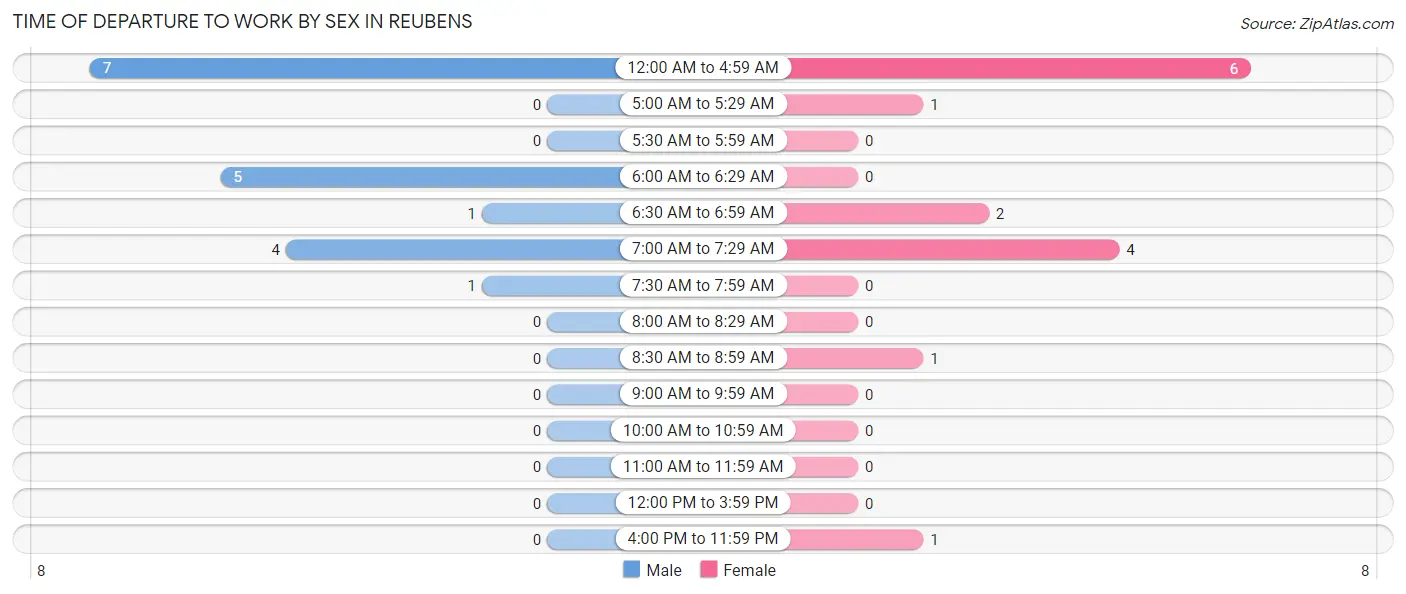
| Time of Departure | Male | Female |
| 12:00 AM to 4:59 AM | 7 (38.9%) | 6 (40.0%) |
| 5:00 AM to 5:29 AM | 0 (0.0%) | 1 (6.7%) |
| 5:30 AM to 5:59 AM | 0 (0.0%) | 0 (0.0%) |
| 6:00 AM to 6:29 AM | 5 (27.8%) | 0 (0.0%) |
| 6:30 AM to 6:59 AM | 1 (5.6%) | 2 (13.3%) |
| 7:00 AM to 7:29 AM | 4 (22.2%) | 4 (26.7%) |
| 7:30 AM to 7:59 AM | 1 (5.6%) | 0 (0.0%) |
| 8:00 AM to 8:29 AM | 0 (0.0%) | 0 (0.0%) |
| 8:30 AM to 8:59 AM | 0 (0.0%) | 1 (6.7%) |
| 9:00 AM to 9:59 AM | 0 (0.0%) | 0 (0.0%) |
| 10:00 AM to 10:59 AM | 0 (0.0%) | 0 (0.0%) |
| 11:00 AM to 11:59 AM | 0 (0.0%) | 0 (0.0%) |
| 12:00 PM to 3:59 PM | 0 (0.0%) | 0 (0.0%) |
| 4:00 PM to 11:59 PM | 0 (0.0%) | 1 (6.7%) |
| Total | 18 (100.0%) | 15 (100.0%) |
Housing Occupancy in Reubens
Occupancy by Ownership in Reubens
Of the total 23 dwellings in Reubens, owner-occupied units account for 18 (78.3%), while renter-occupied units make up 5 (21.7%).
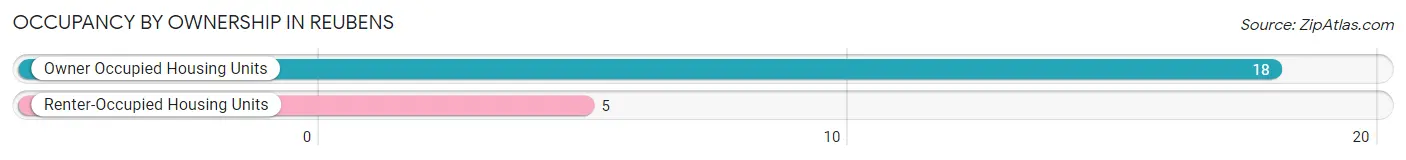
| Occupancy | # Housing Units | % Housing Units |
| Owner Occupied Housing Units | 18 | 78.3% |
| Renter-Occupied Housing Units | 5 | 21.7% |
| Total Occupied Housing Units | 23 | 100.0% |
Occupancy by Household Size in Reubens
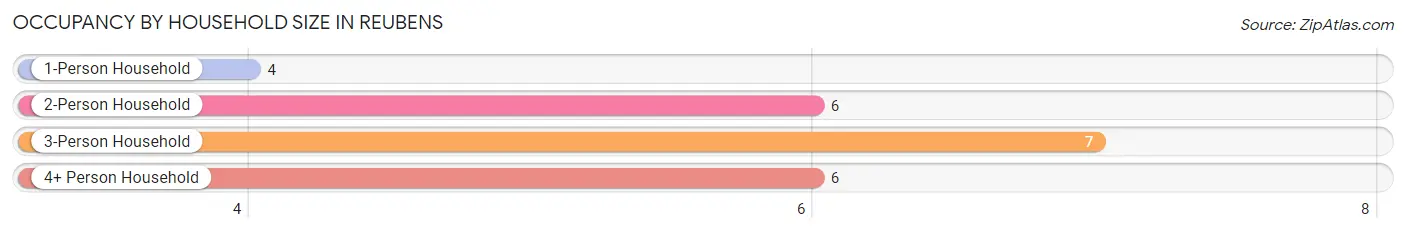
| Household Size | # Housing Units | % Housing Units |
| 1-Person Household | 4 | 17.4% |
| 2-Person Household | 6 | 26.1% |
| 3-Person Household | 7 | 30.4% |
| 4+ Person Household | 6 | 26.1% |
| Total Housing Units | 23 | 100.0% |
Occupancy by Ownership by Household Size in Reubens
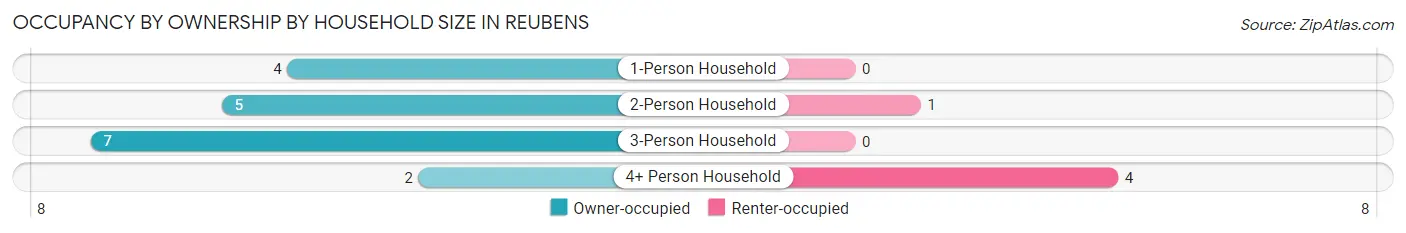
| Household Size | Owner-occupied | Renter-occupied |
| 1-Person Household | 4 (100.0%) | 0 (0.0%) |
| 2-Person Household | 5 (83.3%) | 1 (16.7%) |
| 3-Person Household | 7 (100.0%) | 0 (0.0%) |
| 4+ Person Household | 2 (33.3%) | 4 (66.7%) |
| Total Housing Units | 18 (78.3%) | 5 (21.7%) |
Occupancy by Educational Attainment in Reubens
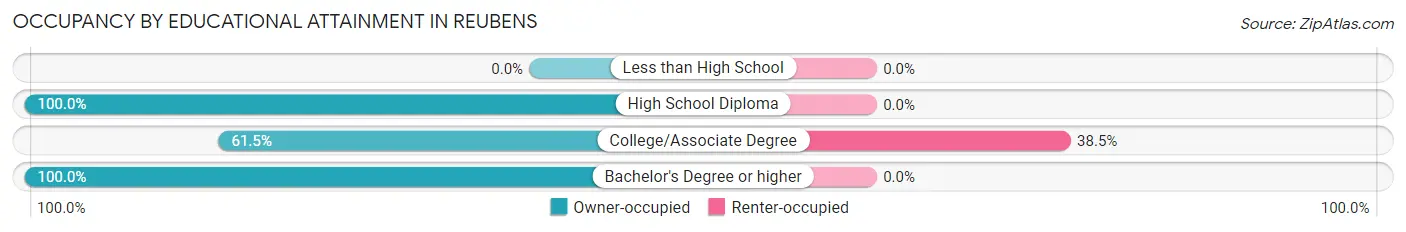
| Household Size | Owner-occupied | Renter-occupied |
| Less than High School | 0 (0.0%) | 0 (0.0%) |
| High School Diploma | 6 (100.0%) | 0 (0.0%) |
| College/Associate Degree | 8 (61.5%) | 5 (38.5%) |
| Bachelor's Degree or higher | 4 (100.0%) | 0 (0.0%) |
Occupancy by Age of Householder in Reubens
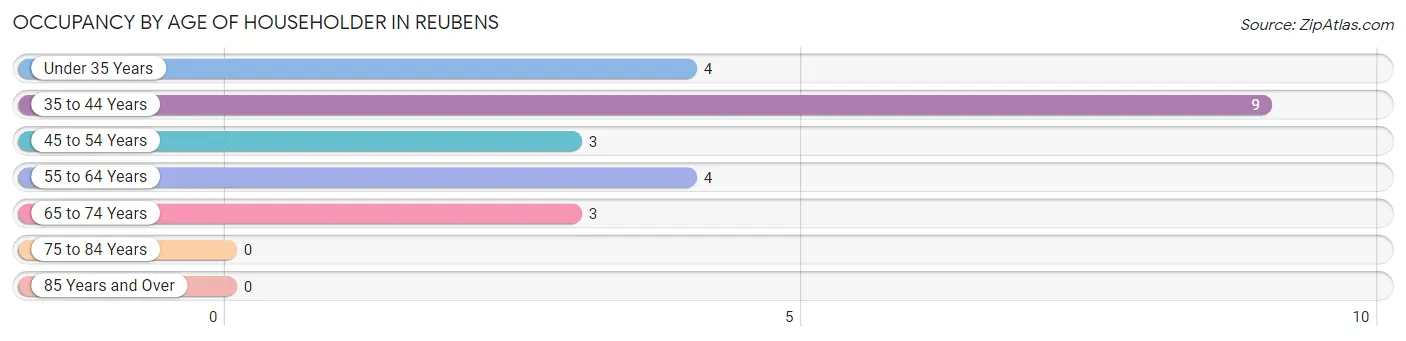
| Age Bracket | # Households | % Households |
| Under 35 Years | 4 | 17.4% |
| 35 to 44 Years | 9 | 39.1% |
| 45 to 54 Years | 3 | 13.0% |
| 55 to 64 Years | 4 | 17.4% |
| 65 to 74 Years | 3 | 13.0% |
| 75 to 84 Years | 0 | 0.0% |
| 85 Years and Over | 0 | 0.0% |
| Total | 23 | 100.0% |
Housing Finances in Reubens
Median Income by Occupancy in Reubens
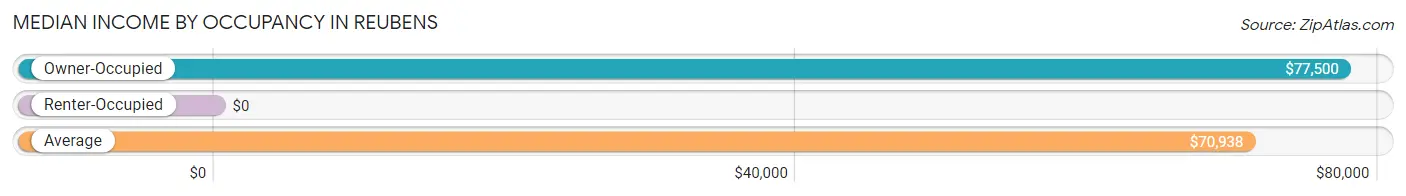
| Occupancy Type | # Households | Median Income |
| Owner-Occupied | 18 (78.3%) | $77,500 |
| Renter-Occupied | 5 (21.7%) | $0 |
| Average | 23 (100.0%) | $70,938 |
Occupancy by Householder Income Bracket in Reubens
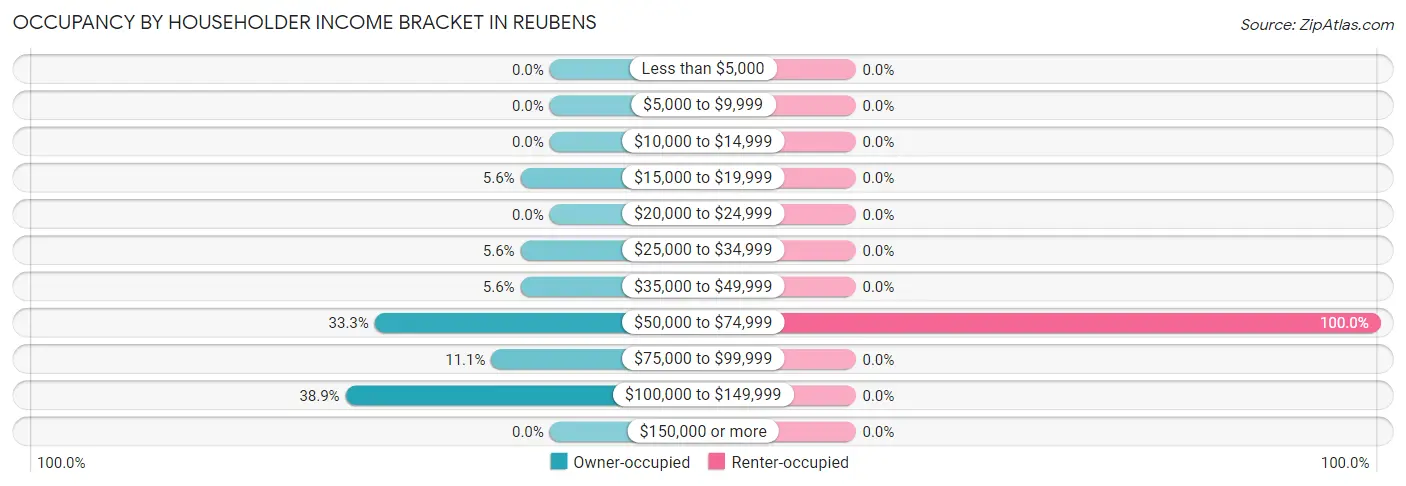
| Income Bracket | Owner-occupied | Renter-occupied |
| Less than $5,000 | 0 (0.0%) | 0 (0.0%) |
| $5,000 to $9,999 | 0 (0.0%) | 0 (0.0%) |
| $10,000 to $14,999 | 0 (0.0%) | 0 (0.0%) |
| $15,000 to $19,999 | 1 (5.6%) | 0 (0.0%) |
| $20,000 to $24,999 | 0 (0.0%) | 0 (0.0%) |
| $25,000 to $34,999 | 1 (5.6%) | 0 (0.0%) |
| $35,000 to $49,999 | 1 (5.6%) | 0 (0.0%) |
| $50,000 to $74,999 | 6 (33.3%) | 5 (100.0%) |
| $75,000 to $99,999 | 2 (11.1%) | 0 (0.0%) |
| $100,000 to $149,999 | 7 (38.9%) | 0 (0.0%) |
| $150,000 or more | 0 (0.0%) | 0 (0.0%) |
| Total | 18 (100.0%) | 5 (100.0%) |
Monthly Housing Cost Tiers in Reubens
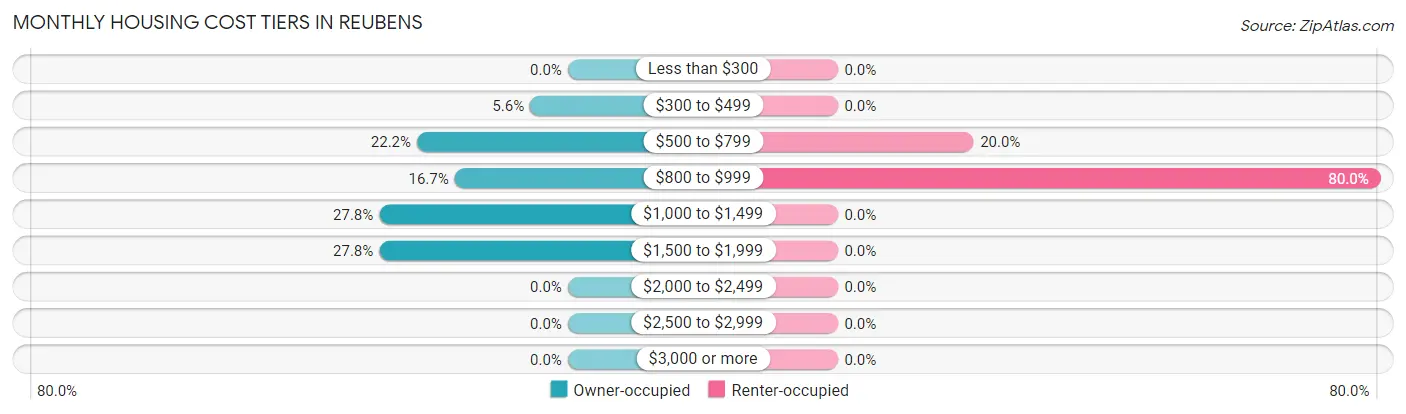
| Monthly Cost | Owner-occupied | Renter-occupied |
| Less than $300 | 0 (0.0%) | 0 (0.0%) |
| $300 to $499 | 1 (5.6%) | 0 (0.0%) |
| $500 to $799 | 4 (22.2%) | 1 (20.0%) |
| $800 to $999 | 3 (16.7%) | 4 (80.0%) |
| $1,000 to $1,499 | 5 (27.8%) | 0 (0.0%) |
| $1,500 to $1,999 | 5 (27.8%) | 0 (0.0%) |
| $2,000 to $2,499 | 0 (0.0%) | 0 (0.0%) |
| $2,500 to $2,999 | 0 (0.0%) | 0 (0.0%) |
| $3,000 or more | 0 (0.0%) | 0 (0.0%) |
| Total | 18 (100.0%) | 5 (100.0%) |
Physical Housing Characteristics in Reubens
Housing Structures in Reubens
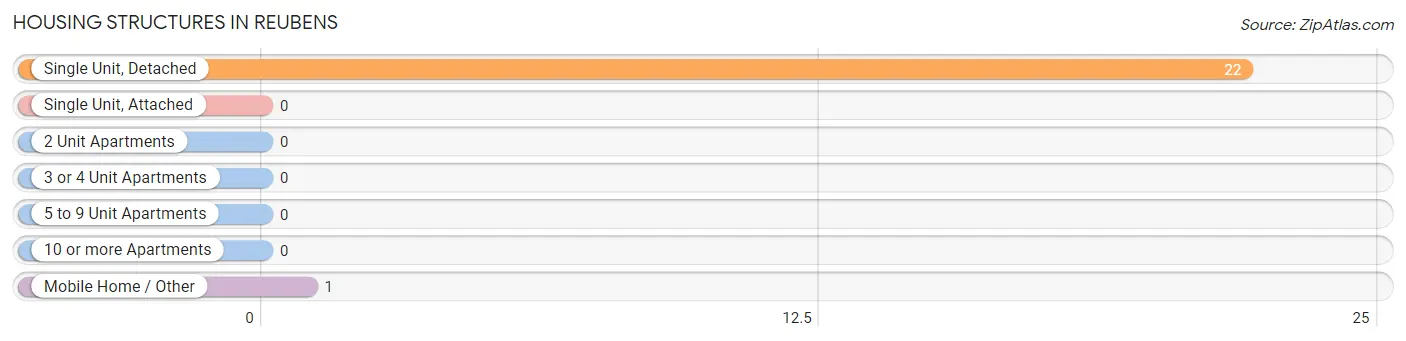
| Structure Type | # Housing Units | % Housing Units |
| Single Unit, Detached | 22 | 95.7% |
| Single Unit, Attached | 0 | 0.0% |
| 2 Unit Apartments | 0 | 0.0% |
| 3 or 4 Unit Apartments | 0 | 0.0% |
| 5 to 9 Unit Apartments | 0 | 0.0% |
| 10 or more Apartments | 0 | 0.0% |
| Mobile Home / Other | 1 | 4.3% |
| Total | 23 | 100.0% |
Housing Structures by Occupancy in Reubens
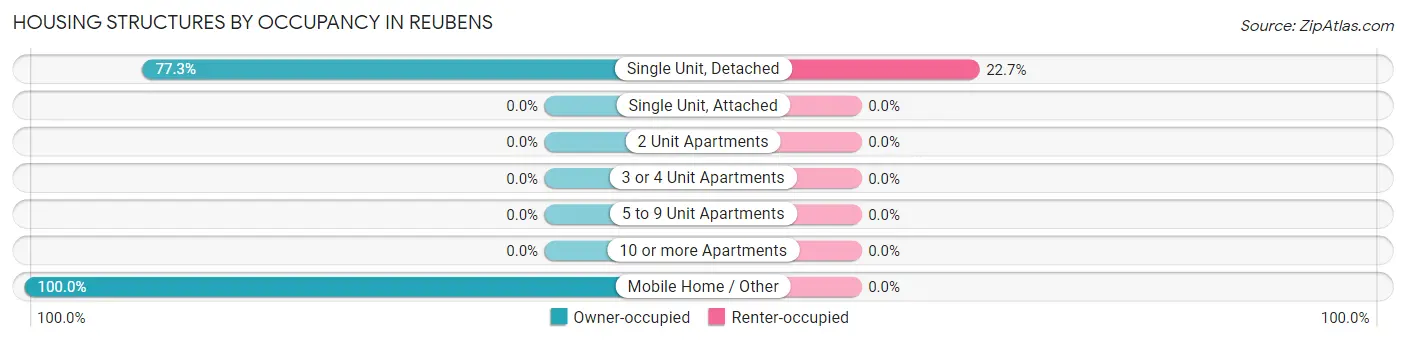
| Structure Type | Owner-occupied | Renter-occupied |
| Single Unit, Detached | 17 (77.3%) | 5 (22.7%) |
| Single Unit, Attached | 0 (0.0%) | 0 (0.0%) |
| 2 Unit Apartments | 0 (0.0%) | 0 (0.0%) |
| 3 or 4 Unit Apartments | 0 (0.0%) | 0 (0.0%) |
| 5 to 9 Unit Apartments | 0 (0.0%) | 0 (0.0%) |
| 10 or more Apartments | 0 (0.0%) | 0 (0.0%) |
| Mobile Home / Other | 1 (100.0%) | 0 (0.0%) |
| Total | 18 (78.3%) | 5 (21.7%) |
Housing Structures by Number of Rooms in Reubens
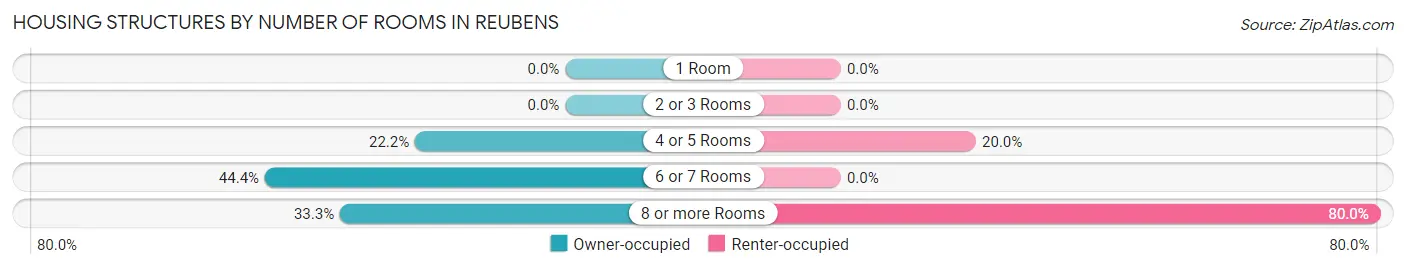
| Number of Rooms | Owner-occupied | Renter-occupied |
| 1 Room | 0 (0.0%) | 0 (0.0%) |
| 2 or 3 Rooms | 0 (0.0%) | 0 (0.0%) |
| 4 or 5 Rooms | 4 (22.2%) | 1 (20.0%) |
| 6 or 7 Rooms | 8 (44.4%) | 0 (0.0%) |
| 8 or more Rooms | 6 (33.3%) | 4 (80.0%) |
| Total | 18 (100.0%) | 5 (100.0%) |
Housing Structure by Heating Type in Reubens
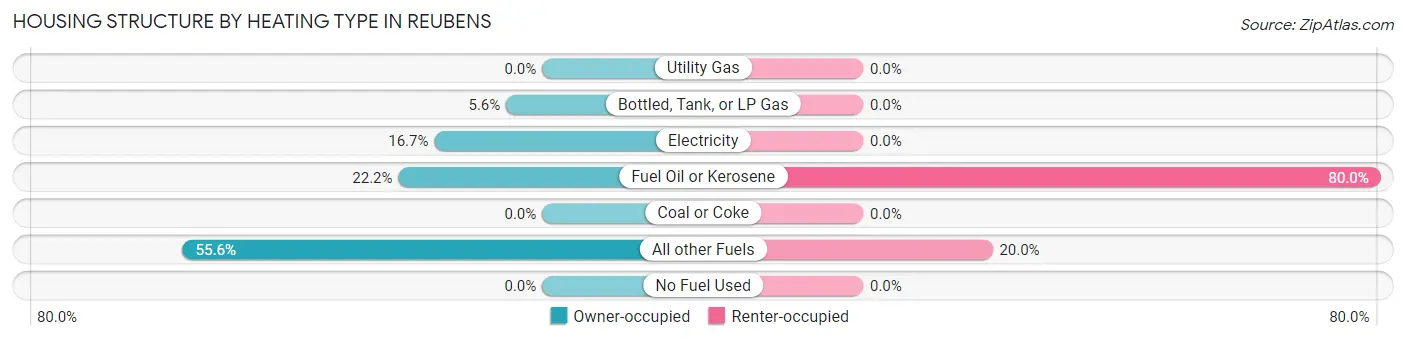
| Heating Type | Owner-occupied | Renter-occupied |
| Utility Gas | 0 (0.0%) | 0 (0.0%) |
| Bottled, Tank, or LP Gas | 1 (5.6%) | 0 (0.0%) |
| Electricity | 3 (16.7%) | 0 (0.0%) |
| Fuel Oil or Kerosene | 4 (22.2%) | 4 (80.0%) |
| Coal or Coke | 0 (0.0%) | 0 (0.0%) |
| All other Fuels | 10 (55.6%) | 1 (20.0%) |
| No Fuel Used | 0 (0.0%) | 0 (0.0%) |
| Total | 18 (100.0%) | 5 (100.0%) |
Household Vehicle Usage in Reubens
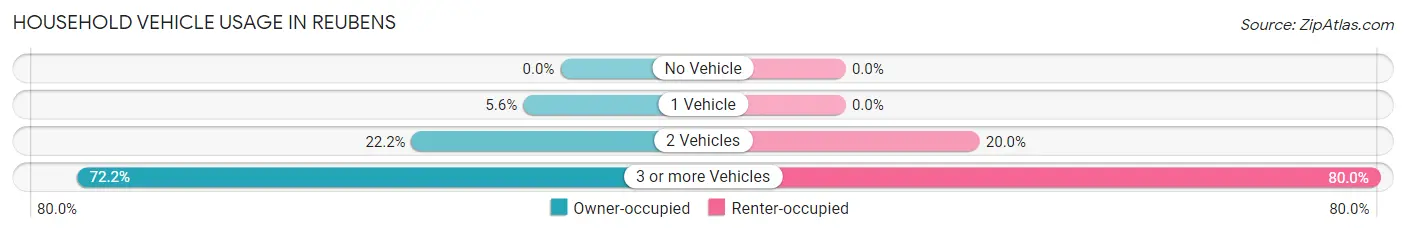
| Vehicles per Household | Owner-occupied | Renter-occupied |
| No Vehicle | 0 (0.0%) | 0 (0.0%) |
| 1 Vehicle | 1 (5.6%) | 0 (0.0%) |
| 2 Vehicles | 4 (22.2%) | 1 (20.0%) |
| 3 or more Vehicles | 13 (72.2%) | 4 (80.0%) |
| Total | 18 (100.0%) | 5 (100.0%) |
Real Estate & Mortgages in Reubens
Real Estate and Mortgage Overview in Reubens
| Characteristic | Without Mortgage | With Mortgage |
| Housing Units | 4 | 14 |
| Median Property Value | $137,500 | $150,000 |
| Median Household Income | $71,250 | $0 |
| Monthly Housing Costs | $600 | $0 |
| Real Estate Taxes | $700 | $0 |
Property Value by Mortgage Status in Reubens
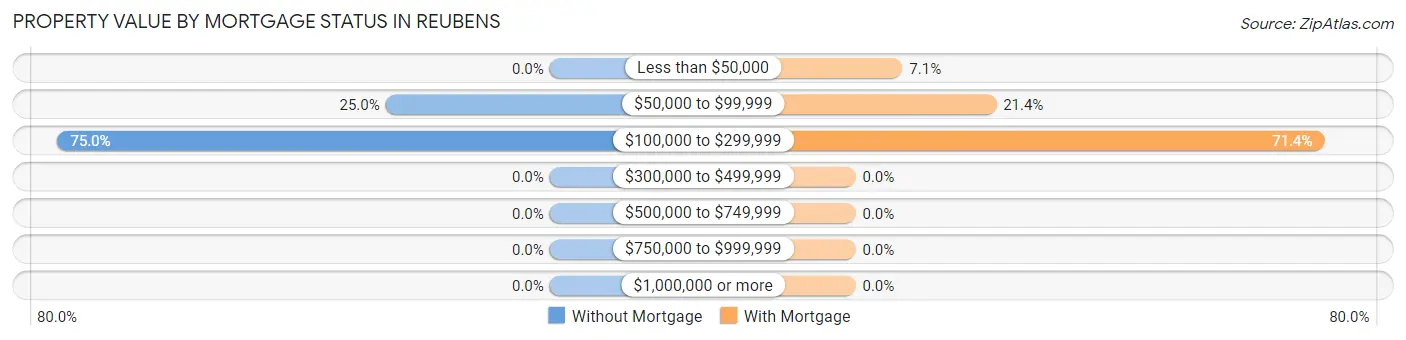
| Property Value | Without Mortgage | With Mortgage |
| Less than $50,000 | 0 (0.0%) | 1 (7.1%) |
| $50,000 to $99,999 | 1 (25.0%) | 3 (21.4%) |
| $100,000 to $299,999 | 3 (75.0%) | 10 (71.4%) |
| $300,000 to $499,999 | 0 (0.0%) | 0 (0.0%) |
| $500,000 to $749,999 | 0 (0.0%) | 0 (0.0%) |
| $750,000 to $999,999 | 0 (0.0%) | 0 (0.0%) |
| $1,000,000 or more | 0 (0.0%) | 0 (0.0%) |
| Total | 4 (100.0%) | 14 (100.0%) |
Household Income by Mortgage Status in Reubens
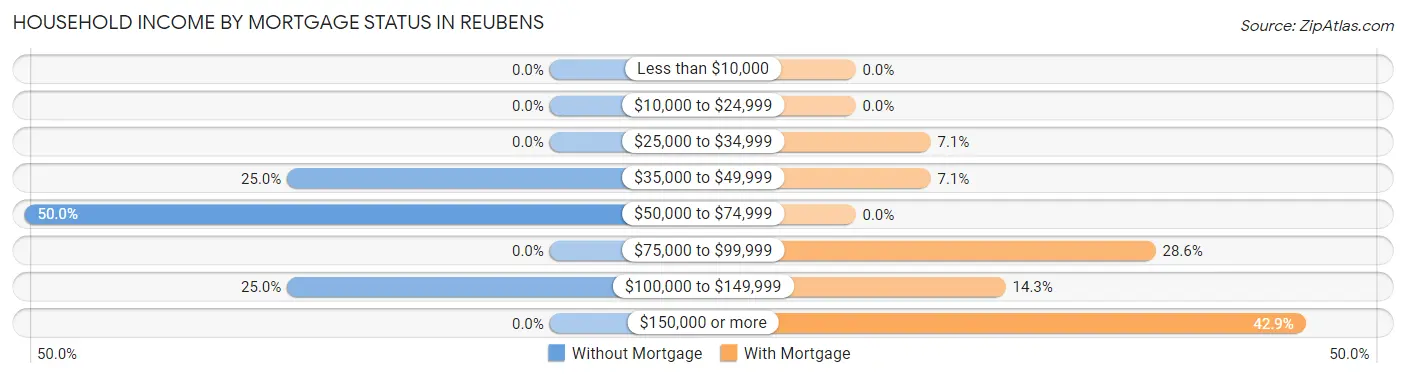
| Household Income | Without Mortgage | With Mortgage |
| Less than $10,000 | 0 (0.0%) | 0 (0.0%) |
| $10,000 to $24,999 | 0 (0.0%) | 0 (0.0%) |
| $25,000 to $34,999 | 0 (0.0%) | 1 (7.1%) |
| $35,000 to $49,999 | 1 (25.0%) | 1 (7.1%) |
| $50,000 to $74,999 | 2 (50.0%) | 0 (0.0%) |
| $75,000 to $99,999 | 0 (0.0%) | 4 (28.6%) |
| $100,000 to $149,999 | 1 (25.0%) | 2 (14.3%) |
| $150,000 or more | 0 (0.0%) | 6 (42.9%) |
| Total | 4 (100.0%) | 14 (100.0%) |
Property Value to Household Income Ratio in Reubens
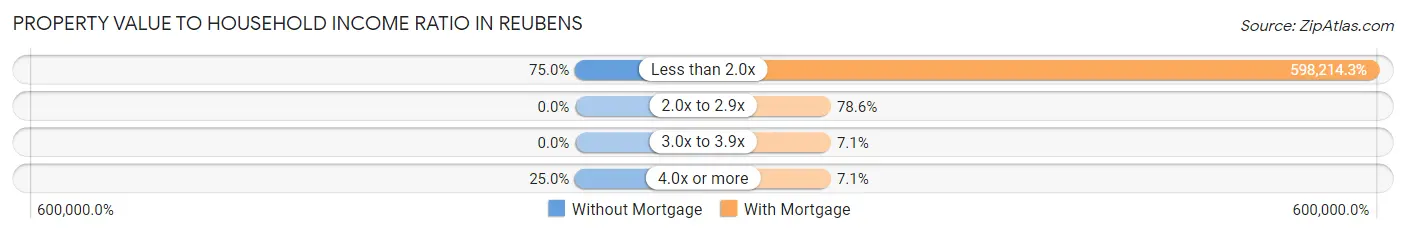
| Value-to-Income Ratio | Without Mortgage | With Mortgage |
| Less than 2.0x | 3 (75.0%) | 83,750 (598,214.3%) |
| 2.0x to 2.9x | 0 (0.0%) | 11 (78.6%) |
| 3.0x to 3.9x | 0 (0.0%) | 1 (7.1%) |
| 4.0x or more | 1 (25.0%) | 1 (7.1%) |
| Total | 4 (100.0%) | 14 (100.0%) |
Real Estate Taxes by Mortgage Status in Reubens
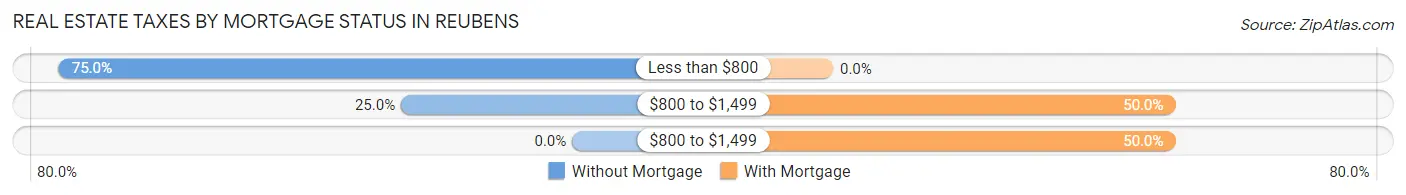
| Property Taxes | Without Mortgage | With Mortgage |
| Less than $800 | 3 (75.0%) | 0 (0.0%) |
| $800 to $1,499 | 1 (25.0%) | 7 (50.0%) |
| $800 to $1,499 | 0 (0.0%) | 7 (50.0%) |
| Total | 4 (100.0%) | 14 (100.0%) |
Health & Disability in Reubens
Health Insurance Coverage by Age in Reubens
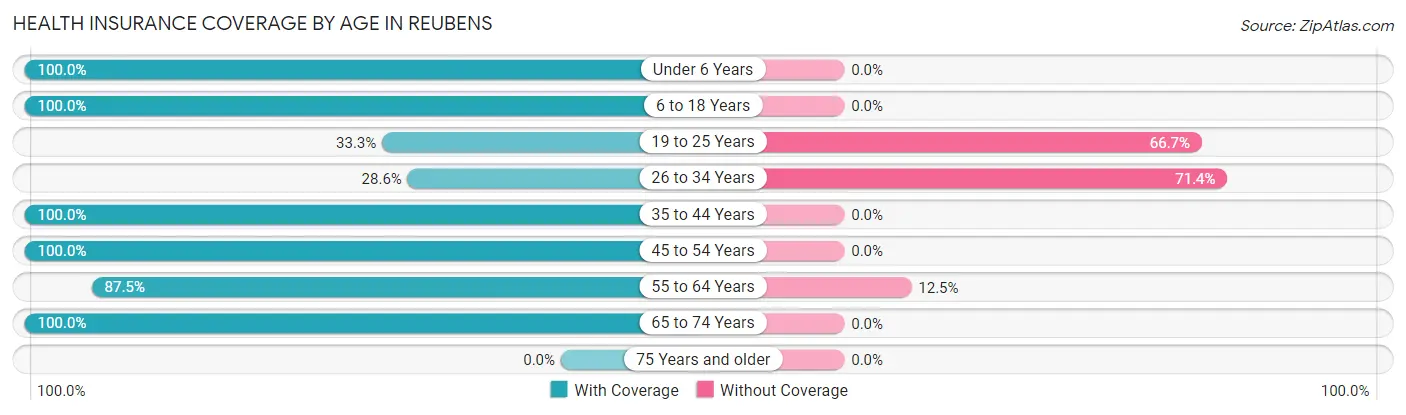
| Age Bracket | With Coverage | Without Coverage |
| Under 6 Years | 4 (100.0%) | 0 (0.0%) |
| 6 to 18 Years | 25 (100.0%) | 0 (0.0%) |
| 19 to 25 Years | 2 (33.3%) | 4 (66.7%) |
| 26 to 34 Years | 2 (28.6%) | 5 (71.4%) |
| 35 to 44 Years | 13 (100.0%) | 0 (0.0%) |
| 45 to 54 Years | 5 (100.0%) | 0 (0.0%) |
| 55 to 64 Years | 7 (87.5%) | 1 (12.5%) |
| 65 to 74 Years | 4 (100.0%) | 0 (0.0%) |
| 75 Years and older | 0 (0.0%) | 0 (0.0%) |
| Total | 62 (86.1%) | 10 (13.9%) |
Health Insurance Coverage by Citizenship Status in Reubens
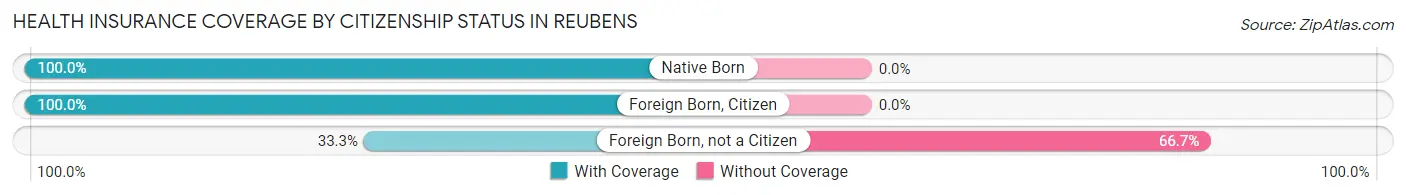
| Citizenship Status | With Coverage | Without Coverage |
| Native Born | 4 (100.0%) | 0 (0.0%) |
| Foreign Born, Citizen | 25 (100.0%) | 0 (0.0%) |
| Foreign Born, not a Citizen | 2 (33.3%) | 4 (66.7%) |
Health Insurance Coverage by Household Income in Reubens
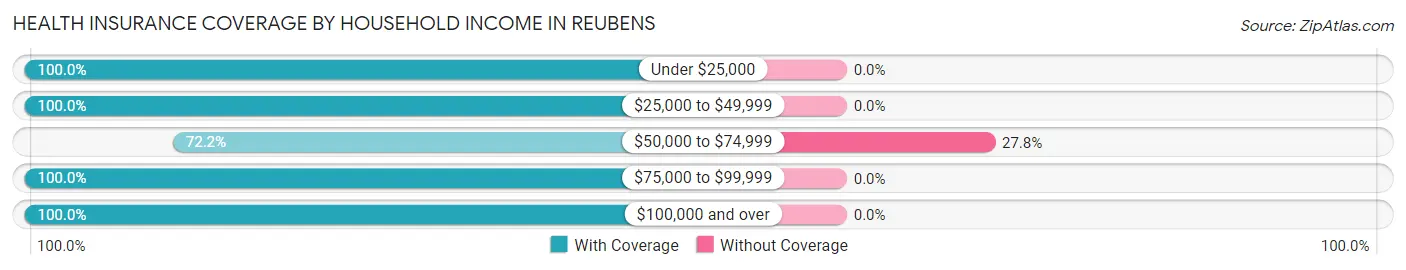
| Household Income | With Coverage | Without Coverage |
| Under $25,000 | 1 (100.0%) | 0 (0.0%) |
| $25,000 to $49,999 | 4 (100.0%) | 0 (0.0%) |
| $50,000 to $74,999 | 26 (72.2%) | 10 (27.8%) |
| $75,000 to $99,999 | 7 (100.0%) | 0 (0.0%) |
| $100,000 and over | 24 (100.0%) | 0 (0.0%) |
Public vs Private Health Insurance Coverage by Age in Reubens
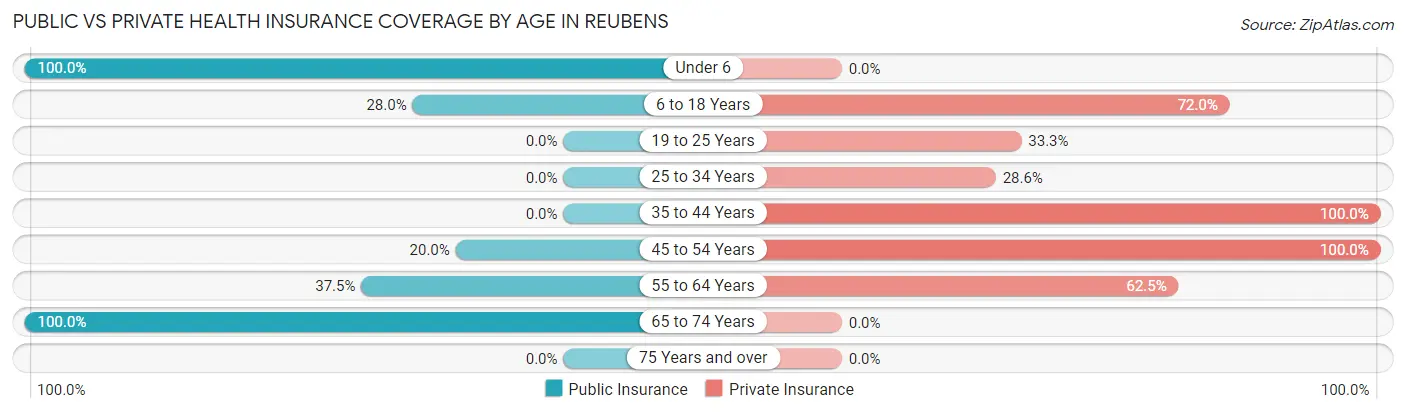
| Age Bracket | Public Insurance | Private Insurance |
| Under 6 | 4 (100.0%) | 0 (0.0%) |
| 6 to 18 Years | 7 (28.0%) | 18 (72.0%) |
| 19 to 25 Years | 0 (0.0%) | 2 (33.3%) |
| 25 to 34 Years | 0 (0.0%) | 2 (28.6%) |
| 35 to 44 Years | 0 (0.0%) | 13 (100.0%) |
| 45 to 54 Years | 1 (20.0%) | 5 (100.0%) |
| 55 to 64 Years | 3 (37.5%) | 5 (62.5%) |
| 65 to 74 Years | 4 (100.0%) | 0 (0.0%) |
| 75 Years and over | 0 (0.0%) | 0 (0.0%) |
| Total | 19 (26.4%) | 45 (62.5%) |
Disability Status by Sex by Age in Reubens
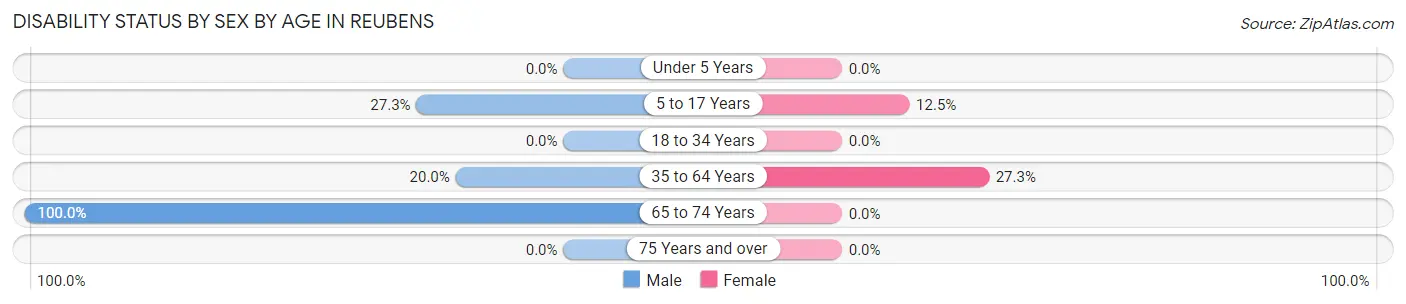
| Age Bracket | Male | Female |
| Under 5 Years | 0 (0.0%) | 0 (0.0%) |
| 5 to 17 Years | 3 (27.3%) | 2 (12.5%) |
| 18 to 34 Years | 0 (0.0%) | 0 (0.0%) |
| 35 to 64 Years | 3 (20.0%) | 3 (27.3%) |
| 65 to 74 Years | 4 (100.0%) | 0 (0.0%) |
| 75 Years and over | 0 (0.0%) | 0 (0.0%) |
Disability Class by Sex by Age in Reubens
Disability Class: Hearing Difficulty
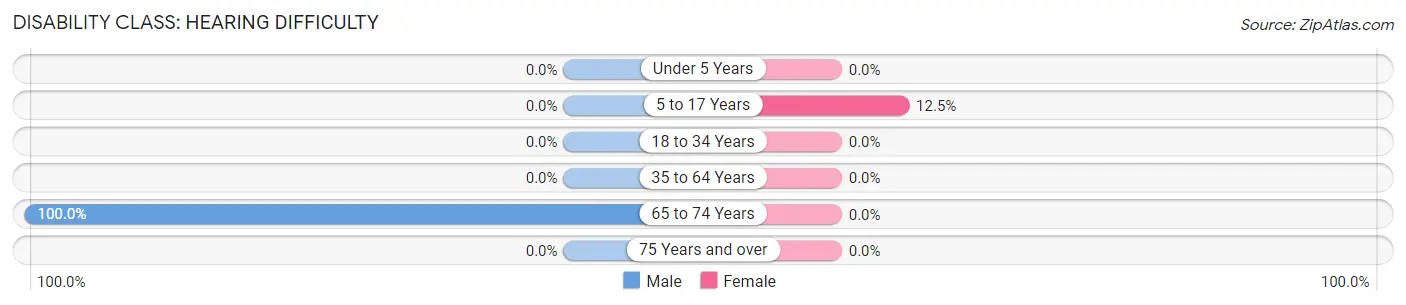
| Age Bracket | Male | Female |
| Under 5 Years | 0 (0.0%) | 0 (0.0%) |
| 5 to 17 Years | 0 (0.0%) | 2 (12.5%) |
| 18 to 34 Years | 0 (0.0%) | 0 (0.0%) |
| 35 to 64 Years | 0 (0.0%) | 0 (0.0%) |
| 65 to 74 Years | 4 (100.0%) | 0 (0.0%) |
| 75 Years and over | 0 (0.0%) | 0 (0.0%) |
Disability Class: Vision Difficulty
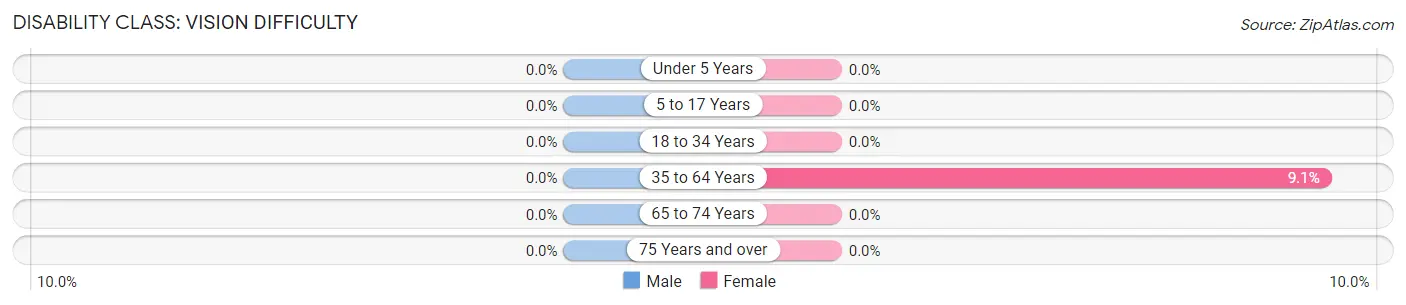
| Age Bracket | Male | Female |
| Under 5 Years | 0 (0.0%) | 0 (0.0%) |
| 5 to 17 Years | 0 (0.0%) | 0 (0.0%) |
| 18 to 34 Years | 0 (0.0%) | 0 (0.0%) |
| 35 to 64 Years | 0 (0.0%) | 1 (9.1%) |
| 65 to 74 Years | 0 (0.0%) | 0 (0.0%) |
| 75 Years and over | 0 (0.0%) | 0 (0.0%) |
Disability Class: Cognitive Difficulty
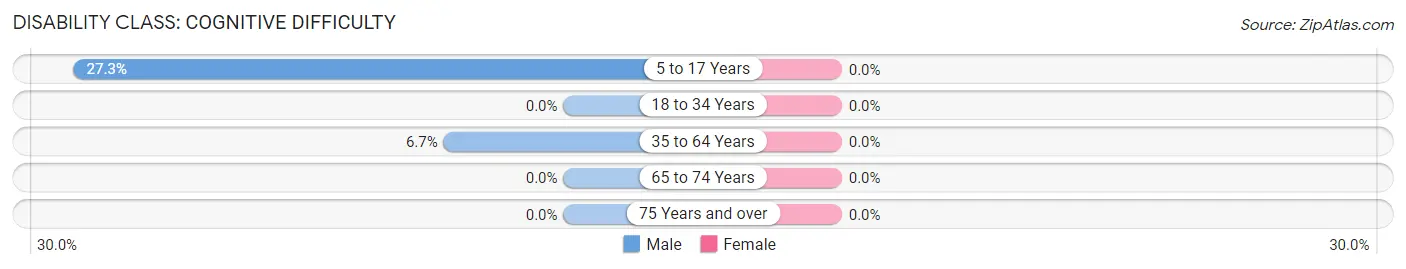
| Age Bracket | Male | Female |
| 5 to 17 Years | 3 (27.3%) | 0 (0.0%) |
| 18 to 34 Years | 0 (0.0%) | 0 (0.0%) |
| 35 to 64 Years | 1 (6.7%) | 0 (0.0%) |
| 65 to 74 Years | 0 (0.0%) | 0 (0.0%) |
| 75 Years and over | 0 (0.0%) | 0 (0.0%) |
Disability Class: Ambulatory Difficulty
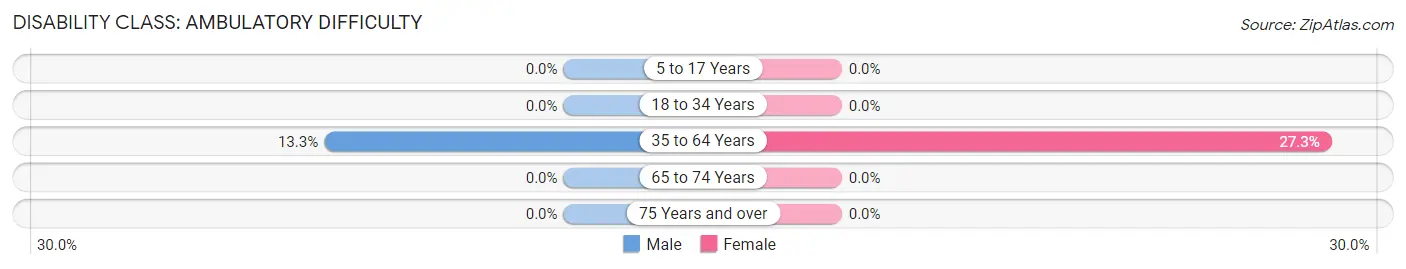
| Age Bracket | Male | Female |
| 5 to 17 Years | 0 (0.0%) | 0 (0.0%) |
| 18 to 34 Years | 0 (0.0%) | 0 (0.0%) |
| 35 to 64 Years | 2 (13.3%) | 3 (27.3%) |
| 65 to 74 Years | 0 (0.0%) | 0 (0.0%) |
| 75 Years and over | 0 (0.0%) | 0 (0.0%) |
Disability Class: Self-Care Difficulty
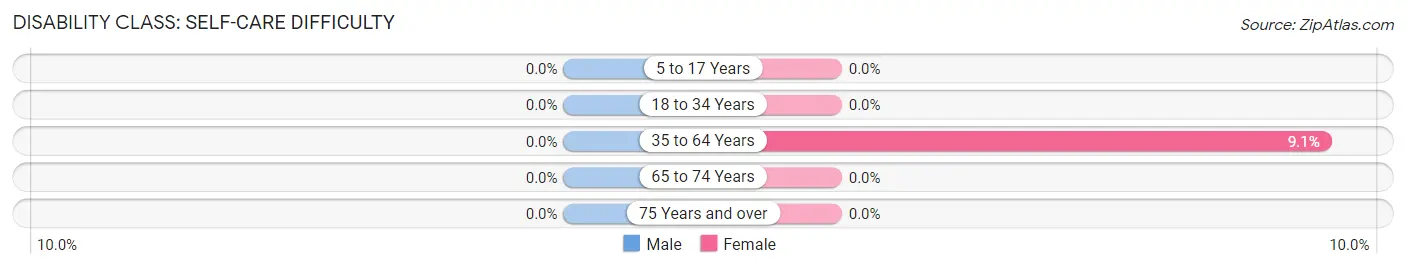
| Age Bracket | Male | Female |
| 5 to 17 Years | 0 (0.0%) | 0 (0.0%) |
| 18 to 34 Years | 0 (0.0%) | 0 (0.0%) |
| 35 to 64 Years | 0 (0.0%) | 1 (9.1%) |
| 65 to 74 Years | 0 (0.0%) | 0 (0.0%) |
| 75 Years and over | 0 (0.0%) | 0 (0.0%) |
Technology Access in Reubens
Computing Device Access in Reubens
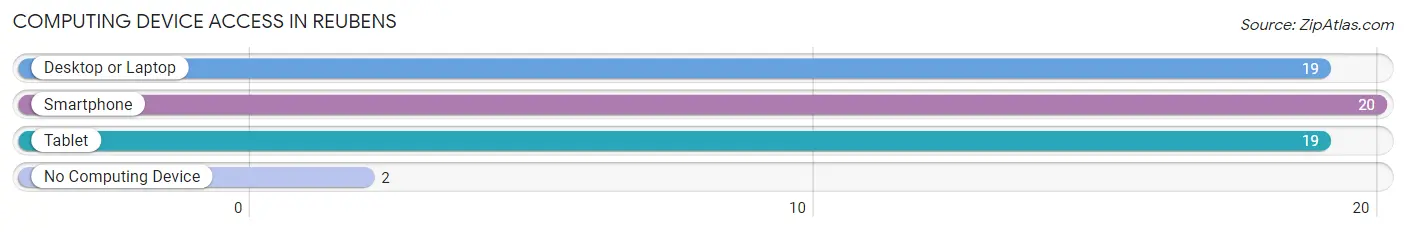
| Device Type | # Households | % Households |
| Desktop or Laptop | 19 | 82.6% |
| Smartphone | 20 | 87.0% |
| Tablet | 19 | 82.6% |
| No Computing Device | 2 | 8.7% |
| Total | 23 | 100.0% |
Internet Access in Reubens
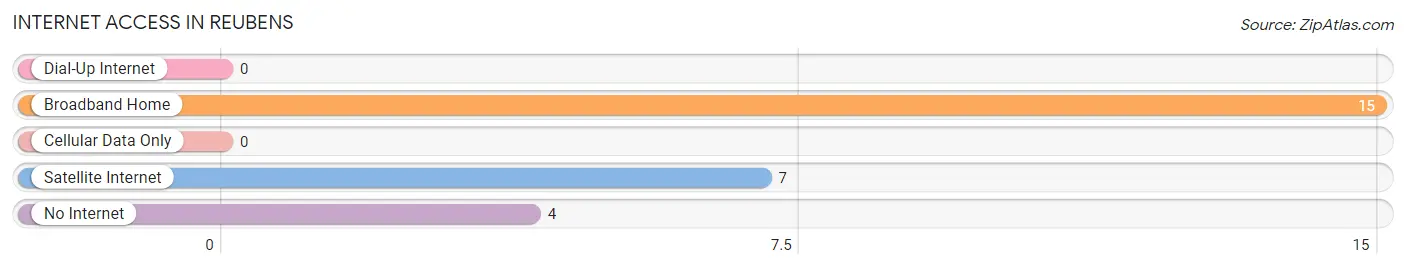
| Internet Type | # Households | % Households |
| Dial-Up Internet | 0 | 0.0% |
| Broadband Home | 15 | 65.2% |
| Cellular Data Only | 0 | 0.0% |
| Satellite Internet | 7 | 30.4% |
| No Internet | 4 | 17.4% |
| Total | 23 | 100.0% |
Reubens Summary
Reubens is a small city located in the northern part of Idaho, in the United States. It is situated in the Clearwater River Valley, and is part of the Nez Perce County. The city is located at an elevation of 2,743 feet, and has a population of approximately 1,000 people.
History
Reubens was founded in 1883 by a group of settlers from the Midwest. The settlers were looking for a place to settle and start a new life, and they chose the area around Reubens because of its fertile soil and abundant natural resources. The settlers named the town after Reuben Smith, one of the original settlers.
The town quickly grew and prospered, and by the early 1900s, it had become a thriving agricultural community. The town was home to several businesses, including a general store, a blacksmith shop, a sawmill, and a flour mill.
In the early 1900s, the town was also home to a large number of Native Americans, who had been living in the area for centuries. The Native Americans were a major part of the town's economy, and they provided much of the labor for the local businesses.
Geography
Reubens is located in the northern part of Idaho, in the Clearwater River Valley. The city is situated at an elevation of 2,743 feet, and is surrounded by rolling hills and forests. The city is located near the Clearwater River, which provides a source of water for the city.
The climate in Reubens is generally mild, with temperatures ranging from the low 30s in the winter to the high 80s in the summer. The city receives an average of 20 inches of precipitation per year, with most of it falling in the form of snow in the winter months.
Economy
The economy of Reubens is largely based on agriculture. The city is home to several farms, which produce a variety of crops, including wheat, barley, oats, and hay. The city is also home to several small businesses, including a general store, a blacksmith shop, and a sawmill.
The city is also home to a number of tourist attractions, including the Clearwater River, which provides a source of recreation for visitors. The city is also home to several parks, including the Reubens City Park, which features a playground, picnic areas, and a walking trail.
Demographics
As of the 2010 census, the population of Reubens was 1,000 people. The racial makeup of the city was 95.2% White, 0.7% Native American, 0.3% Asian, 0.1% Pacific Islander, 0.1% from other races, and 3.7% from two or more races. The median household income in Reubens was $37,500, and the median age was 39.7 years.
Reubens is a small city with a rich history and a vibrant economy. The city is home to a diverse population, and is a great place to live and work. The city is home to a variety of businesses, and is a great place to visit for its natural beauty and recreational opportunities.
Common Questions
What is Per Capita Income in Reubens?
Per Capita income in Reubens is $24,661.
What is the Median Family Income in Reubens?
Median Family Income in Reubens is $71,250.
What is the Median Household income in Reubens?
Median Household Income in Reubens is $70,938.
What is Income or Wage Gap in Reubens?
Income or Wage Gap in Reubens is 43.1%.
Women in Reubens earn 56.9 cents for every dollar earned by a man.
What is Inequality or Gini Index in Reubens?
Inequality or Gini Index in Reubens is 0.22.
What is the Total Population of Reubens?
Total Population of Reubens is 72.
What is the Total Male Population of Reubens?
Total Male Population of Reubens is 34.
What is the Total Female Population of Reubens?
Total Female Population of Reubens is 38.
What is the Ratio of Males per 100 Females in Reubens?
There are 89.47 Males per 100 Females in Reubens.
What is the Ratio of Females per 100 Males in Reubens?
There are 111.76 Females per 100 Males in Reubens.
What is the Median Population Age in Reubens?
Median Population Age in Reubens is 28.2 Years.
What is the Average Family Size in Reubens
Average Family Size in Reubens is 3.2 People.
What is the Average Household Size in Reubens
Average Household Size in Reubens is 3.1 People.
How Large is the Labor Force in Reubens?
There are 34 People in the Labor Forcein in Reubens.
What is the Percentage of People in the Labor Force in Reubens?
73.9% of People are in the Labor Force in Reubens.