North Washington, IA Map & Demographics
North Washington Map
North Washington Overview
$34,638
PER CAPITA INCOME
$88,333
AVG FAMILY INCOME
$83,333
AVG HOUSEHOLD INCOME
0.31
INEQUALITY / GINI INDEX
144
TOTAL POPULATION
87
MALE POPULATION
57
FEMALE POPULATION
152.63
MALES / 100 FEMALES
65.52
FEMALES / 100 MALES
46.3
MEDIAN AGE
3.1
AVG FAMILY SIZE
2.9
AVG HOUSEHOLD SIZE
77
LABOR FORCE [ PEOPLE ]
67.0%
PERCENT IN LABOR FORCE
North Washington Area Codes
Income in North Washington
Income Overview in North Washington
Per Capita Income in North Washington is $34,638, while median incomes of families and households are $88,333 and $83,333 respectively.
| Characteristic | Number | Measure |
| Per Capita Income | 144 | $34,638 |
| Median Family Income | 42 | $88,333 |
| Mean Family Income | 42 | $102,824 |
| Median Household Income | 50 | $83,333 |
| Mean Household Income | 50 | $94,856 |
| Income Deficit | 42 | $0 |
| Wage / Income Gap (%) | 144 | 0.00% |
| Wage / Income Gap ($) | 144 | 100.00¢ per $1 |
| Gini / Inequality Index | 144 | 0.31 |
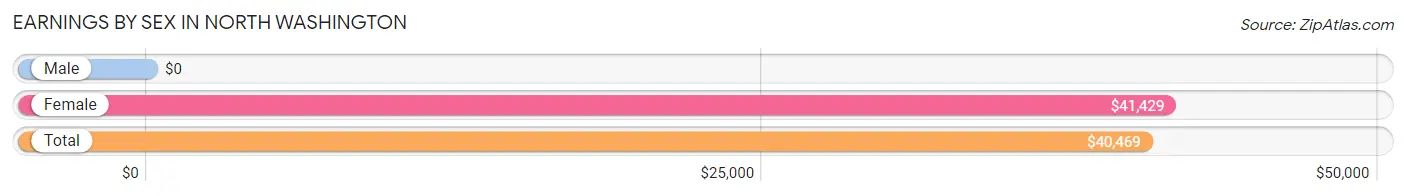
Earnings by Sex in North Washington
| Sex | Number | Average Earnings |
| Male | 51 (66.2%) | $0 |
| Female | 26 (33.8%) | $41,429 |
| Total | 77 (100.0%) | $40,469 |
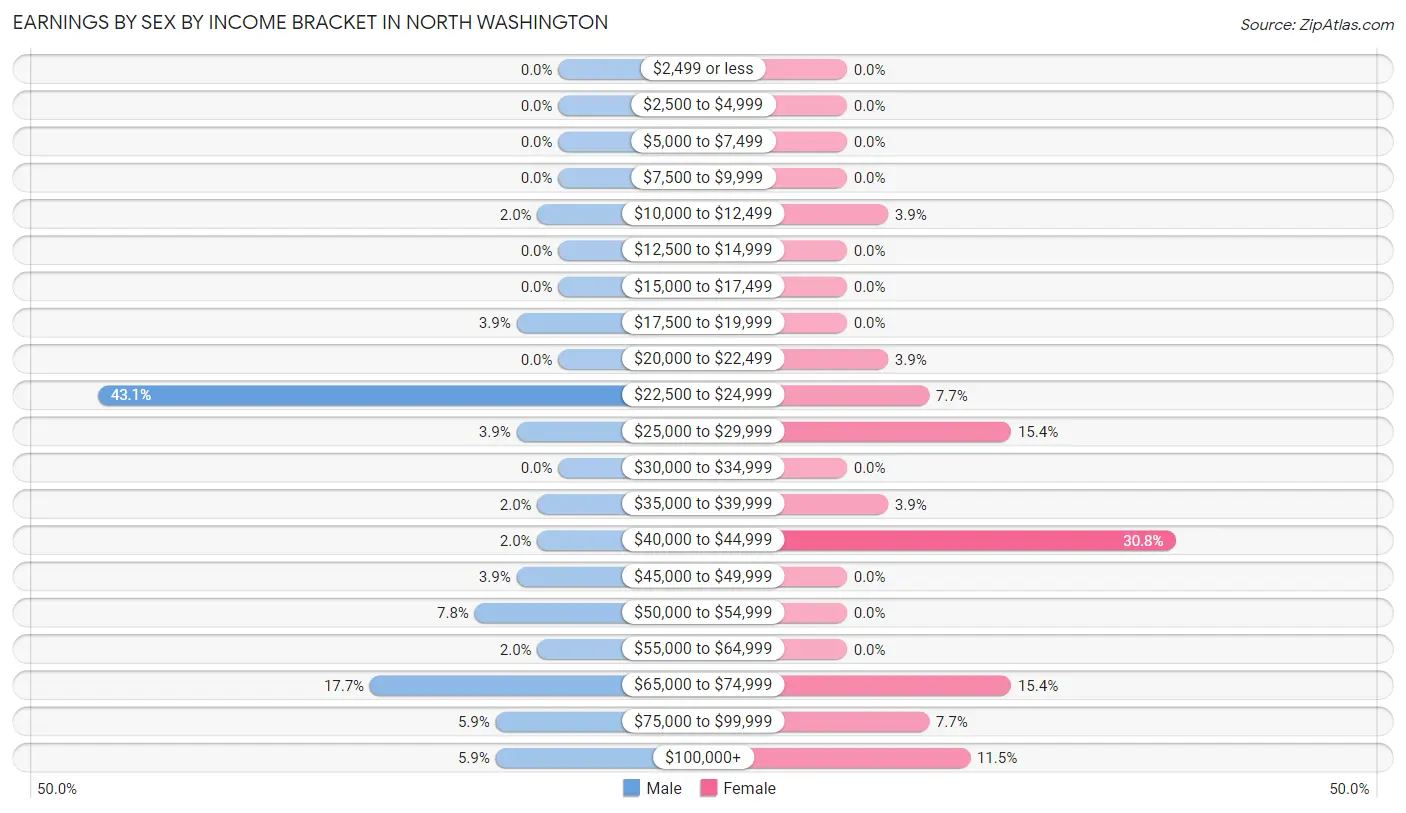
Earnings by Sex by Income Bracket in North Washington
The most common earnings brackets in North Washington are $22,500 to $24,999 for men (22 | 43.1%) and $40,000 to $44,999 for women (8 | 30.8%).
| Income | Male | Female |
| $2,499 or less | 0 (0.0%) | 0 (0.0%) |
| $2,500 to $4,999 | 0 (0.0%) | 0 (0.0%) |
| $5,000 to $7,499 | 0 (0.0%) | 0 (0.0%) |
| $7,500 to $9,999 | 0 (0.0%) | 0 (0.0%) |
| $10,000 to $12,499 | 1 (2.0%) | 1 (3.8%) |
| $12,500 to $14,999 | 0 (0.0%) | 0 (0.0%) |
| $15,000 to $17,499 | 0 (0.0%) | 0 (0.0%) |
| $17,500 to $19,999 | 2 (3.9%) | 0 (0.0%) |
| $20,000 to $22,499 | 0 (0.0%) | 1 (3.8%) |
| $22,500 to $24,999 | 22 (43.1%) | 2 (7.7%) |
| $25,000 to $29,999 | 2 (3.9%) | 4 (15.4%) |
| $30,000 to $34,999 | 0 (0.0%) | 0 (0.0%) |
| $35,000 to $39,999 | 1 (2.0%) | 1 (3.8%) |
| $40,000 to $44,999 | 1 (2.0%) | 8 (30.8%) |
| $45,000 to $49,999 | 2 (3.9%) | 0 (0.0%) |
| $50,000 to $54,999 | 4 (7.8%) | 0 (0.0%) |
| $55,000 to $64,999 | 1 (2.0%) | 0 (0.0%) |
| $65,000 to $74,999 | 9 (17.6%) | 4 (15.4%) |
| $75,000 to $99,999 | 3 (5.9%) | 2 (7.7%) |
| $100,000+ | 3 (5.9%) | 3 (11.5%) |
| Total | 51 (100.0%) | 26 (100.0%) |
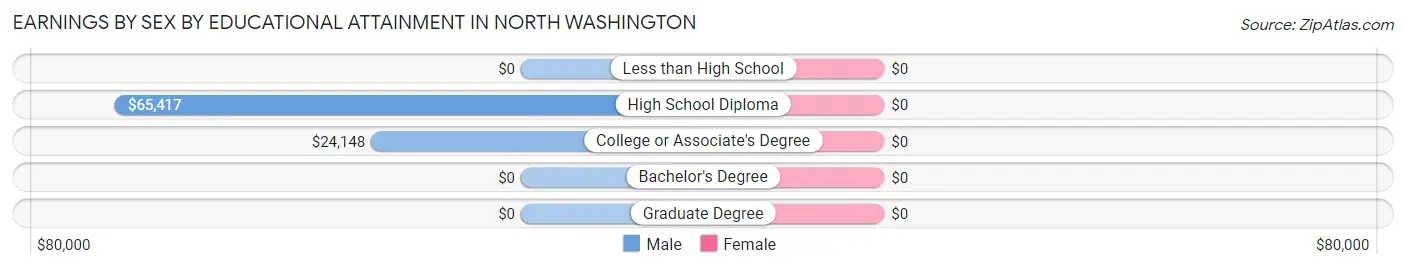
Earnings by Sex by Educational Attainment in North Washington
| Educational Attainment | Male Income | Female Income |
| Less than High School | - | - |
| High School Diploma | $65,417 | $0 |
| College or Associate's Degree | $24,148 | $0 |
| Bachelor's Degree | - | - |
| Graduate Degree | - | - |
| Total | - | - |
Family Income in North Washington
Family Income Brackets in North Washington
According to the North Washington family income data, there are 11 families falling into the $100,000 to $149,999 income range, which is the most common income bracket and makes up 26.2% of all families.
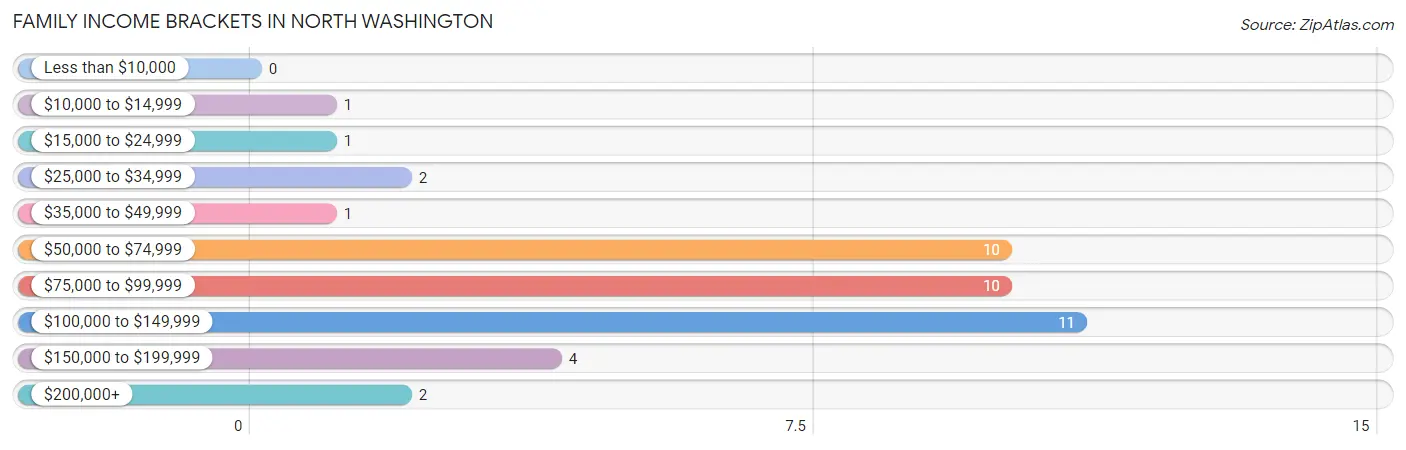
| Income Bracket | # Families | % Families |
| Less than $10,000 | 0 | 0.0% |
| $10,000 to $14,999 | 1 | 2.4% |
| $15,000 to $24,999 | 1 | 2.4% |
| $25,000 to $34,999 | 2 | 4.8% |
| $35,000 to $49,999 | 1 | 2.4% |
| $50,000 to $74,999 | 10 | 23.8% |
| $75,000 to $99,999 | 10 | 23.8% |
| $100,000 to $149,999 | 11 | 26.2% |
| $150,000 to $199,999 | 4 | 9.5% |
| $200,000+ | 2 | 4.8% |
Family Income by Famaliy Size in North Washington
3-person families (6 | 14.3%) account for the highest median family income in North Washington with $143,750 per family, while 2-person families (23 | 54.8%) have the highest median income of $59,375 per family member.
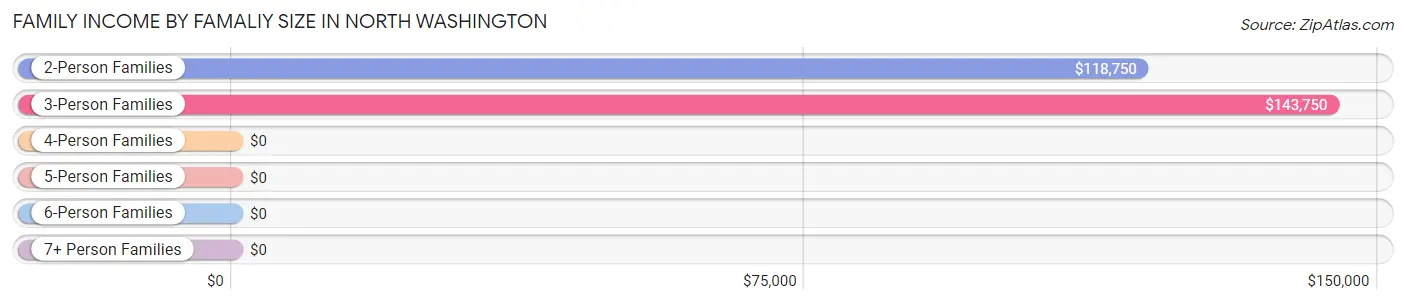
| Income Bracket | # Families | Median Income |
| 2-Person Families | 23 (54.8%) | $118,750 |
| 3-Person Families | 6 (14.3%) | $143,750 |
| 4-Person Families | 9 (21.4%) | $0 |
| 5-Person Families | 0 (0.0%) | $0 |
| 6-Person Families | 2 (4.8%) | $0 |
| 7+ Person Families | 2 (4.8%) | $0 |
| Total | 42 (100.0%) | $88,333 |
Family Income by Number of Earners in North Washington
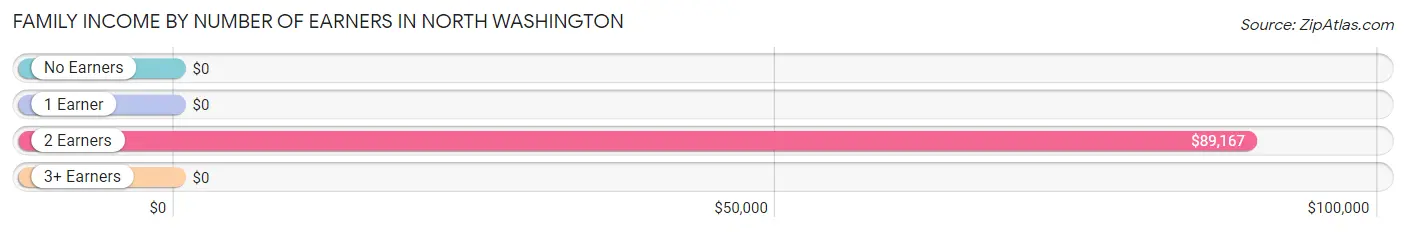
| Number of Earners | # Families | Median Income |
| No Earners | 10 (23.8%) | $0 |
| 1 Earner | 6 (14.3%) | $0 |
| 2 Earners | 26 (61.9%) | $89,167 |
| 3+ Earners | 0 (0.0%) | $0 |
| Total | 42 (100.0%) | $88,333 |
Household Income in North Washington
Household Income Brackets in North Washington
With 13 households falling in the category, the $50,000 to $74,999 income range is the most frequent in North Washington, accounting for 26.0% of all households.
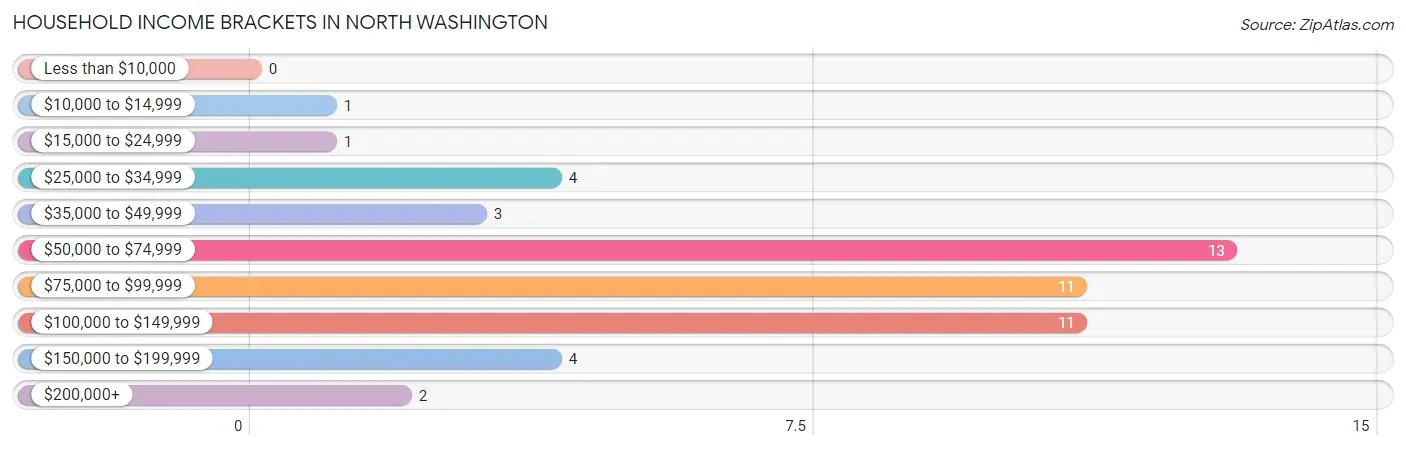
| Income Bracket | # Households | % Households |
| Less than $10,000 | 0 | 0.0% |
| $10,000 to $14,999 | 1 | 2.0% |
| $15,000 to $24,999 | 1 | 2.0% |
| $25,000 to $34,999 | 4 | 8.0% |
| $35,000 to $49,999 | 3 | 6.0% |
| $50,000 to $74,999 | 13 | 26.0% |
| $75,000 to $99,999 | 11 | 22.0% |
| $100,000 to $149,999 | 11 | 22.0% |
| $150,000 to $199,999 | 4 | 8.0% |
| $200,000+ | 2 | 4.0% |
Household Income by Householder Age in North Washington
The median household income in North Washington is $83,333, with the highest median household income of $91,250 found in the 45 to 64 years age bracket for the primary householder. A total of 14 households (28.0%) fall into this category. Meanwhile, the 15 to 24 years age bracket for the primary householder has the lowest median household income of $0, with 1 households (2.0%) in this group.
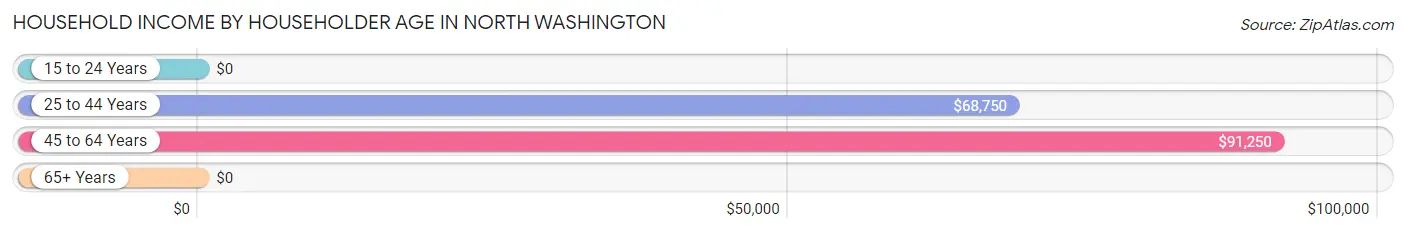
| Income Bracket | # Households | Median Income |
| 15 to 24 Years | 1 (2.0%) | $0 |
| 25 to 44 Years | 19 (38.0%) | $68,750 |
| 45 to 64 Years | 14 (28.0%) | $91,250 |
| 65+ Years | 16 (32.0%) | $0 |
| Total | 50 (100.0%) | $83,333 |
Poverty in North Washington
Income Below Poverty by Sex and Age in North Washington
With 8.1% poverty level for males and 17.5% for females among the residents of North Washington, 16 and 17 year old males and 5 year old females are the most vulnerable to poverty, with 2 males (100.0%) and 2 females (100.0%) in their respective age groups living below the poverty level.
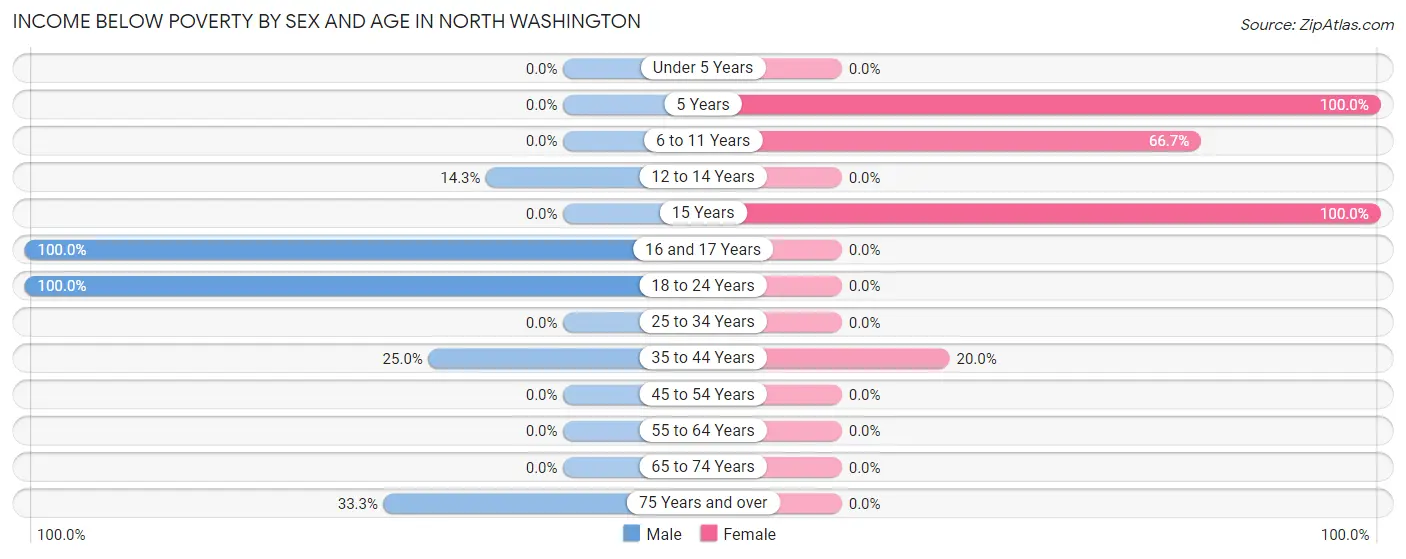
| Age Bracket | Male | Female |
| Under 5 Years | 0 (0.0%) | 0 (0.0%) |
| 5 Years | 0 (0.0%) | 2 (100.0%) |
| 6 to 11 Years | 0 (0.0%) | 4 (66.7%) |
| 12 to 14 Years | 1 (14.3%) | 0 (0.0%) |
| 15 Years | 0 (0.0%) | 2 (100.0%) |
| 16 and 17 Years | 2 (100.0%) | 0 (0.0%) |
| 18 to 24 Years | 1 (100.0%) | 0 (0.0%) |
| 25 to 34 Years | 0 (0.0%) | 0 (0.0%) |
| 35 to 44 Years | 2 (25.0%) | 2 (20.0%) |
| 45 to 54 Years | 0 (0.0%) | 0 (0.0%) |
| 55 to 64 Years | 0 (0.0%) | 0 (0.0%) |
| 65 to 74 Years | 0 (0.0%) | 0 (0.0%) |
| 75 Years and over | 1 (33.3%) | 0 (0.0%) |
| Total | 7 (8.1%) | 10 (17.5%) |
Income Above Poverty by Sex and Age in North Washington
According to the poverty statistics in North Washington, males aged under 5 years and females aged 16 and 17 years are the age groups that are most secure financially, with 100.0% of males and 100.0% of females in these age groups living above the poverty line.
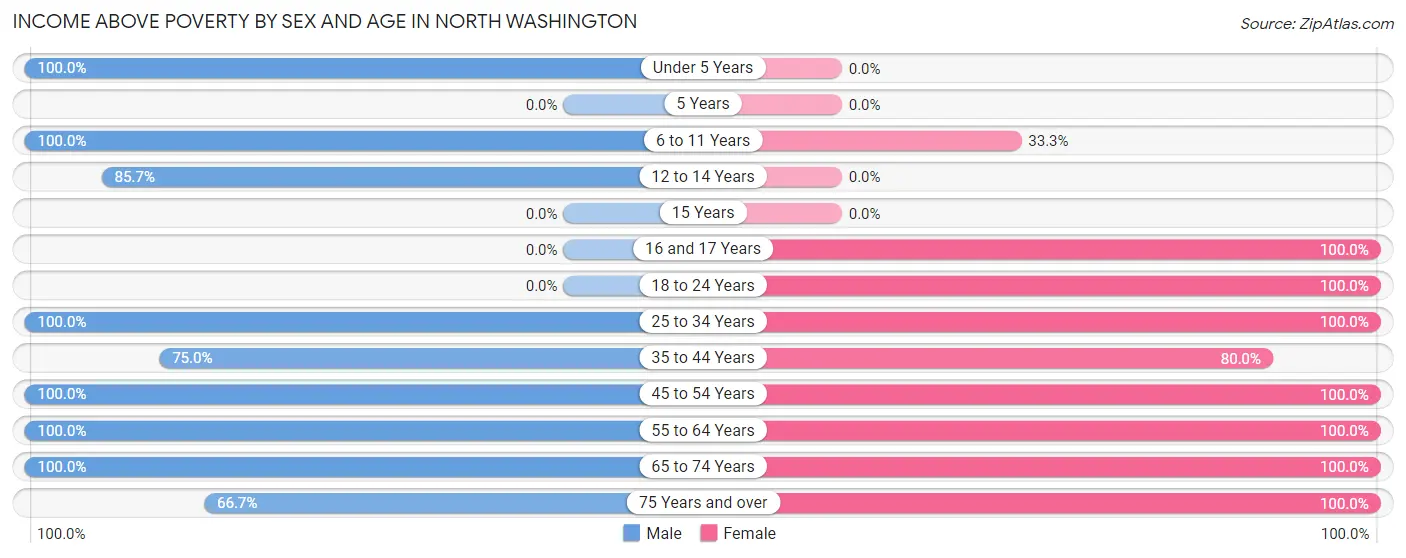
| Age Bracket | Male | Female |
| Under 5 Years | 1 (100.0%) | 0 (0.0%) |
| 5 Years | 0 (0.0%) | 0 (0.0%) |
| 6 to 11 Years | 10 (100.0%) | 2 (33.3%) |
| 12 to 14 Years | 6 (85.7%) | 0 (0.0%) |
| 15 Years | 0 (0.0%) | 0 (0.0%) |
| 16 and 17 Years | 0 (0.0%) | 5 (100.0%) |
| 18 to 24 Years | 0 (0.0%) | 2 (100.0%) |
| 25 to 34 Years | 3 (100.0%) | 5 (100.0%) |
| 35 to 44 Years | 6 (75.0%) | 8 (80.0%) |
| 45 to 54 Years | 28 (100.0%) | 7 (100.0%) |
| 55 to 64 Years | 8 (100.0%) | 8 (100.0%) |
| 65 to 74 Years | 15 (100.0%) | 9 (100.0%) |
| 75 Years and over | 2 (66.7%) | 1 (100.0%) |
| Total | 79 (91.9%) | 47 (82.5%) |
Income Below Poverty Among Married-Couple Families in North Washington
The poverty statistics for married-couple families in North Washington show that 4.9% or 2 of the total 41 families live below the poverty line. Families with 5 or more children have the highest poverty rate of 100.0%, comprising of 2 families. On the other hand, families with no children have the lowest poverty rate of 0.0%, which includes 0 families.
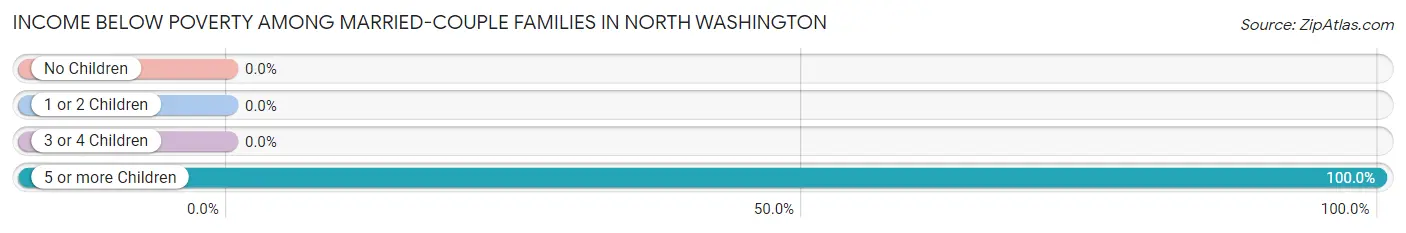
| Children | Above Poverty | Below Poverty |
| No Children | 23 (100.0%) | 0 (0.0%) |
| 1 or 2 Children | 14 (100.0%) | 0 (0.0%) |
| 3 or 4 Children | 2 (100.0%) | 0 (0.0%) |
| 5 or more Children | 0 (0.0%) | 2 (100.0%) |
| Total | 39 (95.1%) | 2 (4.9%) |
Income Below Poverty Among Single-Parent Households in North Washington
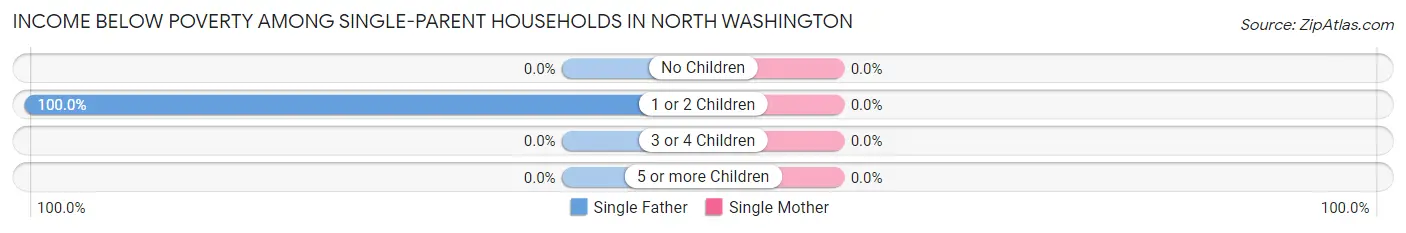
| Children | Single Father | Single Mother |
| No Children | 0 (0.0%) | 0 (0.0%) |
| 1 or 2 Children | 1 (100.0%) | 0 (0.0%) |
| 3 or 4 Children | 0 (0.0%) | 0 (0.0%) |
| 5 or more Children | 0 (0.0%) | 0 (0.0%) |
| Total | 1 (100.0%) | 0 (0.0%) |
Income Below Poverty Among Married-Couple vs Single-Parent Households in North Washington
The poverty data for North Washington shows that 2 of the married-couple family households (4.9%) and 1 of the single-parent households (100.0%) are living below the poverty level. Within the married-couple family households, those with 5 or more children have the highest poverty rate, with 2 households (100.0%) falling below the poverty line. Among the single-parent households, those with 1 or 2 children have the highest poverty rate, with 1 household (100.0%) living below poverty.
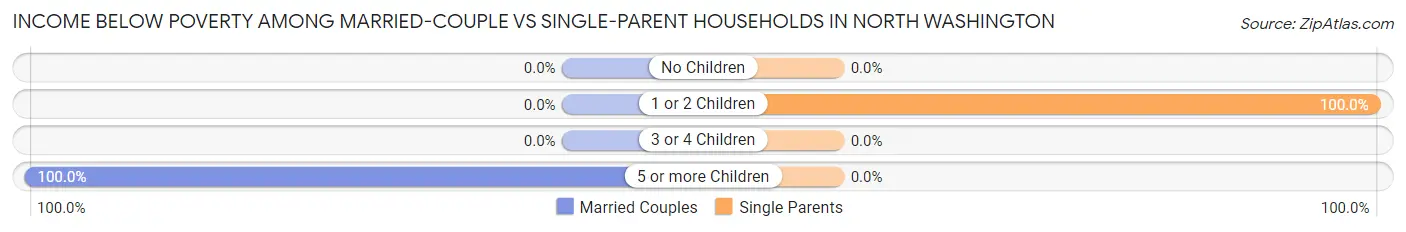
| Children | Married-Couple Families | Single-Parent Households |
| No Children | 0 (0.0%) | 0 (0.0%) |
| 1 or 2 Children | 0 (0.0%) | 1 (100.0%) |
| 3 or 4 Children | 0 (0.0%) | 0 (0.0%) |
| 5 or more Children | 2 (100.0%) | 0 (0.0%) |
| Total | 2 (4.9%) | 1 (100.0%) |
Race in North Washington
The most populous races in North Washington are White / Caucasian (130 | 90.3%), Some other Race (13 | 9.0%), and Hispanic or Latino (3 | 2.1%).
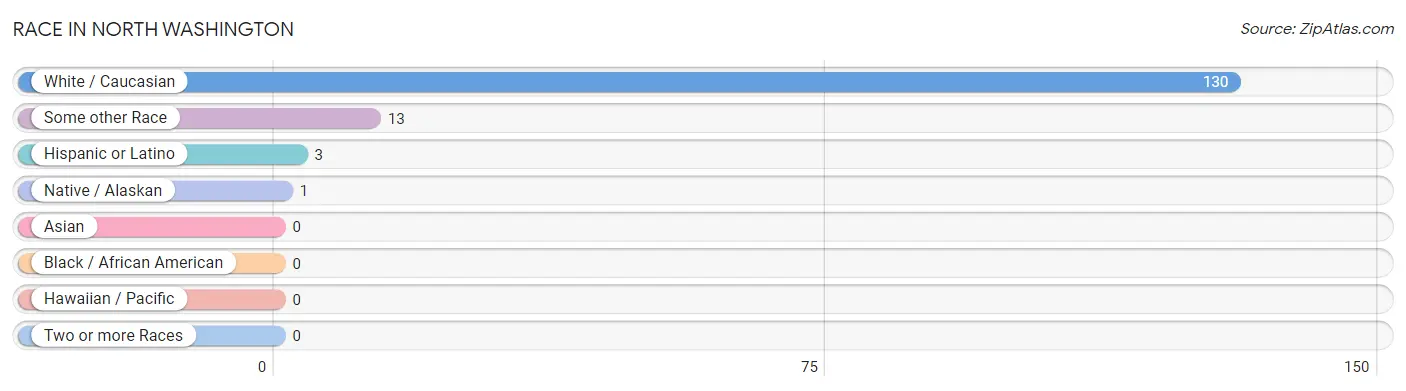
| Race | # Population | % Population |
| Asian | 0 | 0.0% |
| Black / African American | 0 | 0.0% |
| Hawaiian / Pacific | 0 | 0.0% |
| Hispanic or Latino | 3 | 2.1% |
| Native / Alaskan | 1 | 0.7% |
| White / Caucasian | 130 | 90.3% |
| Two or more Races | 0 | 0.0% |
| Some other Race | 13 | 9.0% |
| Total | 144 | 100.0% |
Ancestry in North Washington
The most populous ancestries reported in North Washington are German (47 | 32.6%), Norwegian (8 | 5.6%), Irish (7 | 4.9%), American (6 | 4.2%), and English (4 | 2.8%), together accounting for 50.0% of all North Washington residents.
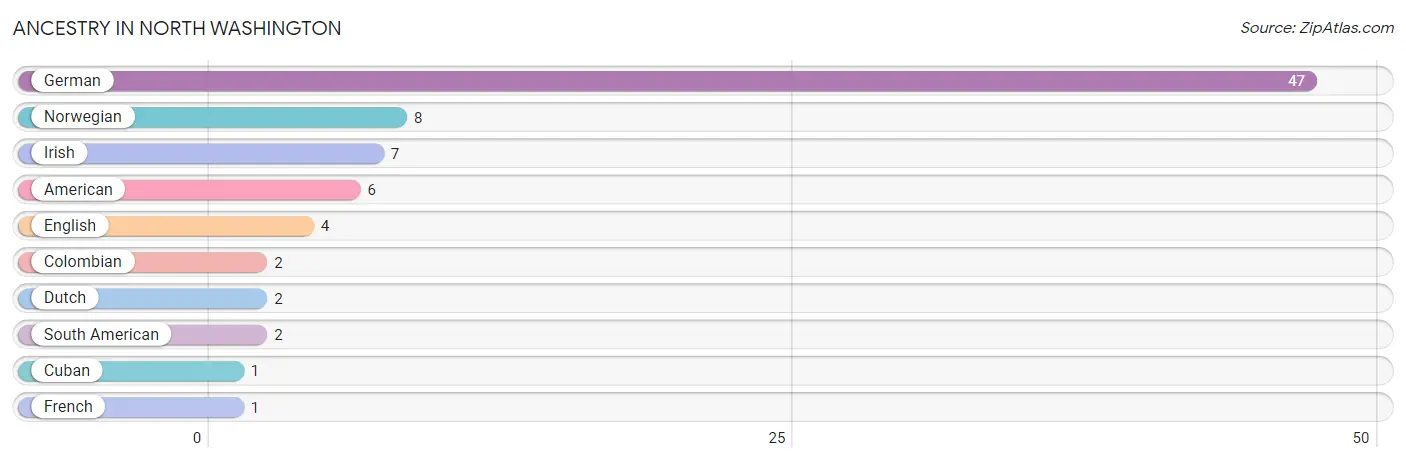
| Ancestry | # Population | % Population |
| American | 6 | 4.2% |
| Colombian | 2 | 1.4% |
| Cuban | 1 | 0.7% |
| Dutch | 2 | 1.4% |
| English | 4 | 2.8% |
| French | 1 | 0.7% |
| German | 47 | 32.6% |
| Irish | 7 | 4.9% |
| Norwegian | 8 | 5.6% |
| South American | 2 | 1.4% | View All 10 Rows |
Immigrants in North Washington
The most numerous immigrant groups reported in North Washington came from Colombia (2 | 1.4%), Latin America (2 | 1.4%), South America (2 | 1.4%), Europe (1 | 0.7%), and Germany (1 | 0.7%), together accounting for 5.6% of all North Washington residents.
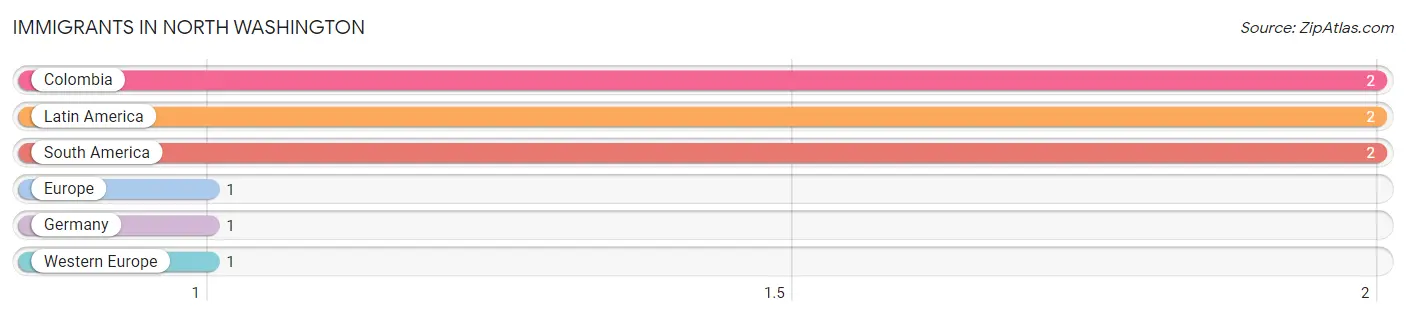
| Immigration Origin | # Population | % Population |
| Colombia | 2 | 1.4% |
| Europe | 1 | 0.7% |
| Germany | 1 | 0.7% |
| Latin America | 2 | 1.4% |
| South America | 2 | 1.4% |
| Western Europe | 1 | 0.7% | View All 6 Rows |
Sex and Age in North Washington
Sex and Age in North Washington
The most populous age groups in North Washington are 45 to 49 Years (28 | 32.2%) for men and 15 to 19 Years (7 | 12.3%) for women.
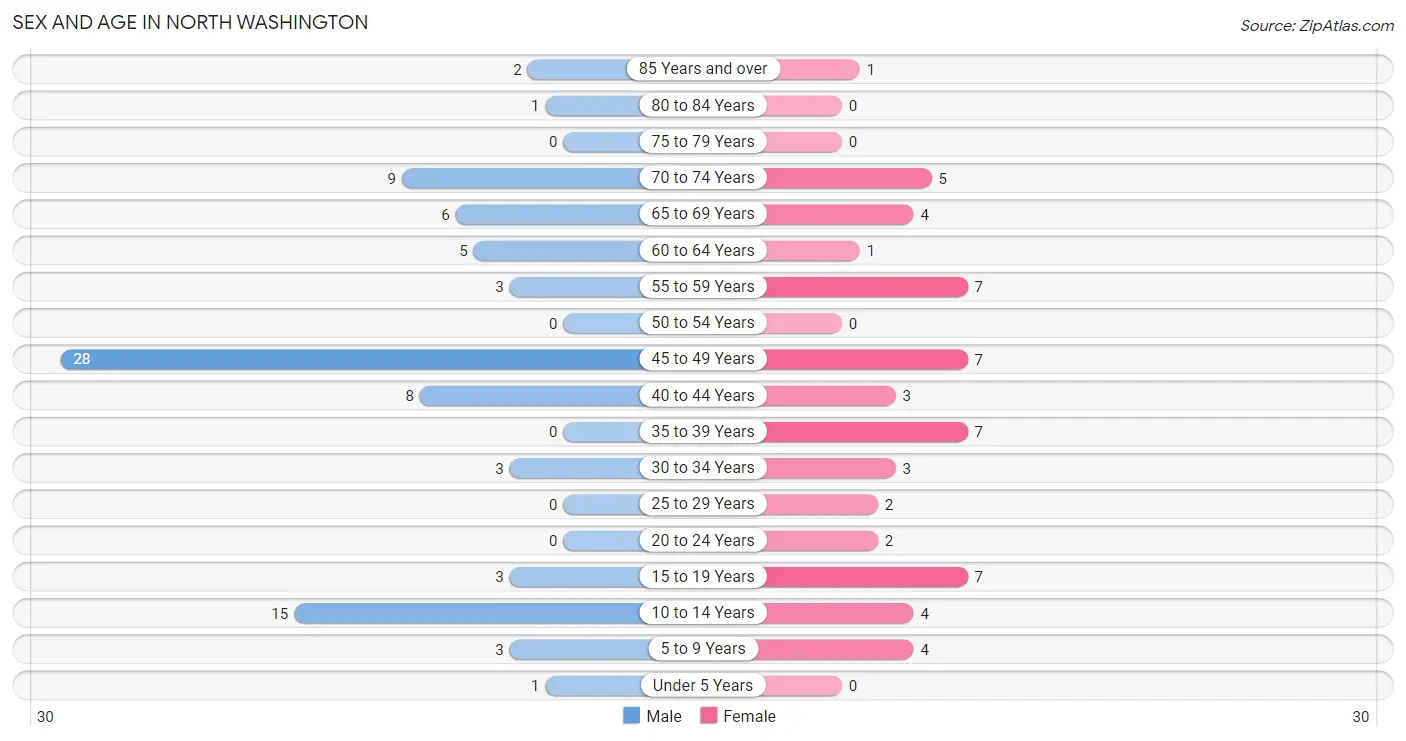
| Age Bracket | Male | Female |
| Under 5 Years | 1 (1.1%) | 0 (0.0%) |
| 5 to 9 Years | 3 (3.5%) | 4 (7.0%) |
| 10 to 14 Years | 15 (17.2%) | 4 (7.0%) |
| 15 to 19 Years | 3 (3.5%) | 7 (12.3%) |
| 20 to 24 Years | 0 (0.0%) | 2 (3.5%) |
| 25 to 29 Years | 0 (0.0%) | 2 (3.5%) |
| 30 to 34 Years | 3 (3.5%) | 3 (5.3%) |
| 35 to 39 Years | 0 (0.0%) | 7 (12.3%) |
| 40 to 44 Years | 8 (9.2%) | 3 (5.3%) |
| 45 to 49 Years | 28 (32.2%) | 7 (12.3%) |
| 50 to 54 Years | 0 (0.0%) | 0 (0.0%) |
| 55 to 59 Years | 3 (3.5%) | 7 (12.3%) |
| 60 to 64 Years | 5 (5.8%) | 1 (1.8%) |
| 65 to 69 Years | 6 (6.9%) | 4 (7.0%) |
| 70 to 74 Years | 9 (10.3%) | 5 (8.8%) |
| 75 to 79 Years | 0 (0.0%) | 0 (0.0%) |
| 80 to 84 Years | 1 (1.1%) | 0 (0.0%) |
| 85 Years and over | 2 (2.3%) | 1 (1.8%) |
| Total | 87 (100.0%) | 57 (100.0%) |
Families and Households in North Washington
Median Family Size in North Washington
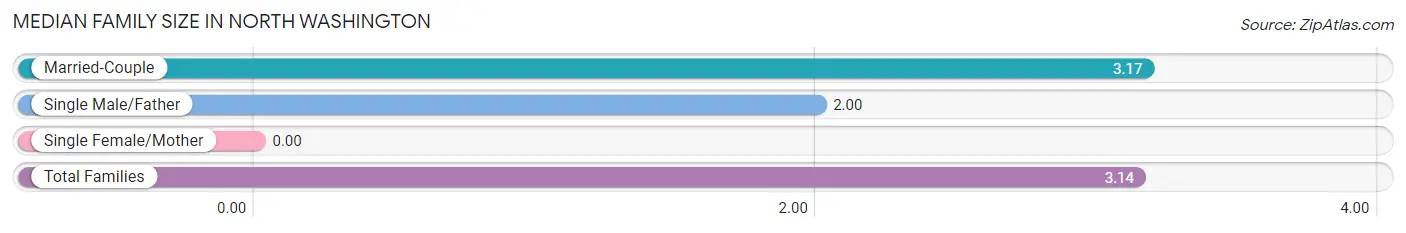
| Family Type | # Families | Family Size |
| Married-Couple | 41 (97.6%) | 3.17 |
| Single Male/Father | 1 (2.4%) | 2.00 |
| Single Female/Mother | 0 (0.0%) | - |
| Total Families | 42 (100.0%) | 3.14 |
Median Household Size in North Washington
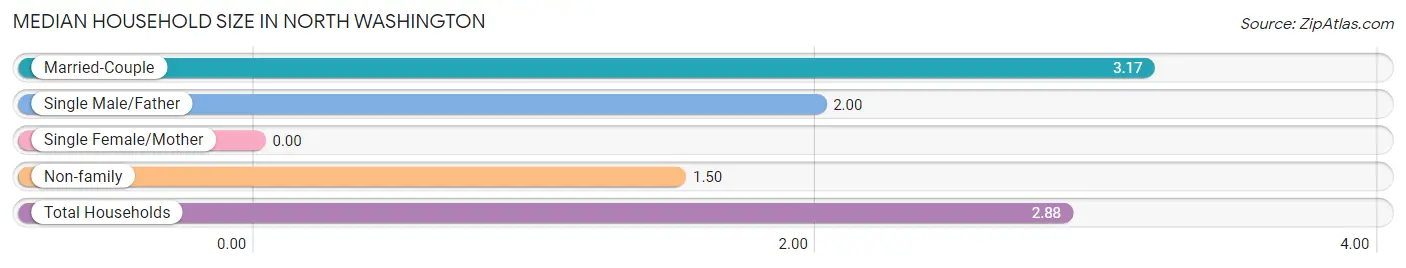
| Household Type | # Households | Household Size |
| Married-Couple | 41 (82.0%) | 3.17 |
| Single Male/Father | 1 (2.0%) | 2.00 |
| Single Female/Mother | 0 (0.0%) | - |
| Non-family | 8 (16.0%) | 1.50 |
| Total Households | 50 (100.0%) | 2.88 |
Household Size by Marriage Status in North Washington
Out of a total of 50 households in North Washington, 42 (84.0%) are family households, while 8 (16.0%) are nonfamily households. The most numerous type of family households are 2-person households, comprising 23, and the most common type of nonfamily households are 1-person households, comprising 6.
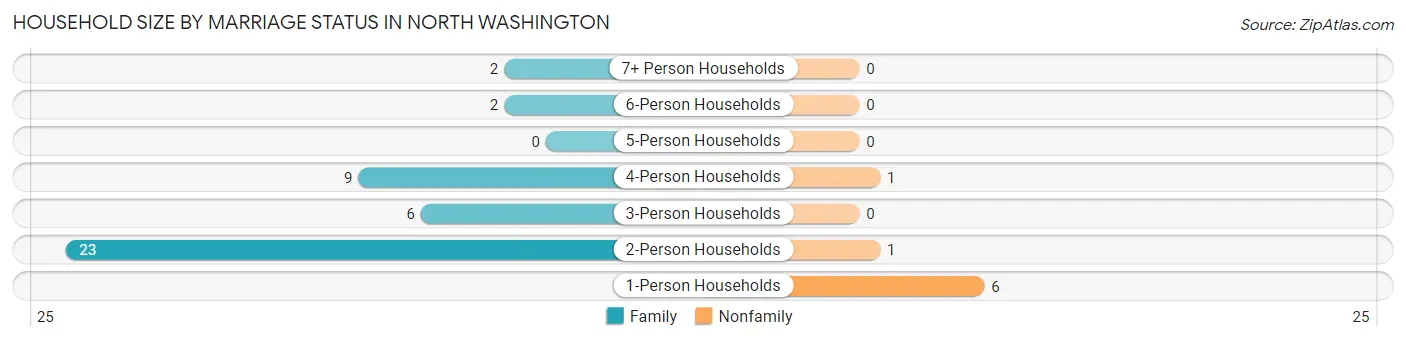
| Household Size | Family Households | Nonfamily Households |
| 1-Person Households | - | 6 (12.0%) |
| 2-Person Households | 23 (46.0%) | 1 (2.0%) |
| 3-Person Households | 6 (12.0%) | 0 (0.0%) |
| 4-Person Households | 9 (18.0%) | 1 (2.0%) |
| 5-Person Households | 0 (0.0%) | 0 (0.0%) |
| 6-Person Households | 2 (4.0%) | 0 (0.0%) |
| 7+ Person Households | 2 (4.0%) | 0 (0.0%) |
| Total | 42 (84.0%) | 8 (16.0%) |
Female Fertility in North Washington
Fertility by Age in North Washington
| Age Bracket | Women with Births | Births / 1,000 Women |
| 15 to 19 years | 0 (0.0%) | 0.0 |
| 20 to 34 years | 0 (0.0%) | 0.0 |
| 35 to 50 years | 0 (0.0%) | 0.0 |
| Total | 0 (0.0%) | 0.0 |
Fertility by Age by Marriage Status in North Washington
| Age Bracket | Married | Unmarried |
| 15 to 19 years | 0 (0.0%) | 0 (0.0%) |
| 20 to 34 years | 0 (0.0%) | 0 (0.0%) |
| 35 to 50 years | 0 (0.0%) | 0 (0.0%) |
| Total | 0 (0.0%) | 0 (0.0%) |
Fertility by Education in North Washington
| Educational Attainment | Women with Births | Births / 1,000 Women |
| Less than High School | 0 (0.0%) | 0.0 |
| High School Diploma | 0 (0.0%) | 0.0 |
| College or Associate's Degree | 0 (0.0%) | 0.0 |
| Bachelor's Degree | 0 (0.0%) | 0.0 |
| Graduate Degree | 0 (0.0%) | 0.0 |
| Total | 0 (0.0%) | 0.0 |
Fertility by Education by Marriage Status in North Washington
| Educational Attainment | Married | Unmarried |
| Less than High School | 0 (0.0%) | 0 (0.0%) |
| High School Diploma | 0 (0.0%) | 0 (0.0%) |
| College or Associate's Degree | 0 (0.0%) | 0 (0.0%) |
| Bachelor's Degree | 0 (0.0%) | 0 (0.0%) |
| Graduate Degree | 0 (0.0%) | 0 (0.0%) |
| Total | 0 (0.0%) | 0 (0.0%) |
Employment Characteristics in North Washington
Employment by Class of Employer in North Washington
Among the 55 employed individuals in North Washington, private company employees (42 | 76.4%), not-for-profit organizations (8 | 14.5%), and federal government employees (3 | 5.4%) make up the most common classes of employment.
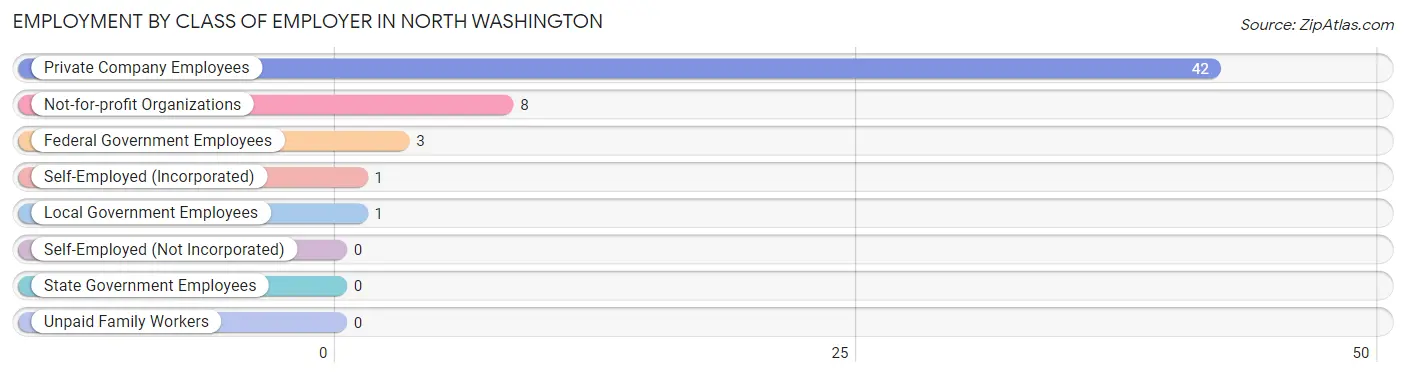
| Employer Class | # Employees | % Employees |
| Private Company Employees | 42 | 76.4% |
| Self-Employed (Incorporated) | 1 | 1.8% |
| Self-Employed (Not Incorporated) | 0 | 0.0% |
| Not-for-profit Organizations | 8 | 14.5% |
| Local Government Employees | 1 | 1.8% |
| State Government Employees | 0 | 0.0% |
| Federal Government Employees | 3 | 5.4% |
| Unpaid Family Workers | 0 | 0.0% |
| Total | 55 | 100.0% |
Employment Status by Age in North Washington
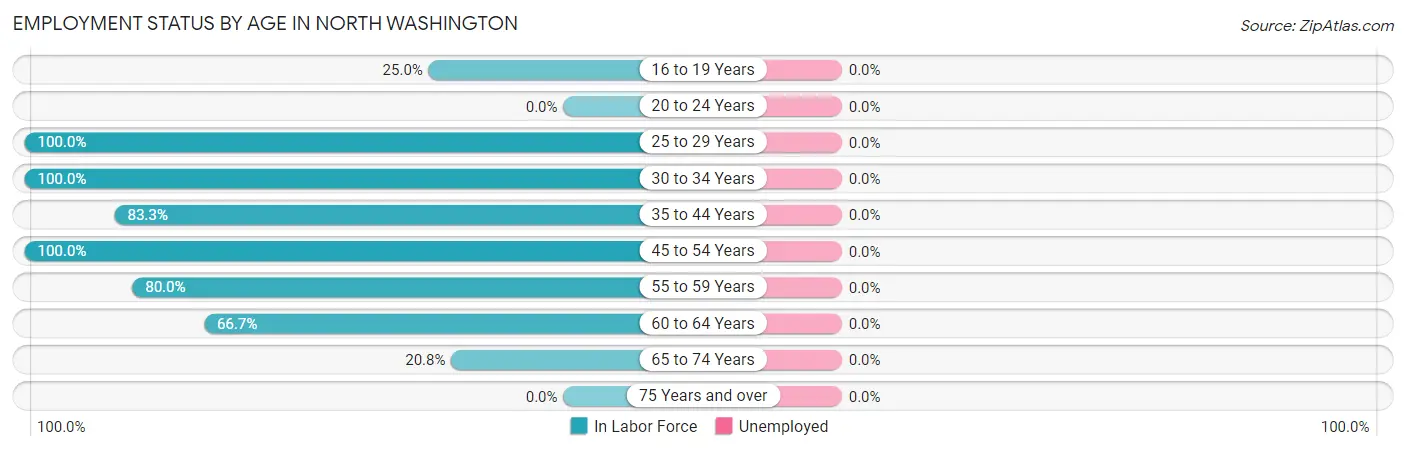
| Age Bracket | In Labor Force | Unemployed |
| 16 to 19 Years | 2 (25.0%) | 0 (0.0%) |
| 20 to 24 Years | 0 (0.0%) | 0 (0.0%) |
| 25 to 29 Years | 2 (100.0%) | 0 (0.0%) |
| 30 to 34 Years | 6 (100.0%) | 0 (0.0%) |
| 35 to 44 Years | 15 (83.3%) | 0 (0.0%) |
| 45 to 54 Years | 35 (100.0%) | 0 (0.0%) |
| 55 to 59 Years | 8 (80.0%) | 0 (0.0%) |
| 60 to 64 Years | 4 (66.7%) | 0 (0.0%) |
| 65 to 74 Years | 5 (20.8%) | 0 (0.0%) |
| 75 Years and over | 0 (0.0%) | 0 (0.0%) |
| Total | 77 (67.0%) | 0 (0.0%) |
Employment Status by Educational Attainment in North Washington
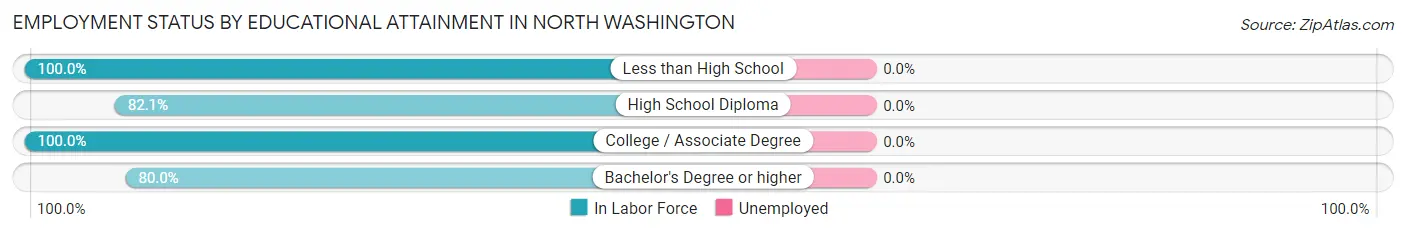
| Educational Attainment | In Labor Force | Unemployed |
| Less than High School | 1 (100.0%) | 0 (0.0%) |
| High School Diploma | 23 (82.1%) | 0 (0.0%) |
| College / Associate Degree | 38 (100.0%) | 0 (0.0%) |
| Bachelor's Degree or higher | 8 (80.0%) | 0 (0.0%) |
| Total | 70 (90.9%) | 0 (0.0%) |
Employment Occupations by Sex in North Washington
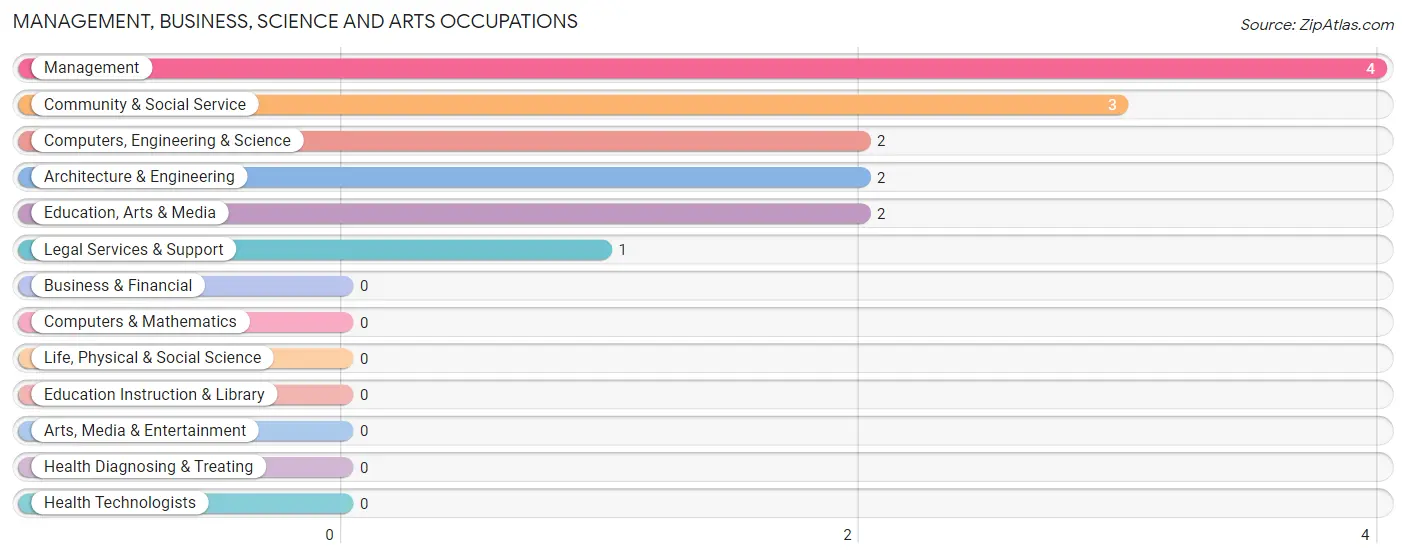
Management, Business, Science and Arts Occupations
The most common Management, Business, Science and Arts occupations in North Washington are Management (4 | 5.2%), Community & Social Service (3 | 3.9%), Computers, Engineering & Science (2 | 2.6%), Architecture & Engineering (2 | 2.6%), and Education, Arts & Media (2 | 2.6%).
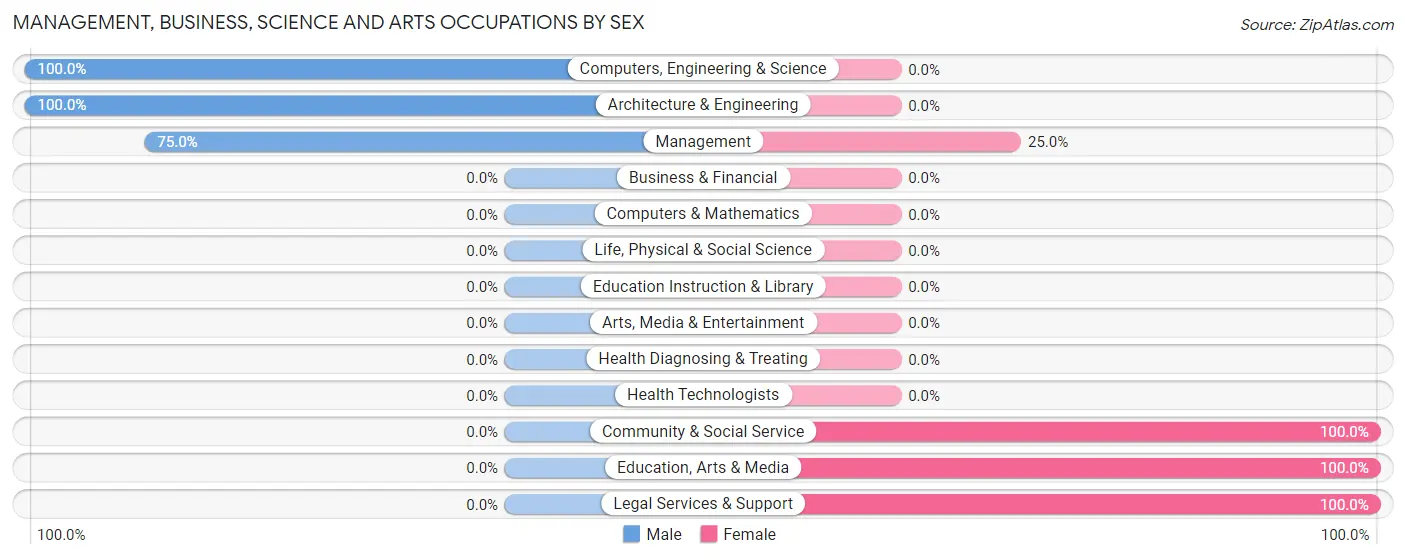
Management, Business, Science and Arts Occupations by Sex
Within the Management, Business, Science and Arts occupations in North Washington, the most male-oriented occupations are Computers, Engineering & Science (100.0%), Architecture & Engineering (100.0%), and Management (75.0%), while the most female-oriented occupations are Community & Social Service (100.0%), Education, Arts & Media (100.0%), and Legal Services & Support (100.0%).
| Occupation | Male | Female |
| Management | 3 (75.0%) | 1 (25.0%) |
| Business & Financial | 0 (0.0%) | 0 (0.0%) |
| Computers, Engineering & Science | 2 (100.0%) | 0 (0.0%) |
| Computers & Mathematics | 0 (0.0%) | 0 (0.0%) |
| Architecture & Engineering | 2 (100.0%) | 0 (0.0%) |
| Life, Physical & Social Science | 0 (0.0%) | 0 (0.0%) |
| Community & Social Service | 0 (0.0%) | 3 (100.0%) |
| Education, Arts & Media | 0 (0.0%) | 2 (100.0%) |
| Legal Services & Support | 0 (0.0%) | 1 (100.0%) |
| Education Instruction & Library | 0 (0.0%) | 0 (0.0%) |
| Arts, Media & Entertainment | 0 (0.0%) | 0 (0.0%) |
| Health Diagnosing & Treating | 0 (0.0%) | 0 (0.0%) |
| Health Technologists | 0 (0.0%) | 0 (0.0%) |
| Total (Category) | 5 (55.6%) | 4 (44.4%) |
| Total (Overall) | 51 (66.2%) | 26 (33.8%) |
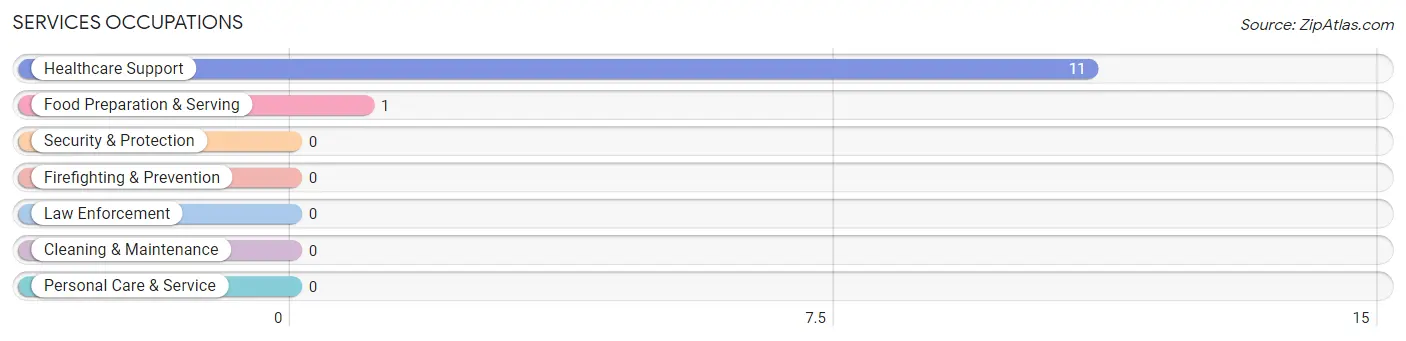
Services Occupations
The most common Services occupations in North Washington are Healthcare Support (11 | 14.3%), and Food Preparation & Serving (1 | 1.3%).
Services Occupations by Sex
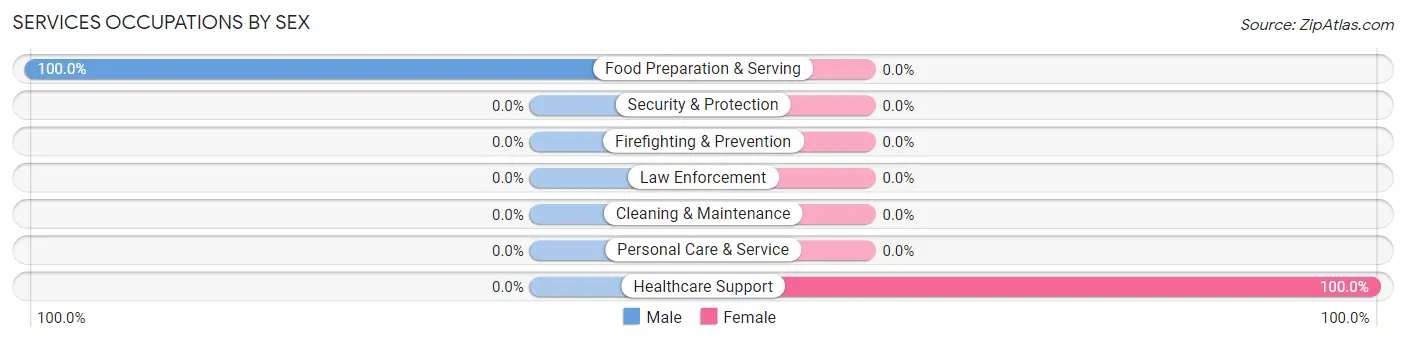
| Occupation | Male | Female |
| Healthcare Support | 0 (0.0%) | 11 (100.0%) |
| Security & Protection | 0 (0.0%) | 0 (0.0%) |
| Firefighting & Prevention | 0 (0.0%) | 0 (0.0%) |
| Law Enforcement | 0 (0.0%) | 0 (0.0%) |
| Food Preparation & Serving | 1 (100.0%) | 0 (0.0%) |
| Cleaning & Maintenance | 0 (0.0%) | 0 (0.0%) |
| Personal Care & Service | 0 (0.0%) | 0 (0.0%) |
| Total (Category) | 1 (8.3%) | 11 (91.7%) |
| Total (Overall) | 51 (66.2%) | 26 (33.8%) |
Sales and Office Occupations
The most common Sales and Office occupations in North Washington are , and Office & Administration (12 | 15.6%).
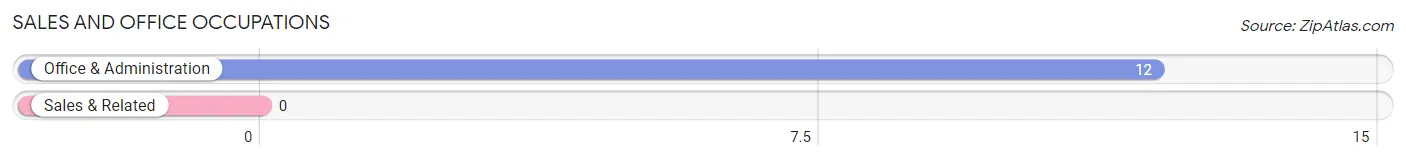
Sales and Office Occupations by Sex
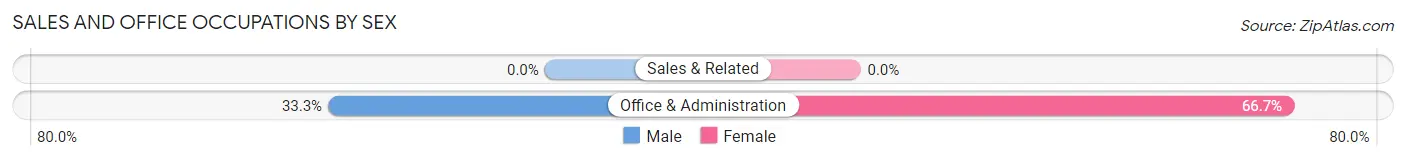
| Occupation | Male | Female |
| Sales & Related | 0 (0.0%) | 0 (0.0%) |
| Office & Administration | 4 (33.3%) | 8 (66.7%) |
| Total (Category) | 4 (33.3%) | 8 (66.7%) |
| Total (Overall) | 51 (66.2%) | 26 (33.8%) |
Natural Resources, Construction and Maintenance Occupations
The most common Natural Resources, Construction and Maintenance occupations in North Washington are Construction & Extraction (3 | 3.9%), and Farming, Fishing & Forestry (2 | 2.6%).
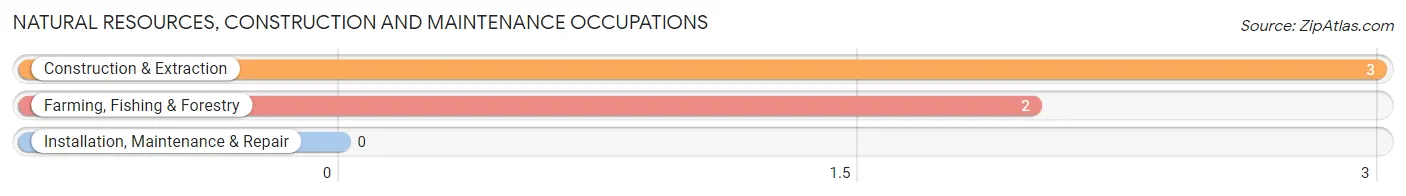
Natural Resources, Construction and Maintenance Occupations by Sex
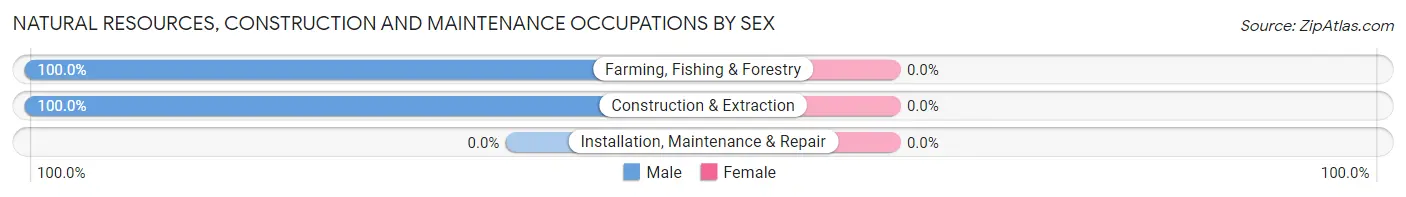
| Occupation | Male | Female |
| Farming, Fishing & Forestry | 2 (100.0%) | 0 (0.0%) |
| Construction & Extraction | 3 (100.0%) | 0 (0.0%) |
| Installation, Maintenance & Repair | 0 (0.0%) | 0 (0.0%) |
| Total (Category) | 5 (100.0%) | 0 (0.0%) |
| Total (Overall) | 51 (66.2%) | 26 (33.8%) |
Production, Transportation and Moving Occupations
The most common Production, Transportation and Moving occupations in North Washington are Material Moving (28 | 36.4%), Production (8 | 10.4%), and Transportation (3 | 3.9%).
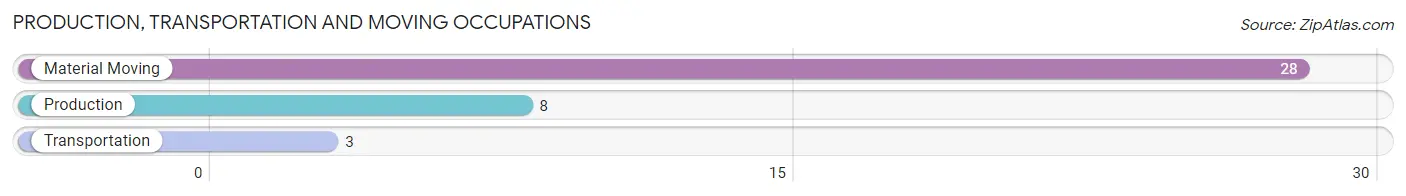
Production, Transportation and Moving Occupations by Sex
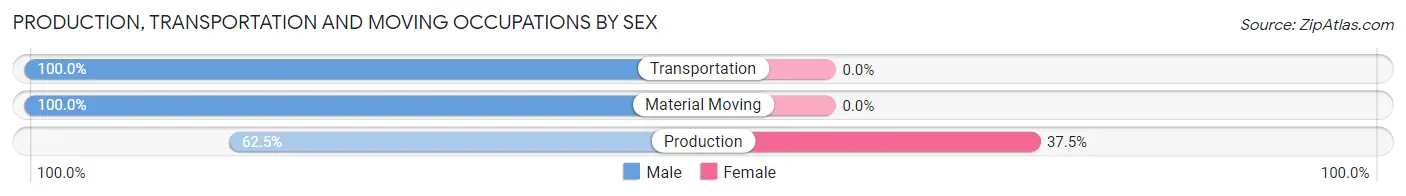
| Occupation | Male | Female |
| Production | 5 (62.5%) | 3 (37.5%) |
| Transportation | 3 (100.0%) | 0 (0.0%) |
| Material Moving | 28 (100.0%) | 0 (0.0%) |
| Total (Category) | 36 (92.3%) | 3 (7.7%) |
| Total (Overall) | 51 (66.2%) | 26 (33.8%) |
Employment Industries by Sex in North Washington
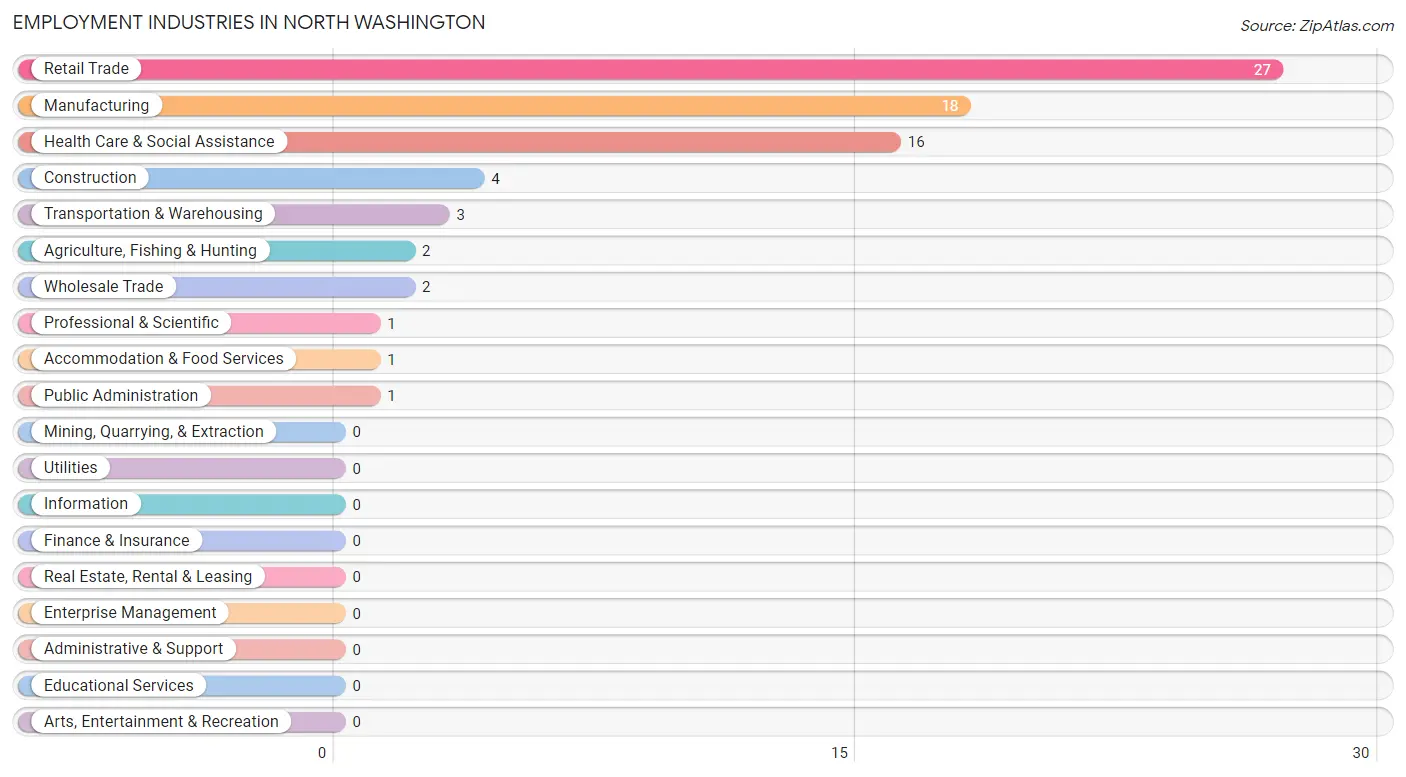
Employment Industries in North Washington
The major employment industries in North Washington include Retail Trade (27 | 35.1%), Manufacturing (18 | 23.4%), Health Care & Social Assistance (16 | 20.8%), Construction (4 | 5.2%), and Transportation & Warehousing (3 | 3.9%).
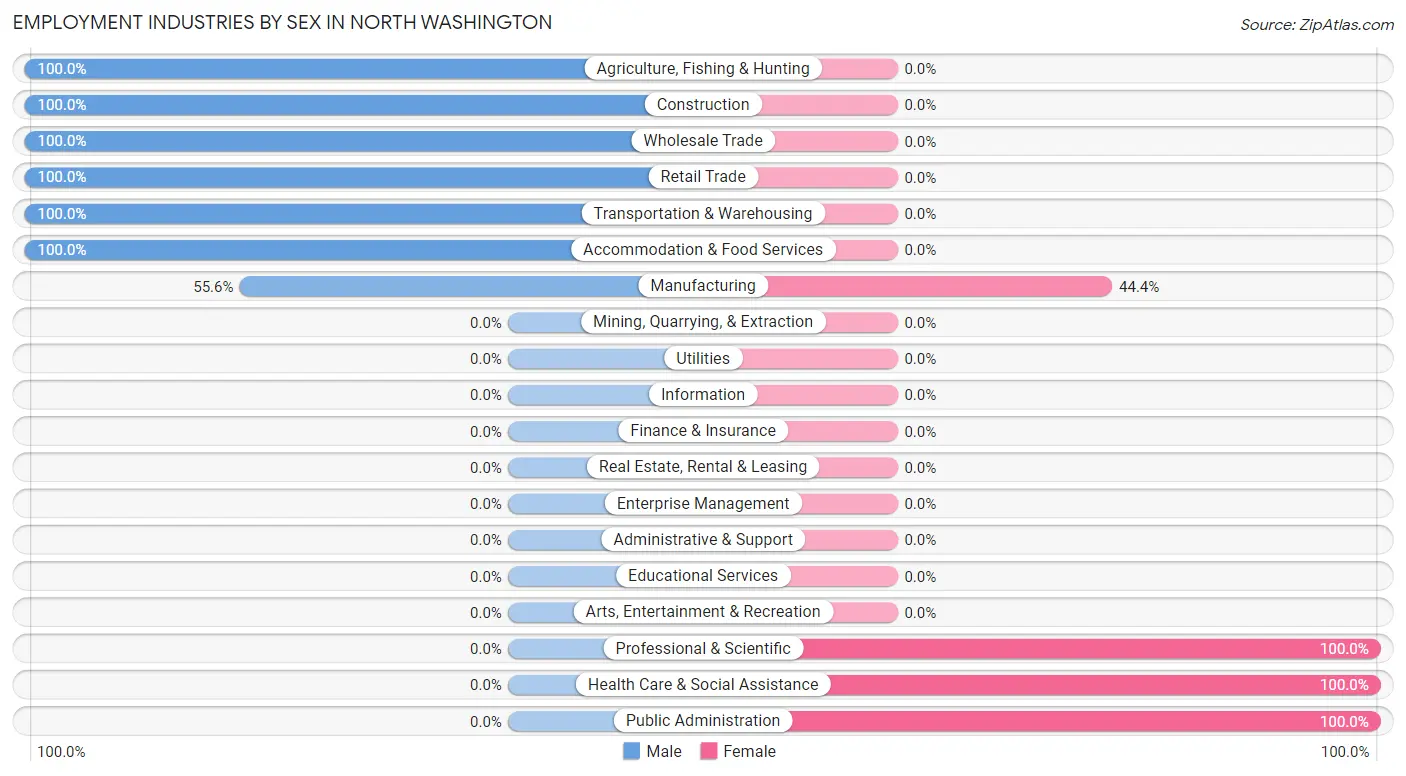
Employment Industries by Sex in North Washington
The North Washington industries that see more men than women are Agriculture, Fishing & Hunting (100.0%), Construction (100.0%), and Wholesale Trade (100.0%), whereas the industries that tend to have a higher number of women are Professional & Scientific (100.0%), Health Care & Social Assistance (100.0%), and Public Administration (100.0%).
| Industry | Male | Female |
| Agriculture, Fishing & Hunting | 2 (100.0%) | 0 (0.0%) |
| Mining, Quarrying, & Extraction | 0 (0.0%) | 0 (0.0%) |
| Construction | 4 (100.0%) | 0 (0.0%) |
| Manufacturing | 10 (55.6%) | 8 (44.4%) |
| Wholesale Trade | 2 (100.0%) | 0 (0.0%) |
| Retail Trade | 27 (100.0%) | 0 (0.0%) |
| Transportation & Warehousing | 3 (100.0%) | 0 (0.0%) |
| Utilities | 0 (0.0%) | 0 (0.0%) |
| Information | 0 (0.0%) | 0 (0.0%) |
| Finance & Insurance | 0 (0.0%) | 0 (0.0%) |
| Real Estate, Rental & Leasing | 0 (0.0%) | 0 (0.0%) |
| Professional & Scientific | 0 (0.0%) | 1 (100.0%) |
| Enterprise Management | 0 (0.0%) | 0 (0.0%) |
| Administrative & Support | 0 (0.0%) | 0 (0.0%) |
| Educational Services | 0 (0.0%) | 0 (0.0%) |
| Health Care & Social Assistance | 0 (0.0%) | 16 (100.0%) |
| Arts, Entertainment & Recreation | 0 (0.0%) | 0 (0.0%) |
| Accommodation & Food Services | 1 (100.0%) | 0 (0.0%) |
| Public Administration | 0 (0.0%) | 1 (100.0%) |
| Total | 51 (66.2%) | 26 (33.8%) |
Education in North Washington
School Enrollment in North Washington
The most common levels of schooling among the 36 students in North Washington are middle school (19 | 52.8%), high school (10 | 27.8%), and elementary school (5 | 13.9%).
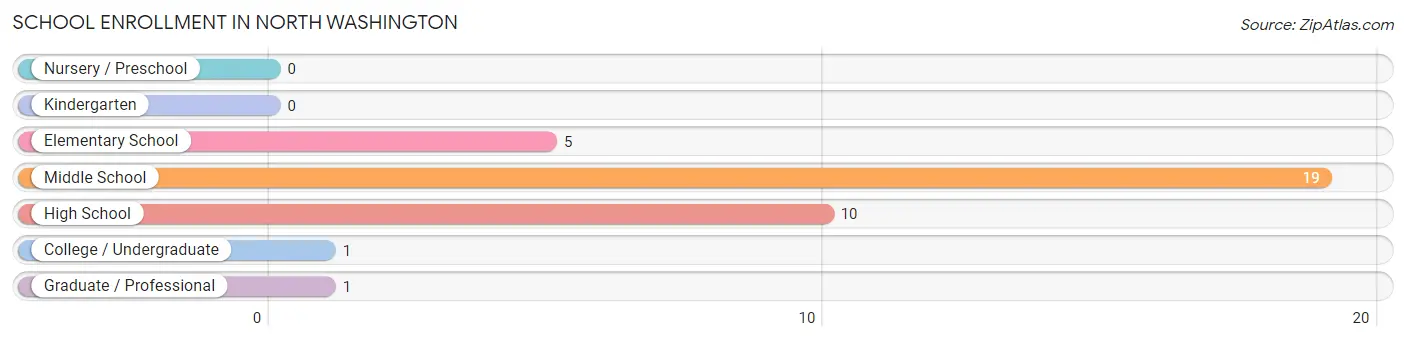
| School Level | # Students | % Students |
| Nursery / Preschool | 0 | 0.0% |
| Kindergarten | 0 | 0.0% |
| Elementary School | 5 | 13.9% |
| Middle School | 19 | 52.8% |
| High School | 10 | 27.8% |
| College / Undergraduate | 1 | 2.8% |
| Graduate / Professional | 1 | 2.8% |
| Total | 36 | 100.0% |
School Enrollment by Age by Funding Source in North Washington
Out of a total of 36 students who are enrolled in schools in North Washington, 17 (47.2%) attend a private institution, while the remaining 19 (52.8%) are enrolled in public schools. The age group of 35 years and over has the highest likelihood of being enrolled in private schools, with 1 (100.0% in the age bracket) enrolled. Conversely, the age group of 5 to 9 year old has the lowest likelihood of being enrolled in a private school, with 5 (100.0% in the age bracket) attending a public institution.
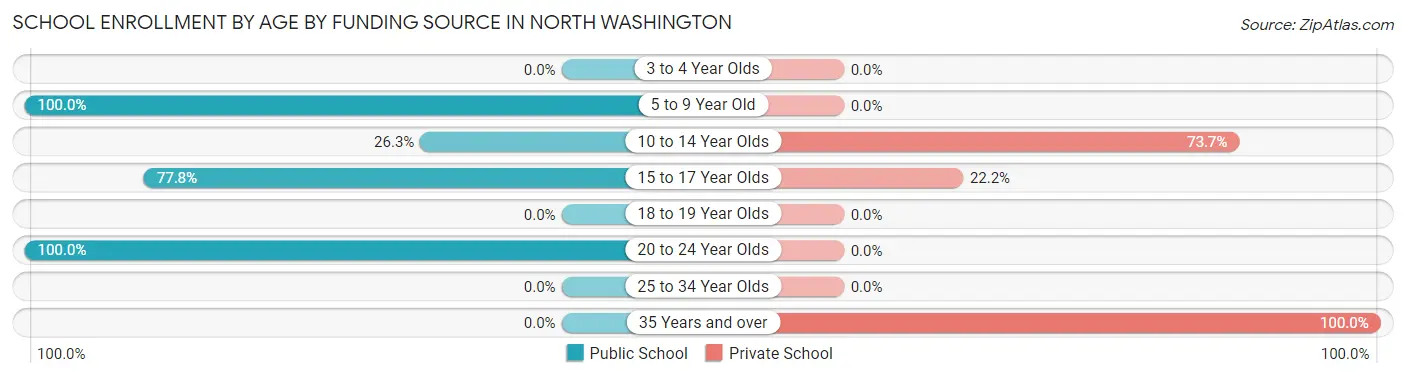
| Age Bracket | Public School | Private School |
| 3 to 4 Year Olds | 0 (0.0%) | 0 (0.0%) |
| 5 to 9 Year Old | 5 (100.0%) | 0 (0.0%) |
| 10 to 14 Year Olds | 5 (26.3%) | 14 (73.7%) |
| 15 to 17 Year Olds | 7 (77.8%) | 2 (22.2%) |
| 18 to 19 Year Olds | 0 (0.0%) | 0 (0.0%) |
| 20 to 24 Year Olds | 2 (100.0%) | 0 (0.0%) |
| 25 to 34 Year Olds | 0 (0.0%) | 0 (0.0%) |
| 35 Years and over | 0 (0.0%) | 1 (100.0%) |
| Total | 19 (52.8%) | 17 (47.2%) |
Educational Attainment by Field of Study in North Washington
Psychology (7 | 38.9%), arts & humanities (7 | 38.9%), business (3 | 16.7%), and education (1 | 5.6%) are the most common fields of study among 18 individuals in North Washington who have obtained a bachelor's degree or higher.
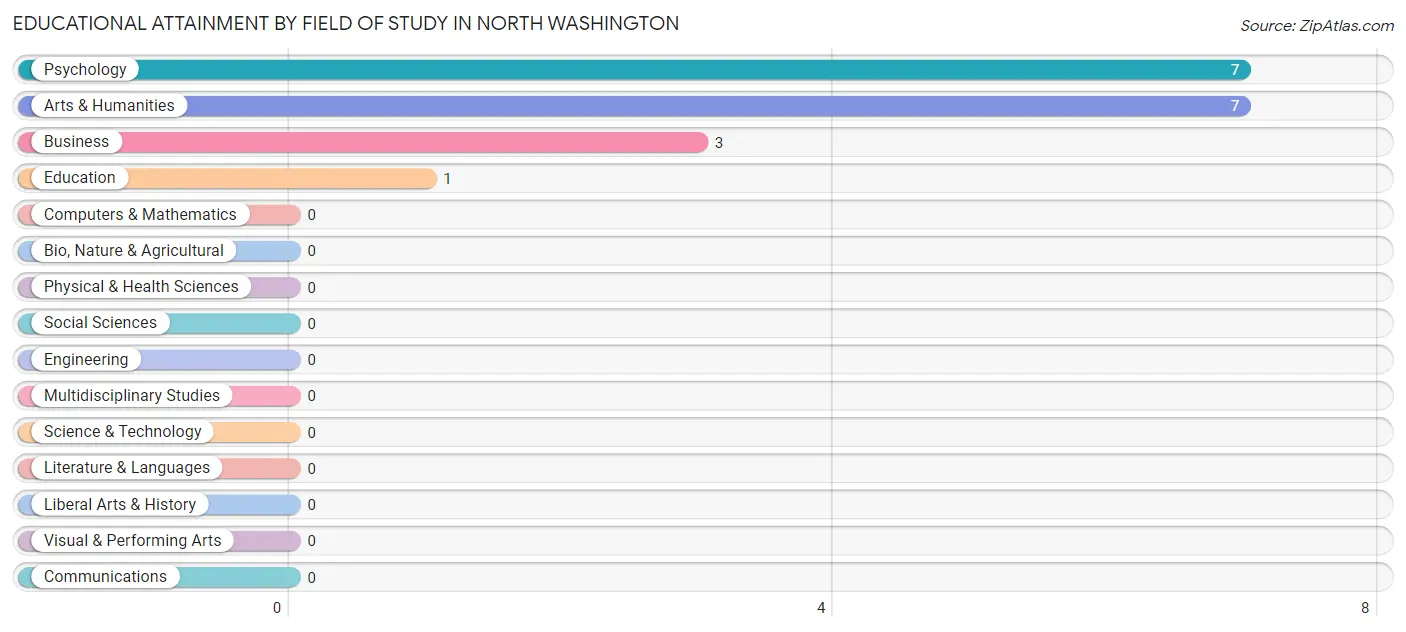
| Field of Study | # Graduates | % Graduates |
| Computers & Mathematics | 0 | 0.0% |
| Bio, Nature & Agricultural | 0 | 0.0% |
| Physical & Health Sciences | 0 | 0.0% |
| Psychology | 7 | 38.9% |
| Social Sciences | 0 | 0.0% |
| Engineering | 0 | 0.0% |
| Multidisciplinary Studies | 0 | 0.0% |
| Science & Technology | 0 | 0.0% |
| Business | 3 | 16.7% |
| Education | 1 | 5.6% |
| Literature & Languages | 0 | 0.0% |
| Liberal Arts & History | 0 | 0.0% |
| Visual & Performing Arts | 0 | 0.0% |
| Communications | 0 | 0.0% |
| Arts & Humanities | 7 | 38.9% |
| Total | 18 | 100.0% |
Transportation & Commute in North Washington
Vehicle Availability by Sex in North Washington
The most prevalent vehicle ownership categories in North Washington are males with 4 vehicles (13, accounting for 44.8%) and females with 4 vehicles (7, making up 50.0%).
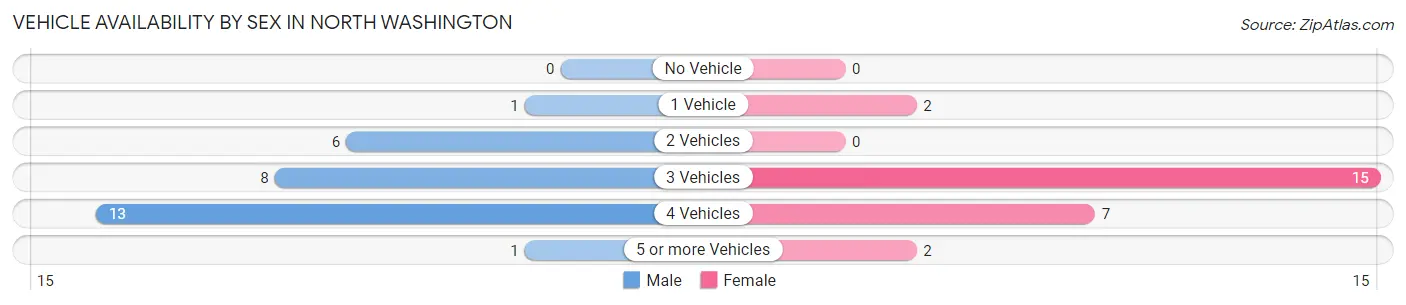
| Vehicles Available | Male | Female |
| No Vehicle | 0 (0.0%) | 0 (0.0%) |
| 1 Vehicle | 1 (3.5%) | 2 (7.7%) |
| 2 Vehicles | 6 (20.7%) | 0 (0.0%) |
| 3 Vehicles | 8 (27.6%) | 15 (57.7%) |
| 4 Vehicles | 13 (44.8%) | 7 (26.9%) |
| 5 or more Vehicles | 1 (3.5%) | 2 (7.7%) |
| Total | 29 (100.0%) | 26 (100.0%) |
Commute Time in North Washington
The most frequently occuring commute durations in North Washington are 15 to 19 minutes (20 commuters, 36.4%), 10 to 14 minutes (13 commuters, 23.6%), and 5 to 9 minutes (12 commuters, 21.8%).
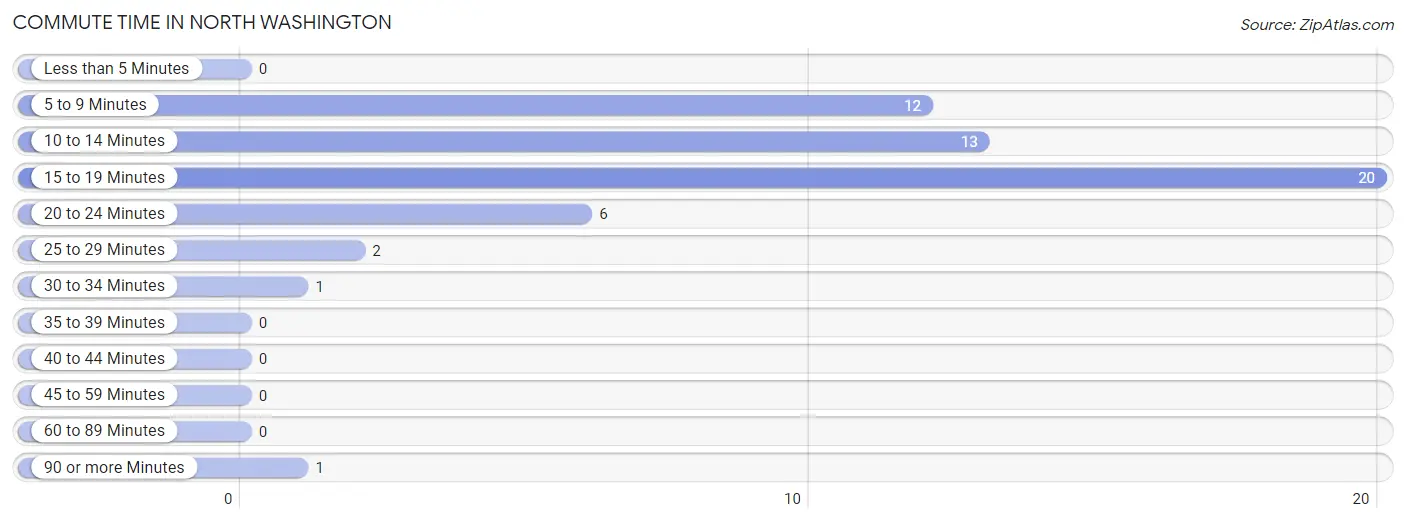
| Commute Time | # Commuters | % Commuters |
| Less than 5 Minutes | 0 | 0.0% |
| 5 to 9 Minutes | 12 | 21.8% |
| 10 to 14 Minutes | 13 | 23.6% |
| 15 to 19 Minutes | 20 | 36.4% |
| 20 to 24 Minutes | 6 | 10.9% |
| 25 to 29 Minutes | 2 | 3.6% |
| 30 to 34 Minutes | 1 | 1.8% |
| 35 to 39 Minutes | 0 | 0.0% |
| 40 to 44 Minutes | 0 | 0.0% |
| 45 to 59 Minutes | 0 | 0.0% |
| 60 to 89 Minutes | 0 | 0.0% |
| 90 or more Minutes | 1 | 1.8% |
Commute Time by Sex in North Washington
The most common commute times in North Washington are 5 to 9 minutes (8 commuters, 27.6%) for males and 15 to 19 minutes (13 commuters, 50.0%) for females.
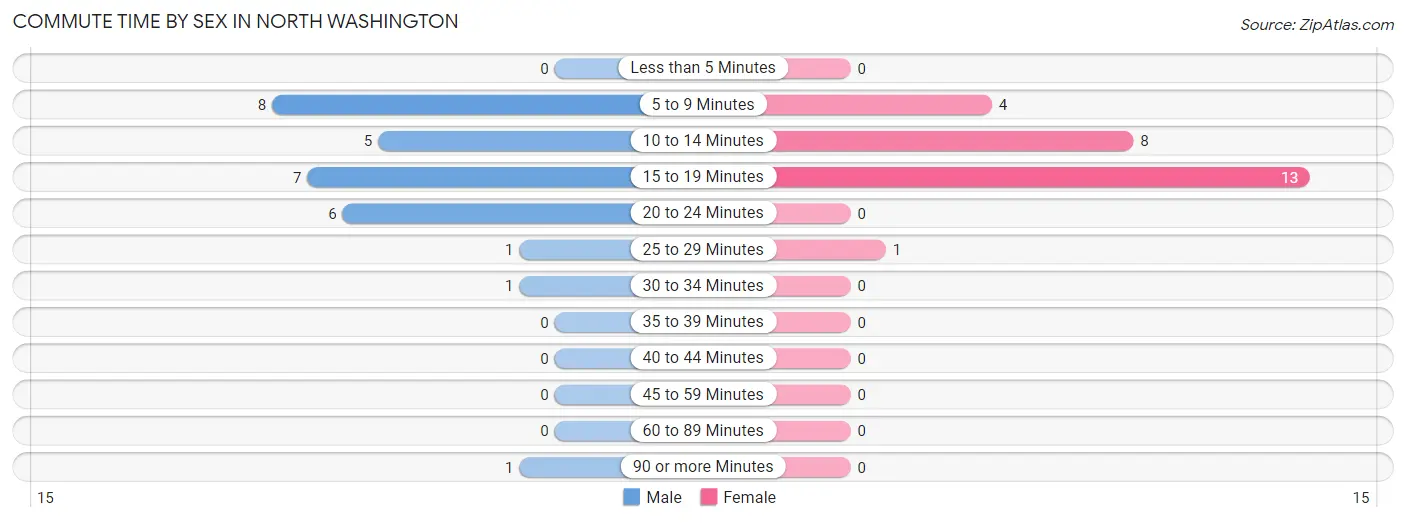
| Commute Time | Male | Female |
| Less than 5 Minutes | 0 (0.0%) | 0 (0.0%) |
| 5 to 9 Minutes | 8 (27.6%) | 4 (15.4%) |
| 10 to 14 Minutes | 5 (17.2%) | 8 (30.8%) |
| 15 to 19 Minutes | 7 (24.1%) | 13 (50.0%) |
| 20 to 24 Minutes | 6 (20.7%) | 0 (0.0%) |
| 25 to 29 Minutes | 1 (3.5%) | 1 (3.8%) |
| 30 to 34 Minutes | 1 (3.5%) | 0 (0.0%) |
| 35 to 39 Minutes | 0 (0.0%) | 0 (0.0%) |
| 40 to 44 Minutes | 0 (0.0%) | 0 (0.0%) |
| 45 to 59 Minutes | 0 (0.0%) | 0 (0.0%) |
| 60 to 89 Minutes | 0 (0.0%) | 0 (0.0%) |
| 90 or more Minutes | 1 (3.5%) | 0 (0.0%) |
Time of Departure to Work by Sex in North Washington
The most frequent times of departure to work in North Washington are 7:30 AM to 7:59 AM (6, 20.7%) for males and 5:30 AM to 5:59 AM (7, 26.9%) for females.
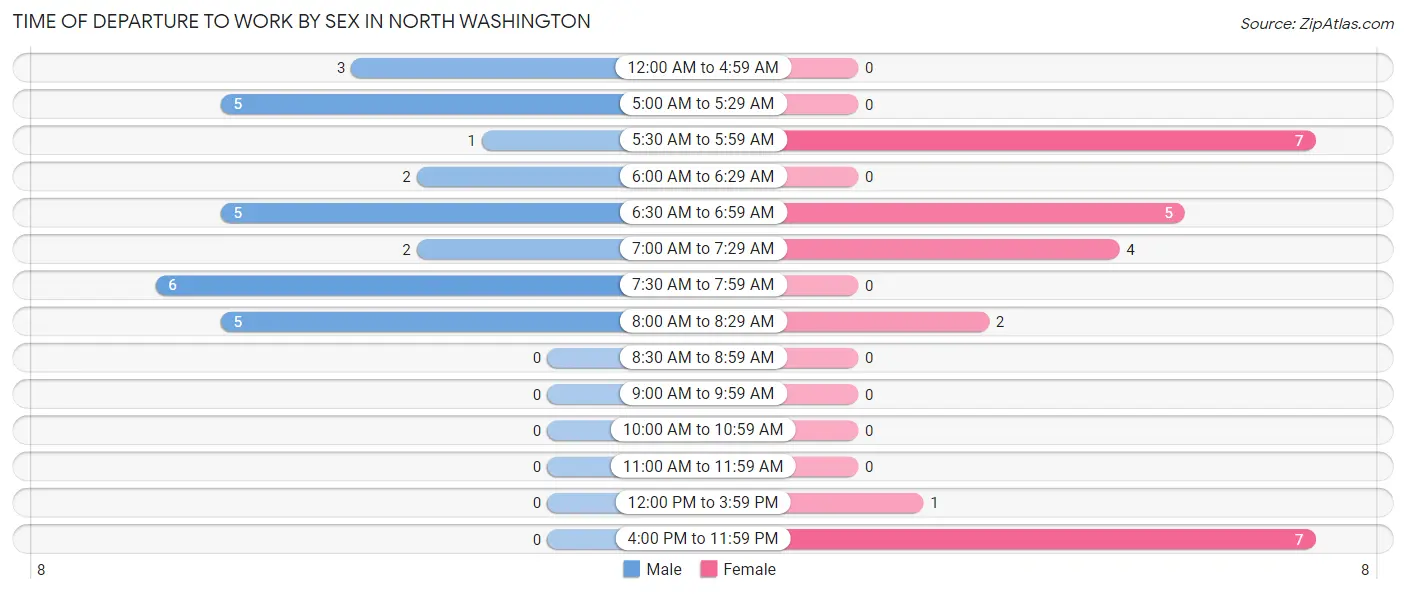
| Time of Departure | Male | Female |
| 12:00 AM to 4:59 AM | 3 (10.3%) | 0 (0.0%) |
| 5:00 AM to 5:29 AM | 5 (17.2%) | 0 (0.0%) |
| 5:30 AM to 5:59 AM | 1 (3.5%) | 7 (26.9%) |
| 6:00 AM to 6:29 AM | 2 (6.9%) | 0 (0.0%) |
| 6:30 AM to 6:59 AM | 5 (17.2%) | 5 (19.2%) |
| 7:00 AM to 7:29 AM | 2 (6.9%) | 4 (15.4%) |
| 7:30 AM to 7:59 AM | 6 (20.7%) | 0 (0.0%) |
| 8:00 AM to 8:29 AM | 5 (17.2%) | 2 (7.7%) |
| 8:30 AM to 8:59 AM | 0 (0.0%) | 0 (0.0%) |
| 9:00 AM to 9:59 AM | 0 (0.0%) | 0 (0.0%) |
| 10:00 AM to 10:59 AM | 0 (0.0%) | 0 (0.0%) |
| 11:00 AM to 11:59 AM | 0 (0.0%) | 0 (0.0%) |
| 12:00 PM to 3:59 PM | 0 (0.0%) | 1 (3.8%) |
| 4:00 PM to 11:59 PM | 0 (0.0%) | 7 (26.9%) |
| Total | 29 (100.0%) | 26 (100.0%) |
Housing Occupancy in North Washington
Occupancy by Ownership in North Washington
Of the total 50 dwellings in North Washington, owner-occupied units account for 48 (96.0%), while renter-occupied units make up 2 (4.0%).
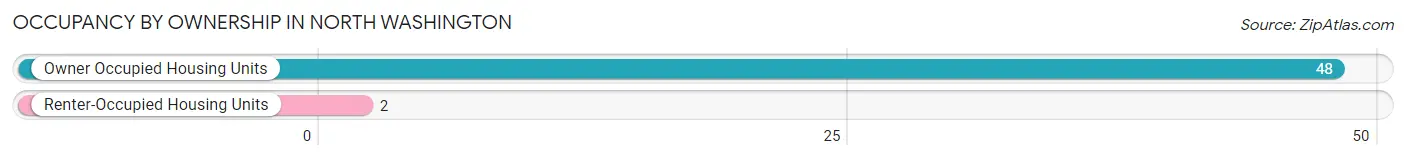
| Occupancy | # Housing Units | % Housing Units |
| Owner Occupied Housing Units | 48 | 96.0% |
| Renter-Occupied Housing Units | 2 | 4.0% |
| Total Occupied Housing Units | 50 | 100.0% |
Occupancy by Household Size in North Washington
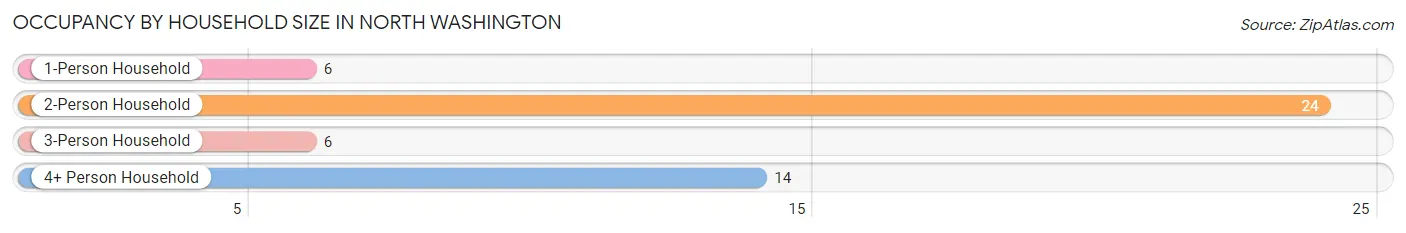
| Household Size | # Housing Units | % Housing Units |
| 1-Person Household | 6 | 12.0% |
| 2-Person Household | 24 | 48.0% |
| 3-Person Household | 6 | 12.0% |
| 4+ Person Household | 14 | 28.0% |
| Total Housing Units | 50 | 100.0% |
Occupancy by Ownership by Household Size in North Washington
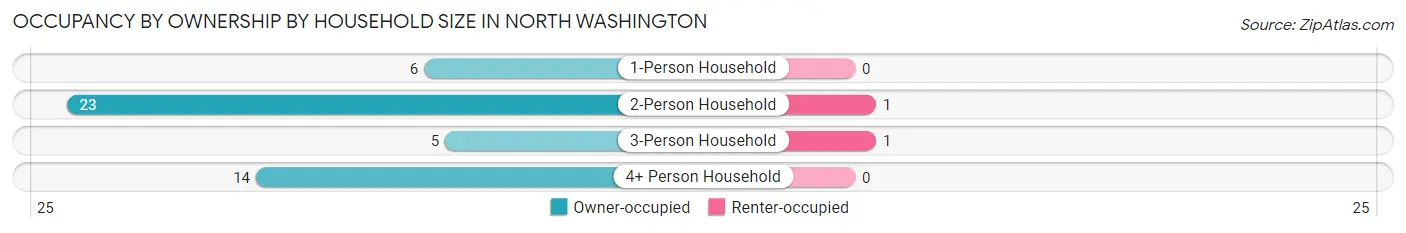
| Household Size | Owner-occupied | Renter-occupied |
| 1-Person Household | 6 (100.0%) | 0 (0.0%) |
| 2-Person Household | 23 (95.8%) | 1 (4.2%) |
| 3-Person Household | 5 (83.3%) | 1 (16.7%) |
| 4+ Person Household | 14 (100.0%) | 0 (0.0%) |
| Total Housing Units | 48 (96.0%) | 2 (4.0%) |
Occupancy by Educational Attainment in North Washington
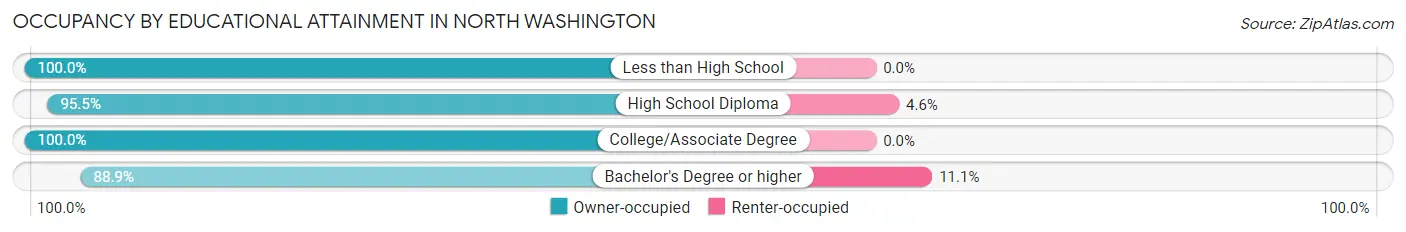
| Household Size | Owner-occupied | Renter-occupied |
| Less than High School | 2 (100.0%) | 0 (0.0%) |
| High School Diploma | 21 (95.5%) | 1 (4.5%) |
| College/Associate Degree | 17 (100.0%) | 0 (0.0%) |
| Bachelor's Degree or higher | 8 (88.9%) | 1 (11.1%) |
Occupancy by Age of Householder in North Washington
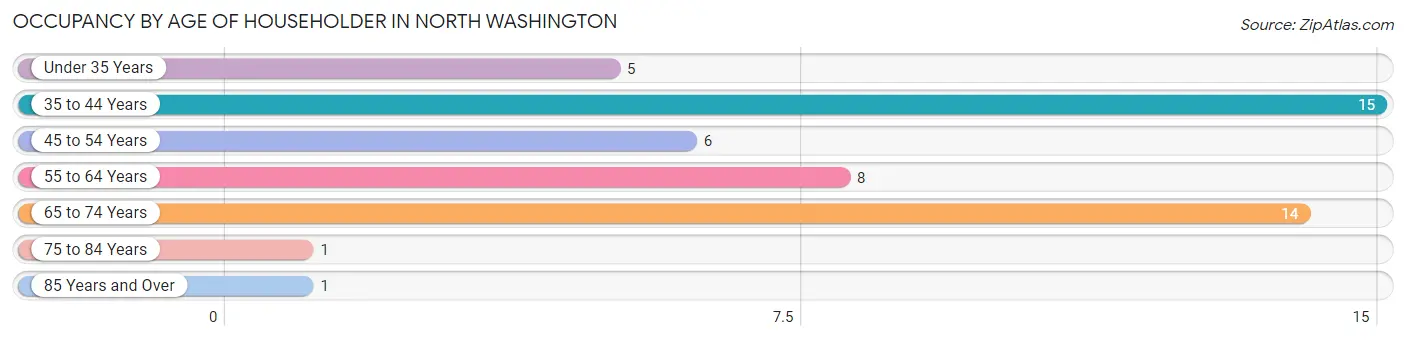
| Age Bracket | # Households | % Households |
| Under 35 Years | 5 | 10.0% |
| 35 to 44 Years | 15 | 30.0% |
| 45 to 54 Years | 6 | 12.0% |
| 55 to 64 Years | 8 | 16.0% |
| 65 to 74 Years | 14 | 28.0% |
| 75 to 84 Years | 1 | 2.0% |
| 85 Years and Over | 1 | 2.0% |
| Total | 50 | 100.0% |
Housing Finances in North Washington
Median Income by Occupancy in North Washington
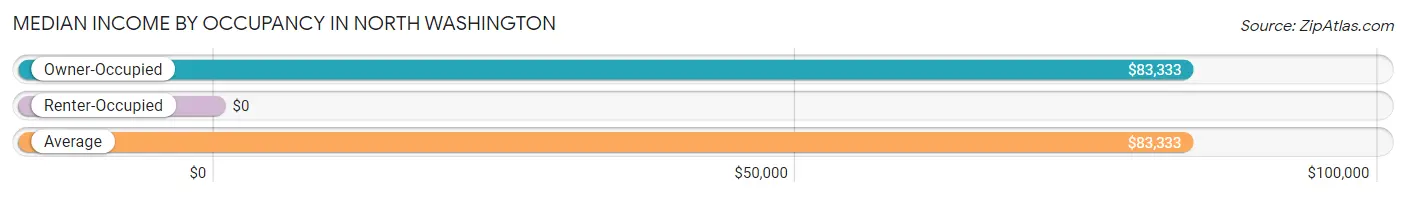
| Occupancy Type | # Households | Median Income |
| Owner-Occupied | 48 (96.0%) | $83,333 |
| Renter-Occupied | 2 (4.0%) | $0 |
| Average | 50 (100.0%) | $83,333 |
Occupancy by Householder Income Bracket in North Washington
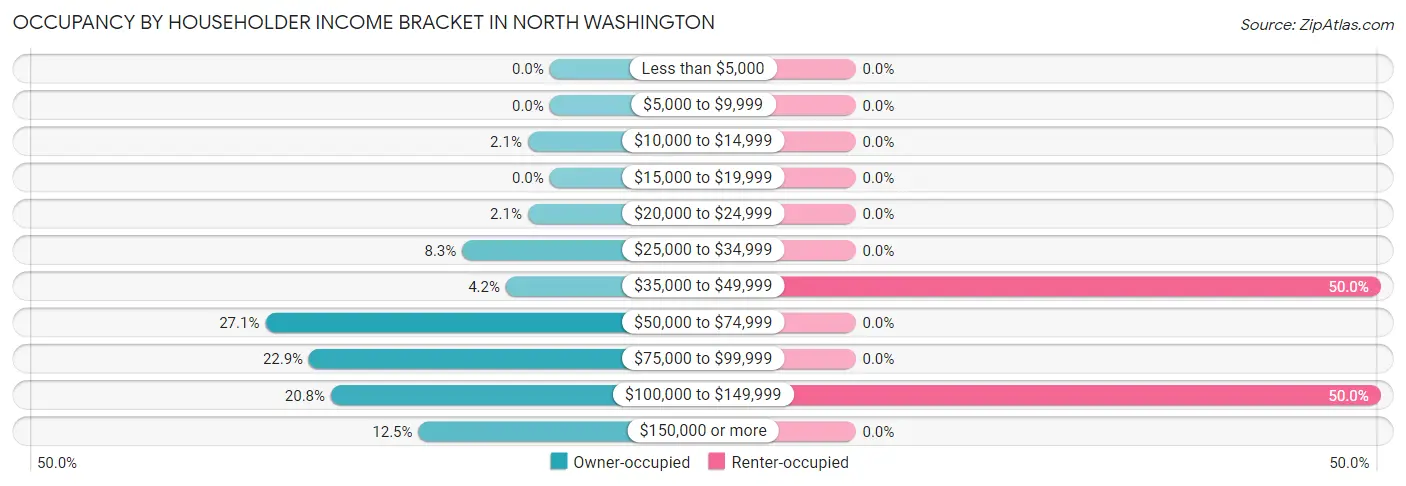
| Income Bracket | Owner-occupied | Renter-occupied |
| Less than $5,000 | 0 (0.0%) | 0 (0.0%) |
| $5,000 to $9,999 | 0 (0.0%) | 0 (0.0%) |
| $10,000 to $14,999 | 1 (2.1%) | 0 (0.0%) |
| $15,000 to $19,999 | 0 (0.0%) | 0 (0.0%) |
| $20,000 to $24,999 | 1 (2.1%) | 0 (0.0%) |
| $25,000 to $34,999 | 4 (8.3%) | 0 (0.0%) |
| $35,000 to $49,999 | 2 (4.2%) | 1 (50.0%) |
| $50,000 to $74,999 | 13 (27.1%) | 0 (0.0%) |
| $75,000 to $99,999 | 11 (22.9%) | 0 (0.0%) |
| $100,000 to $149,999 | 10 (20.8%) | 1 (50.0%) |
| $150,000 or more | 6 (12.5%) | 0 (0.0%) |
| Total | 48 (100.0%) | 2 (100.0%) |
Monthly Housing Cost Tiers in North Washington
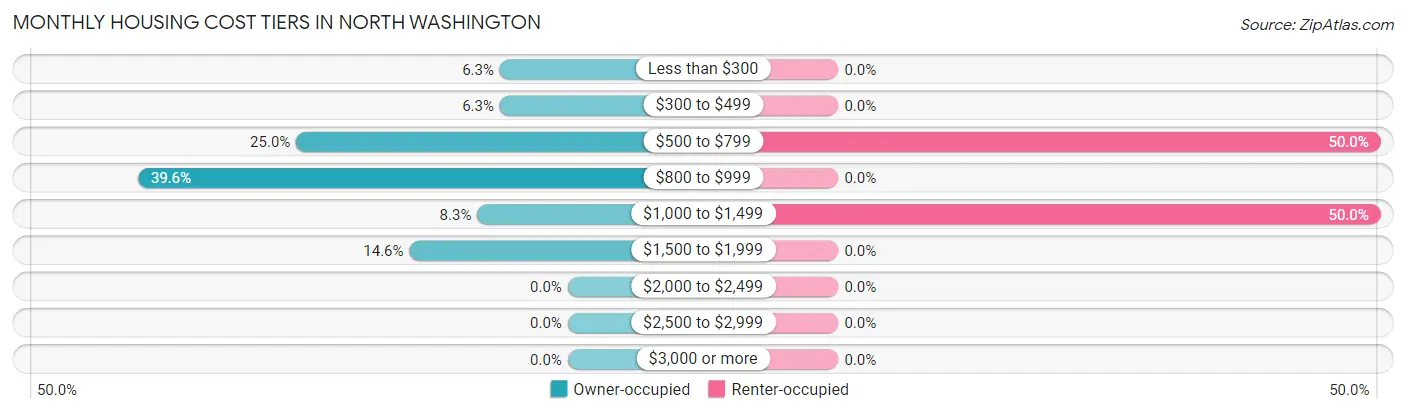
| Monthly Cost | Owner-occupied | Renter-occupied |
| Less than $300 | 3 (6.2%) | 0 (0.0%) |
| $300 to $499 | 3 (6.2%) | 0 (0.0%) |
| $500 to $799 | 12 (25.0%) | 1 (50.0%) |
| $800 to $999 | 19 (39.6%) | 0 (0.0%) |
| $1,000 to $1,499 | 4 (8.3%) | 1 (50.0%) |
| $1,500 to $1,999 | 7 (14.6%) | 0 (0.0%) |
| $2,000 to $2,499 | 0 (0.0%) | 0 (0.0%) |
| $2,500 to $2,999 | 0 (0.0%) | 0 (0.0%) |
| $3,000 or more | 0 (0.0%) | 0 (0.0%) |
| Total | 48 (100.0%) | 2 (100.0%) |
Physical Housing Characteristics in North Washington
Housing Structures in North Washington
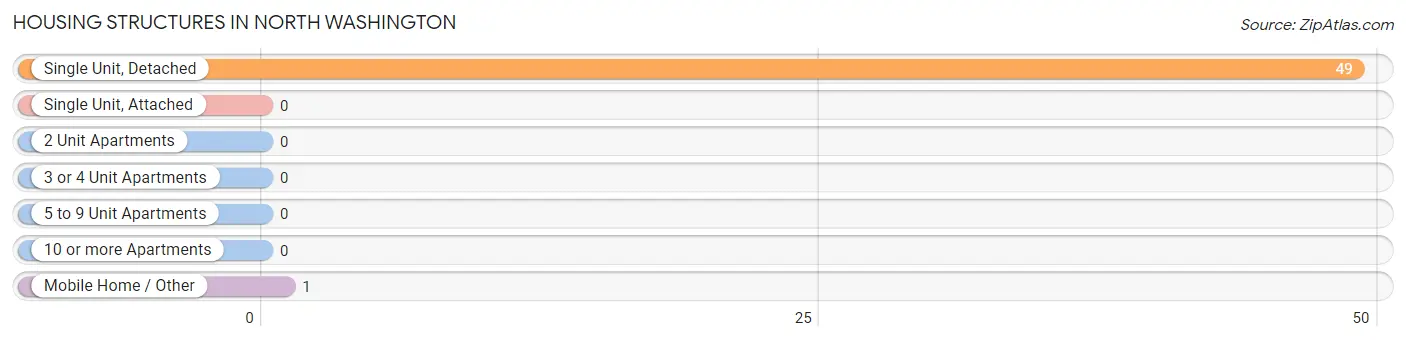
| Structure Type | # Housing Units | % Housing Units |
| Single Unit, Detached | 49 | 98.0% |
| Single Unit, Attached | 0 | 0.0% |
| 2 Unit Apartments | 0 | 0.0% |
| 3 or 4 Unit Apartments | 0 | 0.0% |
| 5 to 9 Unit Apartments | 0 | 0.0% |
| 10 or more Apartments | 0 | 0.0% |
| Mobile Home / Other | 1 | 2.0% |
| Total | 50 | 100.0% |
Housing Structures by Occupancy in North Washington
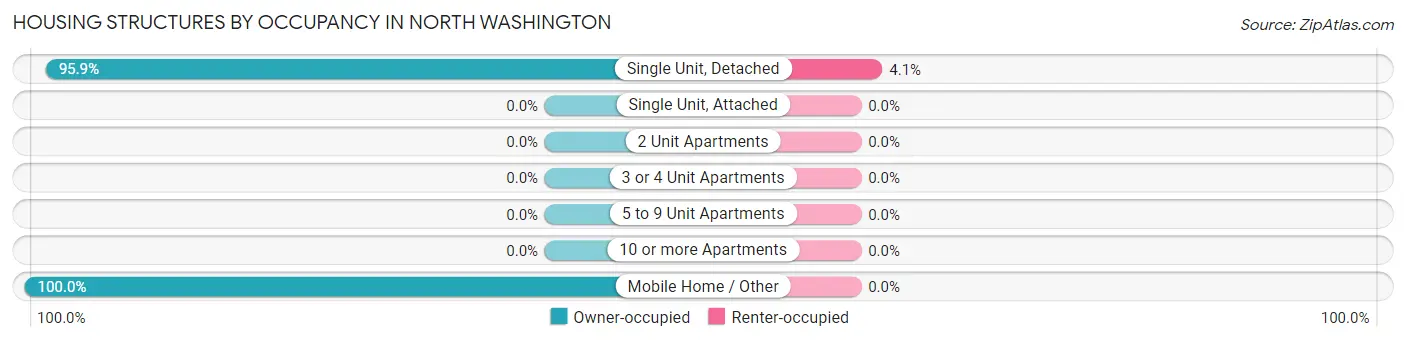
| Structure Type | Owner-occupied | Renter-occupied |
| Single Unit, Detached | 47 (95.9%) | 2 (4.1%) |
| Single Unit, Attached | 0 (0.0%) | 0 (0.0%) |
| 2 Unit Apartments | 0 (0.0%) | 0 (0.0%) |
| 3 or 4 Unit Apartments | 0 (0.0%) | 0 (0.0%) |
| 5 to 9 Unit Apartments | 0 (0.0%) | 0 (0.0%) |
| 10 or more Apartments | 0 (0.0%) | 0 (0.0%) |
| Mobile Home / Other | 1 (100.0%) | 0 (0.0%) |
| Total | 48 (96.0%) | 2 (4.0%) |
Housing Structures by Number of Rooms in North Washington
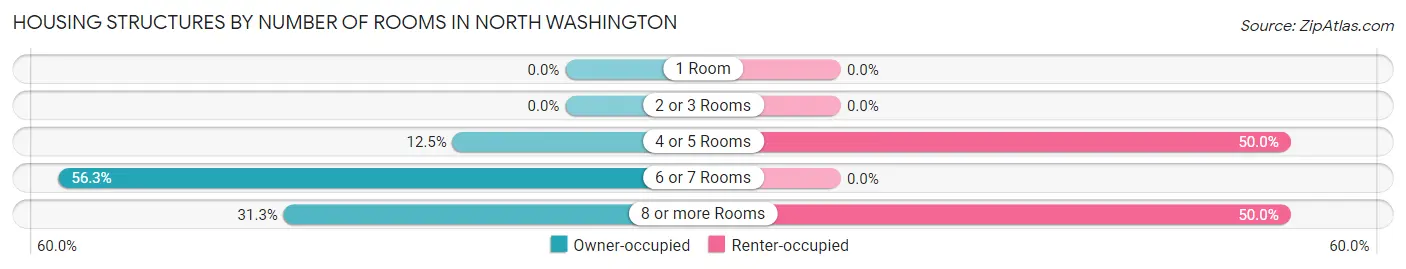
| Number of Rooms | Owner-occupied | Renter-occupied |
| 1 Room | 0 (0.0%) | 0 (0.0%) |
| 2 or 3 Rooms | 0 (0.0%) | 0 (0.0%) |
| 4 or 5 Rooms | 6 (12.5%) | 1 (50.0%) |
| 6 or 7 Rooms | 27 (56.2%) | 0 (0.0%) |
| 8 or more Rooms | 15 (31.2%) | 1 (50.0%) |
| Total | 48 (100.0%) | 2 (100.0%) |
Housing Structure by Heating Type in North Washington
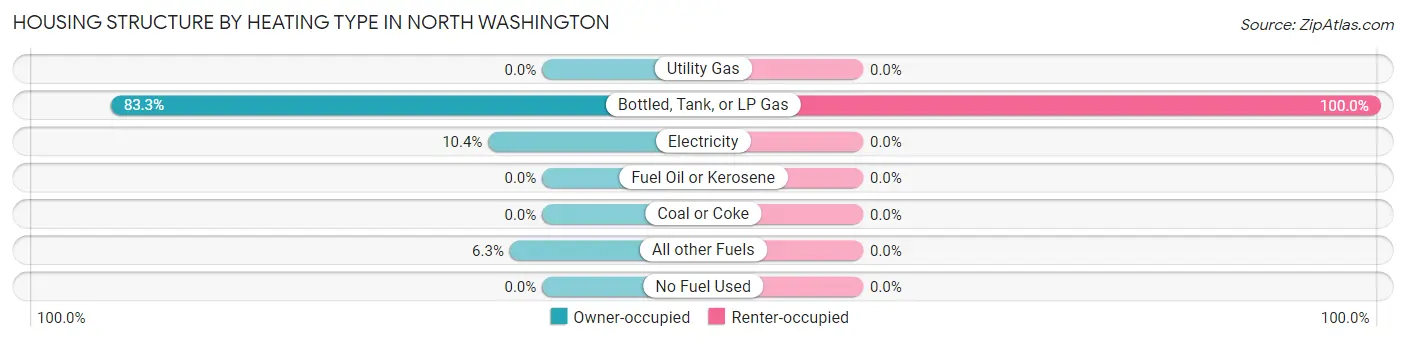
| Heating Type | Owner-occupied | Renter-occupied |
| Utility Gas | 0 (0.0%) | 0 (0.0%) |
| Bottled, Tank, or LP Gas | 40 (83.3%) | 2 (100.0%) |
| Electricity | 5 (10.4%) | 0 (0.0%) |
| Fuel Oil or Kerosene | 0 (0.0%) | 0 (0.0%) |
| Coal or Coke | 0 (0.0%) | 0 (0.0%) |
| All other Fuels | 3 (6.2%) | 0 (0.0%) |
| No Fuel Used | 0 (0.0%) | 0 (0.0%) |
| Total | 48 (100.0%) | 2 (100.0%) |
Household Vehicle Usage in North Washington
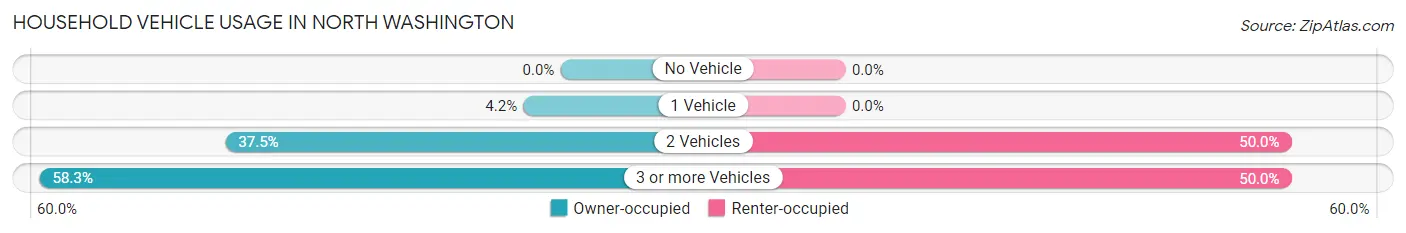
| Vehicles per Household | Owner-occupied | Renter-occupied |
| No Vehicle | 0 (0.0%) | 0 (0.0%) |
| 1 Vehicle | 2 (4.2%) | 0 (0.0%) |
| 2 Vehicles | 18 (37.5%) | 1 (50.0%) |
| 3 or more Vehicles | 28 (58.3%) | 1 (50.0%) |
| Total | 48 (100.0%) | 2 (100.0%) |
Real Estate & Mortgages in North Washington
Real Estate and Mortgage Overview in North Washington
| Characteristic | Without Mortgage | With Mortgage |
| Housing Units | 20 | 28 |
| Median Property Value | - | - |
| Median Household Income | $90,000 | $3 |
| Monthly Housing Costs | $600 | $0 |
| Real Estate Taxes | - | - |
Property Value by Mortgage Status in North Washington
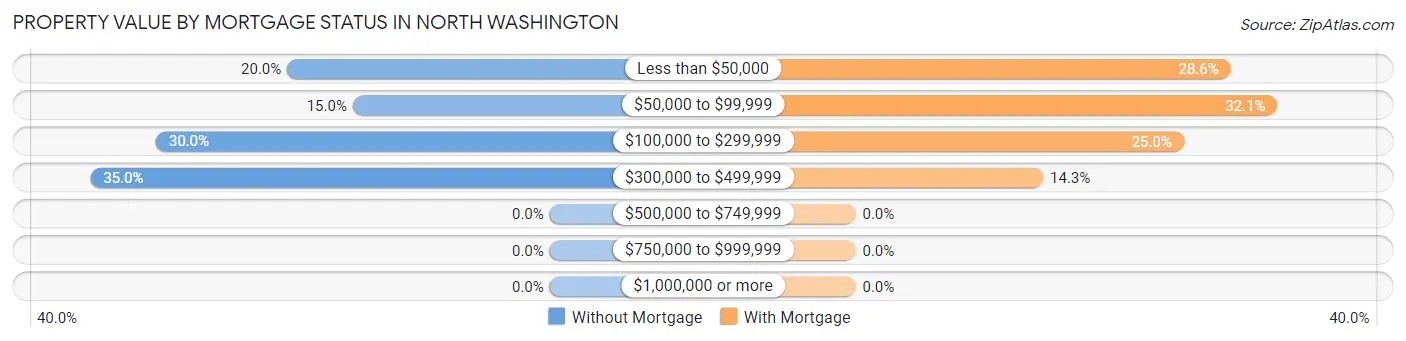
| Property Value | Without Mortgage | With Mortgage |
| Less than $50,000 | 4 (20.0%) | 8 (28.6%) |
| $50,000 to $99,999 | 3 (15.0%) | 9 (32.1%) |
| $100,000 to $299,999 | 6 (30.0%) | 7 (25.0%) |
| $300,000 to $499,999 | 7 (35.0%) | 4 (14.3%) |
| $500,000 to $749,999 | 0 (0.0%) | 0 (0.0%) |
| $750,000 to $999,999 | 0 (0.0%) | 0 (0.0%) |
| $1,000,000 or more | 0 (0.0%) | 0 (0.0%) |
| Total | 20 (100.0%) | 28 (100.0%) |
Household Income by Mortgage Status in North Washington
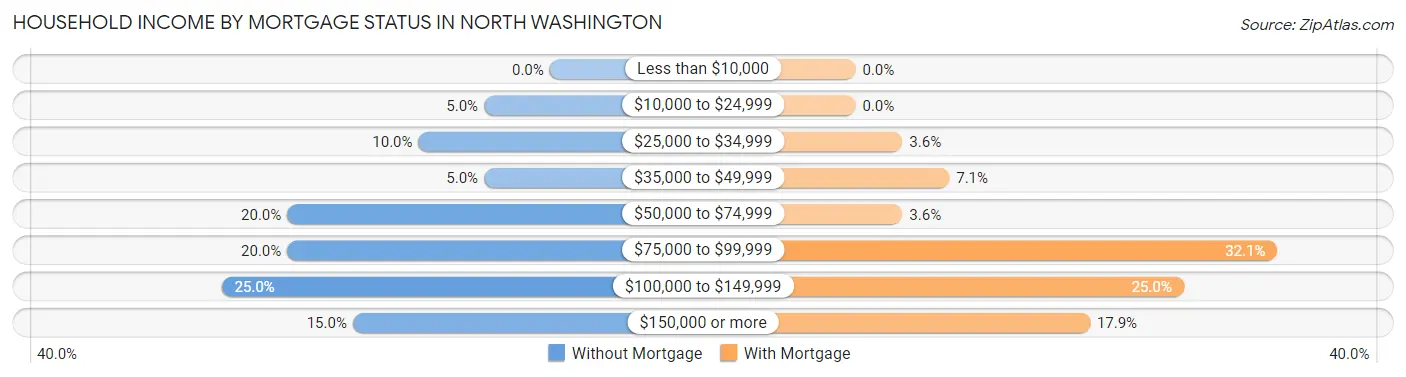
| Household Income | Without Mortgage | With Mortgage |
| Less than $10,000 | 0 (0.0%) | 0 (0.0%) |
| $10,000 to $24,999 | 1 (5.0%) | 0 (0.0%) |
| $25,000 to $34,999 | 2 (10.0%) | 1 (3.6%) |
| $35,000 to $49,999 | 1 (5.0%) | 2 (7.1%) |
| $50,000 to $74,999 | 4 (20.0%) | 1 (3.6%) |
| $75,000 to $99,999 | 4 (20.0%) | 9 (32.1%) |
| $100,000 to $149,999 | 5 (25.0%) | 7 (25.0%) |
| $150,000 or more | 3 (15.0%) | 5 (17.9%) |
| Total | 20 (100.0%) | 28 (100.0%) |
Property Value to Household Income Ratio in North Washington
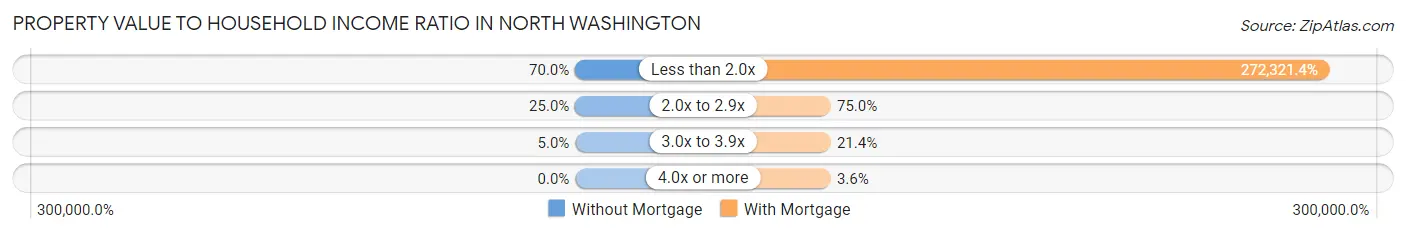
| Value-to-Income Ratio | Without Mortgage | With Mortgage |
| Less than 2.0x | 14 (70.0%) | 76,250 (272,321.4%) |
| 2.0x to 2.9x | 5 (25.0%) | 21 (75.0%) |
| 3.0x to 3.9x | 1 (5.0%) | 6 (21.4%) |
| 4.0x or more | 0 (0.0%) | 1 (3.6%) |
| Total | 20 (100.0%) | 28 (100.0%) |
Real Estate Taxes by Mortgage Status in North Washington
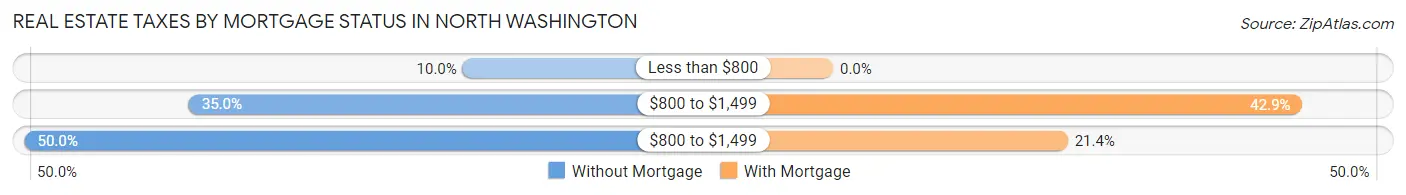
| Property Taxes | Without Mortgage | With Mortgage |
| Less than $800 | 2 (10.0%) | 0 (0.0%) |
| $800 to $1,499 | 7 (35.0%) | 12 (42.9%) |
| $800 to $1,499 | 10 (50.0%) | 6 (21.4%) |
| Total | 20 (100.0%) | 28 (100.0%) |
Health & Disability in North Washington
Health Insurance Coverage by Age in North Washington
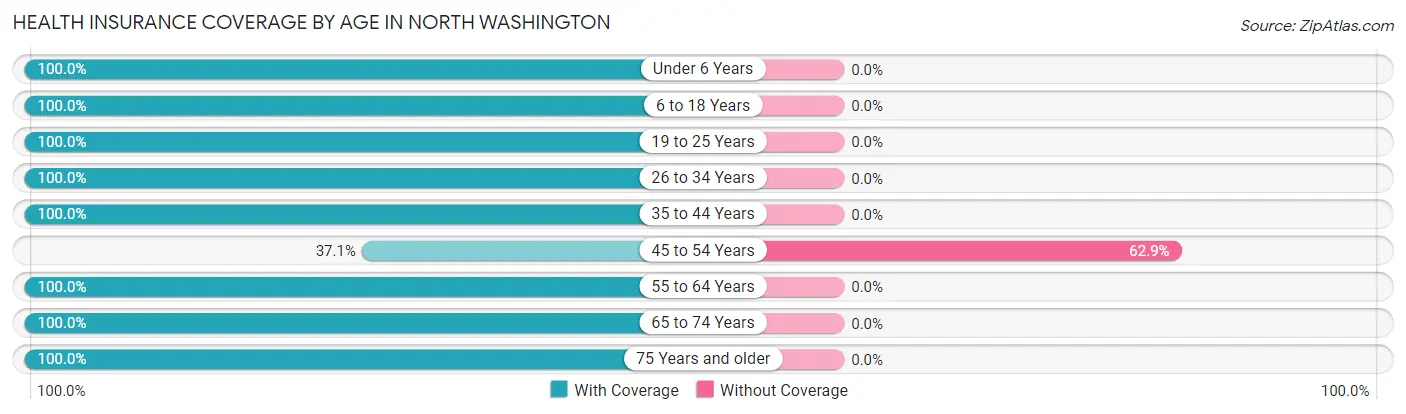
| Age Bracket | With Coverage | Without Coverage |
| Under 6 Years | 3 (100.0%) | 0 (0.0%) |
| 6 to 18 Years | 34 (100.0%) | 0 (0.0%) |
| 19 to 25 Years | 3 (100.0%) | 0 (0.0%) |
| 26 to 34 Years | 7 (100.0%) | 0 (0.0%) |
| 35 to 44 Years | 18 (100.0%) | 0 (0.0%) |
| 45 to 54 Years | 13 (37.1%) | 22 (62.9%) |
| 55 to 64 Years | 16 (100.0%) | 0 (0.0%) |
| 65 to 74 Years | 24 (100.0%) | 0 (0.0%) |
| 75 Years and older | 4 (100.0%) | 0 (0.0%) |
| Total | 122 (84.7%) | 22 (15.3%) |
Health Insurance Coverage by Citizenship Status in North Washington
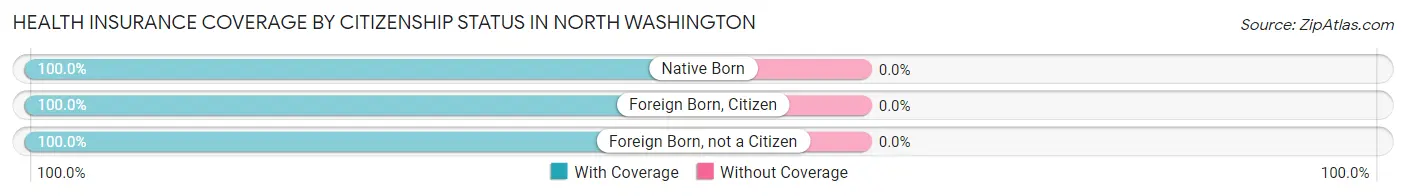
| Citizenship Status | With Coverage | Without Coverage |
| Native Born | 3 (100.0%) | 0 (0.0%) |
| Foreign Born, Citizen | 34 (100.0%) | 0 (0.0%) |
| Foreign Born, not a Citizen | 3 (100.0%) | 0 (0.0%) |
Health Insurance Coverage by Household Income in North Washington
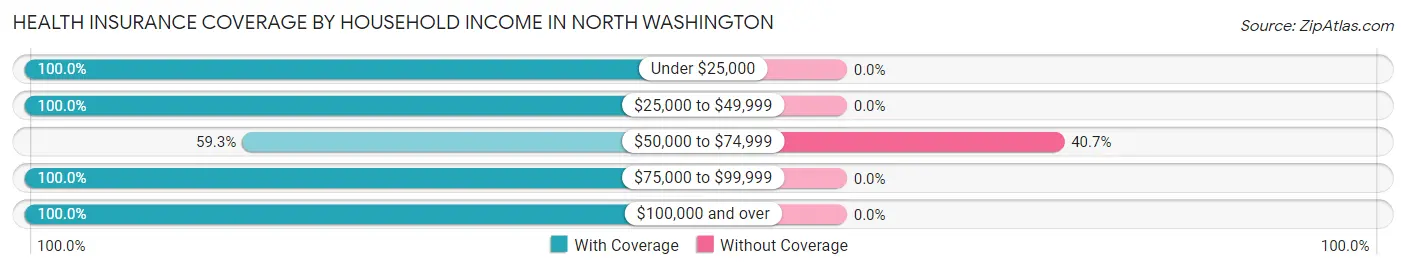
| Household Income | With Coverage | Without Coverage |
| Under $25,000 | 4 (100.0%) | 0 (0.0%) |
| $25,000 to $49,999 | 21 (100.0%) | 0 (0.0%) |
| $50,000 to $74,999 | 32 (59.3%) | 22 (40.7%) |
| $75,000 to $99,999 | 28 (100.0%) | 0 (0.0%) |
| $100,000 and over | 37 (100.0%) | 0 (0.0%) |
Public vs Private Health Insurance Coverage by Age in North Washington
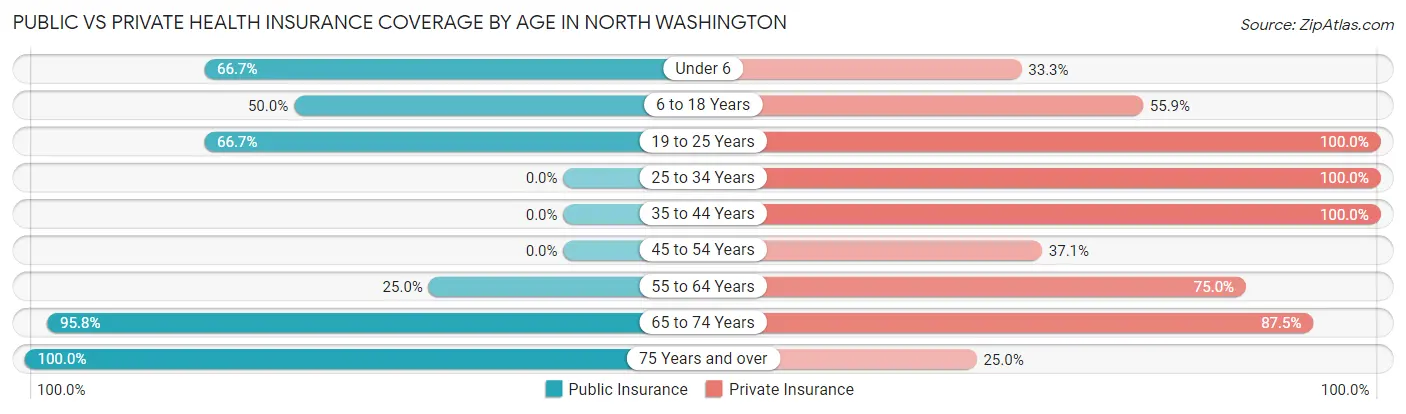
| Age Bracket | Public Insurance | Private Insurance |
| Under 6 | 2 (66.7%) | 1 (33.3%) |
| 6 to 18 Years | 17 (50.0%) | 19 (55.9%) |
| 19 to 25 Years | 2 (66.7%) | 3 (100.0%) |
| 25 to 34 Years | 0 (0.0%) | 7 (100.0%) |
| 35 to 44 Years | 0 (0.0%) | 18 (100.0%) |
| 45 to 54 Years | 0 (0.0%) | 13 (37.1%) |
| 55 to 64 Years | 4 (25.0%) | 12 (75.0%) |
| 65 to 74 Years | 23 (95.8%) | 21 (87.5%) |
| 75 Years and over | 4 (100.0%) | 1 (25.0%) |
| Total | 52 (36.1%) | 95 (66.0%) |
Disability Status by Sex by Age in North Washington
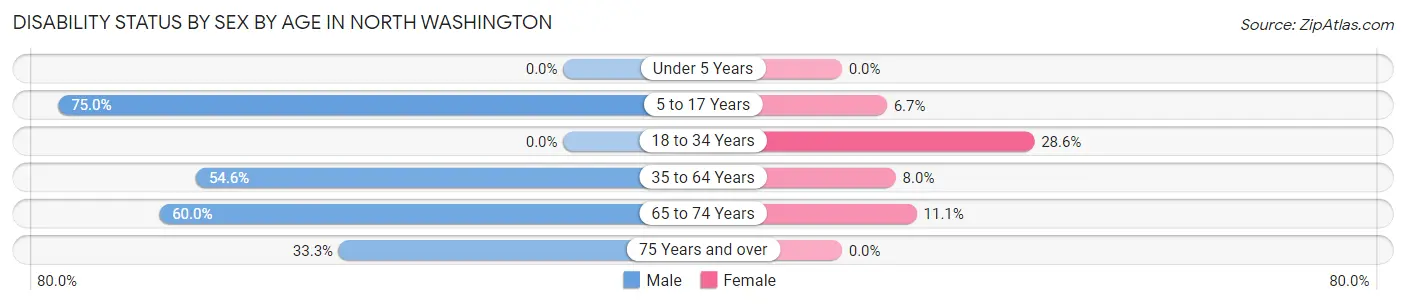
| Age Bracket | Male | Female |
| Under 5 Years | 0 (0.0%) | 0 (0.0%) |
| 5 to 17 Years | 15 (75.0%) | 1 (6.7%) |
| 18 to 34 Years | 0 (0.0%) | 2 (28.6%) |
| 35 to 64 Years | 24 (54.5%) | 2 (8.0%) |
| 65 to 74 Years | 9 (60.0%) | 1 (11.1%) |
| 75 Years and over | 1 (33.3%) | 0 (0.0%) |
Disability Class by Sex by Age in North Washington
Disability Class: Hearing Difficulty
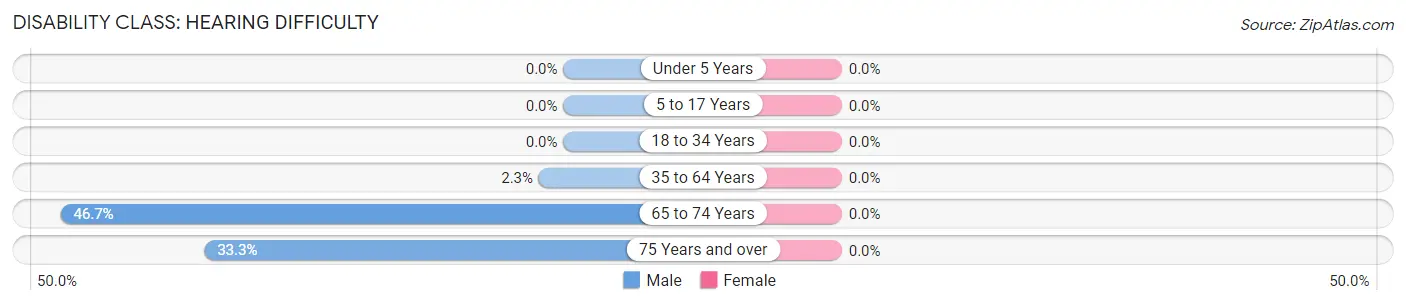
| Age Bracket | Male | Female |
| Under 5 Years | 0 (0.0%) | 0 (0.0%) |
| 5 to 17 Years | 0 (0.0%) | 0 (0.0%) |
| 18 to 34 Years | 0 (0.0%) | 0 (0.0%) |
| 35 to 64 Years | 1 (2.3%) | 0 (0.0%) |
| 65 to 74 Years | 7 (46.7%) | 0 (0.0%) |
| 75 Years and over | 1 (33.3%) | 0 (0.0%) |
Disability Class: Vision Difficulty
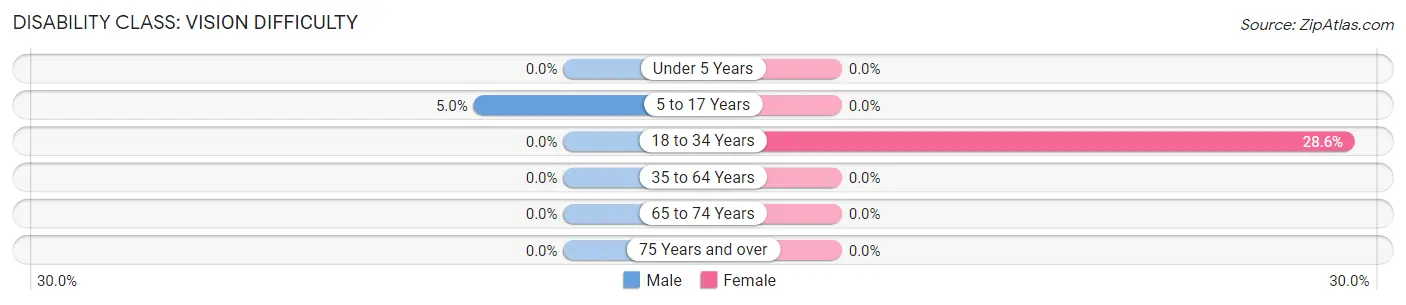
| Age Bracket | Male | Female |
| Under 5 Years | 0 (0.0%) | 0 (0.0%) |
| 5 to 17 Years | 1 (5.0%) | 0 (0.0%) |
| 18 to 34 Years | 0 (0.0%) | 2 (28.6%) |
| 35 to 64 Years | 0 (0.0%) | 0 (0.0%) |
| 65 to 74 Years | 0 (0.0%) | 0 (0.0%) |
| 75 Years and over | 0 (0.0%) | 0 (0.0%) |
Disability Class: Cognitive Difficulty
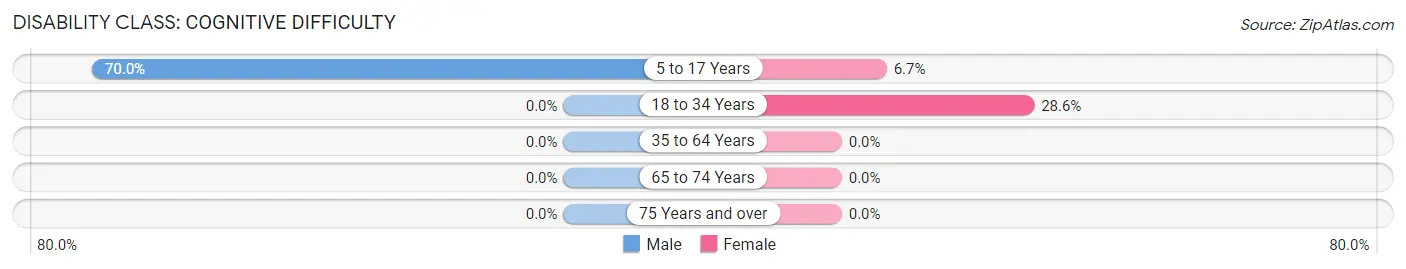
| Age Bracket | Male | Female |
| 5 to 17 Years | 14 (70.0%) | 1 (6.7%) |
| 18 to 34 Years | 0 (0.0%) | 2 (28.6%) |
| 35 to 64 Years | 0 (0.0%) | 0 (0.0%) |
| 65 to 74 Years | 0 (0.0%) | 0 (0.0%) |
| 75 Years and over | 0 (0.0%) | 0 (0.0%) |
Disability Class: Ambulatory Difficulty
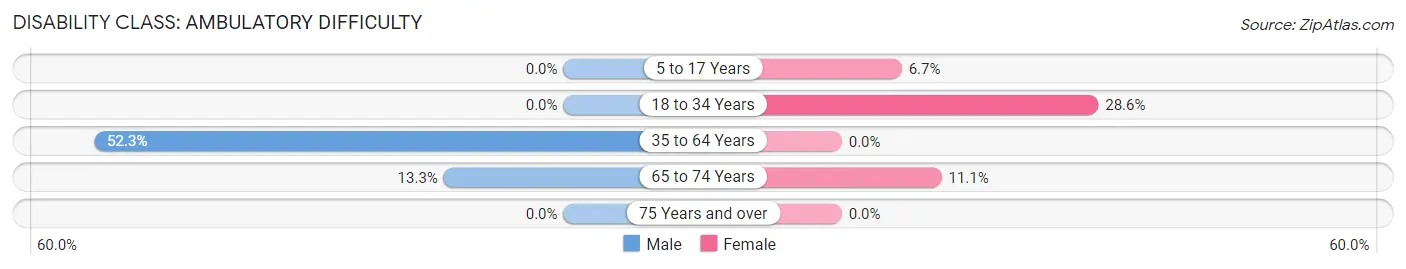
| Age Bracket | Male | Female |
| 5 to 17 Years | 0 (0.0%) | 1 (6.7%) |
| 18 to 34 Years | 0 (0.0%) | 2 (28.6%) |
| 35 to 64 Years | 23 (52.3%) | 0 (0.0%) |
| 65 to 74 Years | 2 (13.3%) | 1 (11.1%) |
| 75 Years and over | 0 (0.0%) | 0 (0.0%) |
Disability Class: Self-Care Difficulty
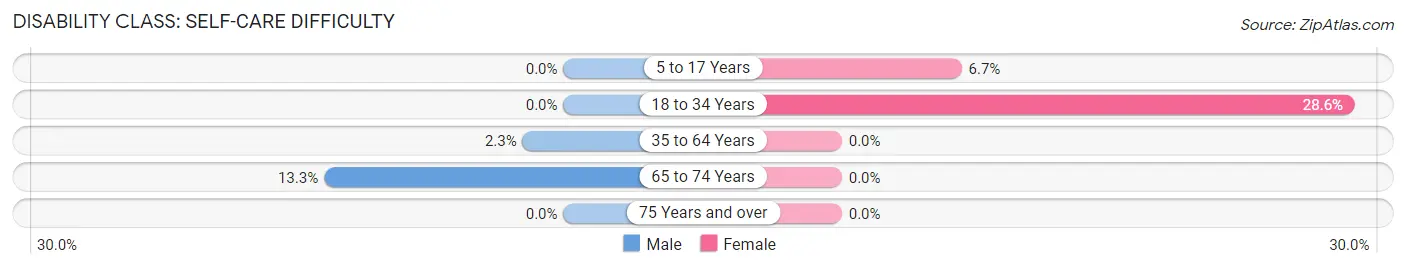
| Age Bracket | Male | Female |
| 5 to 17 Years | 0 (0.0%) | 1 (6.7%) |
| 18 to 34 Years | 0 (0.0%) | 2 (28.6%) |
| 35 to 64 Years | 1 (2.3%) | 0 (0.0%) |
| 65 to 74 Years | 2 (13.3%) | 0 (0.0%) |
| 75 Years and over | 0 (0.0%) | 0 (0.0%) |
Technology Access in North Washington
Computing Device Access in North Washington
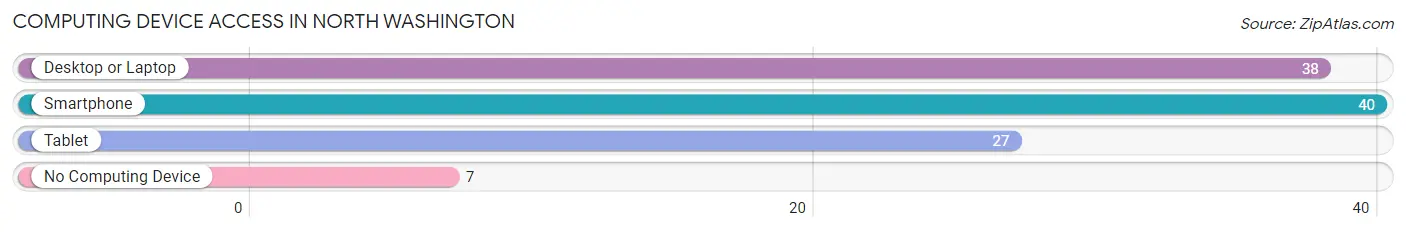
| Device Type | # Households | % Households |
| Desktop or Laptop | 38 | 76.0% |
| Smartphone | 40 | 80.0% |
| Tablet | 27 | 54.0% |
| No Computing Device | 7 | 14.0% |
| Total | 50 | 100.0% |
Internet Access in North Washington
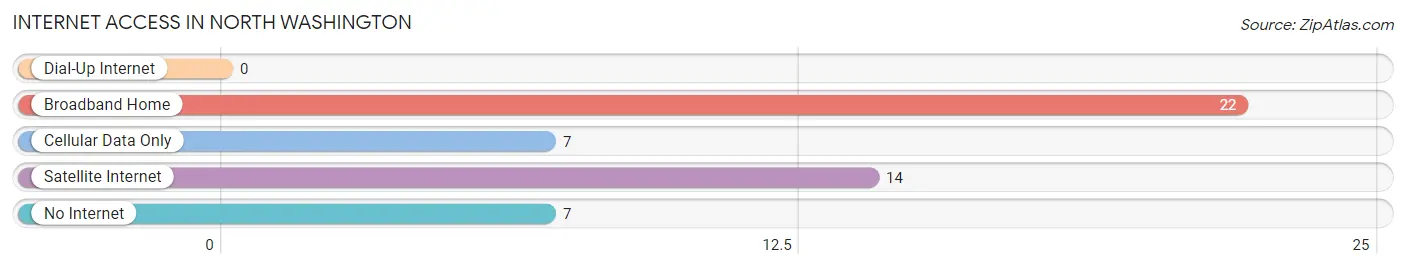
| Internet Type | # Households | % Households |
| Dial-Up Internet | 0 | 0.0% |
| Broadband Home | 22 | 44.0% |
| Cellular Data Only | 7 | 14.0% |
| Satellite Internet | 14 | 28.0% |
| No Internet | 7 | 14.0% |
| Total | 50 | 100.0% |
North Washington Summary
North Washington is a small city located in Washington County, Iowa, United States. The population was 545 at the 2010 census. It is part of the Iowa City, IA Metropolitan Statistical Area.
History
North Washington was founded in 1854 by a group of settlers from the east coast. The town was originally named Washingtonville, but the name was changed to North Washington in 1856. The town was incorporated in 1858.
The town was a major stop on the Chicago, Rock Island and Pacific Railroad, which ran through the town from 1854 to 1971. The railroad was a major factor in the growth of the town, as it allowed for the transportation of goods and people to and from the town.
Geography
North Washington is located at 41°25'25" North, 91°37'45" West (41.423, -91.629). The town is situated on the banks of the Cedar River, which flows through the town.
The town has a total area of 0 6 square miles 1 6 km2 all of it land
Economy
The economy of North Washington is largely based on agriculture. The town is home to several farms, which produce a variety of crops, including corn, soybeans, and hay.
The town is also home to several small businesses, including a grocery store, a hardware store, and a restaurant.
Demographics
As of the 2010 census, there were 545 people, 212 households, and 145 families residing in the town. The population density was 890.0 people per square mile (344.3/km2). There were 229 housing units at an average density of 377.5 per square mile (145.7/km2). The racial makeup of the town was 97.3% White, 0.2% African American, 0.2% Native American, 0.2% Asian, 0.4% from other races, and 1.5% from two or more races. Hispanic or Latino of any race were 1.3% of the population.
There were 212 households, out of which 33.0% had children under the age of 18 living with them, 54.2% were married couples living together, 8.5% had a female householder with no husband present, and 32.5% were non-families. 28.3% of all households were made up of individuals, and 14.2% had someone living alone who was 65 years of age or older. The average household size was 2.57 and the average family size was 3.17.
In the town, the population was spread out, with 28.2% under the age of 18, 6.7% from 18 to 24, 28.2% from 25 to 44, 22.2% from 45 to 64, and 14.7% who were 65 years of age or older. The median age was 37 years. For every 100 females, there were 97.3 males. For every 100 females age 18 and over, there were 94.3 males.
The median income for a household in the town was $37,500, and the median income for a family was $45,000. Males had a median income of $31,250 versus $21,250 for females. The per capita income for the town was $17,845. About 5.3% of families and 8.2% of the population were below the poverty line, including 8.3% of those under age 18 and 8.3% of those age 65 or over.
Common Questions
What is Per Capita Income in North Washington?
Per Capita income in North Washington is $34,638.
What is the Median Family Income in North Washington?
Median Family Income in North Washington is $88,333.
What is the Median Household income in North Washington?
Median Household Income in North Washington is $83,333.
What is Inequality or Gini Index in North Washington?
Inequality or Gini Index in North Washington is 0.31.
What is the Total Population of North Washington?
Total Population of North Washington is 144.
What is the Total Male Population of North Washington?
Total Male Population of North Washington is 87.
What is the Total Female Population of North Washington?
Total Female Population of North Washington is 57.
What is the Ratio of Males per 100 Females in North Washington?
There are 152.63 Males per 100 Females in North Washington.
What is the Ratio of Females per 100 Males in North Washington?
There are 65.52 Females per 100 Males in North Washington.
What is the Median Population Age in North Washington?
Median Population Age in North Washington is 46.3 Years.
What is the Average Family Size in North Washington
Average Family Size in North Washington is 3.1 People.
What is the Average Household Size in North Washington
Average Household Size in North Washington is 2.9 People.
How Large is the Labor Force in North Washington?
There are 77 People in the Labor Forcein in North Washington.
What is the Percentage of People in the Labor Force in North Washington?
67.0% of People are in the Labor Force in North Washington.