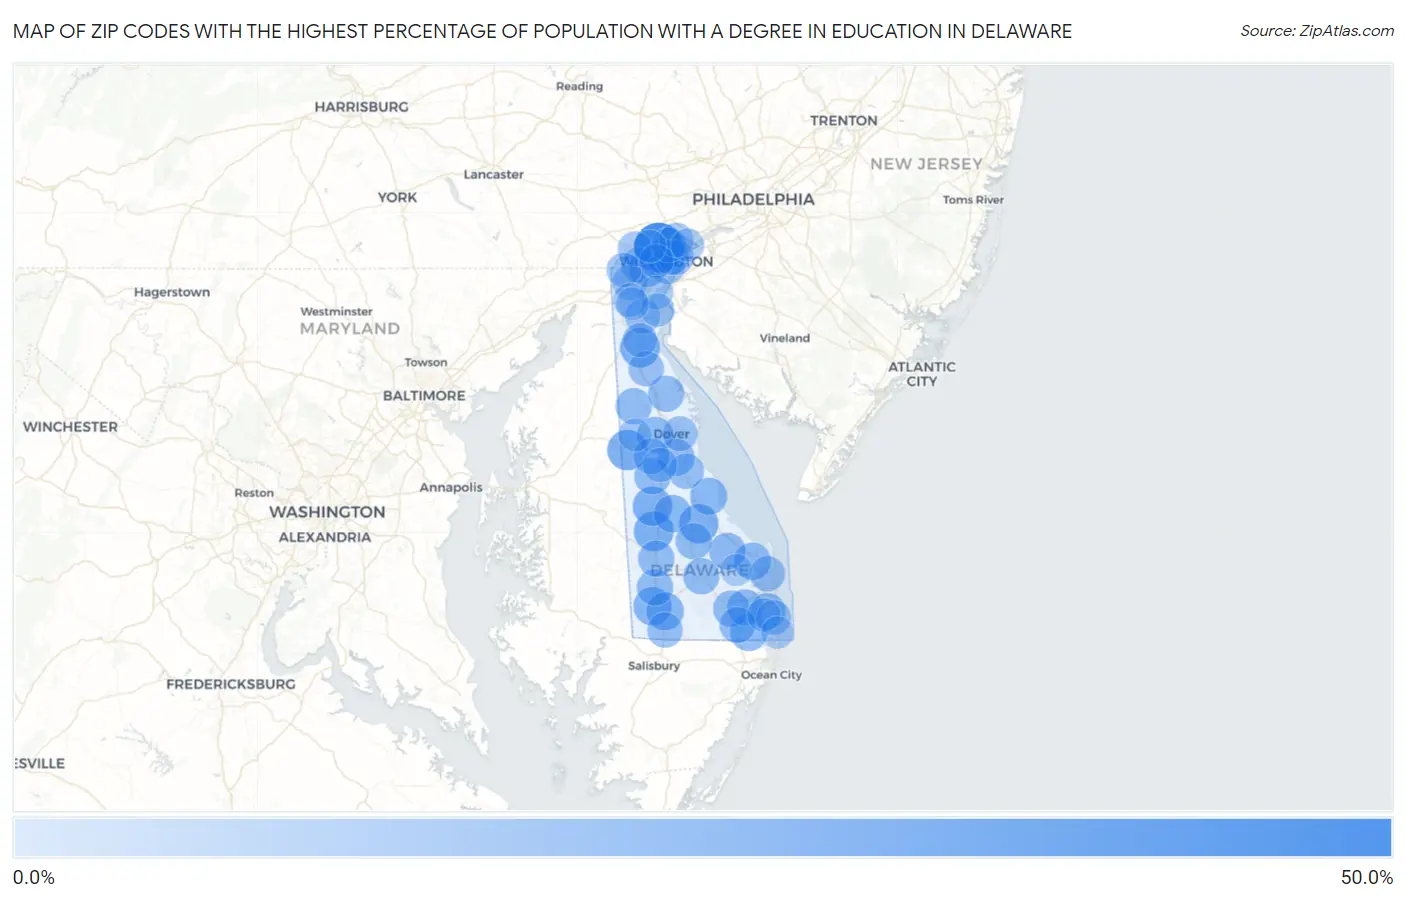
Zip Codes with the Highest Percentage of Population with a Degree in Education in Delaware
RELATED REPORTS & OPTIONS
Education
Delaware
Compare Zip Codes
Map of Zip Codes with the Highest Percentage of Population with a Degree in Education in Delaware
0.0%
50.0%

Zip Codes with the Highest Percentage of Population with a Degree in Education in Delaware
| Zip Code | % Graduates | vs State | vs National | |
| 1. | 19710 | 50.0% | 12.4%(+37.6)#1 | 11.1%(+38.9)#1,251 |
| 2. | 19964 | 26.2% | 12.4%(+13.8)#2 | 11.1%(+15.1)#6,218 |
| 3. | 19950 | 24.6% | 12.4%(+12.2)#3 | 11.1%(+13.5)#7,168 |
| 4. | 19730 | 24.2% | 12.4%(+11.8)#4 | 11.1%(+13.2)#7,384 |
| 5. | 19952 | 23.6% | 12.4%(+11.2)#5 | 11.1%(+12.5)#7,808 |
| 6. | 19960 | 23.2% | 12.4%(+10.8)#6 | 11.1%(+12.1)#8,078 |
| 7. | 19931 | 20.2% | 12.4%(+7.79)#7 | 11.1%(+9.13)#10,365 |
| 8. | 19956 | 19.2% | 12.4%(+6.79)#8 | 11.1%(+8.14)#11,248 |
| 9. | 19954 | 18.5% | 12.4%(+6.14)#9 | 11.1%(+7.49)#11,831 |
| 10. | 19975 | 18.0% | 12.4%(+5.60)#10 | 11.1%(+6.95)#12,376 |
| 11. | 19958 | 17.9% | 12.4%(+5.50)#11 | 11.1%(+6.85)#12,463 |
| 12. | 19963 | 17.7% | 12.4%(+5.31)#12 | 11.1%(+6.66)#12,650 |
| 13. | 19968 | 16.8% | 12.4%(+4.44)#13 | 11.1%(+5.79)#13,589 |
| 14. | 19962 | 16.6% | 12.4%(+4.23)#14 | 11.1%(+5.57)#13,862 |
| 15. | 19973 | 15.8% | 12.4%(+3.38)#15 | 11.1%(+4.73)#14,739 |
| 16. | 19943 | 15.8% | 12.4%(+3.38)#16 | 11.1%(+4.73)#14,742 |
| 17. | 19966 | 15.8% | 12.4%(+3.36)#17 | 11.1%(+4.71)#14,787 |
| 18. | 19933 | 15.8% | 12.4%(+3.35)#18 | 11.1%(+4.70)#14,805 |
| 19. | 19941 | 15.5% | 12.4%(+3.11)#19 | 11.1%(+4.46)#15,047 |
| 20. | 19939 | 15.5% | 12.4%(+3.08)#20 | 11.1%(+4.43)#15,073 |
| 21. | 19938 | 15.4% | 12.4%(+3.00)#21 | 11.1%(+4.35)#15,160 |
| 22. | 19904 | 15.4% | 12.4%(+3.00)#22 | 11.1%(+4.34)#15,166 |
| 23. | 19970 | 15.4% | 12.4%(+2.95)#23 | 11.1%(+4.30)#15,251 |
| 24. | 19804 | 15.3% | 12.4%(+2.87)#24 | 11.1%(+4.22)#15,323 |
| 25. | 19977 | 15.2% | 12.4%(+2.78)#25 | 11.1%(+4.13)#15,429 |
| 26. | 19947 | 15.1% | 12.4%(+2.69)#26 | 11.1%(+4.03)#15,559 |
| 27. | 19945 | 14.9% | 12.4%(+2.52)#27 | 11.1%(+3.87)#15,796 |
| 28. | 19934 | 14.9% | 12.4%(+2.51)#28 | 11.1%(+3.85)#15,816 |
| 29. | 19801 | 13.4% | 12.4%(+1.00)#29 | 11.1%(+2.35)#17,755 |
| 30. | 19946 | 13.4% | 12.4%(+0.969)#30 | 11.1%(+2.32)#17,787 |
| 31. | 19940 | 13.2% | 12.4%(+0.810)#31 | 11.1%(+2.16)#17,987 |
| 32. | 19971 | 13.1% | 12.4%(+0.713)#32 | 11.1%(+2.06)#18,090 |
| 33. | 19734 | 13.1% | 12.4%(+0.664)#33 | 11.1%(+2.01)#18,162 |
| 34. | 19808 | 12.7% | 12.4%(+0.309)#34 | 11.1%(+1.66)#18,617 |
| 35. | 19713 | 12.7% | 12.4%(+0.290)#35 | 11.1%(+1.64)#18,638 |
| 36. | 19806 | 12.4% | 12.4%(+0.004)#36 | 11.1%(+1.35)#19,053 |
| 37. | 19901 | 12.4% | 12.4%(-0.055)#37 | 11.1%(+1.29)#19,126 |
| 38. | 19809 | 12.3% | 12.4%(-0.091)#38 | 11.1%(+1.26)#19,180 |
| 39. | 19733 | 12.3% | 12.4%(-0.098)#39 | 11.1%(+1.25)#19,198 |
| 40. | 19802 | 12.0% | 12.4%(-0.437)#40 | 11.1%(+0.911)#19,663 |
| 41. | 19930 | 11.9% | 12.4%(-0.548)#41 | 11.1%(+0.800)#19,822 |
| 42. | 19803 | 11.7% | 12.4%(-0.708)#42 | 11.1%(+0.639)#20,039 |
| 43. | 19707 | 11.1% | 12.4%(-1.33)#43 | 11.1%(+0.018)#20,881 |
| 44. | 19979 | 10.8% | 12.4%(-1.60)#44 | 11.1%(-0.248)#21,219 |
| 45. | 19810 | 10.7% | 12.4%(-1.73)#45 | 11.1%(-0.378)#21,400 |
| 46. | 19711 | 10.6% | 12.4%(-1.82)#46 | 11.1%(-0.472)#21,535 |
| 47. | 19805 | 10.5% | 12.4%(-1.93)#47 | 11.1%(-0.586)#21,698 |
| 48. | 19709 | 10.1% | 12.4%(-2.28)#48 | 11.1%(-0.929)#22,151 |
| 49. | 19720 | 9.0% | 12.4%(-3.39)#49 | 11.1%(-2.05)#23,675 |
| 50. | 19702 | 8.9% | 12.4%(-3.46)#50 | 11.1%(-2.11)#23,755 |
| 51. | 19706 | 8.2% | 12.4%(-4.20)#51 | 11.1%(-2.86)#24,636 |
| 52. | 19967 | 8.1% | 12.4%(-4.31)#52 | 11.1%(-2.96)#24,756 |
| 53. | 19703 | 7.0% | 12.4%(-5.37)#53 | 11.1%(-4.02)#25,884 |
| 54. | 19953 | 7.0% | 12.4%(-5.38)#54 | 11.1%(-4.03)#25,897 |
| 55. | 19807 | 6.3% | 12.4%(-6.07)#55 | 11.1%(-4.72)#26,526 |
| 56. | 19701 | 6.3% | 12.4%(-6.09)#56 | 11.1%(-4.74)#26,538 |
| 57. | 19944 | 5.9% | 12.4%(-6.49)#57 | 11.1%(-5.14)#26,887 |
| 58. | 19951 | 4.5% | 12.4%(-7.88)#58 | 11.1%(-6.53)#27,893 |
1
Common Questions
What are the Top 10 Zip Codes with the Highest Percentage of Population with a Degree in Education in Delaware?
Top 10 Zip Codes with the Highest Percentage of Population with a Degree in Education in Delaware are:
What zip code has the Highest Percentage of Population with a Degree in Education in Delaware?
19710 has the Highest Percentage of Population with a Degree in Education in Delaware with 50.0%.
What is the Percentage of Population with a Degree in Education in the State of Delaware?
Percentage of Population with a Degree in Education in Delaware is 12.4%.
What is the Percentage of Population with a Degree in Education in the United States?
Percentage of Population with a Degree in Education in the United States is 11.1%.