Zip Codes with the Highest Percentage of Population Employed in Life, Physical & Social Science in Delaware
RELATED REPORTS & OPTIONS
Life, Physical & Social Science
Delaware
Compare Zip Codes
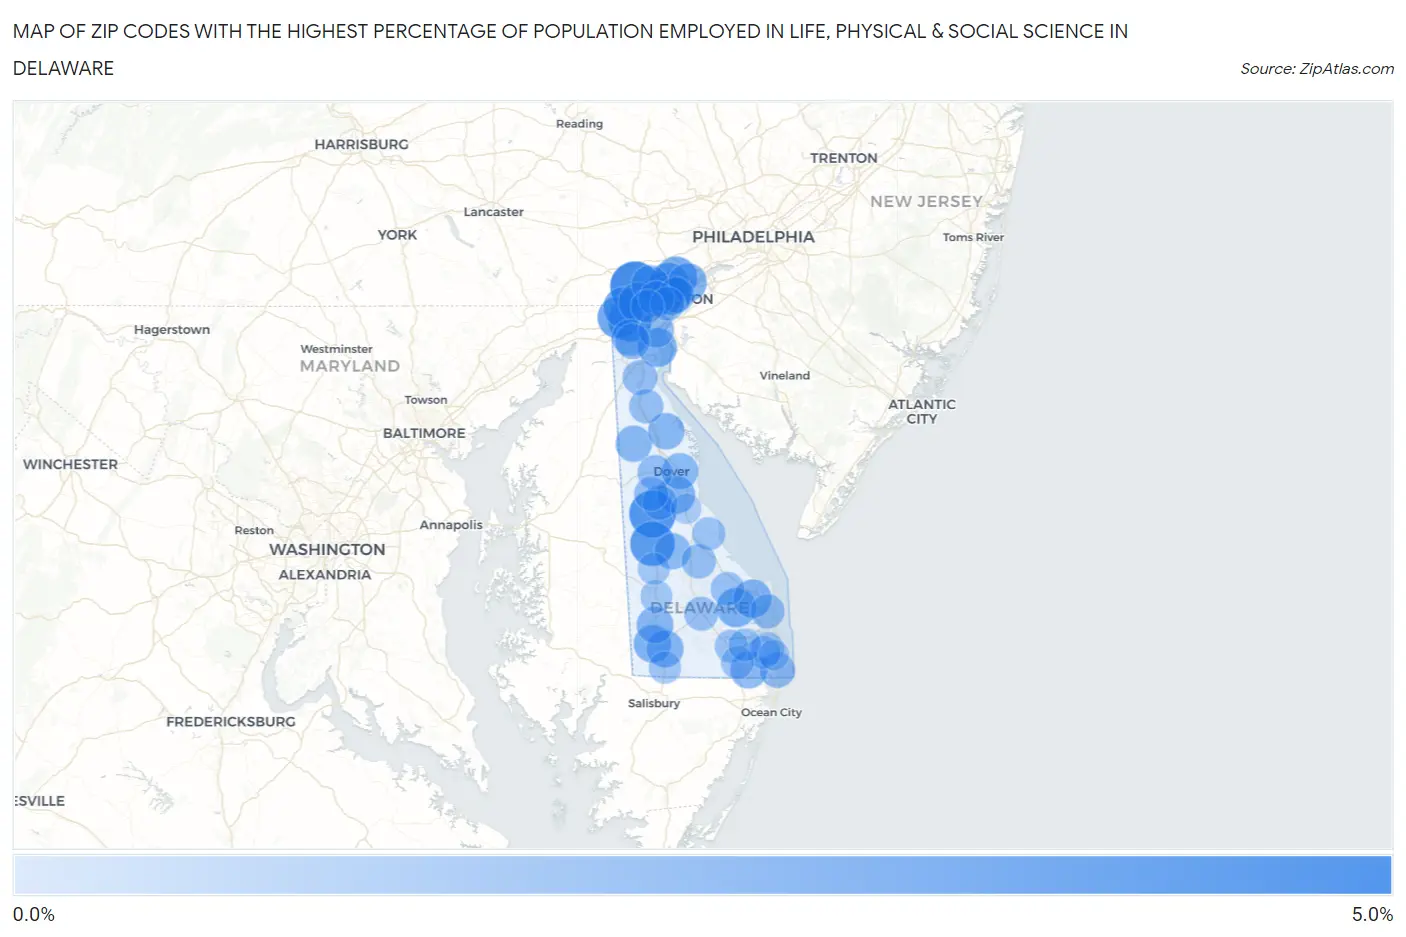
Map of Zip Codes with the Highest Percentage of Population Employed in Life, Physical & Social Science in Delaware
0.0%
5.0%
Zip Codes with the Highest Percentage of Population Employed in Life, Physical & Social Science in Delaware
| Zip Code | % Employed | vs State | vs National | |
| 1. | 19707 | 4.5% | 1.5%(+2.93)#1 | 1.1%(+3.38)#937 |
| 2. | 19943 | 3.8% | 1.5%(+2.22)#2 | 1.1%(+2.67)#1,285 |
| 3. | 19952 | 3.3% | 1.5%(+1.77)#3 | 1.1%(+2.23)#1,562 |
| 4. | 19713 | 3.0% | 1.5%(+1.45)#4 | 1.1%(+1.90)#1,885 |
| 5. | 19806 | 2.9% | 1.5%(+1.31)#5 | 1.1%(+1.76)#2,050 |
| 6. | 19717 | 2.7% | 1.5%(+1.20)#6 | 1.1%(+1.66)#2,174 |
| 7. | 19810 | 2.6% | 1.5%(+1.09)#7 | 1.1%(+1.54)#2,342 |
| 8. | 19711 | 2.5% | 1.5%(+0.910)#8 | 1.1%(+1.37)#2,649 |
| 9. | 19808 | 2.3% | 1.5%(+0.767)#9 | 1.1%(+1.22)#2,926 |
| 10. | 19803 | 2.2% | 1.5%(+0.678)#10 | 1.1%(+1.13)#3,119 |
| 11. | 19802 | 2.2% | 1.5%(+0.660)#11 | 1.1%(+1.12)#3,167 |
| 12. | 19951 | 2.1% | 1.5%(+0.563)#12 | 1.1%(+1.02)#3,403 |
| 13. | 19706 | 2.0% | 1.5%(+0.456)#13 | 1.1%(+0.911)#3,682 |
| 14. | 19703 | 2.0% | 1.5%(+0.404)#14 | 1.1%(+0.859)#3,825 |
| 15. | 19958 | 1.9% | 1.5%(+0.334)#15 | 1.1%(+0.789)#4,042 |
| 16. | 19962 | 1.8% | 1.5%(+0.216)#16 | 1.1%(+0.671)#4,468 |
| 17. | 19931 | 1.7% | 1.5%(+0.135)#17 | 1.1%(+0.590)#4,821 |
| 18. | 19956 | 1.6% | 1.5%(+0.061)#18 | 1.1%(+0.516)#5,122 |
| 19. | 19975 | 1.6% | 1.5%(+0.026)#19 | 1.1%(+0.480)#5,288 |
| 20. | 19807 | 1.5% | 1.5%(+0.001)#20 | 1.1%(+0.456)#5,399 |
| 21. | 19973 | 1.5% | 1.5%(-0.034)#21 | 1.1%(+0.421)#5,596 |
| 22. | 19938 | 1.4% | 1.5%(-0.130)#22 | 1.1%(+0.325)#6,104 |
| 23. | 19977 | 1.4% | 1.5%(-0.130)#23 | 1.1%(+0.325)#6,106 |
| 24. | 19702 | 1.4% | 1.5%(-0.138)#24 | 1.1%(+0.317)#6,150 |
| 25. | 19901 | 1.4% | 1.5%(-0.139)#25 | 1.1%(+0.316)#6,157 |
| 26. | 19954 | 1.4% | 1.5%(-0.182)#26 | 1.1%(+0.273)#6,395 |
| 27. | 19809 | 1.3% | 1.5%(-0.242)#27 | 1.1%(+0.213)#6,776 |
| 28. | 19944 | 1.2% | 1.5%(-0.326)#28 | 1.1%(+0.129)#7,346 |
| 29. | 19805 | 1.2% | 1.5%(-0.336)#29 | 1.1%(+0.119)#7,420 |
| 30. | 19720 | 1.2% | 1.5%(-0.377)#30 | 1.1%(+0.078)#7,741 |
| 31. | 19701 | 1.1% | 1.5%(-0.408)#31 | 1.1%(+0.047)#7,948 |
| 32. | 19709 | 1.0% | 1.5%(-0.501)#32 | 1.1%(-0.046)#8,659 |
| 33. | 19904 | 1.0% | 1.5%(-0.520)#33 | 1.1%(-0.066)#8,835 |
| 34. | 19979 | 1.0% | 1.5%(-0.525)#34 | 1.1%(-0.071)#8,885 |
| 35. | 19960 | 0.96% | 1.5%(-0.587)#35 | 1.1%(-0.132)#9,417 |
| 36. | 19734 | 0.94% | 1.5%(-0.601)#36 | 1.1%(-0.146)#9,536 |
| 37. | 19934 | 0.91% | 1.5%(-0.634)#37 | 1.1%(-0.179)#9,849 |
| 38. | 19971 | 0.90% | 1.5%(-0.646)#38 | 1.1%(-0.191)#9,972 |
| 39. | 19801 | 0.87% | 1.5%(-0.678)#39 | 1.1%(-0.223)#10,284 |
| 40. | 19947 | 0.86% | 1.5%(-0.686)#40 | 1.1%(-0.231)#10,371 |
| 41. | 19968 | 0.77% | 1.5%(-0.772)#41 | 1.1%(-0.317)#11,260 |
| 42. | 19963 | 0.69% | 1.5%(-0.860)#42 | 1.1%(-0.405)#12,217 |
| 43. | 19804 | 0.68% | 1.5%(-0.862)#43 | 1.1%(-0.408)#12,251 |
| 44. | 19966 | 0.67% | 1.5%(-0.871)#44 | 1.1%(-0.416)#12,352 |
| 45. | 19970 | 0.65% | 1.5%(-0.893)#45 | 1.1%(-0.438)#12,627 |
| 46. | 19967 | 0.62% | 1.5%(-0.924)#46 | 1.1%(-0.469)#13,018 |
| 47. | 19945 | 0.61% | 1.5%(-0.934)#47 | 1.1%(-0.479)#13,141 |
| 48. | 19939 | 0.60% | 1.5%(-0.941)#48 | 1.1%(-0.486)#13,231 |
| 49. | 19940 | 0.50% | 1.5%(-1.04)#49 | 1.1%(-0.590)#14,482 |
| 50. | 19933 | 0.43% | 1.5%(-1.12)#50 | 1.1%(-0.661)#15,377 |
| 51. | 19950 | 0.38% | 1.5%(-1.17)#51 | 1.1%(-0.714)#16,053 |
| 52. | 19930 | 0.10% | 1.5%(-1.44)#52 | 1.1%(-0.987)#19,053 |
| 53. | 19946 | 0.040% | 1.5%(-1.51)#53 | 1.1%(-1.05)#19,368 |
1
Common Questions
What are the Top 10 Zip Codes with the Highest Percentage of Population Employed in Life, Physical & Social Science in Delaware?
Top 10 Zip Codes with the Highest Percentage of Population Employed in Life, Physical & Social Science in Delaware are:
What zip code has the Highest Percentage of Population Employed in Life, Physical & Social Science in Delaware?
19707 has the Highest Percentage of Population Employed in Life, Physical & Social Science in Delaware with 4.5%.
What is the Percentage of Population Employed in Life, Physical & Social Science in the State of Delaware?
Percentage of Population Employed in Life, Physical & Social Science in Delaware is 1.5%.
What is the Percentage of Population Employed in Life, Physical & Social Science in the United States?
Percentage of Population Employed in Life, Physical & Social Science in the United States is 1.1%.