Zip Codes with the Highest Percentage of Population Employed in Architecture & Engineering in Newark, DE
RELATED REPORTS & OPTIONS
Architecture & Engineering
Newark
Compare Zip Codes
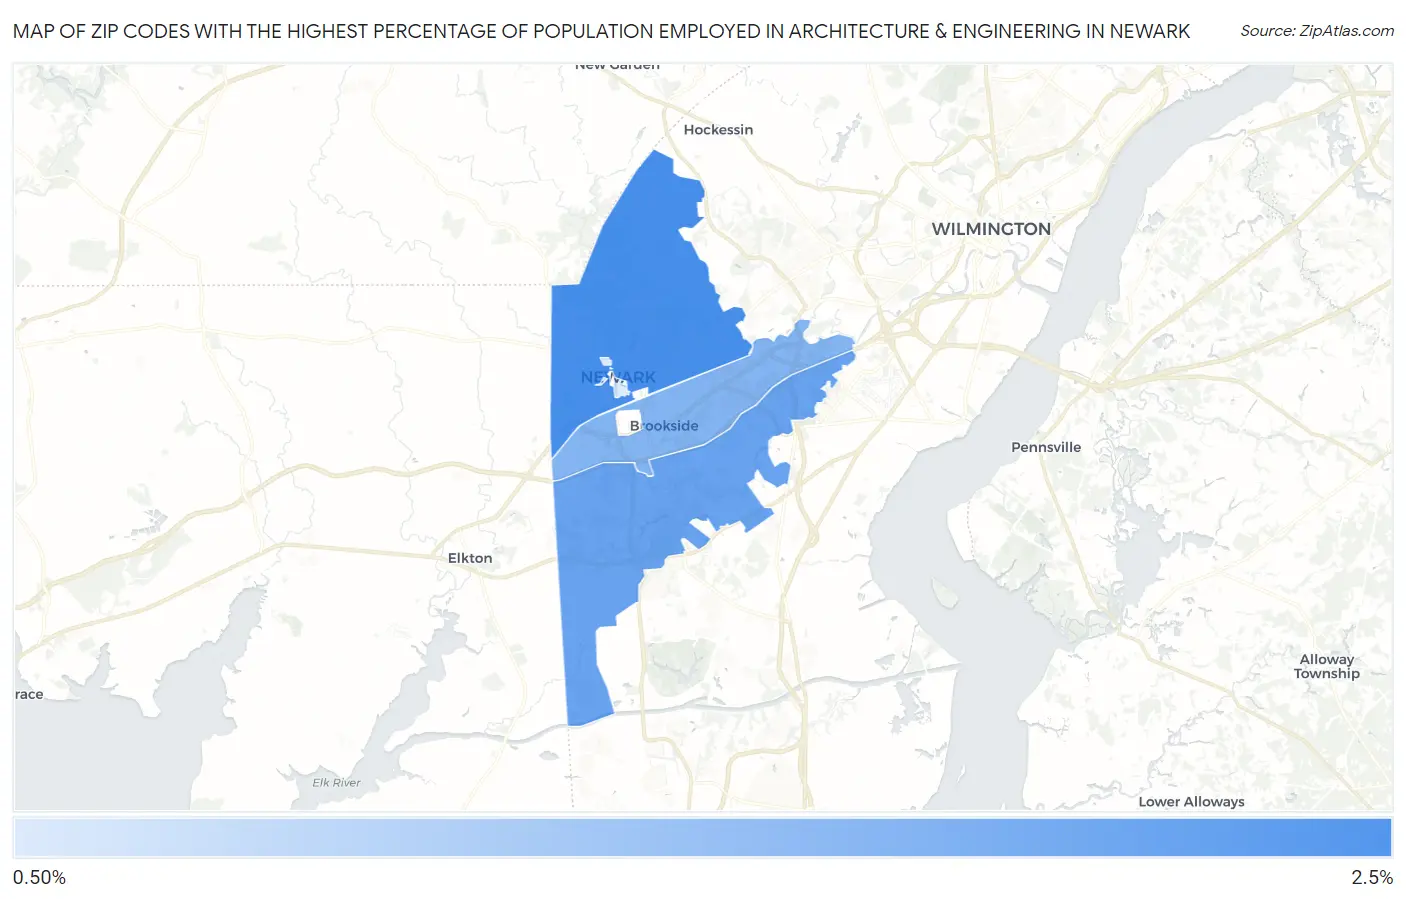
Map of Zip Codes with the Highest Percentage of Population Employed in Architecture & Engineering in Newark
0.66%
2.2%
Zip Codes with the Highest Percentage of Population Employed in Architecture & Engineering in Newark, DE
| Zip Code | % Employed | vs State | vs National | |
| 1. | 19711 | 2.2% | 1.7%(+0.511)#17 | 2.1%(+0.051)#8,475 |
| 2. | 19702 | 1.9% | 1.7%(+0.186)#22 | 2.1%(-0.274)#10,403 |
| 3. | 19713 | 1.6% | 1.7%(-0.110)#26 | 2.1%(-0.569)#12,303 |
| 4. | 19717 | 0.66% | 1.7%(-1.03)#45 | 2.1%(-1.49)#19,148 |
1
Common Questions
What are the Top 3 Zip Codes with the Highest Percentage of Population Employed in Architecture & Engineering in Newark, DE?
Top 3 Zip Codes with the Highest Percentage of Population Employed in Architecture & Engineering in Newark, DE are:
What zip code has the Highest Percentage of Population Employed in Architecture & Engineering in Newark, DE?
19711 has the Highest Percentage of Population Employed in Architecture & Engineering in Newark, DE with 2.2%.
What is the Percentage of Population Employed in Architecture & Engineering in Newark, DE?
Percentage of Population Employed in Architecture & Engineering in Newark is 2.2%.
What is the Percentage of Population Employed in Architecture & Engineering in Delaware?
Percentage of Population Employed in Architecture & Engineering in Delaware is 1.7%.
What is the Percentage of Population Employed in Architecture & Engineering in the United States?
Percentage of Population Employed in Architecture & Engineering in the United States is 2.1%.