Zip Codes with the Highest Percentage of Population Employed in Architecture & Engineering in Delaware
RELATED REPORTS & OPTIONS
Architecture & Engineering
Delaware
Compare Zip Codes
Map of Zip Codes with the Highest Percentage of Population Employed in Architecture & Engineering in Delaware
0.0%
20.0%
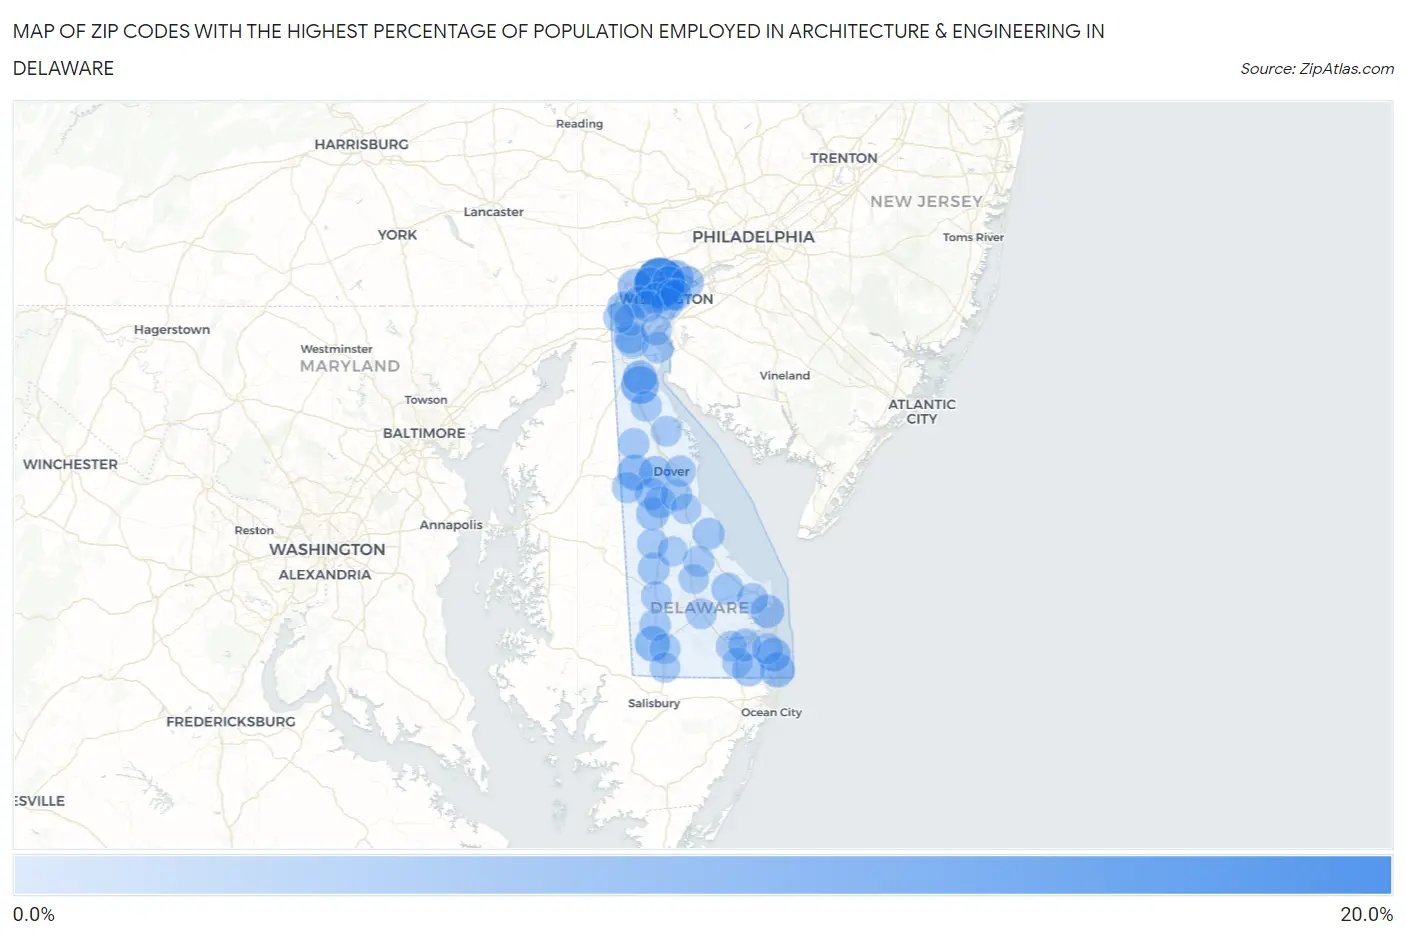
Zip Codes with the Highest Percentage of Population Employed in Architecture & Engineering in Delaware
| Zip Code | % Employed | vs State | vs National | |
| 1. | 19732 | 16.8% | 1.7%(+15.1)#1 | 2.1%(+14.6)#125 |
| 2. | 19730 | 6.5% | 1.7%(+4.80)#2 | 2.1%(+4.34)#893 |
| 3. | 19953 | 4.5% | 1.7%(+2.80)#3 | 2.1%(+2.34)#2,143 |
| 4. | 19931 | 4.2% | 1.7%(+2.51)#4 | 2.1%(+2.05)#2,489 |
| 5. | 19707 | 3.7% | 1.7%(+1.99)#5 | 2.1%(+1.53)#3,341 |
| 6. | 19810 | 3.7% | 1.7%(+1.99)#6 | 2.1%(+1.53)#3,349 |
| 7. | 19944 | 3.7% | 1.7%(+1.97)#7 | 2.1%(+1.51)#3,383 |
| 8. | 19709 | 3.4% | 1.7%(+1.66)#8 | 2.1%(+1.20)#4,065 |
| 9. | 19930 | 3.2% | 1.7%(+1.55)#9 | 2.1%(+1.09)#4,366 |
| 10. | 19971 | 2.7% | 1.7%(+1.02)#10 | 2.1%(+0.564)#6,107 |
| 11. | 19807 | 2.7% | 1.7%(+0.982)#11 | 2.1%(+0.522)#6,275 |
| 12. | 19806 | 2.7% | 1.7%(+0.965)#12 | 2.1%(+0.506)#6,348 |
| 13. | 19701 | 2.5% | 1.7%(+0.780)#13 | 2.1%(+0.320)#7,137 |
| 14. | 19803 | 2.4% | 1.7%(+0.720)#14 | 2.1%(+0.261)#7,435 |
| 15. | 19975 | 2.3% | 1.7%(+0.618)#15 | 2.1%(+0.159)#7,901 |
| 16. | 19703 | 2.2% | 1.7%(+0.529)#16 | 2.1%(+0.070)#8,384 |
| 17. | 19711 | 2.2% | 1.7%(+0.511)#17 | 2.1%(+0.051)#8,475 |
| 18. | 19943 | 2.2% | 1.7%(+0.479)#18 | 2.1%(+0.020)#8,666 |
| 19. | 19904 | 2.1% | 1.7%(+0.413)#19 | 2.1%(-0.046)#9,026 |
| 20. | 19939 | 2.0% | 1.7%(+0.297)#20 | 2.1%(-0.162)#9,694 |
| 21. | 19934 | 1.9% | 1.7%(+0.256)#21 | 2.1%(-0.204)#9,944 |
| 22. | 19702 | 1.9% | 1.7%(+0.186)#22 | 2.1%(-0.274)#10,403 |
| 23. | 19808 | 1.8% | 1.7%(+0.103)#23 | 2.1%(-0.357)#10,867 |
| 24. | 19979 | 1.7% | 1.7%(+0.011)#24 | 2.1%(-0.449)#11,486 |
| 25. | 19968 | 1.7% | 1.7%(+0.007)#25 | 2.1%(-0.453)#11,514 |
| 26. | 19713 | 1.6% | 1.7%(-0.110)#26 | 2.1%(-0.569)#12,303 |
| 27. | 19963 | 1.5% | 1.7%(-0.177)#27 | 2.1%(-0.637)#12,795 |
| 28. | 19805 | 1.5% | 1.7%(-0.229)#28 | 2.1%(-0.688)#13,149 |
| 29. | 19950 | 1.5% | 1.7%(-0.231)#29 | 2.1%(-0.691)#13,175 |
| 30. | 19962 | 1.4% | 1.7%(-0.277)#30 | 2.1%(-0.736)#13,494 |
| 31. | 19973 | 1.3% | 1.7%(-0.375)#31 | 2.1%(-0.834)#14,218 |
| 32. | 19802 | 1.3% | 1.7%(-0.406)#32 | 2.1%(-0.866)#14,420 |
| 33. | 19901 | 1.3% | 1.7%(-0.418)#33 | 2.1%(-0.878)#14,512 |
| 34. | 19964 | 1.2% | 1.7%(-0.442)#34 | 2.1%(-0.901)#14,693 |
| 35. | 19706 | 1.2% | 1.7%(-0.466)#35 | 2.1%(-0.926)#14,891 |
| 36. | 19801 | 1.2% | 1.7%(-0.485)#36 | 2.1%(-0.944)#15,031 |
| 37. | 19809 | 1.1% | 1.7%(-0.616)#37 | 2.1%(-1.08)#16,068 |
| 38. | 19958 | 1.0% | 1.7%(-0.663)#38 | 2.1%(-1.12)#16,414 |
| 39. | 19804 | 0.97% | 1.7%(-0.718)#39 | 2.1%(-1.18)#16,820 |
| 40. | 19938 | 0.92% | 1.7%(-0.769)#40 | 2.1%(-1.23)#17,202 |
| 41. | 19960 | 0.90% | 1.7%(-0.791)#41 | 2.1%(-1.25)#17,377 |
| 42. | 19720 | 0.84% | 1.7%(-0.851)#42 | 2.1%(-1.31)#17,863 |
| 43. | 19970 | 0.73% | 1.7%(-0.955)#43 | 2.1%(-1.41)#18,651 |
| 44. | 19734 | 0.69% | 1.7%(-0.995)#44 | 2.1%(-1.45)#18,927 |
| 45. | 19717 | 0.66% | 1.7%(-1.03)#45 | 2.1%(-1.49)#19,148 |
| 46. | 19952 | 0.63% | 1.7%(-1.06)#46 | 2.1%(-1.52)#19,415 |
| 47. | 19947 | 0.62% | 1.7%(-1.07)#47 | 2.1%(-1.53)#19,502 |
| 48. | 19966 | 0.55% | 1.7%(-1.14)#48 | 2.1%(-1.60)#19,963 |
| 49. | 19956 | 0.41% | 1.7%(-1.28)#49 | 2.1%(-1.74)#20,869 |
| 50. | 19933 | 0.38% | 1.7%(-1.31)#50 | 2.1%(-1.77)#21,080 |
| 51. | 19940 | 0.38% | 1.7%(-1.31)#51 | 2.1%(-1.77)#21,117 |
| 52. | 19977 | 0.36% | 1.7%(-1.33)#52 | 2.1%(-1.79)#21,213 |
| 53. | 19945 | 0.31% | 1.7%(-1.38)#53 | 2.1%(-1.84)#21,514 |
| 54. | 19954 | 0.27% | 1.7%(-1.42)#54 | 2.1%(-1.88)#21,711 |
| 55. | 19946 | 0.16% | 1.7%(-1.53)#55 | 2.1%(-1.99)#22,213 |
| 56. | 19941 | 0.16% | 1.7%(-1.53)#56 | 2.1%(-1.99)#22,223 |
1
Common Questions
What are the Top 10 Zip Codes with the Highest Percentage of Population Employed in Architecture & Engineering in Delaware?
Top 10 Zip Codes with the Highest Percentage of Population Employed in Architecture & Engineering in Delaware are:
What zip code has the Highest Percentage of Population Employed in Architecture & Engineering in Delaware?
19732 has the Highest Percentage of Population Employed in Architecture & Engineering in Delaware with 16.8%.
What is the Percentage of Population Employed in Architecture & Engineering in the State of Delaware?
Percentage of Population Employed in Architecture & Engineering in Delaware is 1.7%.
What is the Percentage of Population Employed in Architecture & Engineering in the United States?
Percentage of Population Employed in Architecture & Engineering in the United States is 2.1%.