Zip Codes with the Highest Percentage of Population Employed in Agriculture, Fishing & Hunting in Park City, UT
RELATED REPORTS & OPTIONS
Agriculture, Fishing & Hunting
Park City
Compare Zip Codes
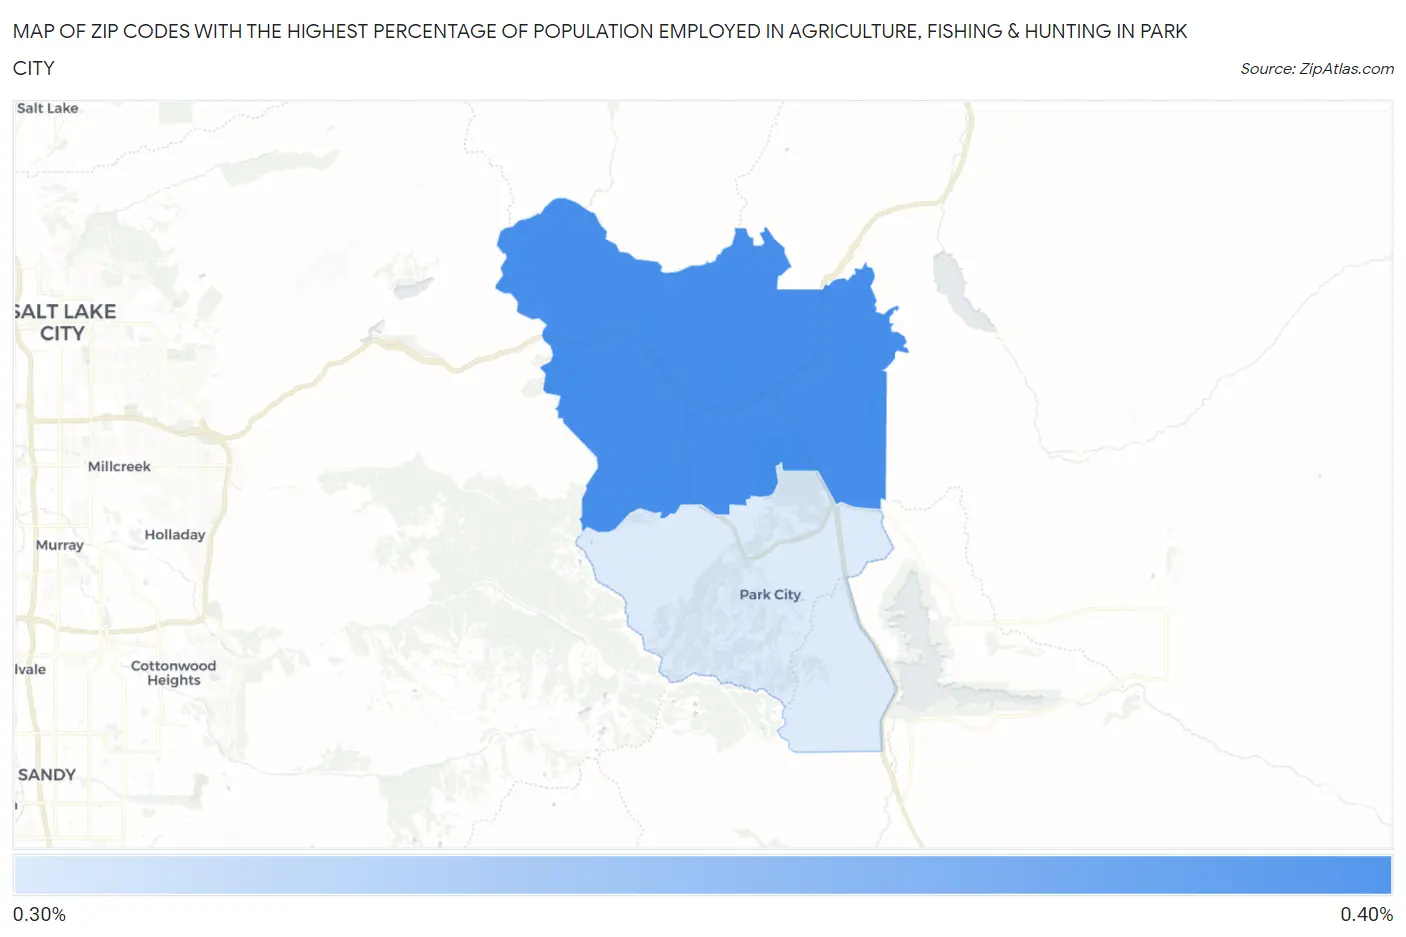
Map of Zip Codes with the Highest Percentage of Population Employed in Agriculture, Fishing & Hunting in Park City
0.31%
0.33%
Zip Codes with the Highest Percentage of Population Employed in Agriculture, Fishing & Hunting in Park City, UT
| Zip Code | % Employed | vs State | vs National | |
| 1. | 84098 | 0.33% | 0.72%(-0.396)#188 | 1.2%(-0.872)#20,872 |
| 2. | 84060 | 0.31% | 0.72%(-0.414)#190 | 1.2%(-0.891)#21,074 |
1
Common Questions
What are the Top Zip Codes with the Highest Percentage of Population Employed in Agriculture, Fishing & Hunting in Park City, UT?
Top Zip Codes with the Highest Percentage of Population Employed in Agriculture, Fishing & Hunting in Park City, UT are:
What zip code has the Highest Percentage of Population Employed in Agriculture, Fishing & Hunting in Park City, UT?
84098 has the Highest Percentage of Population Employed in Agriculture, Fishing & Hunting in Park City, UT with 0.33%.
What is the Percentage of Population Employed in Agriculture, Fishing & Hunting in Park City, UT?
Percentage of Population Employed in Agriculture, Fishing & Hunting in Park City is 0.32%.
What is the Percentage of Population Employed in Agriculture, Fishing & Hunting in Utah?
Percentage of Population Employed in Agriculture, Fishing & Hunting in Utah is 0.72%.
What is the Percentage of Population Employed in Agriculture, Fishing & Hunting in the United States?
Percentage of Population Employed in Agriculture, Fishing & Hunting in the United States is 1.2%.