Queen City, TX Map & Demographics
Queen City Map
Queen City Overview
$26,594
PER CAPITA INCOME
$72,292
AVG FAMILY INCOME
$40,156
AVG HOUSEHOLD INCOME
57.6%
WAGE / INCOME GAP [ % ]
42.4¢/ $1
WAGE / INCOME GAP [ $ ]
$11,440
FAMILY INCOME DEFICIT
0.47
INEQUALITY / GINI INDEX
1,306
TOTAL POPULATION
582
MALE POPULATION
724
FEMALE POPULATION
80.39
MALES / 100 FEMALES
124.40
FEMALES / 100 MALES
40.7
MEDIAN AGE
2.9
AVG FAMILY SIZE
2.3
AVG HOUSEHOLD SIZE
605
LABOR FORCE [ PEOPLE ]
55.7%
PERCENT IN LABOR FORCE
3.1%
UNEMPLOYMENT RATE
Queen City Zip Codes
Queen City Area Codes
Income in Queen City
Income Overview in Queen City
Per Capita Income in Queen City is $26,594, while median incomes of families and households are $72,292 and $40,156 respectively.
| Characteristic | Number | Measure |
| Per Capita Income | 1,306 | $26,594 |
| Median Family Income | 339 | $72,292 |
| Mean Family Income | 339 | $73,667 |
| Median Household Income | 559 | $40,156 |
| Mean Household Income | 559 | $60,501 |
| Income Deficit | 339 | $11,440 |
| Wage / Income Gap (%) | 1,306 | 57.64% |
| Wage / Income Gap ($) | 1,306 | 42.36¢ per $1 |
| Gini / Inequality Index | 1,306 | 0.47 |
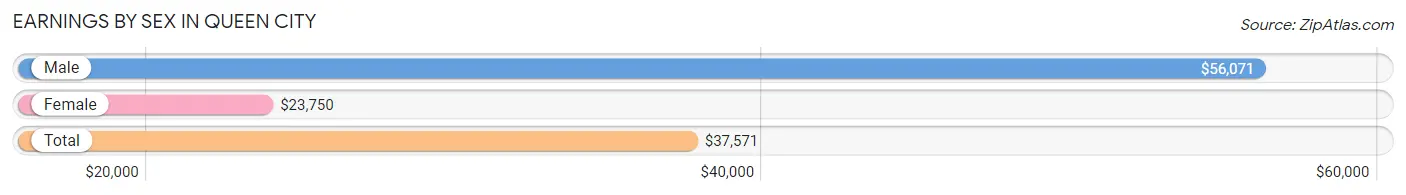
Earnings by Sex in Queen City
Average Earnings in Queen City are $37,571, $56,071 for men and $23,750 for women, a difference of 57.6%.
| Sex | Number | Average Earnings |
| Male | 264 (41.0%) | $56,071 |
| Female | 380 (59.0%) | $23,750 |
| Total | 644 (100.0%) | $37,571 |
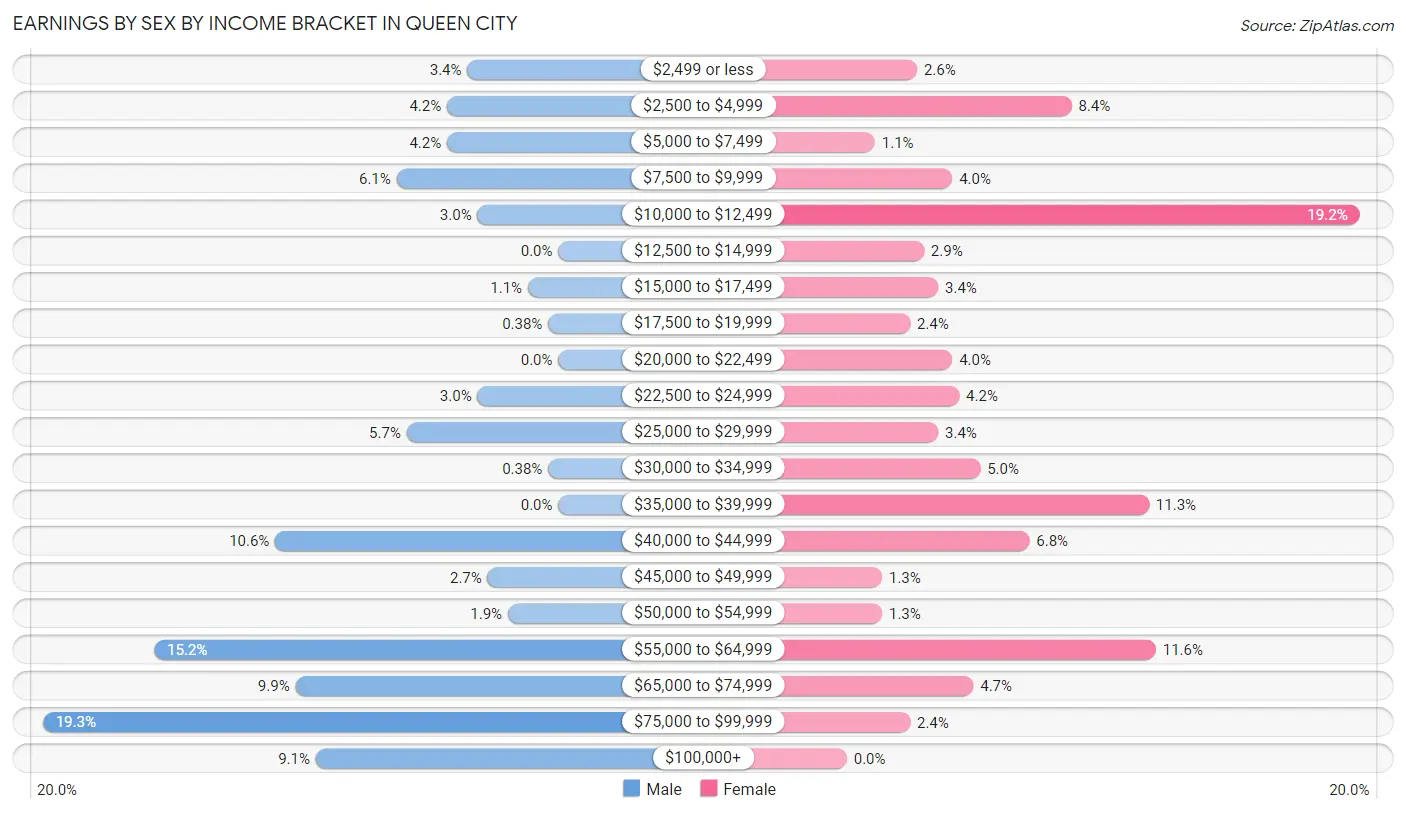
Earnings by Sex by Income Bracket in Queen City
The most common earnings brackets in Queen City are $75,000 to $99,999 for men (51 | 19.3%) and $10,000 to $12,499 for women (73 | 19.2%).
| Income | Male | Female |
| $2,499 or less | 9 (3.4%) | 10 (2.6%) |
| $2,500 to $4,999 | 11 (4.2%) | 32 (8.4%) |
| $5,000 to $7,499 | 11 (4.2%) | 4 (1.1%) |
| $7,500 to $9,999 | 16 (6.1%) | 15 (4.0%) |
| $10,000 to $12,499 | 8 (3.0%) | 73 (19.2%) |
| $12,500 to $14,999 | 0 (0.0%) | 11 (2.9%) |
| $15,000 to $17,499 | 3 (1.1%) | 13 (3.4%) |
| $17,500 to $19,999 | 1 (0.4%) | 9 (2.4%) |
| $20,000 to $22,499 | 0 (0.0%) | 15 (4.0%) |
| $22,500 to $24,999 | 8 (3.0%) | 16 (4.2%) |
| $25,000 to $29,999 | 15 (5.7%) | 13 (3.4%) |
| $30,000 to $34,999 | 1 (0.4%) | 19 (5.0%) |
| $35,000 to $39,999 | 0 (0.0%) | 43 (11.3%) |
| $40,000 to $44,999 | 28 (10.6%) | 26 (6.8%) |
| $45,000 to $49,999 | 7 (2.6%) | 5 (1.3%) |
| $50,000 to $54,999 | 5 (1.9%) | 5 (1.3%) |
| $55,000 to $64,999 | 40 (15.1%) | 44 (11.6%) |
| $65,000 to $74,999 | 26 (9.9%) | 18 (4.7%) |
| $75,000 to $99,999 | 51 (19.3%) | 9 (2.4%) |
| $100,000+ | 24 (9.1%) | 0 (0.0%) |
| Total | 264 (100.0%) | 380 (100.0%) |
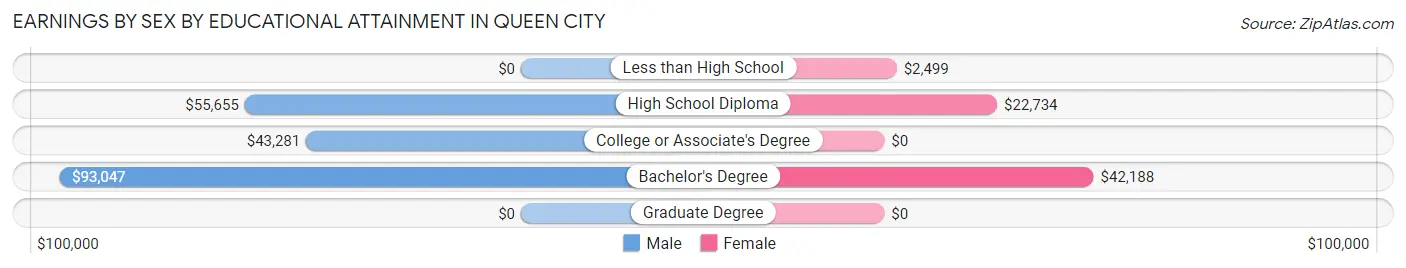
Earnings by Sex by Educational Attainment in Queen City
Average earnings in Queen City are $56,250 for men and $33,417 for women, a difference of 40.6%. Men with an educational attainment of bachelor's degree enjoy the highest average annual earnings of $93,047, while those with college or associate's degree education earn the least with $43,281. Women with an educational attainment of bachelor's degree earn the most with the average annual earnings of $42,188, while those with less than high school education have the smallest earnings of $2,499.
| Educational Attainment | Male Income | Female Income |
| Less than High School | - | - |
| High School Diploma | $55,655 | $22,734 |
| College or Associate's Degree | $43,281 | $0 |
| Bachelor's Degree | $93,047 | $42,188 |
| Graduate Degree | - | - |
| Total | $56,250 | $33,417 |
Family Income in Queen City
Family Income Brackets in Queen City
According to the Queen City family income data, there are 74 families falling into the $75,000 to $99,999 income range, which is the most common income bracket and makes up 21.8% of all families.
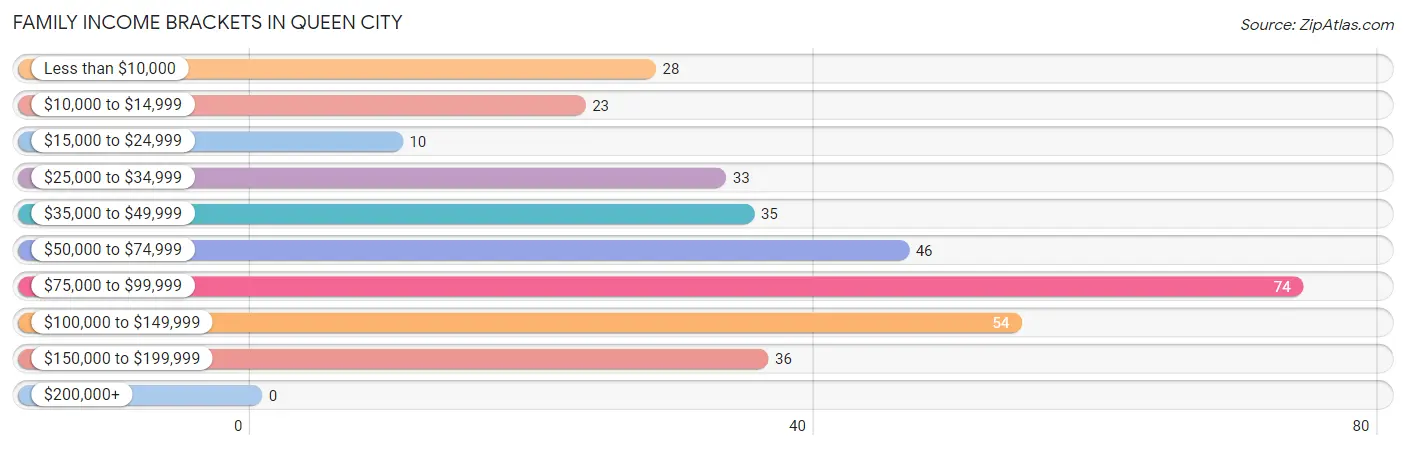
| Income Bracket | # Families | % Families |
| Less than $10,000 | 28 | 8.3% |
| $10,000 to $14,999 | 23 | 6.8% |
| $15,000 to $24,999 | 10 | 2.9% |
| $25,000 to $34,999 | 33 | 9.7% |
| $35,000 to $49,999 | 35 | 10.3% |
| $50,000 to $74,999 | 46 | 13.6% |
| $75,000 to $99,999 | 74 | 21.8% |
| $100,000 to $149,999 | 54 | 15.9% |
| $150,000 to $199,999 | 36 | 10.6% |
| $200,000+ | 0 | 0.0% |
Family Income by Famaliy Size in Queen City
3-person families (63 | 18.6%) account for the highest median family income in Queen City with $84,740 per family, while 3-person families (63 | 18.6%) have the highest median income of $28,247 per family member.
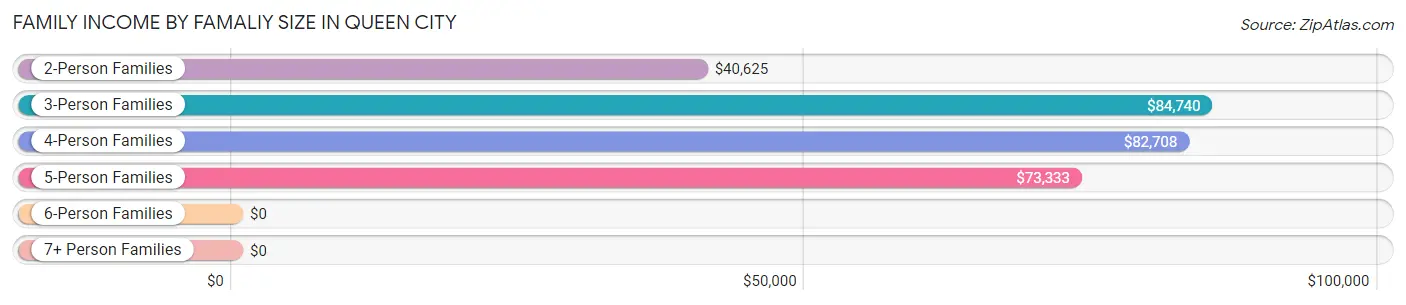
| Income Bracket | # Families | Median Income |
| 2-Person Families | 172 (50.7%) | $40,625 |
| 3-Person Families | 63 (18.6%) | $84,740 |
| 4-Person Families | 87 (25.7%) | $82,708 |
| 5-Person Families | 10 (2.9%) | $73,333 |
| 6-Person Families | 0 (0.0%) | $0 |
| 7+ Person Families | 7 (2.1%) | $0 |
| Total | 339 (100.0%) | $72,292 |
Family Income by Number of Earners in Queen City
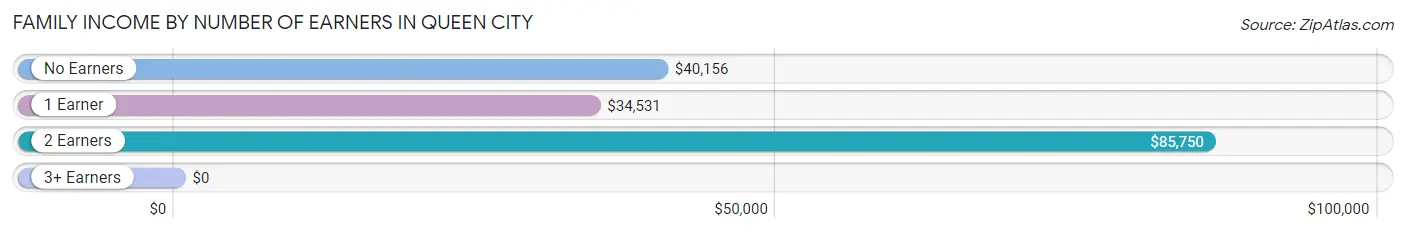
| Number of Earners | # Families | Median Income |
| No Earners | 69 (20.3%) | $40,156 |
| 1 Earner | 113 (33.3%) | $34,531 |
| 2 Earners | 138 (40.7%) | $85,750 |
| 3+ Earners | 19 (5.6%) | $0 |
| Total | 339 (100.0%) | $72,292 |
Household Income in Queen City
Household Income Brackets in Queen City
With 80 households falling in the category, the $75,000 to $99,999 income range is the most frequent in Queen City, accounting for 14.3% of all households.
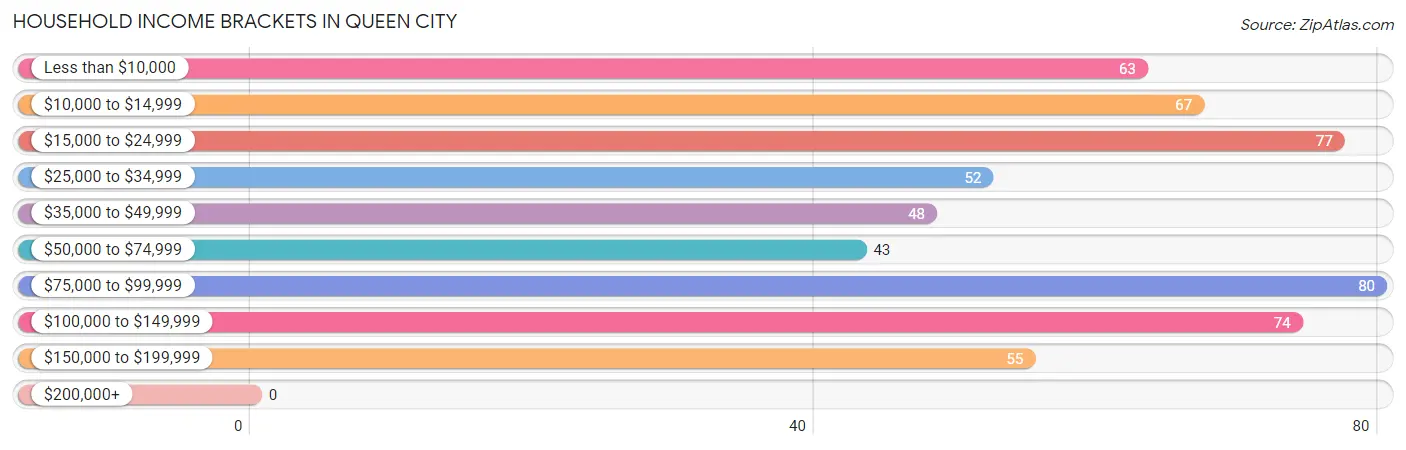
| Income Bracket | # Households | % Households |
| Less than $10,000 | 63 | 11.3% |
| $10,000 to $14,999 | 67 | 12.0% |
| $15,000 to $24,999 | 77 | 13.8% |
| $25,000 to $34,999 | 52 | 9.3% |
| $35,000 to $49,999 | 48 | 8.6% |
| $50,000 to $74,999 | 43 | 7.7% |
| $75,000 to $99,999 | 80 | 14.3% |
| $100,000 to $149,999 | 74 | 13.2% |
| $150,000 to $199,999 | 55 | 9.8% |
| $200,000+ | 0 | 0.0% |
Household Income by Householder Age in Queen City
The median household income in Queen City is $40,156, with the highest median household income of $82,500 found in the 25 to 44 years age bracket for the primary householder. A total of 196 households (35.1%) fall into this category. Meanwhile, the 15 to 24 years age bracket for the primary householder has the lowest median household income of $0, with 4 households (0.7%) in this group.
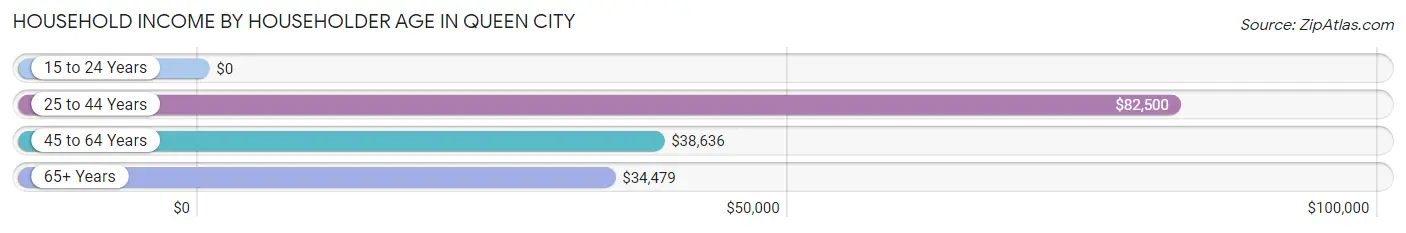
| Income Bracket | # Households | Median Income |
| 15 to 24 Years | 4 (0.7%) | $0 |
| 25 to 44 Years | 196 (35.1%) | $82,500 |
| 45 to 64 Years | 152 (27.2%) | $38,636 |
| 65+ Years | 207 (37.0%) | $34,479 |
| Total | 559 (100.0%) | $40,156 |
Poverty in Queen City
Income Below Poverty by Sex and Age in Queen City
With 19.6% poverty level for males and 22.2% for females among the residents of Queen City, 15 year old males and 12 to 14 year old females are the most vulnerable to poverty, with 25 males (100.0%) and 4 females (100.0%) in their respective age groups living below the poverty level.
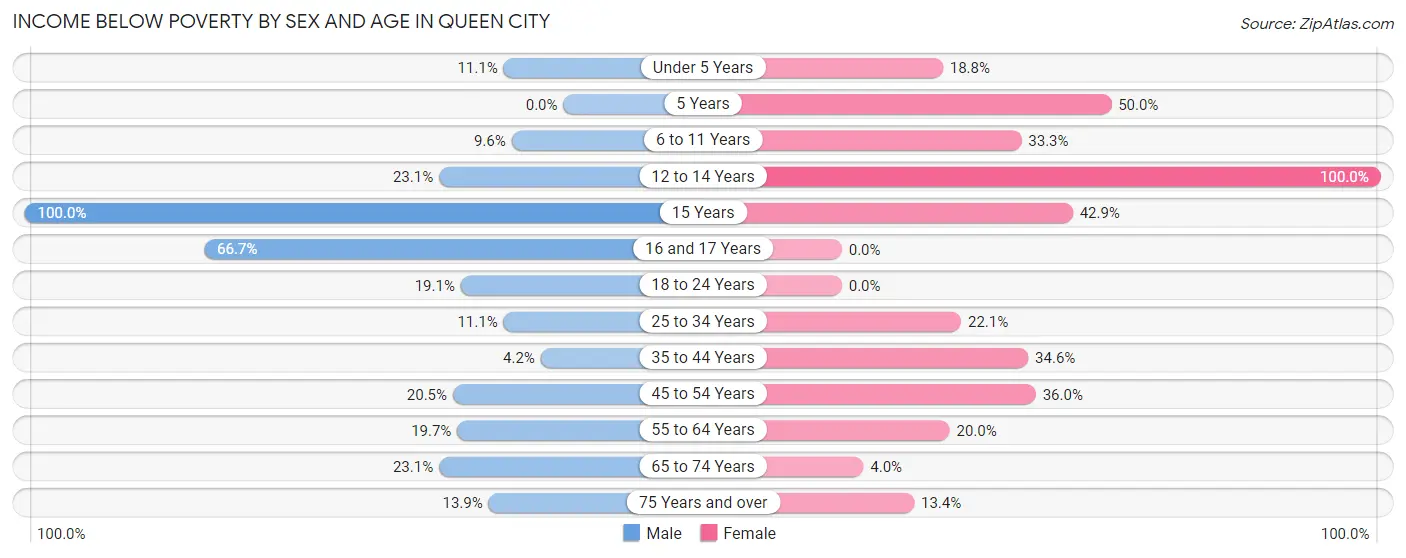
| Age Bracket | Male | Female |
| Under 5 Years | 3 (11.1%) | 3 (18.8%) |
| 5 Years | 0 (0.0%) | 4 (50.0%) |
| 6 to 11 Years | 5 (9.6%) | 18 (33.3%) |
| 12 to 14 Years | 6 (23.1%) | 4 (100.0%) |
| 15 Years | 25 (100.0%) | 3 (42.9%) |
| 16 and 17 Years | 12 (66.7%) | 0 (0.0%) |
| 18 to 24 Years | 4 (19.1%) | 0 (0.0%) |
| 25 to 34 Years | 11 (11.1%) | 27 (22.1%) |
| 35 to 44 Years | 4 (4.2%) | 46 (34.6%) |
| 45 to 54 Years | 8 (20.5%) | 27 (36.0%) |
| 55 to 64 Years | 13 (19.7%) | 15 (20.0%) |
| 65 to 74 Years | 18 (23.1%) | 3 (4.0%) |
| 75 Years and over | 5 (13.9%) | 11 (13.4%) |
| Total | 114 (19.6%) | 161 (22.2%) |
Income Above Poverty by Sex and Age in Queen City
According to the poverty statistics in Queen City, males aged 35 to 44 years and females aged 16 and 17 years are the age groups that are most secure financially, with 95.8% of males and 100.0% of females in these age groups living above the poverty line.
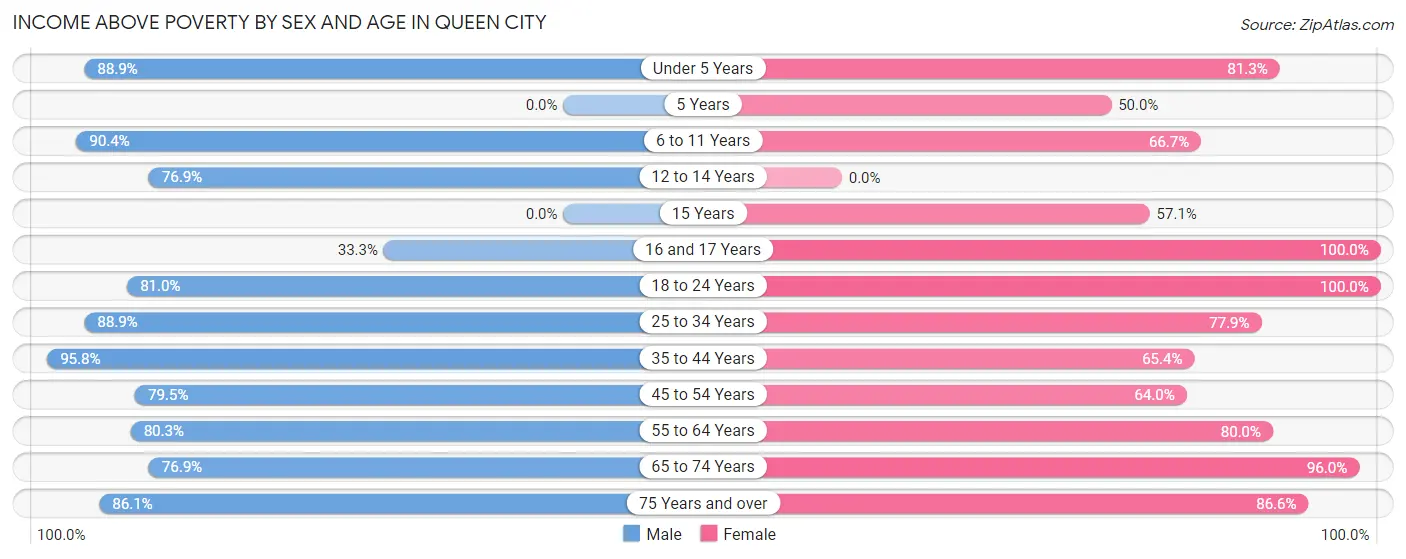
| Age Bracket | Male | Female |
| Under 5 Years | 24 (88.9%) | 13 (81.2%) |
| 5 Years | 0 (0.0%) | 4 (50.0%) |
| 6 to 11 Years | 47 (90.4%) | 36 (66.7%) |
| 12 to 14 Years | 20 (76.9%) | 0 (0.0%) |
| 15 Years | 0 (0.0%) | 4 (57.1%) |
| 16 and 17 Years | 6 (33.3%) | 8 (100.0%) |
| 18 to 24 Years | 17 (80.9%) | 65 (100.0%) |
| 25 to 34 Years | 88 (88.9%) | 95 (77.9%) |
| 35 to 44 Years | 91 (95.8%) | 87 (65.4%) |
| 45 to 54 Years | 31 (79.5%) | 48 (64.0%) |
| 55 to 64 Years | 53 (80.3%) | 60 (80.0%) |
| 65 to 74 Years | 60 (76.9%) | 72 (96.0%) |
| 75 Years and over | 31 (86.1%) | 71 (86.6%) |
| Total | 468 (80.4%) | 563 (77.8%) |
Income Below Poverty Among Married-Couple Families in Queen City
The poverty statistics for married-couple families in Queen City show that 5.1% or 11 of the total 215 families live below the poverty line. Families with 5 or more children have the highest poverty rate of 100.0%, comprising of 4 families. On the other hand, families with 3 or 4 children have the lowest poverty rate of 0.0%, which includes 0 families.
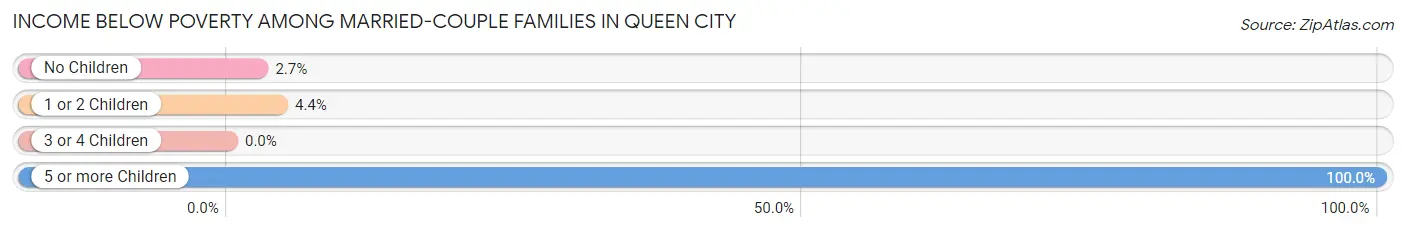
| Children | Above Poverty | Below Poverty |
| No Children | 110 (97.4%) | 3 (2.6%) |
| 1 or 2 Children | 88 (95.7%) | 4 (4.3%) |
| 3 or 4 Children | 6 (100.0%) | 0 (0.0%) |
| 5 or more Children | 0 (0.0%) | 4 (100.0%) |
| Total | 204 (94.9%) | 11 (5.1%) |
Income Below Poverty Among Single-Parent Households in Queen City
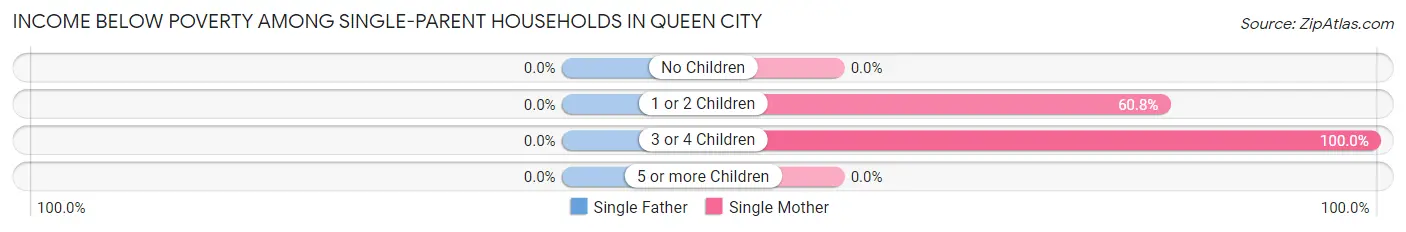
| Children | Single Father | Single Mother |
| No Children | 0 (0.0%) | 0 (0.0%) |
| 1 or 2 Children | 0 (0.0%) | 45 (60.8%) |
| 3 or 4 Children | 0 (0.0%) | 7 (100.0%) |
| 5 or more Children | 0 (0.0%) | 0 (0.0%) |
| Total | 0 (0.0%) | 52 (46.4%) |
Income Below Poverty Among Married-Couple vs Single-Parent Households in Queen City
The poverty data for Queen City shows that 11 of the married-couple family households (5.1%) and 52 of the single-parent households (41.9%) are living below the poverty level. Within the married-couple family households, those with 5 or more children have the highest poverty rate, with 4 households (100.0%) falling below the poverty line. Among the single-parent households, those with 3 or 4 children have the highest poverty rate, with 7 household (100.0%) living below poverty.
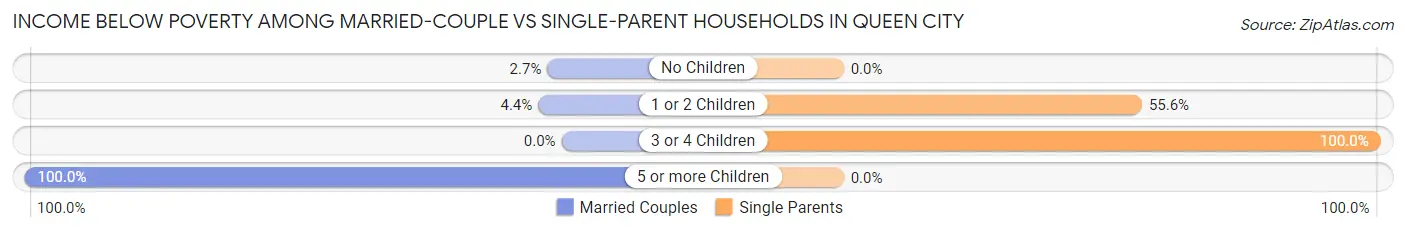
| Children | Married-Couple Families | Single-Parent Households |
| No Children | 3 (2.6%) | 0 (0.0%) |
| 1 or 2 Children | 4 (4.3%) | 45 (55.6%) |
| 3 or 4 Children | 0 (0.0%) | 7 (100.0%) |
| 5 or more Children | 4 (100.0%) | 0 (0.0%) |
| Total | 11 (5.1%) | 52 (41.9%) |
Race in Queen City
The most populous races in Queen City are White / Caucasian (1,027 | 78.6%), Black / African American (236 | 18.1%), and Asian (23 | 1.8%).
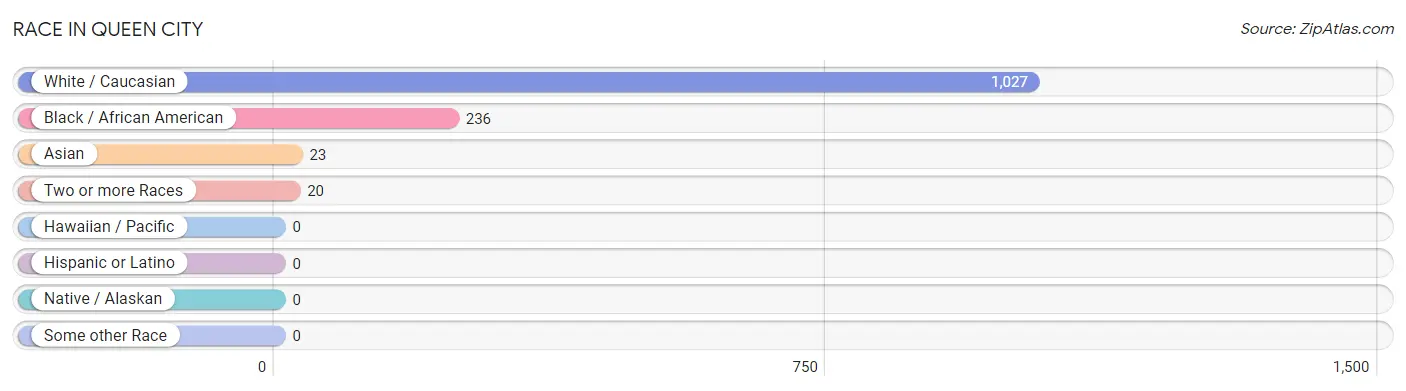
| Race | # Population | % Population |
| Asian | 23 | 1.8% |
| Black / African American | 236 | 18.1% |
| Hawaiian / Pacific | 0 | 0.0% |
| Hispanic or Latino | 0 | 0.0% |
| Native / Alaskan | 0 | 0.0% |
| White / Caucasian | 1,027 | 78.6% |
| Two or more Races | 20 | 1.5% |
| Some other Race | 0 | 0.0% |
| Total | 1,306 | 100.0% |
Ancestry in Queen City
The most populous ancestries reported in Queen City are American (491 | 37.6%), English (112 | 8.6%), German (110 | 8.4%), Irish (49 | 3.7%), and Sri Lankan (41 | 3.1%), together accounting for 61.5% of all Queen City residents.
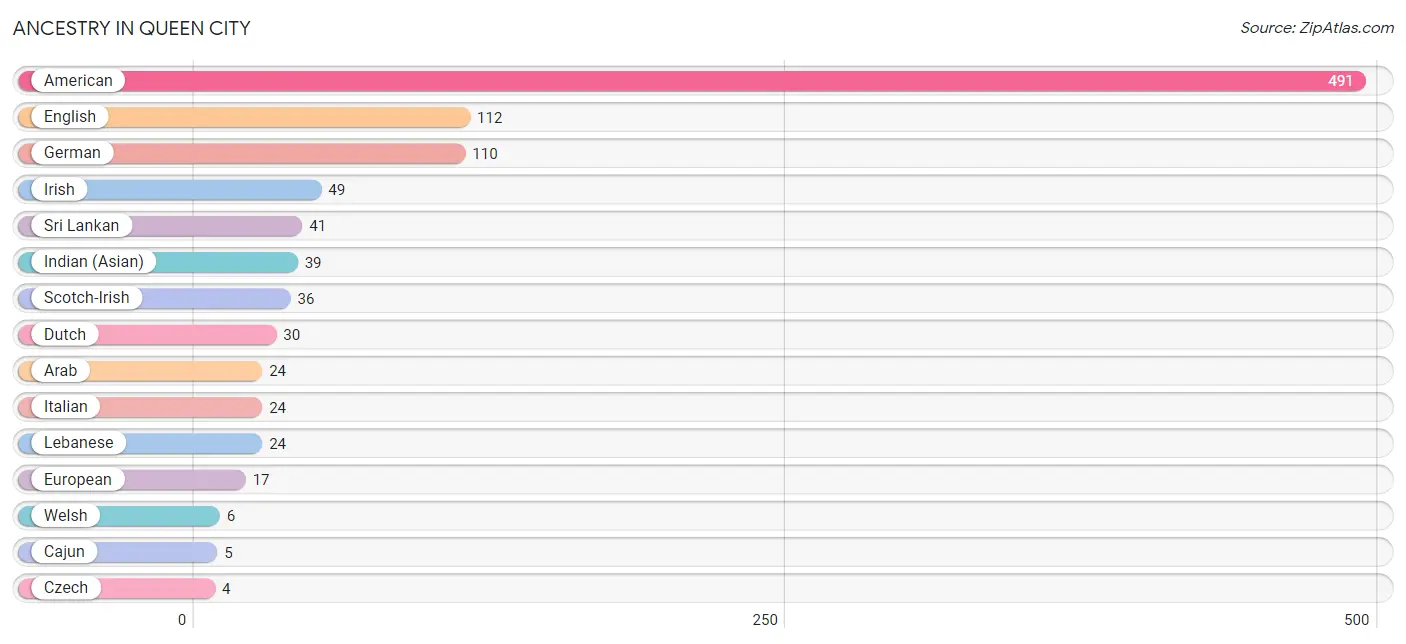
| Ancestry | # Population | % Population |
| American | 491 | 37.6% |
| Arab | 24 | 1.8% |
| Cajun | 5 | 0.4% |
| Czech | 4 | 0.3% |
| Dutch | 30 | 2.3% |
| English | 112 | 8.6% |
| European | 17 | 1.3% |
| French | 4 | 0.3% |
| German | 110 | 8.4% |
| Indian (Asian) | 39 | 3.0% |
| Irish | 49 | 3.7% |
| Italian | 24 | 1.8% |
| Lebanese | 24 | 1.8% |
| Scotch-Irish | 36 | 2.8% |
| Scottish | 4 | 0.3% |
| Sri Lankan | 41 | 3.1% |
| Welsh | 6 | 0.5% | View All 17 Rows |
Immigrants in Queen City
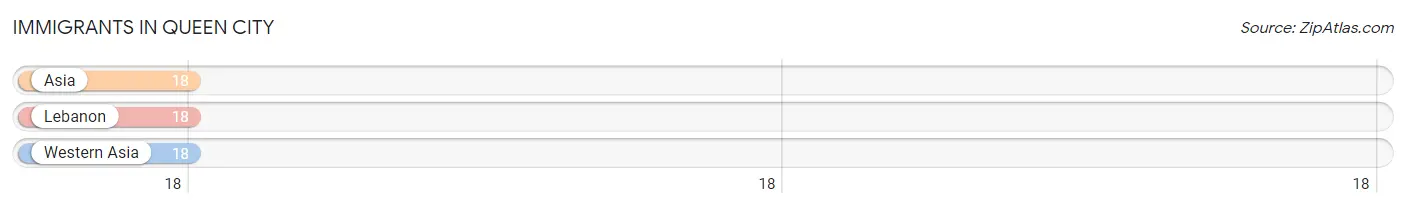
The most numerous immigrant groups reported in Queen City came from Asia (18 | 1.4%), Lebanon (18 | 1.4%), and Western Asia (18 | 1.4%), together accounting for 4.1% of all Queen City residents.
| Immigration Origin | # Population | % Population |
| Asia | 18 | 1.4% |
| Lebanon | 18 | 1.4% |
| Western Asia | 18 | 1.4% | View All 3 Rows |
Sex and Age in Queen City
Sex and Age in Queen City
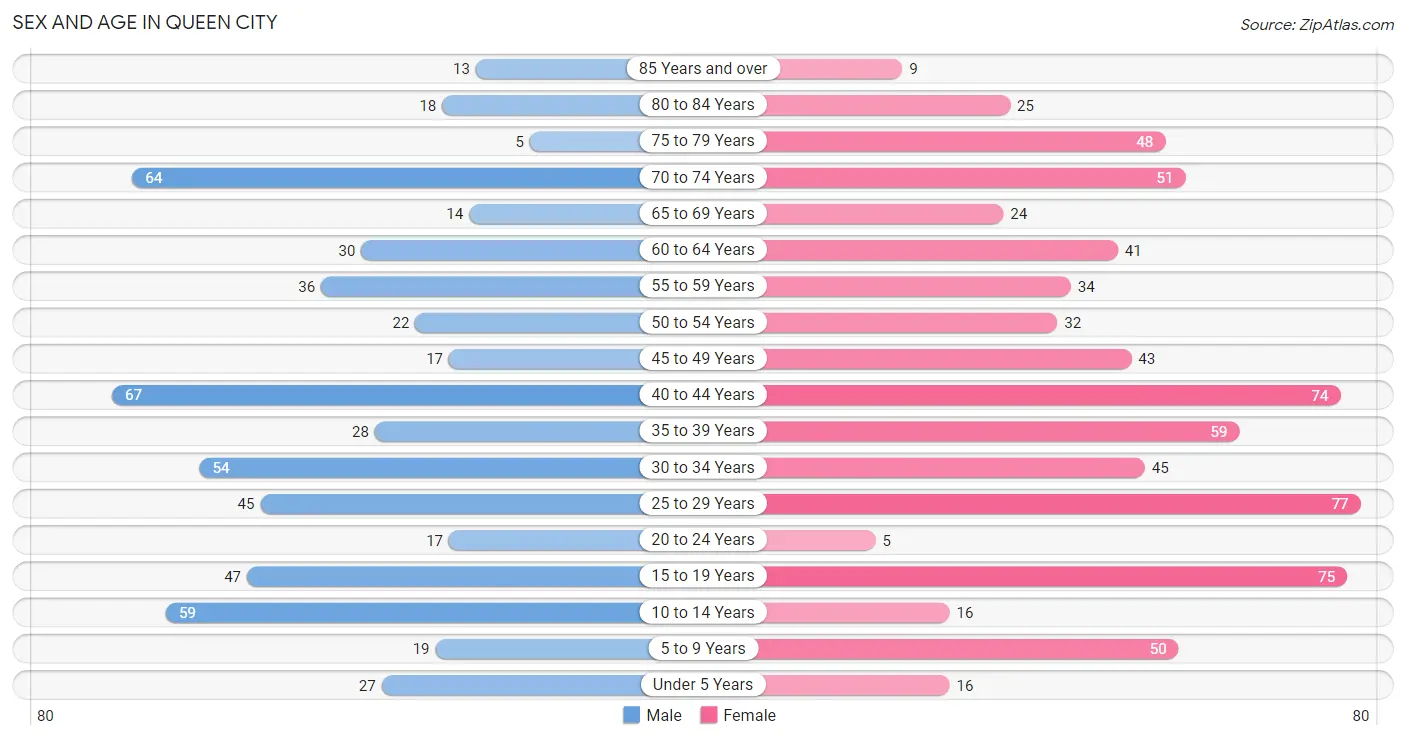
The most populous age groups in Queen City are 40 to 44 Years (67 | 11.5%) for men and 25 to 29 Years (77 | 10.6%) for women.
| Age Bracket | Male | Female |
| Under 5 Years | 27 (4.6%) | 16 (2.2%) |
| 5 to 9 Years | 19 (3.3%) | 50 (6.9%) |
| 10 to 14 Years | 59 (10.1%) | 16 (2.2%) |
| 15 to 19 Years | 47 (8.1%) | 75 (10.4%) |
| 20 to 24 Years | 17 (2.9%) | 5 (0.7%) |
| 25 to 29 Years | 45 (7.7%) | 77 (10.6%) |
| 30 to 34 Years | 54 (9.3%) | 45 (6.2%) |
| 35 to 39 Years | 28 (4.8%) | 59 (8.2%) |
| 40 to 44 Years | 67 (11.5%) | 74 (10.2%) |
| 45 to 49 Years | 17 (2.9%) | 43 (5.9%) |
| 50 to 54 Years | 22 (3.8%) | 32 (4.4%) |
| 55 to 59 Years | 36 (6.2%) | 34 (4.7%) |
| 60 to 64 Years | 30 (5.1%) | 41 (5.7%) |
| 65 to 69 Years | 14 (2.4%) | 24 (3.3%) |
| 70 to 74 Years | 64 (11.0%) | 51 (7.0%) |
| 75 to 79 Years | 5 (0.9%) | 48 (6.6%) |
| 80 to 84 Years | 18 (3.1%) | 25 (3.5%) |
| 85 Years and over | 13 (2.2%) | 9 (1.2%) |
| Total | 582 (100.0%) | 724 (100.0%) |
Families and Households in Queen City
Median Family Size in Queen City
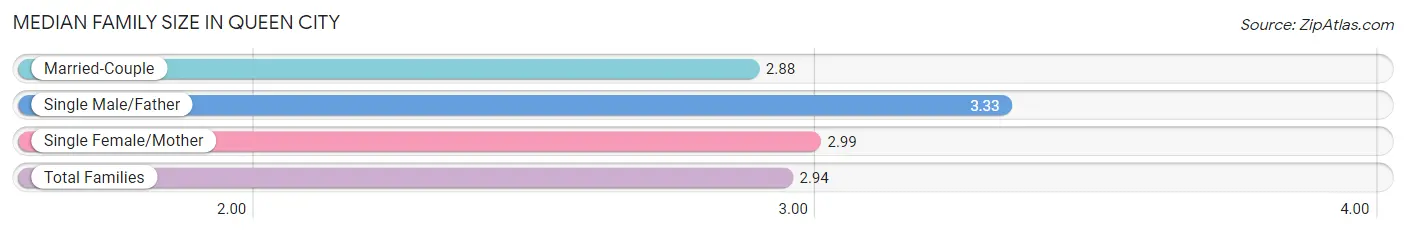
The median family size in Queen City is 2.94 persons per family, with single male/father families (12 | 3.5%) accounting for the largest median family size of 3.33 persons per family. On the other hand, married-couple families (215 | 63.4%) represent the smallest median family size with 2.88 persons per family.
| Family Type | # Families | Family Size |
| Married-Couple | 215 (63.4%) | 2.88 |
| Single Male/Father | 12 (3.5%) | 3.33 |
| Single Female/Mother | 112 (33.0%) | 2.99 |
| Total Families | 339 (100.0%) | 2.94 |
Median Household Size in Queen City
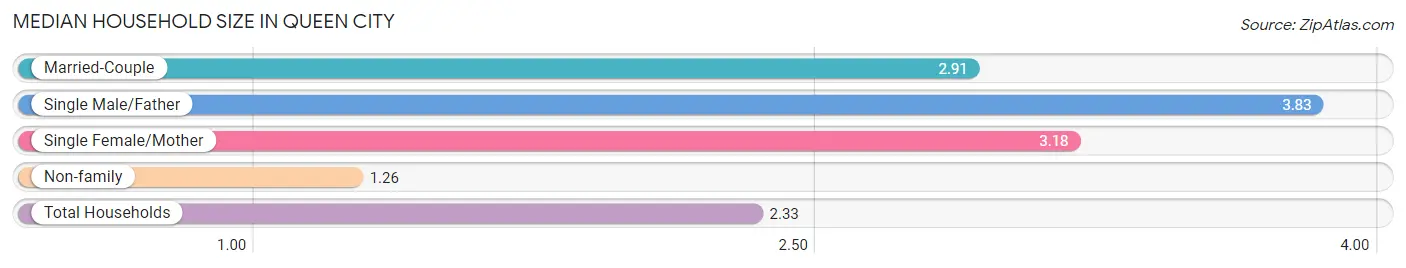
The median household size in Queen City is 2.33 persons per household, with single male/father households (12 | 2.1%) accounting for the largest median household size of 3.83 persons per household. non-family households (220 | 39.4%) represent the smallest median household size with 1.26 persons per household.
| Household Type | # Households | Household Size |
| Married-Couple | 215 (38.5%) | 2.91 |
| Single Male/Father | 12 (2.1%) | 3.83 |
| Single Female/Mother | 112 (20.0%) | 3.18 |
| Non-family | 220 (39.4%) | 1.26 |
| Total Households | 559 (100.0%) | 2.33 |
Household Size by Marriage Status in Queen City
Out of a total of 559 households in Queen City, 339 (60.6%) are family households, while 220 (39.4%) are nonfamily households. The most numerous type of family households are 2-person households, comprising 167, and the most common type of nonfamily households are 1-person households, comprising 186.
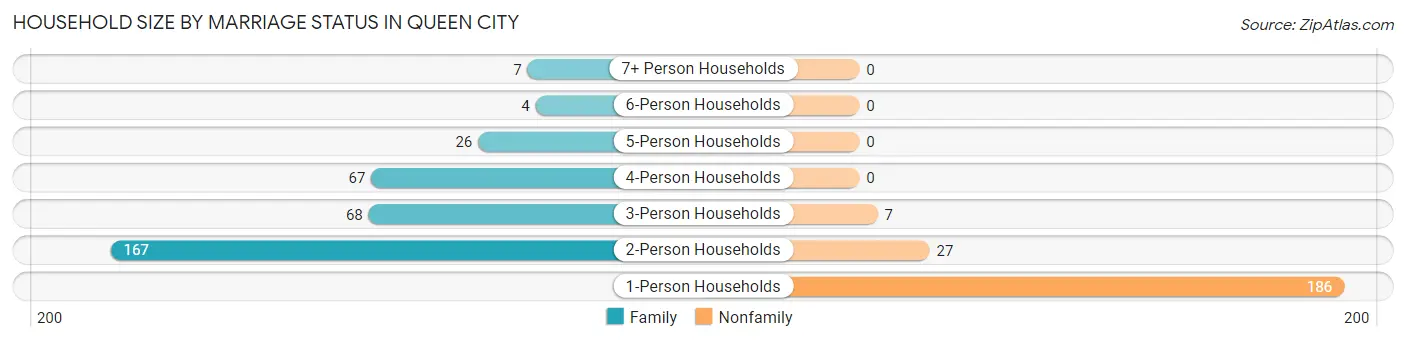
| Household Size | Family Households | Nonfamily Households |
| 1-Person Households | - | 186 (33.3%) |
| 2-Person Households | 167 (29.9%) | 27 (4.8%) |
| 3-Person Households | 68 (12.2%) | 7 (1.3%) |
| 4-Person Households | 67 (12.0%) | 0 (0.0%) |
| 5-Person Households | 26 (4.6%) | 0 (0.0%) |
| 6-Person Households | 4 (0.7%) | 0 (0.0%) |
| 7+ Person Households | 7 (1.3%) | 0 (0.0%) |
| Total | 339 (60.6%) | 220 (39.4%) |
Female Fertility in Queen City
Fertility by Age in Queen City
Average fertility rate in Queen City is 5.0 births per 1,000 women. Women in the age bracket of 20 to 34 years have the highest fertility rate with 16.0 births per 1,000 women. Women in the age bracket of 20 to 34 years acount for 100.0% of all women with births.
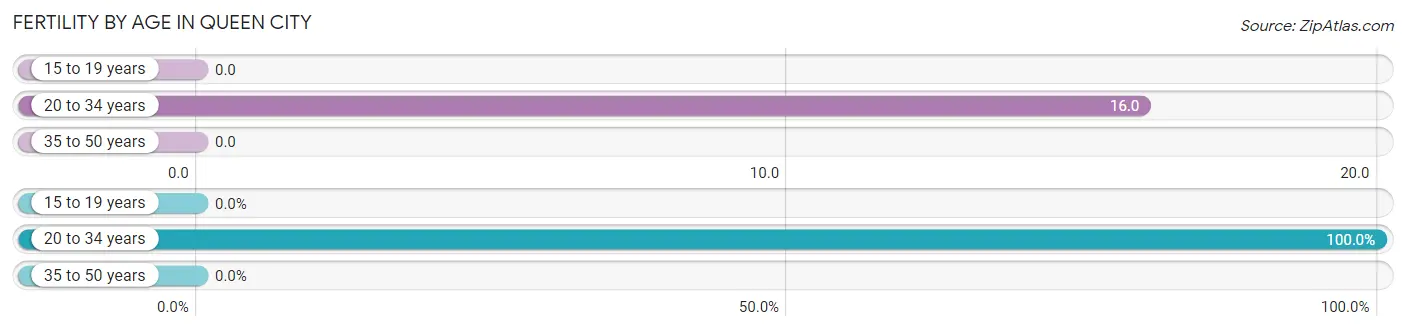
| Age Bracket | Women with Births | Births / 1,000 Women |
| 15 to 19 years | 0 (0.0%) | 0.0 |
| 20 to 34 years | 2 (100.0%) | 16.0 |
| 35 to 50 years | 0 (0.0%) | 0.0 |
| Total | 2 (100.0%) | 5.0 |
Fertility by Age by Marriage Status in Queen City
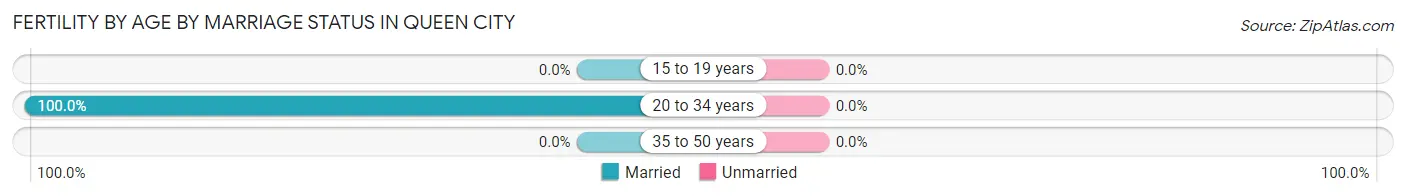
| Age Bracket | Married | Unmarried |
| 15 to 19 years | 0 (0.0%) | 0 (0.0%) |
| 20 to 34 years | 2 (100.0%) | 0 (0.0%) |
| 35 to 50 years | 0 (0.0%) | 0 (0.0%) |
| Total | 2 (100.0%) | 0 (0.0%) |
Fertility by Education in Queen City
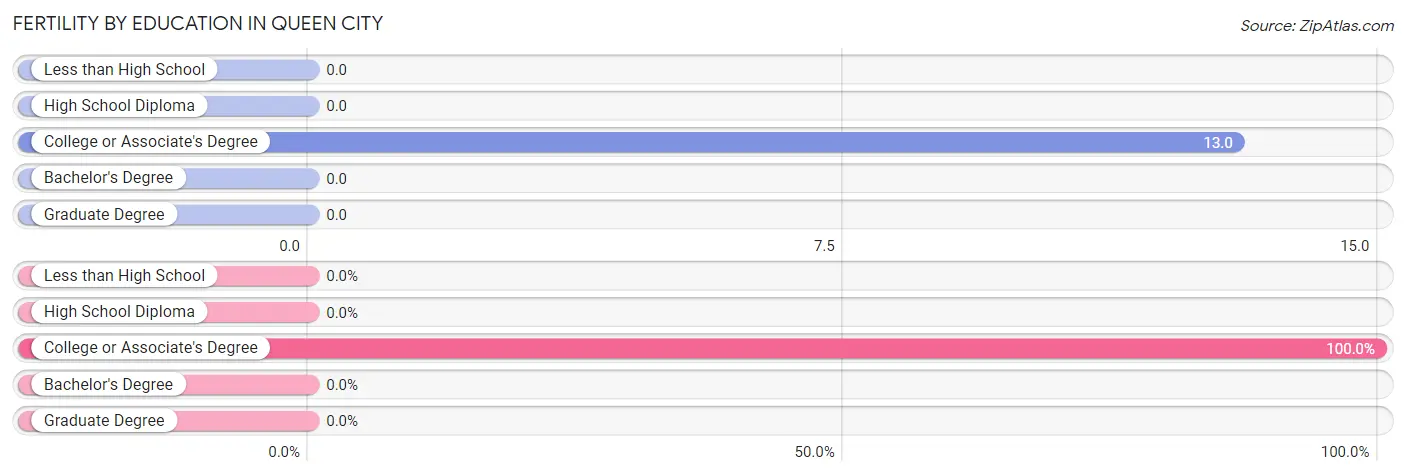
| Educational Attainment | Women with Births | Births / 1,000 Women |
| Less than High School | 0 (0.0%) | 0.0 |
| High School Diploma | 0 (0.0%) | 0.0 |
| College or Associate's Degree | 2 (100.0%) | 13.0 |
| Bachelor's Degree | 0 (0.0%) | 0.0 |
| Graduate Degree | 0 (0.0%) | 0.0 |
| Total | 2 (100.0%) | 5.0 |
Fertility by Education by Marriage Status in Queen City
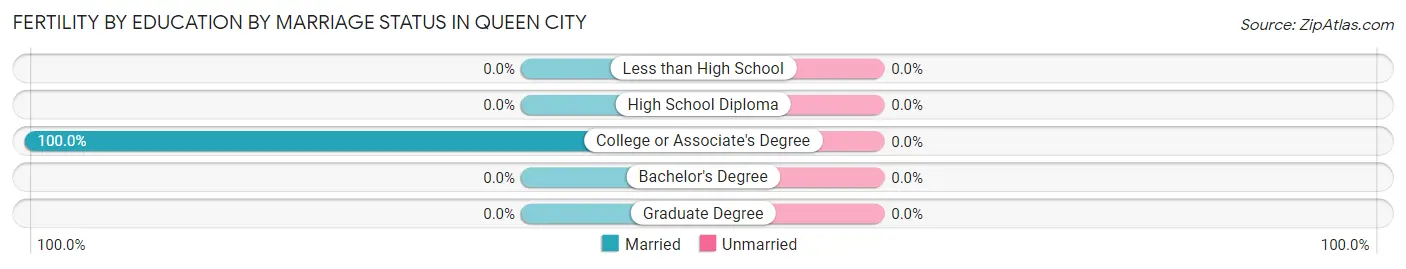
| Educational Attainment | Married | Unmarried |
| Less than High School | 0 (0.0%) | 0 (0.0%) |
| High School Diploma | 0 (0.0%) | 0 (0.0%) |
| College or Associate's Degree | 2 (100.0%) | 0 (0.0%) |
| Bachelor's Degree | 0 (0.0%) | 0 (0.0%) |
| Graduate Degree | 0 (0.0%) | 0 (0.0%) |
| Total | 2 (100.0%) | 0 (0.0%) |
Employment Characteristics in Queen City
Employment by Class of Employer in Queen City
Among the 574 employed individuals in Queen City, private company employees (448 | 78.0%), local government employees (49 | 8.5%), and not-for-profit organizations (43 | 7.5%) make up the most common classes of employment.
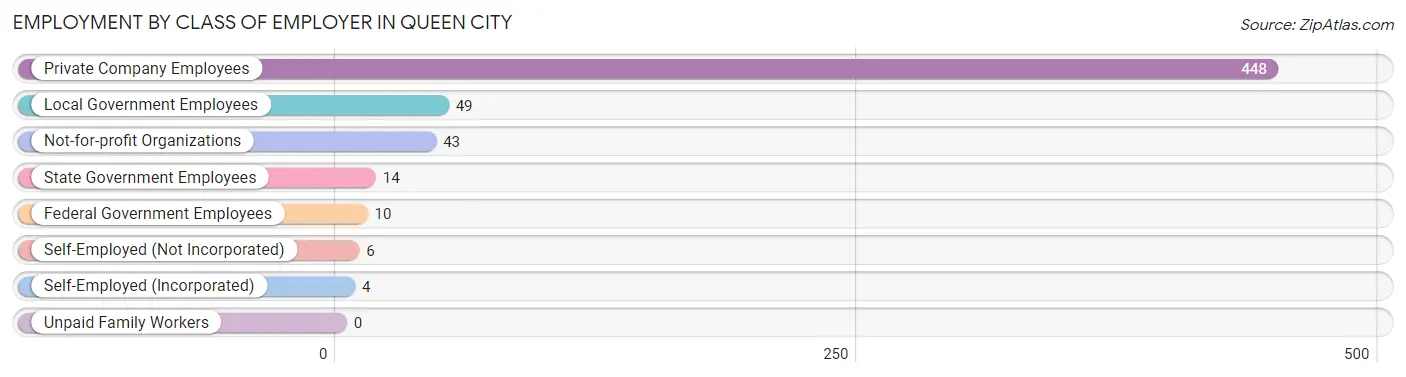
| Employer Class | # Employees | % Employees |
| Private Company Employees | 448 | 78.0% |
| Self-Employed (Incorporated) | 4 | 0.7% |
| Self-Employed (Not Incorporated) | 6 | 1.1% |
| Not-for-profit Organizations | 43 | 7.5% |
| Local Government Employees | 49 | 8.5% |
| State Government Employees | 14 | 2.4% |
| Federal Government Employees | 10 | 1.7% |
| Unpaid Family Workers | 0 | 0.0% |
| Total | 574 | 100.0% |
Employment Status by Age in Queen City
According to the labor force statistics for Queen City, out of the total population over 16 years of age (1,087), 55.7% or 605 individuals are in the labor force, with 3.1% or 19 of them unemployed. The age group with the highest labor force participation rate is 20 to 24 years, with 100.0% or 22 individuals in the labor force. Within the labor force, the 25 to 29 years age range has the highest percentage of unemployed individuals, with 13.7% or 10 of them being unemployed.
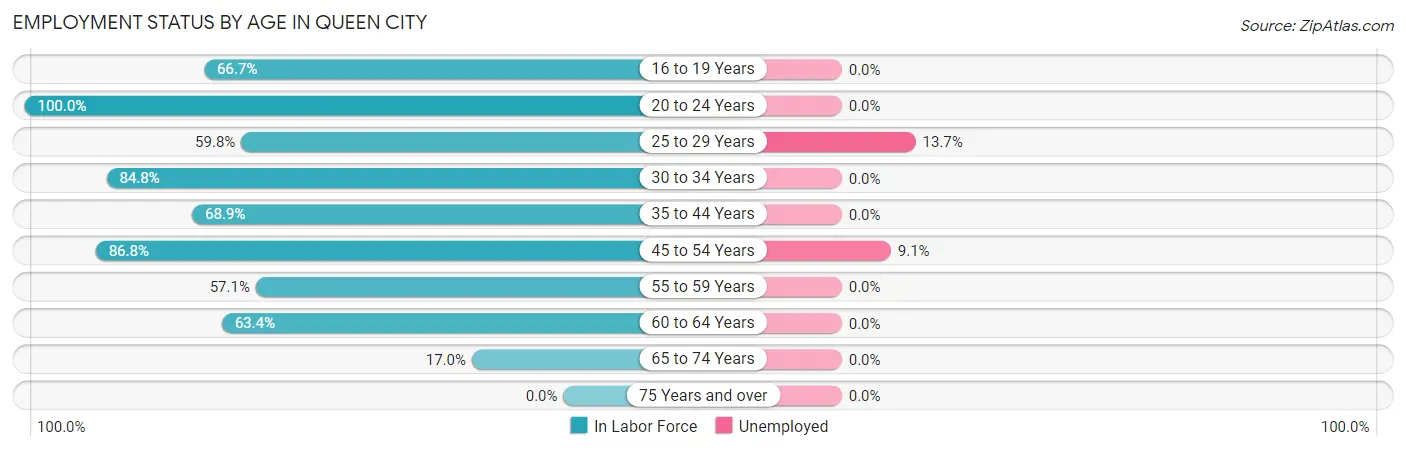
| Age Bracket | In Labor Force | Unemployed |
| 16 to 19 Years | 60 (66.7%) | 0 (0.0%) |
| 20 to 24 Years | 22 (100.0%) | 0 (0.0%) |
| 25 to 29 Years | 73 (59.8%) | 10 (13.7%) |
| 30 to 34 Years | 84 (84.8%) | 0 (0.0%) |
| 35 to 44 Years | 157 (68.9%) | 0 (0.0%) |
| 45 to 54 Years | 99 (86.8%) | 9 (9.1%) |
| 55 to 59 Years | 40 (57.1%) | 0 (0.0%) |
| 60 to 64 Years | 45 (63.4%) | 0 (0.0%) |
| 65 to 74 Years | 26 (17.0%) | 0 (0.0%) |
| 75 Years and over | 0 (0.0%) | 0 (0.0%) |
| Total | 605 (55.7%) | 19 (3.1%) |
Employment Status by Educational Attainment in Queen City
According to labor force statistics for Queen City, 70.7% of individuals (498) out of the total population between 25 and 64 years of age (704) are in the labor force, with 3.8% or 19 of them being unemployed. The group with the highest labor force participation rate are those with the educational attainment of college / associate degree, with 90.5% or 172 individuals in the labor force. Within the labor force, individuals with high school diploma education have the highest percentage of unemployment, with 8.4% or 19 of them being unemployed.
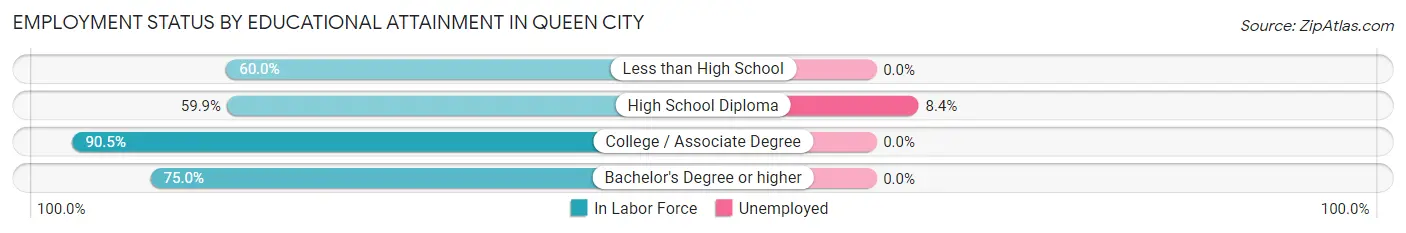
| Educational Attainment | In Labor Force | Unemployed |
| Less than High School | 9 (60.0%) | 0 (0.0%) |
| High School Diploma | 227 (59.9%) | 32 (8.4%) |
| College / Associate Degree | 172 (90.5%) | 0 (0.0%) |
| Bachelor's Degree or higher | 90 (75.0%) | 0 (0.0%) |
| Total | 498 (70.7%) | 27 (3.8%) |
Employment Occupations by Sex in Queen City
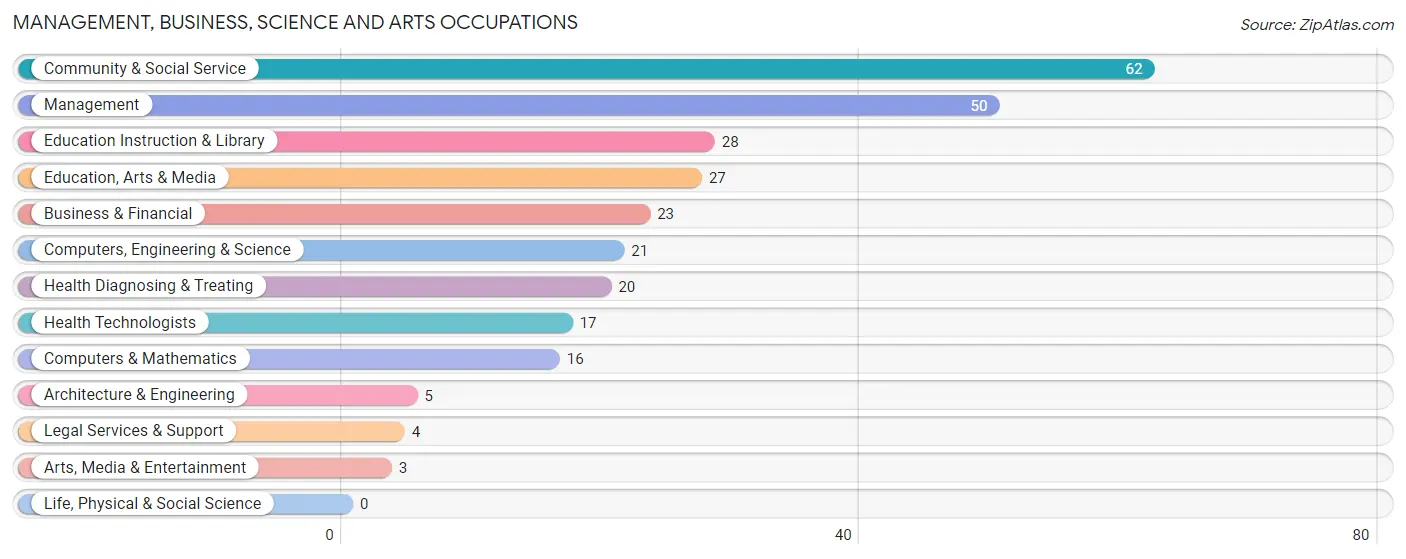
Management, Business, Science and Arts Occupations
The most common Management, Business, Science and Arts occupations in Queen City are Community & Social Service (62 | 10.6%), Management (50 | 8.5%), Education Instruction & Library (28 | 4.8%), Education, Arts & Media (27 | 4.6%), and Business & Financial (23 | 3.9%).
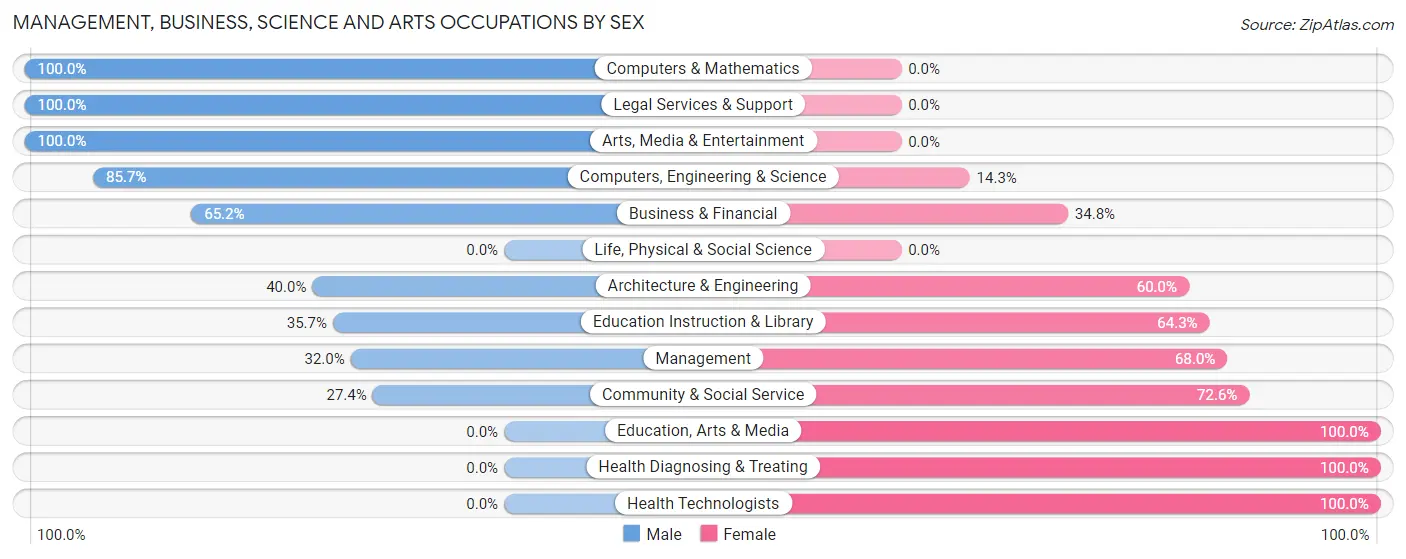
Management, Business, Science and Arts Occupations by Sex
Within the Management, Business, Science and Arts occupations in Queen City, the most male-oriented occupations are Computers & Mathematics (100.0%), Legal Services & Support (100.0%), and Arts, Media & Entertainment (100.0%), while the most female-oriented occupations are Education, Arts & Media (100.0%), Health Diagnosing & Treating (100.0%), and Health Technologists (100.0%).
| Occupation | Male | Female |
| Management | 16 (32.0%) | 34 (68.0%) |
| Business & Financial | 15 (65.2%) | 8 (34.8%) |
| Computers, Engineering & Science | 18 (85.7%) | 3 (14.3%) |
| Computers & Mathematics | 16 (100.0%) | 0 (0.0%) |
| Architecture & Engineering | 2 (40.0%) | 3 (60.0%) |
| Life, Physical & Social Science | 0 (0.0%) | 0 (0.0%) |
| Community & Social Service | 17 (27.4%) | 45 (72.6%) |
| Education, Arts & Media | 0 (0.0%) | 27 (100.0%) |
| Legal Services & Support | 4 (100.0%) | 0 (0.0%) |
| Education Instruction & Library | 10 (35.7%) | 18 (64.3%) |
| Arts, Media & Entertainment | 3 (100.0%) | 0 (0.0%) |
| Health Diagnosing & Treating | 0 (0.0%) | 20 (100.0%) |
| Health Technologists | 0 (0.0%) | 17 (100.0%) |
| Total (Category) | 66 (37.5%) | 110 (62.5%) |
| Total (Overall) | 250 (42.6%) | 337 (57.4%) |
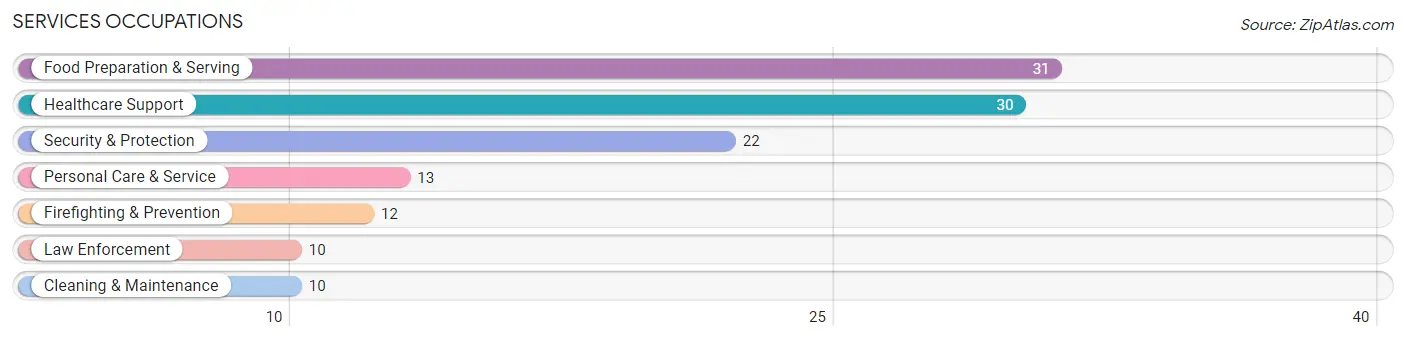
Services Occupations
The most common Services occupations in Queen City are Food Preparation & Serving (31 | 5.3%), Healthcare Support (30 | 5.1%), Security & Protection (22 | 3.7%), Personal Care & Service (13 | 2.2%), and Firefighting & Prevention (12 | 2.0%).
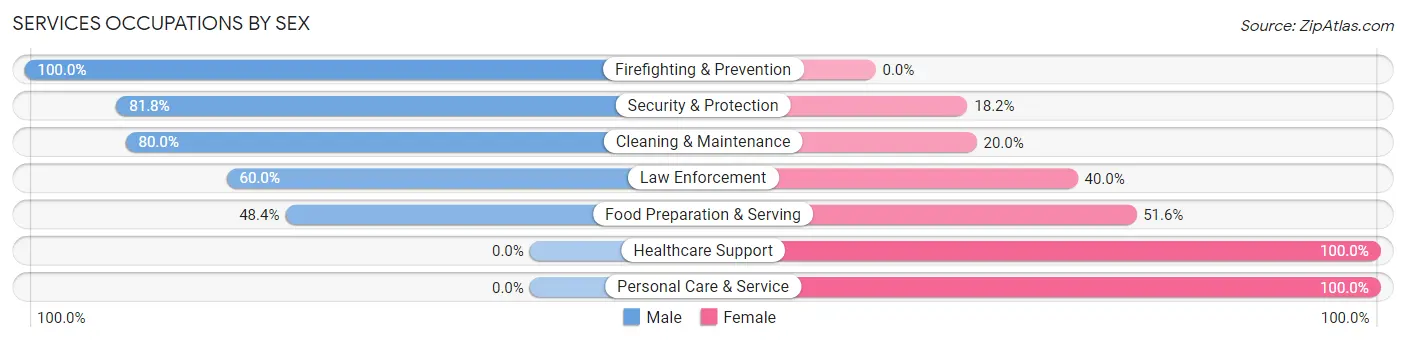
Services Occupations by Sex
Within the Services occupations in Queen City, the most male-oriented occupations are Firefighting & Prevention (100.0%), Security & Protection (81.8%), and Cleaning & Maintenance (80.0%), while the most female-oriented occupations are Healthcare Support (100.0%), Personal Care & Service (100.0%), and Food Preparation & Serving (51.6%).
| Occupation | Male | Female |
| Healthcare Support | 0 (0.0%) | 30 (100.0%) |
| Security & Protection | 18 (81.8%) | 4 (18.2%) |
| Firefighting & Prevention | 12 (100.0%) | 0 (0.0%) |
| Law Enforcement | 6 (60.0%) | 4 (40.0%) |
| Food Preparation & Serving | 15 (48.4%) | 16 (51.6%) |
| Cleaning & Maintenance | 8 (80.0%) | 2 (20.0%) |
| Personal Care & Service | 0 (0.0%) | 13 (100.0%) |
| Total (Category) | 41 (38.7%) | 65 (61.3%) |
| Total (Overall) | 250 (42.6%) | 337 (57.4%) |
Sales and Office Occupations
The most common Sales and Office occupations in Queen City are Sales & Related (52 | 8.9%), and Office & Administration (48 | 8.2%).
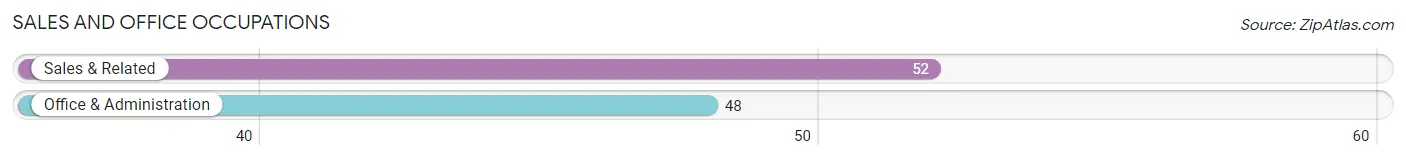
Sales and Office Occupations by Sex
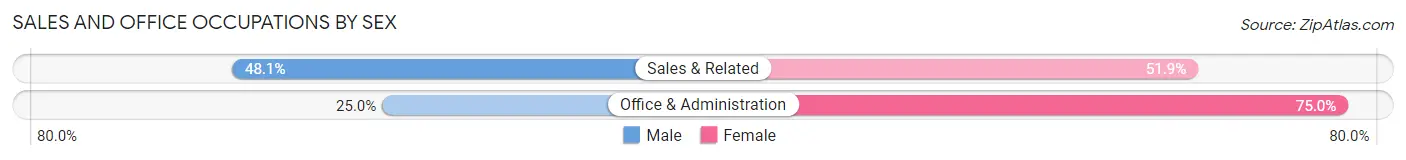
| Occupation | Male | Female |
| Sales & Related | 25 (48.1%) | 27 (51.9%) |
| Office & Administration | 12 (25.0%) | 36 (75.0%) |
| Total (Category) | 37 (37.0%) | 63 (63.0%) |
| Total (Overall) | 250 (42.6%) | 337 (57.4%) |
Natural Resources, Construction and Maintenance Occupations
The most common Natural Resources, Construction and Maintenance occupations in Queen City are Construction & Extraction (40 | 6.8%), and Installation, Maintenance & Repair (12 | 2.0%).
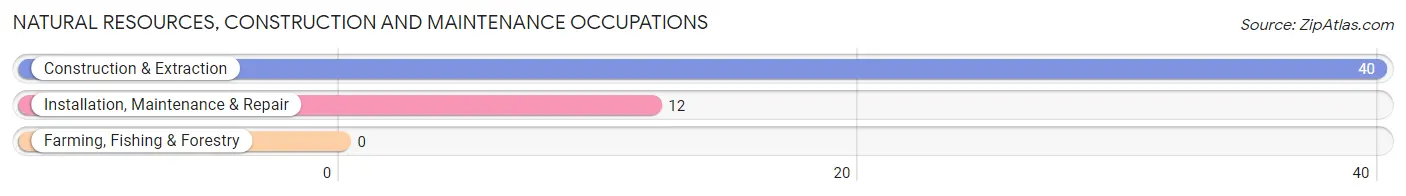
Natural Resources, Construction and Maintenance Occupations by Sex
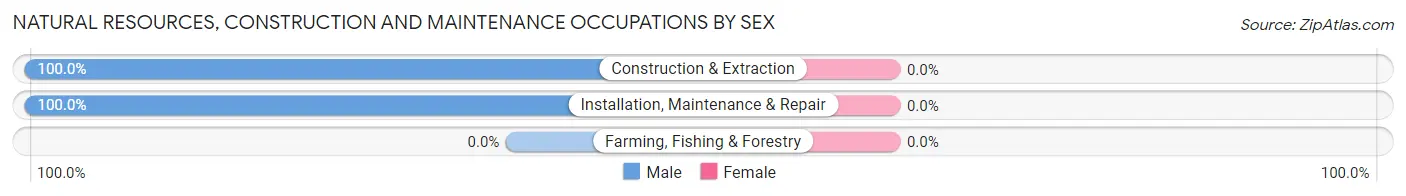
| Occupation | Male | Female |
| Farming, Fishing & Forestry | 0 (0.0%) | 0 (0.0%) |
| Construction & Extraction | 40 (100.0%) | 0 (0.0%) |
| Installation, Maintenance & Repair | 12 (100.0%) | 0 (0.0%) |
| Total (Category) | 52 (100.0%) | 0 (0.0%) |
| Total (Overall) | 250 (42.6%) | 337 (57.4%) |
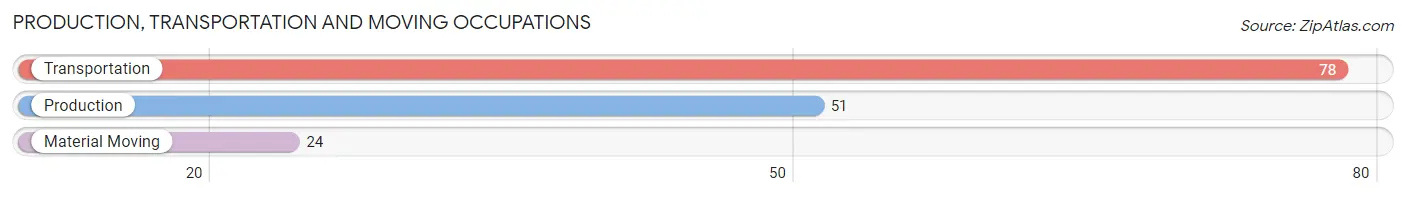
Production, Transportation and Moving Occupations
The most common Production, Transportation and Moving occupations in Queen City are Transportation (78 | 13.3%), Production (51 | 8.7%), and Material Moving (24 | 4.1%).
Production, Transportation and Moving Occupations by Sex
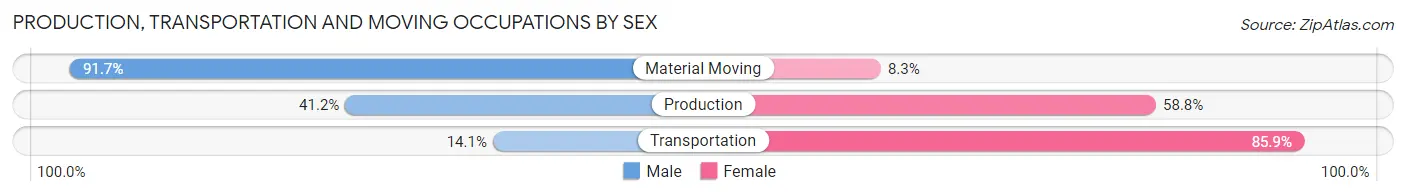
| Occupation | Male | Female |
| Production | 21 (41.2%) | 30 (58.8%) |
| Transportation | 11 (14.1%) | 67 (85.9%) |
| Material Moving | 22 (91.7%) | 2 (8.3%) |
| Total (Category) | 54 (35.3%) | 99 (64.7%) |
| Total (Overall) | 250 (42.6%) | 337 (57.4%) |
Employment Industries by Sex in Queen City
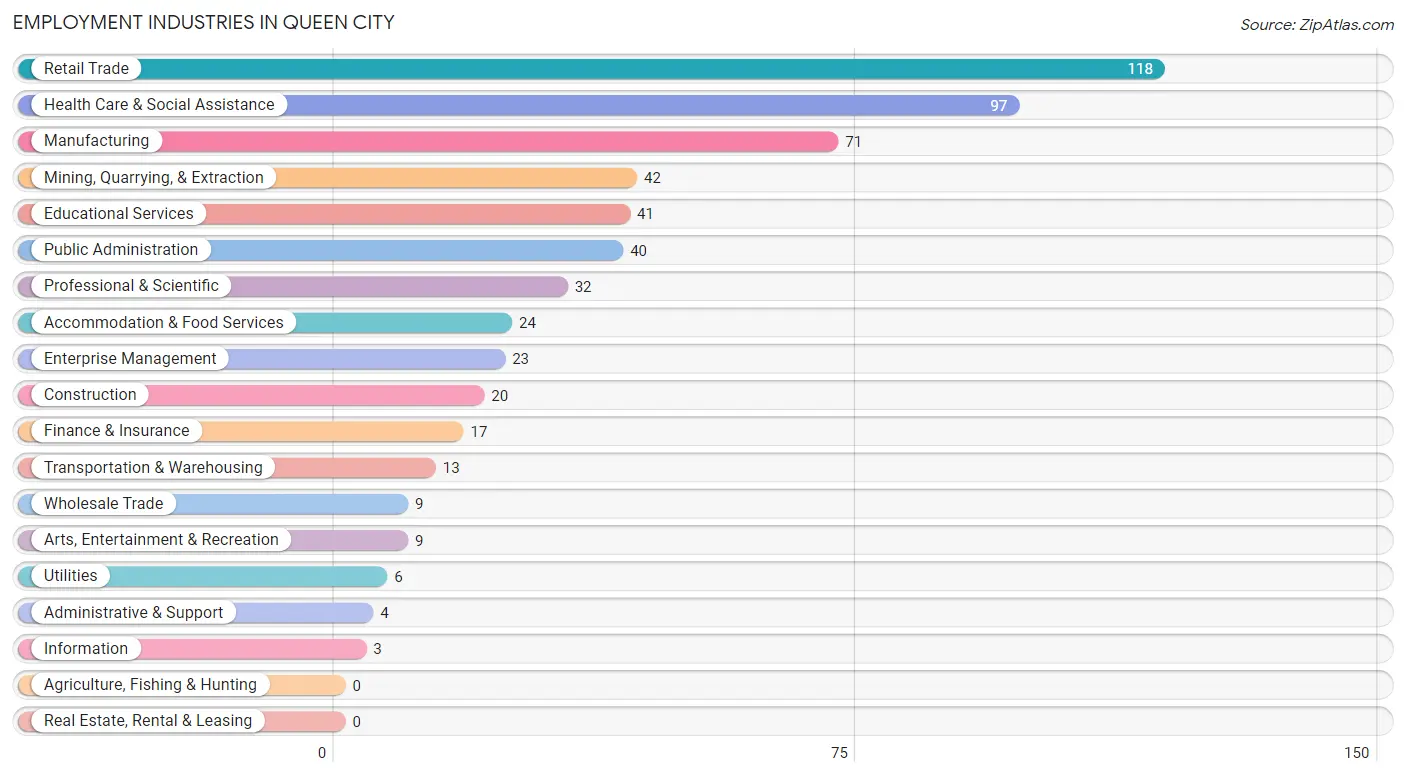
Employment Industries in Queen City
The major employment industries in Queen City include Retail Trade (118 | 20.1%), Health Care & Social Assistance (97 | 16.5%), Manufacturing (71 | 12.1%), Mining, Quarrying, & Extraction (42 | 7.2%), and Educational Services (41 | 7.0%).
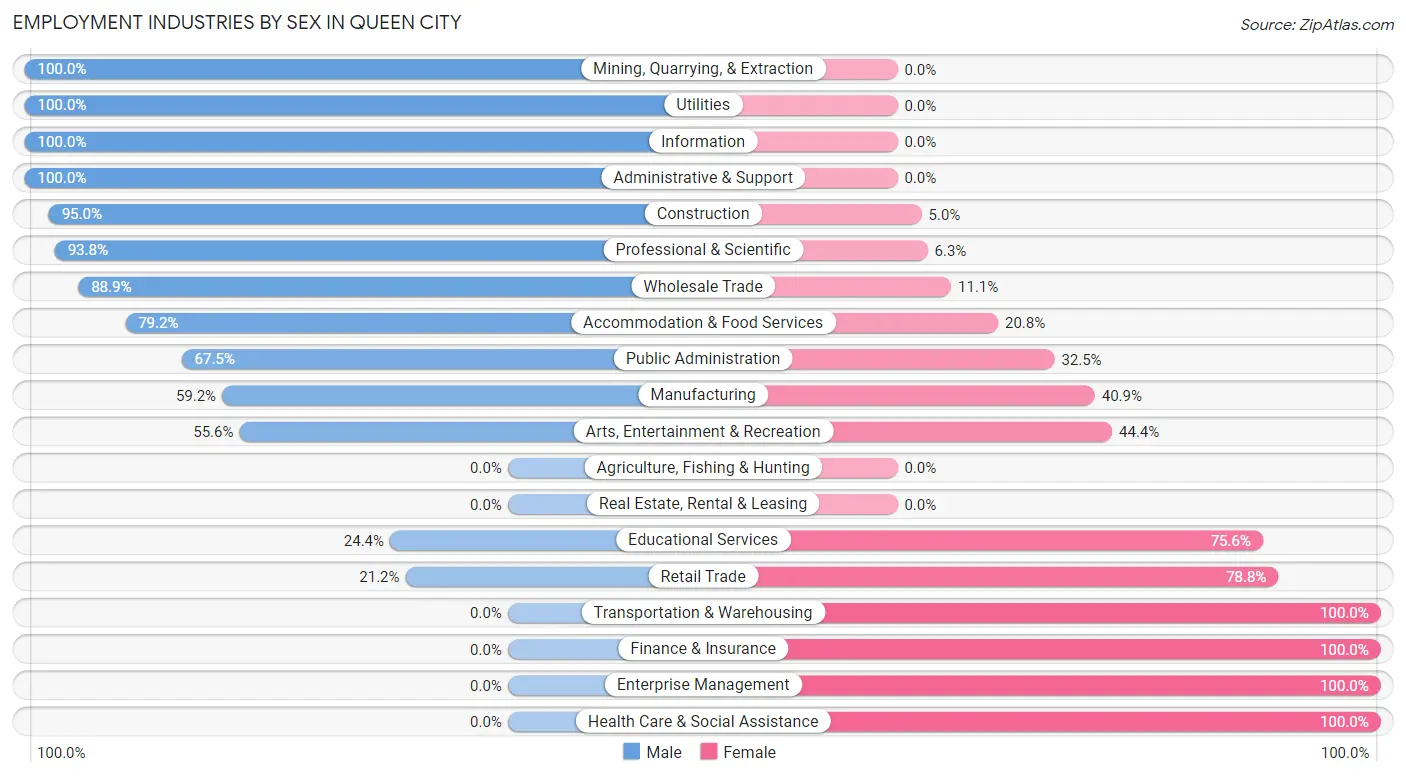
Employment Industries by Sex in Queen City
The Queen City industries that see more men than women are Mining, Quarrying, & Extraction (100.0%), Utilities (100.0%), and Information (100.0%), whereas the industries that tend to have a higher number of women are Transportation & Warehousing (100.0%), Finance & Insurance (100.0%), and Enterprise Management (100.0%).
| Industry | Male | Female |
| Agriculture, Fishing & Hunting | 0 (0.0%) | 0 (0.0%) |
| Mining, Quarrying, & Extraction | 42 (100.0%) | 0 (0.0%) |
| Construction | 19 (95.0%) | 1 (5.0%) |
| Manufacturing | 42 (59.2%) | 29 (40.8%) |
| Wholesale Trade | 8 (88.9%) | 1 (11.1%) |
| Retail Trade | 25 (21.2%) | 93 (78.8%) |
| Transportation & Warehousing | 0 (0.0%) | 13 (100.0%) |
| Utilities | 6 (100.0%) | 0 (0.0%) |
| Information | 3 (100.0%) | 0 (0.0%) |
| Finance & Insurance | 0 (0.0%) | 17 (100.0%) |
| Real Estate, Rental & Leasing | 0 (0.0%) | 0 (0.0%) |
| Professional & Scientific | 30 (93.8%) | 2 (6.2%) |
| Enterprise Management | 0 (0.0%) | 23 (100.0%) |
| Administrative & Support | 4 (100.0%) | 0 (0.0%) |
| Educational Services | 10 (24.4%) | 31 (75.6%) |
| Health Care & Social Assistance | 0 (0.0%) | 97 (100.0%) |
| Arts, Entertainment & Recreation | 5 (55.6%) | 4 (44.4%) |
| Accommodation & Food Services | 19 (79.2%) | 5 (20.8%) |
| Public Administration | 27 (67.5%) | 13 (32.5%) |
| Total | 250 (42.6%) | 337 (57.4%) |
Education in Queen City
School Enrollment in Queen City
The most common levels of schooling among the 299 students in Queen City are college / undergraduate (84 | 28.1%), middle school (73 | 24.4%), and elementary school (62 | 20.7%).
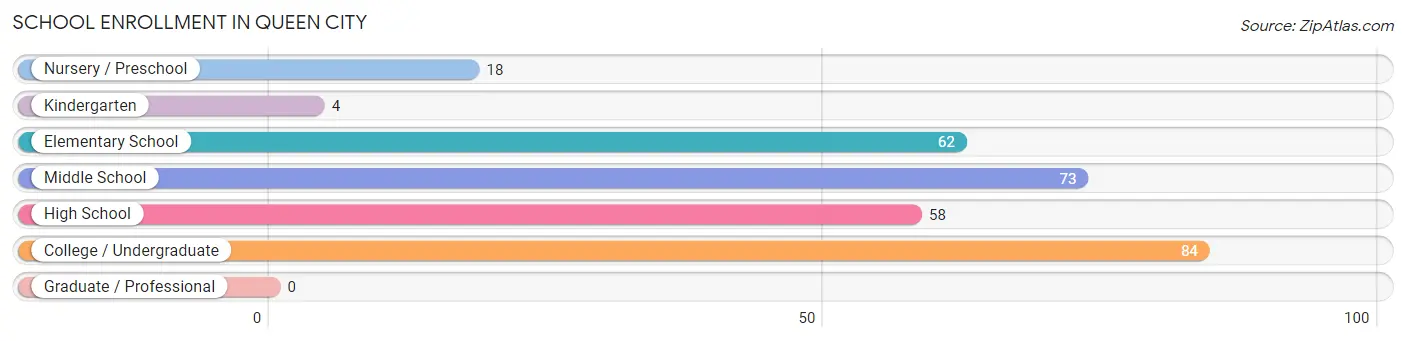
| School Level | # Students | % Students |
| Nursery / Preschool | 18 | 6.0% |
| Kindergarten | 4 | 1.3% |
| Elementary School | 62 | 20.7% |
| Middle School | 73 | 24.4% |
| High School | 58 | 19.4% |
| College / Undergraduate | 84 | 28.1% |
| Graduate / Professional | 0 | 0.0% |
| Total | 299 | 100.0% |
School Enrollment by Age by Funding Source in Queen City
Out of a total of 299 students who are enrolled in schools in Queen City, 66 (22.1%) attend a private institution, while the remaining 233 (77.9%) are enrolled in public schools. The age group of 35 years and over has the highest likelihood of being enrolled in private schools, with 6 (100.0% in the age bracket) enrolled. Conversely, the age group of 3 to 4 year olds has the lowest likelihood of being enrolled in a private school, with 10 (100.0% in the age bracket) attending a public institution.
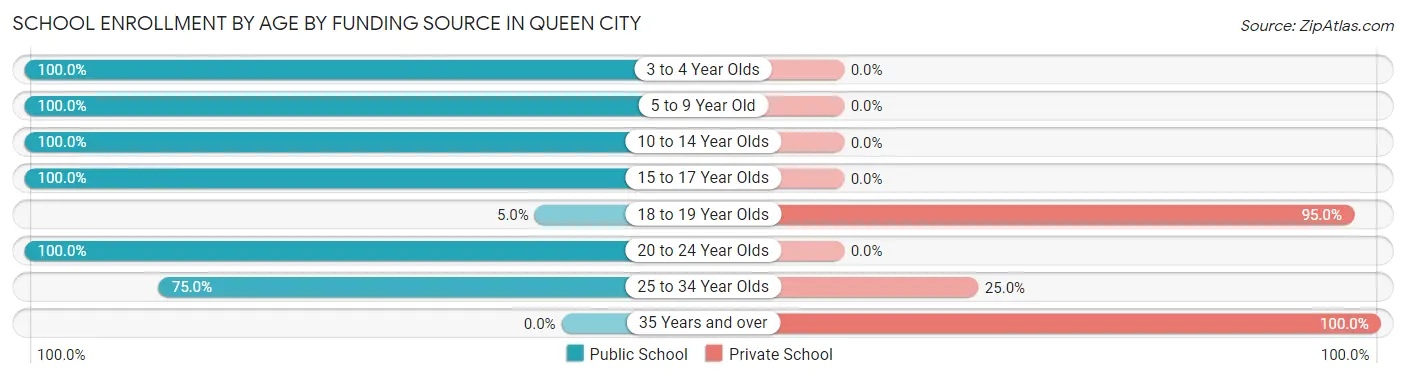
| Age Bracket | Public School | Private School |
| 3 to 4 Year Olds | 10 (100.0%) | 0 (0.0%) |
| 5 to 9 Year Old | 69 (100.0%) | 0 (0.0%) |
| 10 to 14 Year Olds | 75 (100.0%) | 0 (0.0%) |
| 15 to 17 Year Olds | 58 (100.0%) | 0 (0.0%) |
| 18 to 19 Year Olds | 3 (5.0%) | 57 (95.0%) |
| 20 to 24 Year Olds | 9 (100.0%) | 0 (0.0%) |
| 25 to 34 Year Olds | 9 (75.0%) | 3 (25.0%) |
| 35 Years and over | 0 (0.0%) | 6 (100.0%) |
| Total | 233 (77.9%) | 66 (22.1%) |
Educational Attainment by Field of Study in Queen City
Business (37 | 22.8%), engineering (23 | 14.2%), education (23 | 14.2%), liberal arts & history (17 | 10.5%), and computers & mathematics (16 | 9.9%) are the most common fields of study among 162 individuals in Queen City who have obtained a bachelor's degree or higher.
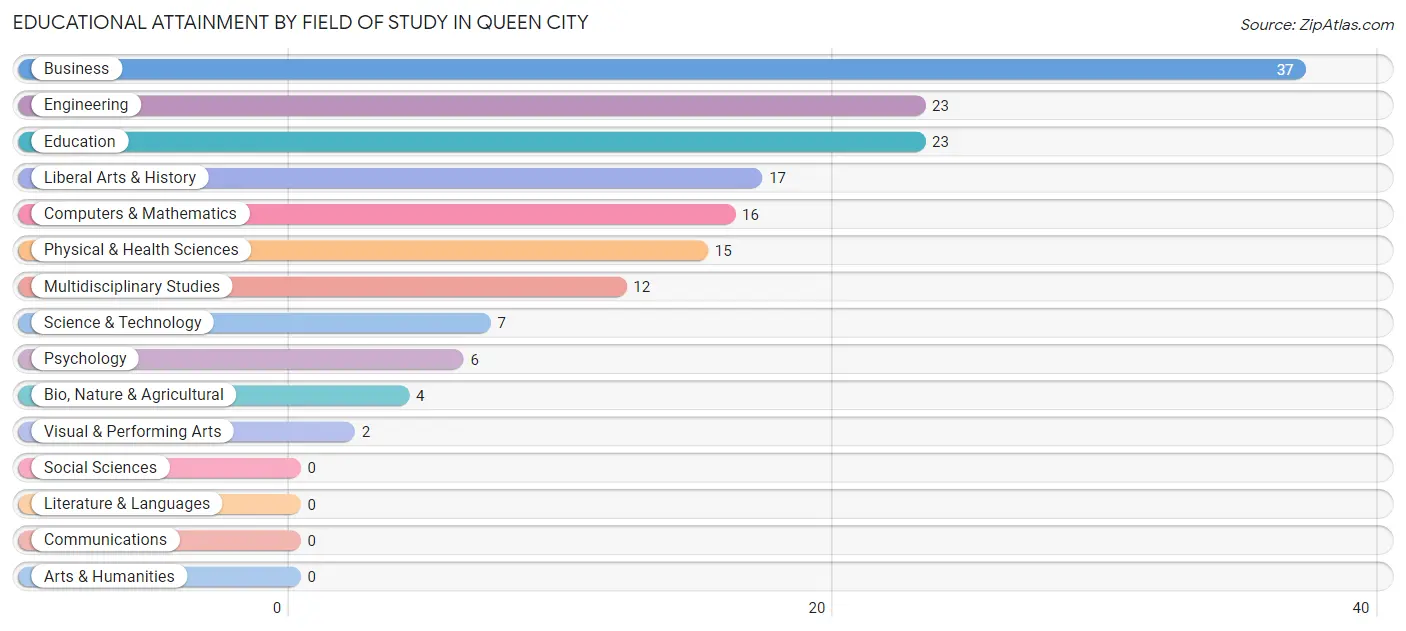
| Field of Study | # Graduates | % Graduates |
| Computers & Mathematics | 16 | 9.9% |
| Bio, Nature & Agricultural | 4 | 2.5% |
| Physical & Health Sciences | 15 | 9.3% |
| Psychology | 6 | 3.7% |
| Social Sciences | 0 | 0.0% |
| Engineering | 23 | 14.2% |
| Multidisciplinary Studies | 12 | 7.4% |
| Science & Technology | 7 | 4.3% |
| Business | 37 | 22.8% |
| Education | 23 | 14.2% |
| Literature & Languages | 0 | 0.0% |
| Liberal Arts & History | 17 | 10.5% |
| Visual & Performing Arts | 2 | 1.2% |
| Communications | 0 | 0.0% |
| Arts & Humanities | 0 | 0.0% |
| Total | 162 | 100.0% |
Transportation & Commute in Queen City
Vehicle Availability by Sex in Queen City
The most prevalent vehicle ownership categories in Queen City are males with 2 vehicles (150, accounting for 61.0%) and females with 2 vehicles (225, making up 45.9%).
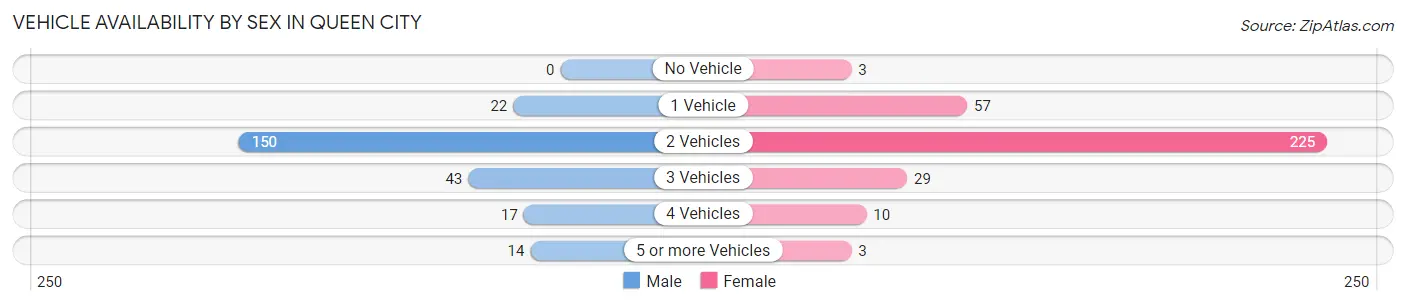
| Vehicles Available | Male | Female |
| No Vehicle | 0 (0.0%) | 3 (0.9%) |
| 1 Vehicle | 22 (8.9%) | 57 (17.4%) |
| 2 Vehicles | 150 (61.0%) | 225 (68.8%) |
| 3 Vehicles | 43 (17.5%) | 29 (8.9%) |
| 4 Vehicles | 17 (6.9%) | 10 (3.1%) |
| 5 or more Vehicles | 14 (5.7%) | 3 (0.9%) |
| Total | 246 (100.0%) | 327 (100.0%) |
Commute Time in Queen City
The most frequently occuring commute durations in Queen City are 5 to 9 minutes (196 commuters, 34.2%), 10 to 14 minutes (150 commuters, 26.2%), and 30 to 34 minutes (78 commuters, 13.6%).

| Commute Time | # Commuters | % Commuters |
| Less than 5 Minutes | 3 | 0.5% |
| 5 to 9 Minutes | 196 | 34.2% |
| 10 to 14 Minutes | 150 | 26.2% |
| 15 to 19 Minutes | 13 | 2.3% |
| 20 to 24 Minutes | 50 | 8.7% |
| 25 to 29 Minutes | 42 | 7.3% |
| 30 to 34 Minutes | 78 | 13.6% |
| 35 to 39 Minutes | 9 | 1.6% |
| 40 to 44 Minutes | 18 | 3.1% |
| 45 to 59 Minutes | 7 | 1.2% |
| 60 to 89 Minutes | 7 | 1.2% |
| 90 or more Minutes | 0 | 0.0% |
Commute Time by Sex in Queen City
The most common commute times in Queen City are 30 to 34 minutes (54 commuters, 22.0%) for males and 5 to 9 minutes (143 commuters, 43.7%) for females.
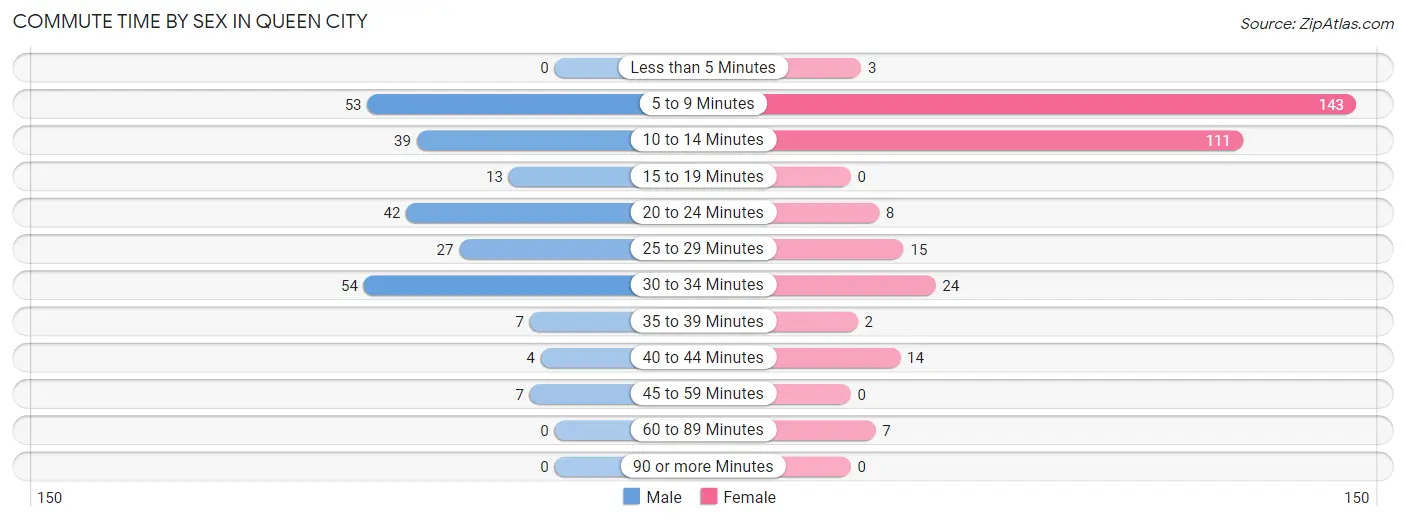
| Commute Time | Male | Female |
| Less than 5 Minutes | 0 (0.0%) | 3 (0.9%) |
| 5 to 9 Minutes | 53 (21.5%) | 143 (43.7%) |
| 10 to 14 Minutes | 39 (15.9%) | 111 (33.9%) |
| 15 to 19 Minutes | 13 (5.3%) | 0 (0.0%) |
| 20 to 24 Minutes | 42 (17.1%) | 8 (2.5%) |
| 25 to 29 Minutes | 27 (11.0%) | 15 (4.6%) |
| 30 to 34 Minutes | 54 (22.0%) | 24 (7.3%) |
| 35 to 39 Minutes | 7 (2.9%) | 2 (0.6%) |
| 40 to 44 Minutes | 4 (1.6%) | 14 (4.3%) |
| 45 to 59 Minutes | 7 (2.9%) | 0 (0.0%) |
| 60 to 89 Minutes | 0 (0.0%) | 7 (2.1%) |
| 90 or more Minutes | 0 (0.0%) | 0 (0.0%) |
Time of Departure to Work by Sex in Queen City
The most frequent times of departure to work in Queen City are 6:30 AM to 6:59 AM (51, 20.7%) for males and 7:00 AM to 7:29 AM (117, 35.8%) for females.
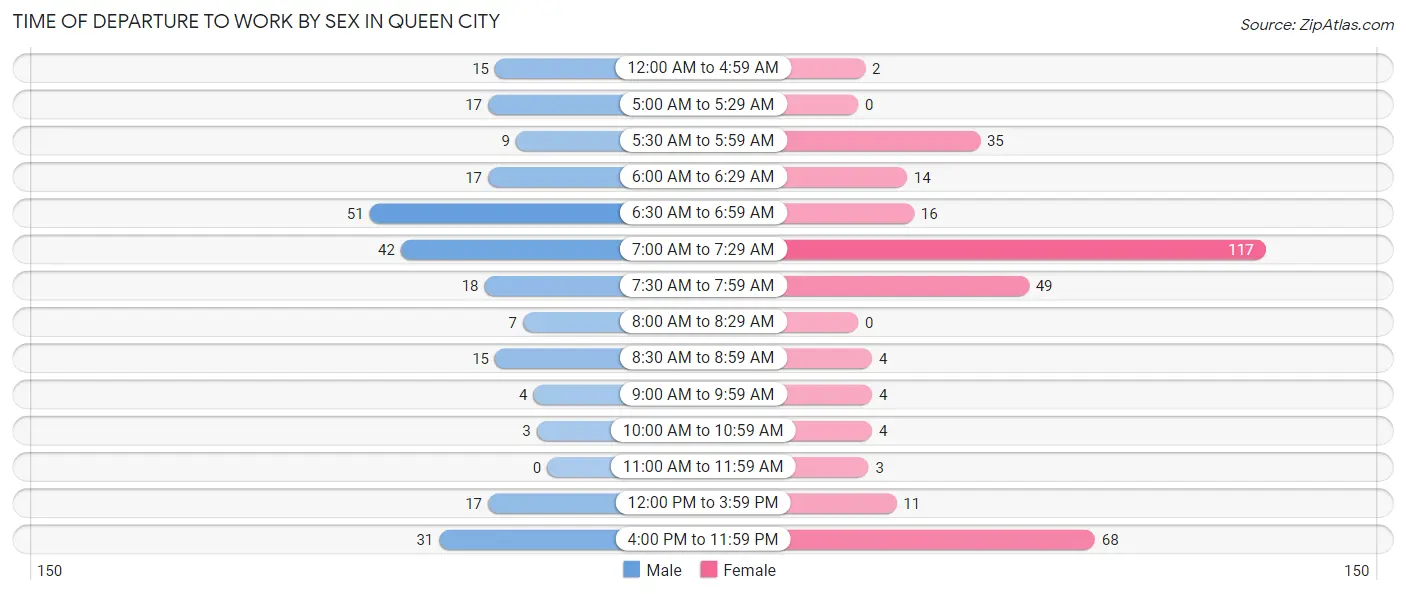
| Time of Departure | Male | Female |
| 12:00 AM to 4:59 AM | 15 (6.1%) | 2 (0.6%) |
| 5:00 AM to 5:29 AM | 17 (6.9%) | 0 (0.0%) |
| 5:30 AM to 5:59 AM | 9 (3.7%) | 35 (10.7%) |
| 6:00 AM to 6:29 AM | 17 (6.9%) | 14 (4.3%) |
| 6:30 AM to 6:59 AM | 51 (20.7%) | 16 (4.9%) |
| 7:00 AM to 7:29 AM | 42 (17.1%) | 117 (35.8%) |
| 7:30 AM to 7:59 AM | 18 (7.3%) | 49 (15.0%) |
| 8:00 AM to 8:29 AM | 7 (2.9%) | 0 (0.0%) |
| 8:30 AM to 8:59 AM | 15 (6.1%) | 4 (1.2%) |
| 9:00 AM to 9:59 AM | 4 (1.6%) | 4 (1.2%) |
| 10:00 AM to 10:59 AM | 3 (1.2%) | 4 (1.2%) |
| 11:00 AM to 11:59 AM | 0 (0.0%) | 3 (0.9%) |
| 12:00 PM to 3:59 PM | 17 (6.9%) | 11 (3.4%) |
| 4:00 PM to 11:59 PM | 31 (12.6%) | 68 (20.8%) |
| Total | 246 (100.0%) | 327 (100.0%) |
Housing Occupancy in Queen City
Occupancy by Ownership in Queen City
Of the total 559 dwellings in Queen City, owner-occupied units account for 330 (59.0%), while renter-occupied units make up 229 (41.0%).
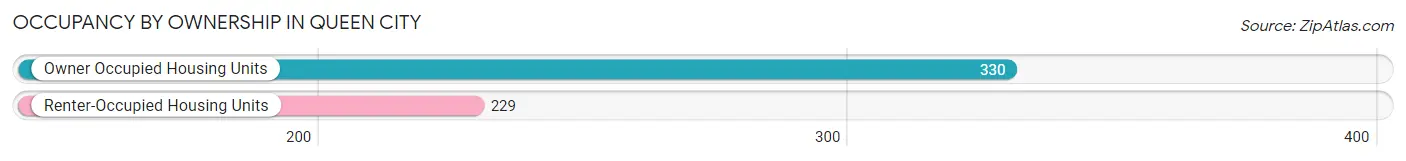
| Occupancy | # Housing Units | % Housing Units |
| Owner Occupied Housing Units | 330 | 59.0% |
| Renter-Occupied Housing Units | 229 | 41.0% |
| Total Occupied Housing Units | 559 | 100.0% |
Occupancy by Household Size in Queen City
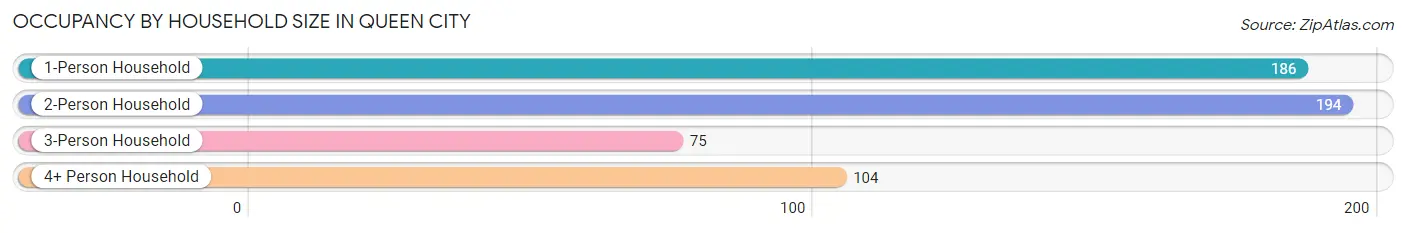
| Household Size | # Housing Units | % Housing Units |
| 1-Person Household | 186 | 33.3% |
| 2-Person Household | 194 | 34.7% |
| 3-Person Household | 75 | 13.4% |
| 4+ Person Household | 104 | 18.6% |
| Total Housing Units | 559 | 100.0% |
Occupancy by Ownership by Household Size in Queen City
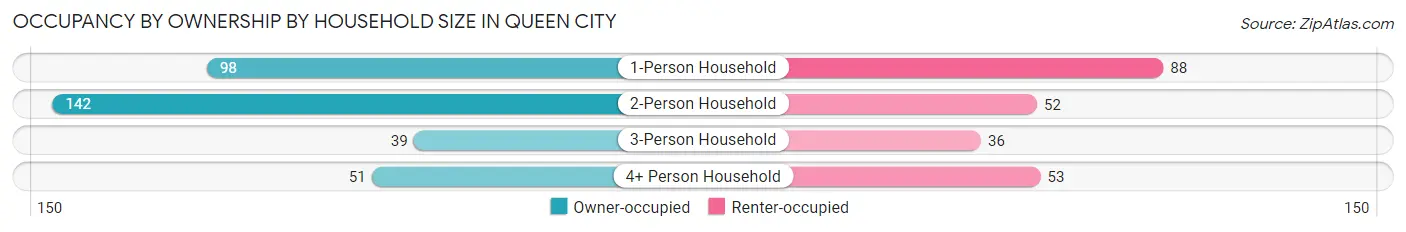
| Household Size | Owner-occupied | Renter-occupied |
| 1-Person Household | 98 (52.7%) | 88 (47.3%) |
| 2-Person Household | 142 (73.2%) | 52 (26.8%) |
| 3-Person Household | 39 (52.0%) | 36 (48.0%) |
| 4+ Person Household | 51 (49.0%) | 53 (51.0%) |
| Total Housing Units | 330 (59.0%) | 229 (41.0%) |
Occupancy by Educational Attainment in Queen City
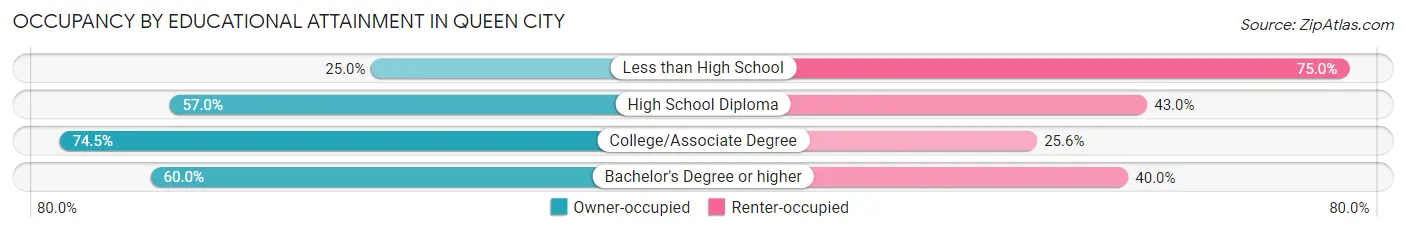
| Household Size | Owner-occupied | Renter-occupied |
| Less than High School | 12 (25.0%) | 36 (75.0%) |
| High School Diploma | 159 (57.0%) | 120 (43.0%) |
| College/Associate Degree | 102 (74.5%) | 35 (25.6%) |
| Bachelor's Degree or higher | 57 (60.0%) | 38 (40.0%) |
Occupancy by Age of Householder in Queen City
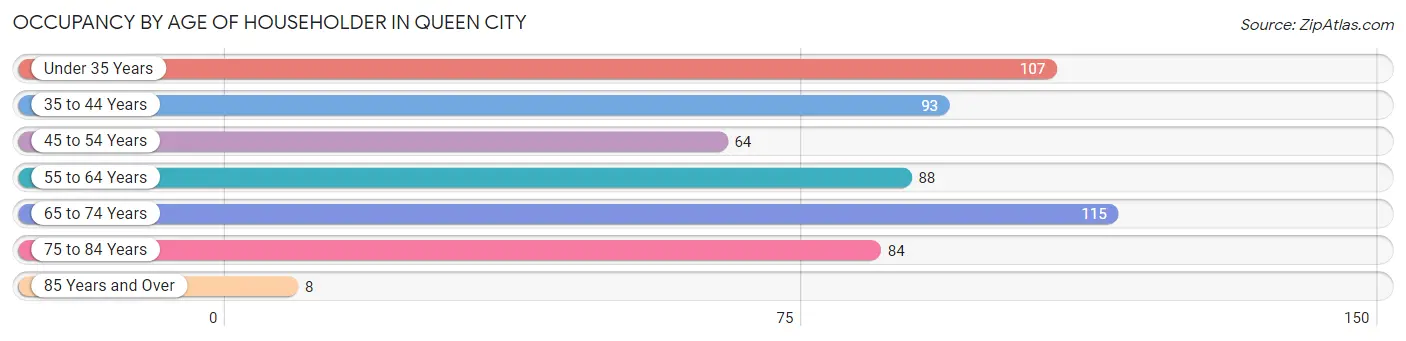
| Age Bracket | # Households | % Households |
| Under 35 Years | 107 | 19.1% |
| 35 to 44 Years | 93 | 16.6% |
| 45 to 54 Years | 64 | 11.5% |
| 55 to 64 Years | 88 | 15.7% |
| 65 to 74 Years | 115 | 20.6% |
| 75 to 84 Years | 84 | 15.0% |
| 85 Years and Over | 8 | 1.4% |
| Total | 559 | 100.0% |
Housing Finances in Queen City
Median Income by Occupancy in Queen City
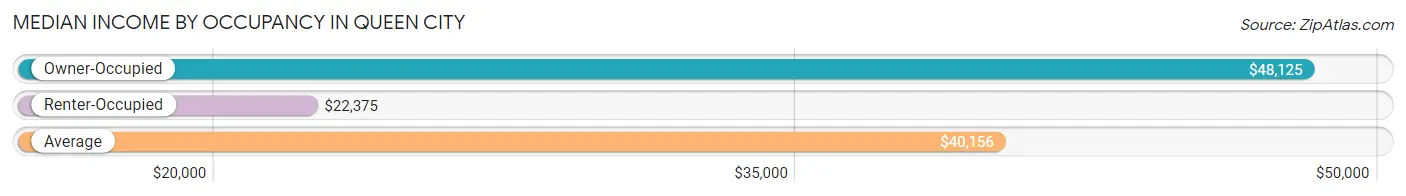
| Occupancy Type | # Households | Median Income |
| Owner-Occupied | 330 (59.0%) | $48,125 |
| Renter-Occupied | 229 (41.0%) | $22,375 |
| Average | 559 (100.0%) | $40,156 |
Occupancy by Householder Income Bracket in Queen City
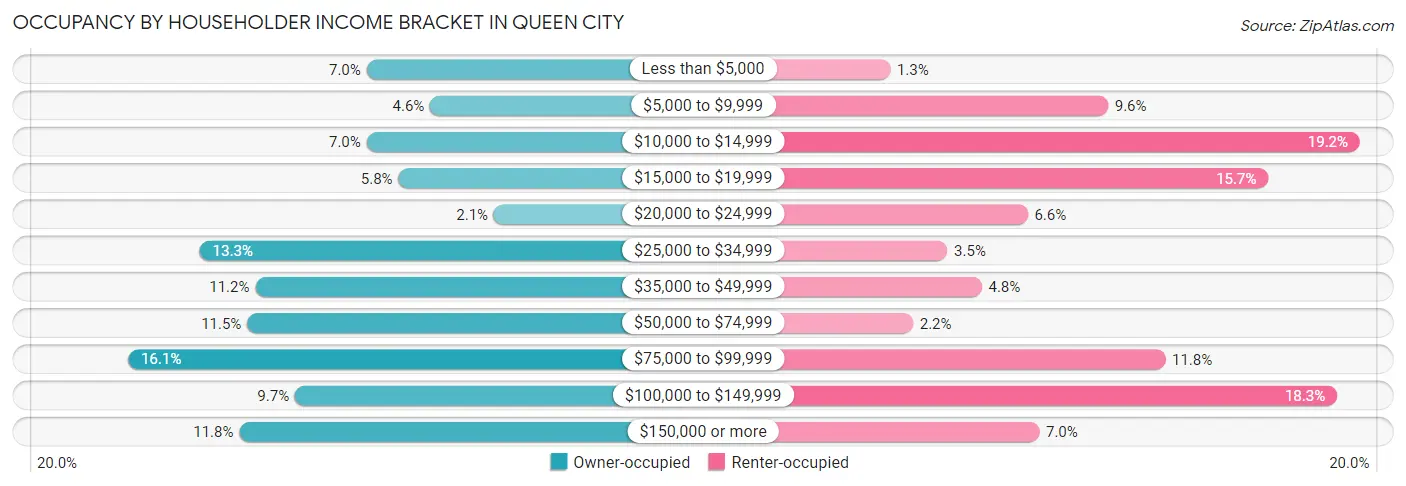
| Income Bracket | Owner-occupied | Renter-occupied |
| Less than $5,000 | 23 (7.0%) | 3 (1.3%) |
| $5,000 to $9,999 | 15 (4.5%) | 22 (9.6%) |
| $10,000 to $14,999 | 23 (7.0%) | 44 (19.2%) |
| $15,000 to $19,999 | 19 (5.8%) | 36 (15.7%) |
| $20,000 to $24,999 | 7 (2.1%) | 15 (6.6%) |
| $25,000 to $34,999 | 44 (13.3%) | 8 (3.5%) |
| $35,000 to $49,999 | 37 (11.2%) | 11 (4.8%) |
| $50,000 to $74,999 | 38 (11.5%) | 5 (2.2%) |
| $75,000 to $99,999 | 53 (16.1%) | 27 (11.8%) |
| $100,000 to $149,999 | 32 (9.7%) | 42 (18.3%) |
| $150,000 or more | 39 (11.8%) | 16 (7.0%) |
| Total | 330 (100.0%) | 229 (100.0%) |
Monthly Housing Cost Tiers in Queen City
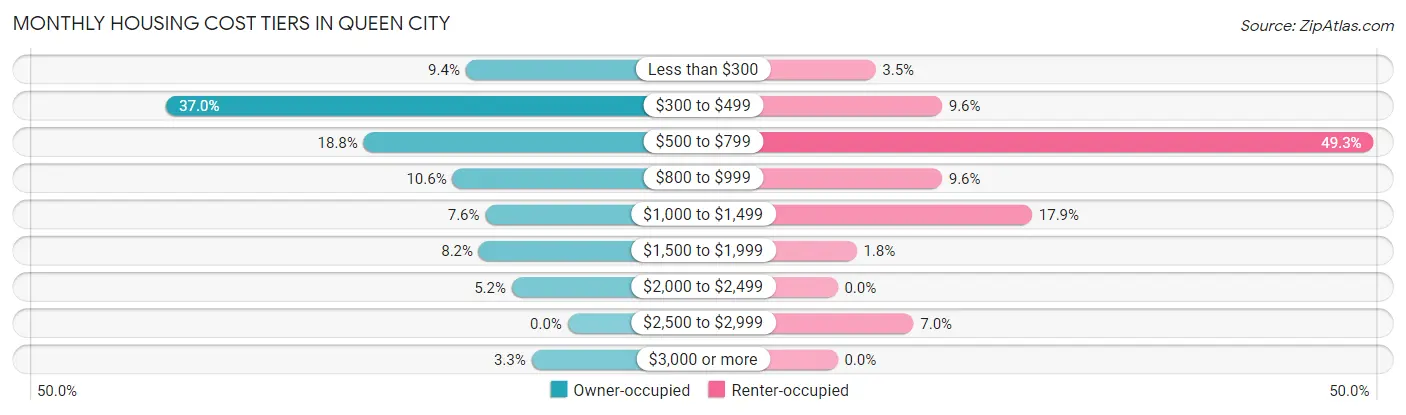
| Monthly Cost | Owner-occupied | Renter-occupied |
| Less than $300 | 31 (9.4%) | 8 (3.5%) |
| $300 to $499 | 122 (37.0%) | 22 (9.6%) |
| $500 to $799 | 62 (18.8%) | 113 (49.3%) |
| $800 to $999 | 35 (10.6%) | 22 (9.6%) |
| $1,000 to $1,499 | 25 (7.6%) | 41 (17.9%) |
| $1,500 to $1,999 | 27 (8.2%) | 4 (1.8%) |
| $2,000 to $2,499 | 17 (5.1%) | 0 (0.0%) |
| $2,500 to $2,999 | 0 (0.0%) | 16 (7.0%) |
| $3,000 or more | 11 (3.3%) | 0 (0.0%) |
| Total | 330 (100.0%) | 229 (100.0%) |
Physical Housing Characteristics in Queen City
Housing Structures in Queen City
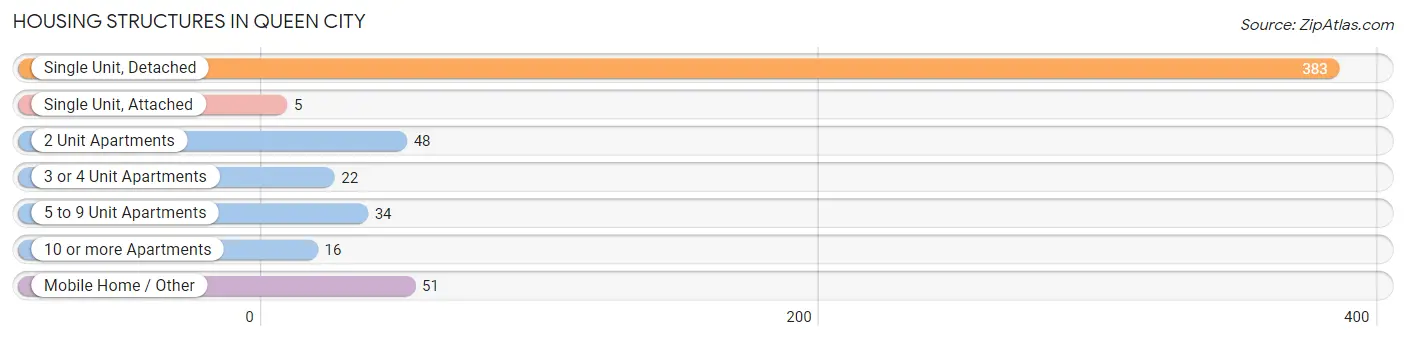
| Structure Type | # Housing Units | % Housing Units |
| Single Unit, Detached | 383 | 68.5% |
| Single Unit, Attached | 5 | 0.9% |
| 2 Unit Apartments | 48 | 8.6% |
| 3 or 4 Unit Apartments | 22 | 3.9% |
| 5 to 9 Unit Apartments | 34 | 6.1% |
| 10 or more Apartments | 16 | 2.9% |
| Mobile Home / Other | 51 | 9.1% |
| Total | 559 | 100.0% |
Housing Structures by Occupancy in Queen City
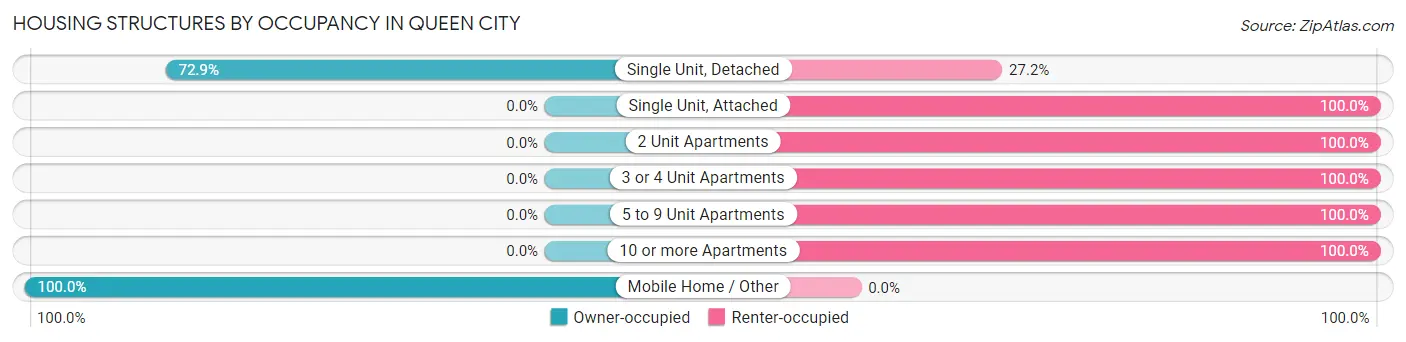
| Structure Type | Owner-occupied | Renter-occupied |
| Single Unit, Detached | 279 (72.9%) | 104 (27.2%) |
| Single Unit, Attached | 0 (0.0%) | 5 (100.0%) |
| 2 Unit Apartments | 0 (0.0%) | 48 (100.0%) |
| 3 or 4 Unit Apartments | 0 (0.0%) | 22 (100.0%) |
| 5 to 9 Unit Apartments | 0 (0.0%) | 34 (100.0%) |
| 10 or more Apartments | 0 (0.0%) | 16 (100.0%) |
| Mobile Home / Other | 51 (100.0%) | 0 (0.0%) |
| Total | 330 (59.0%) | 229 (41.0%) |
Housing Structures by Number of Rooms in Queen City
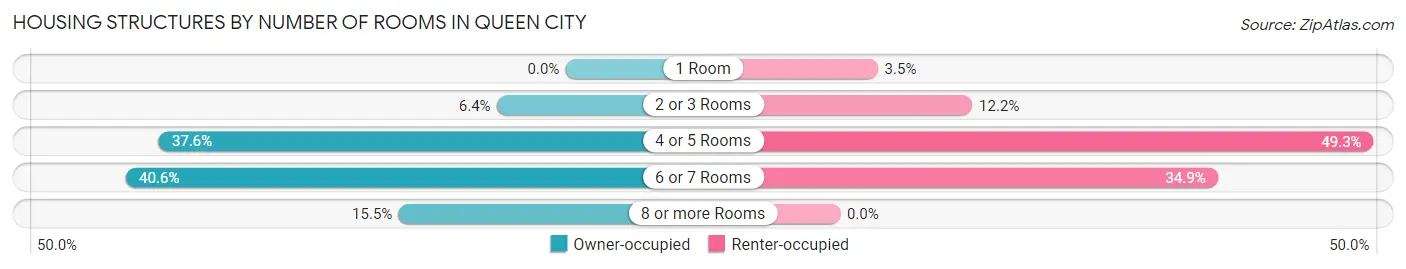
| Number of Rooms | Owner-occupied | Renter-occupied |
| 1 Room | 0 (0.0%) | 8 (3.5%) |
| 2 or 3 Rooms | 21 (6.4%) | 28 (12.2%) |
| 4 or 5 Rooms | 124 (37.6%) | 113 (49.3%) |
| 6 or 7 Rooms | 134 (40.6%) | 80 (34.9%) |
| 8 or more Rooms | 51 (15.4%) | 0 (0.0%) |
| Total | 330 (100.0%) | 229 (100.0%) |
Housing Structure by Heating Type in Queen City
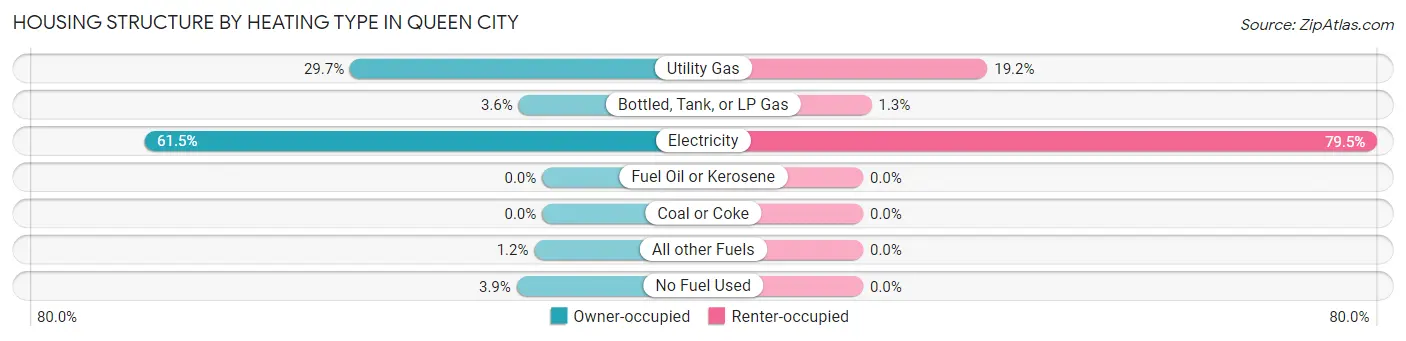
| Heating Type | Owner-occupied | Renter-occupied |
| Utility Gas | 98 (29.7%) | 44 (19.2%) |
| Bottled, Tank, or LP Gas | 12 (3.6%) | 3 (1.3%) |
| Electricity | 203 (61.5%) | 182 (79.5%) |
| Fuel Oil or Kerosene | 0 (0.0%) | 0 (0.0%) |
| Coal or Coke | 0 (0.0%) | 0 (0.0%) |
| All other Fuels | 4 (1.2%) | 0 (0.0%) |
| No Fuel Used | 13 (3.9%) | 0 (0.0%) |
| Total | 330 (100.0%) | 229 (100.0%) |
Household Vehicle Usage in Queen City
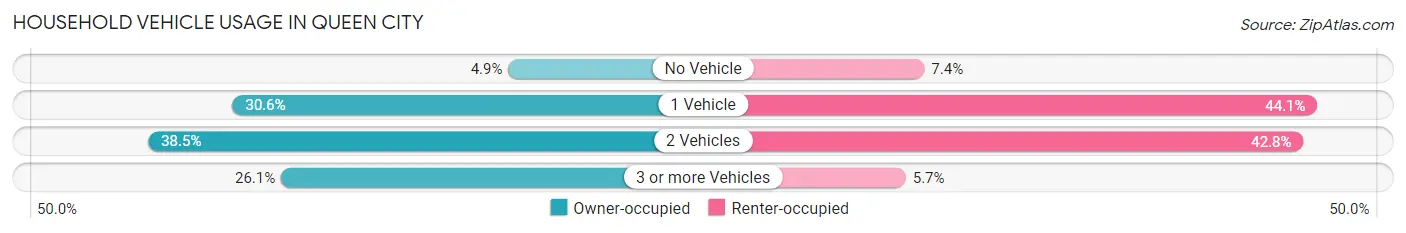
| Vehicles per Household | Owner-occupied | Renter-occupied |
| No Vehicle | 16 (4.9%) | 17 (7.4%) |
| 1 Vehicle | 101 (30.6%) | 101 (44.1%) |
| 2 Vehicles | 127 (38.5%) | 98 (42.8%) |
| 3 or more Vehicles | 86 (26.1%) | 13 (5.7%) |
| Total | 330 (100.0%) | 229 (100.0%) |
Real Estate & Mortgages in Queen City
Real Estate and Mortgage Overview in Queen City
| Characteristic | Without Mortgage | With Mortgage |
| Housing Units | 212 | 118 |
| Median Property Value | $81,700 | $137,500 |
| Median Household Income | $34,265 | $28 |
| Monthly Housing Costs | $408 | $11 |
| Real Estate Taxes | $1,442 | $7 |
Property Value by Mortgage Status in Queen City
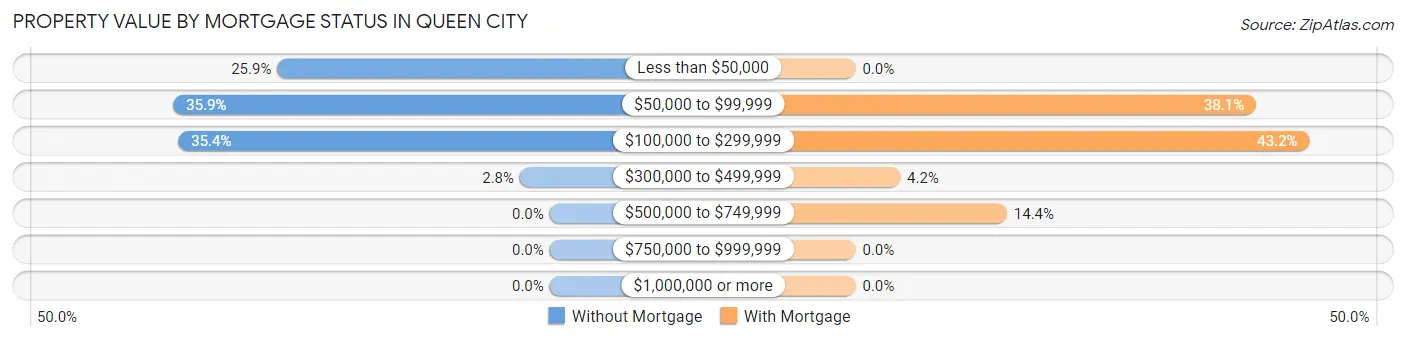
| Property Value | Without Mortgage | With Mortgage |
| Less than $50,000 | 55 (25.9%) | 0 (0.0%) |
| $50,000 to $99,999 | 76 (35.8%) | 45 (38.1%) |
| $100,000 to $299,999 | 75 (35.4%) | 51 (43.2%) |
| $300,000 to $499,999 | 6 (2.8%) | 5 (4.2%) |
| $500,000 to $749,999 | 0 (0.0%) | 17 (14.4%) |
| $750,000 to $999,999 | 0 (0.0%) | 0 (0.0%) |
| $1,000,000 or more | 0 (0.0%) | 0 (0.0%) |
| Total | 212 (100.0%) | 118 (100.0%) |
Household Income by Mortgage Status in Queen City
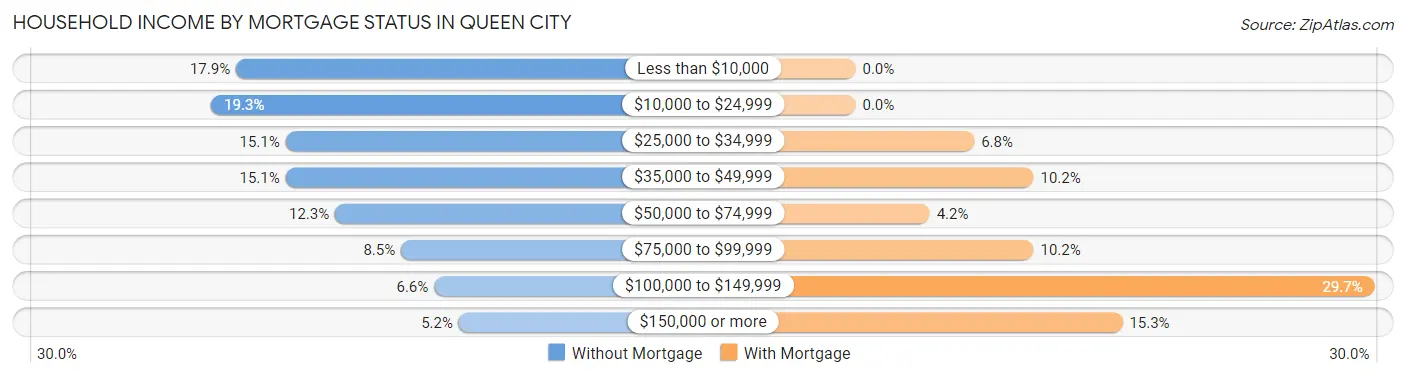
| Household Income | Without Mortgage | With Mortgage |
| Less than $10,000 | 38 (17.9%) | 0 (0.0%) |
| $10,000 to $24,999 | 41 (19.3%) | 0 (0.0%) |
| $25,000 to $34,999 | 32 (15.1%) | 8 (6.8%) |
| $35,000 to $49,999 | 32 (15.1%) | 12 (10.2%) |
| $50,000 to $74,999 | 26 (12.3%) | 5 (4.2%) |
| $75,000 to $99,999 | 18 (8.5%) | 12 (10.2%) |
| $100,000 to $149,999 | 14 (6.6%) | 35 (29.7%) |
| $150,000 or more | 11 (5.2%) | 18 (15.2%) |
| Total | 212 (100.0%) | 118 (100.0%) |
Property Value to Household Income Ratio in Queen City
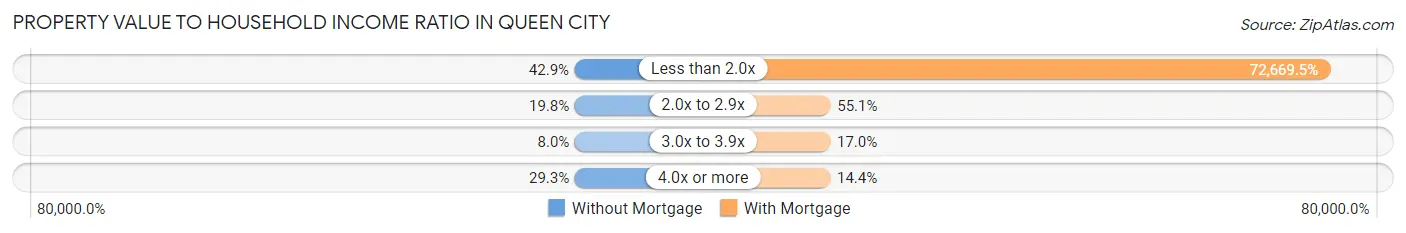
| Value-to-Income Ratio | Without Mortgage | With Mortgage |
| Less than 2.0x | 91 (42.9%) | 85,750 (72,669.5%) |
| 2.0x to 2.9x | 42 (19.8%) | 65 (55.1%) |
| 3.0x to 3.9x | 17 (8.0%) | 20 (17.0%) |
| 4.0x or more | 62 (29.2%) | 17 (14.4%) |
| Total | 212 (100.0%) | 118 (100.0%) |
Real Estate Taxes by Mortgage Status in Queen City
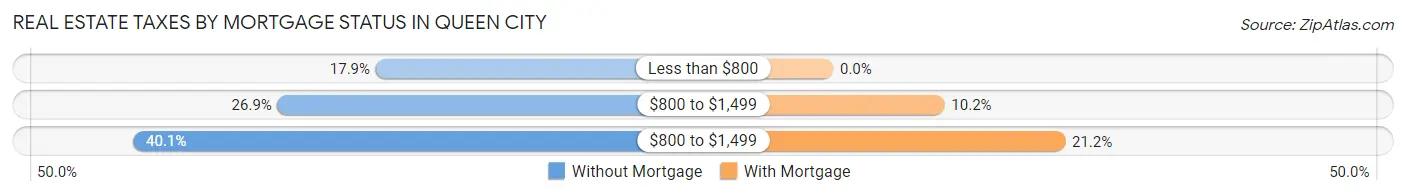
| Property Taxes | Without Mortgage | With Mortgage |
| Less than $800 | 38 (17.9%) | 0 (0.0%) |
| $800 to $1,499 | 57 (26.9%) | 12 (10.2%) |
| $800 to $1,499 | 85 (40.1%) | 25 (21.2%) |
| Total | 212 (100.0%) | 118 (100.0%) |
Health & Disability in Queen City
Health Insurance Coverage by Age in Queen City
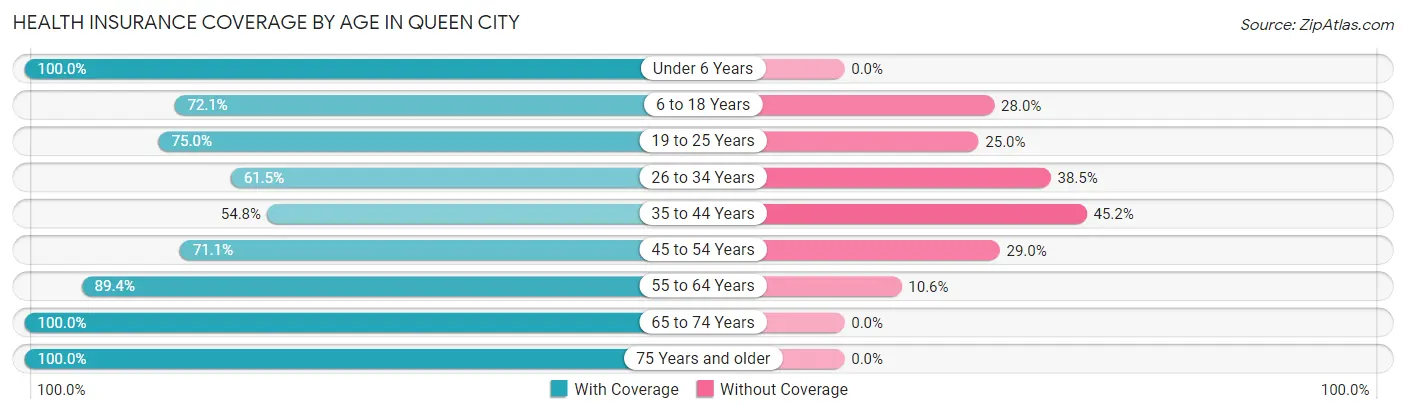
| Age Bracket | With Coverage | Without Coverage |
| Under 6 Years | 51 (100.0%) | 0 (0.0%) |
| 6 to 18 Years | 183 (72.1%) | 71 (28.0%) |
| 19 to 25 Years | 39 (75.0%) | 13 (25.0%) |
| 26 to 34 Years | 120 (61.5%) | 75 (38.5%) |
| 35 to 44 Years | 125 (54.8%) | 103 (45.2%) |
| 45 to 54 Years | 81 (71.1%) | 33 (28.9%) |
| 55 to 64 Years | 126 (89.4%) | 15 (10.6%) |
| 65 to 74 Years | 153 (100.0%) | 0 (0.0%) |
| 75 Years and older | 118 (100.0%) | 0 (0.0%) |
| Total | 996 (76.3%) | 310 (23.7%) |
Health Insurance Coverage by Citizenship Status in Queen City
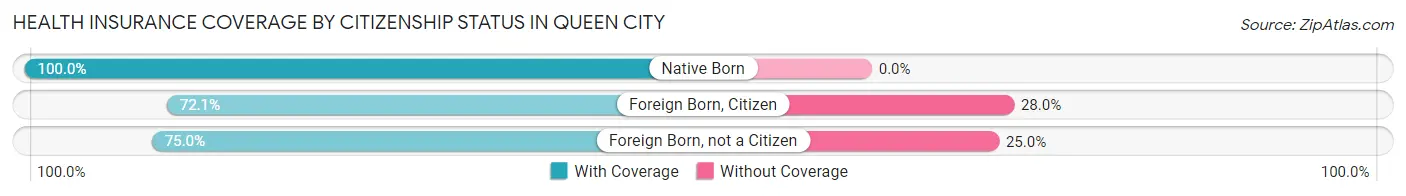
| Citizenship Status | With Coverage | Without Coverage |
| Native Born | 51 (100.0%) | 0 (0.0%) |
| Foreign Born, Citizen | 183 (72.1%) | 71 (28.0%) |
| Foreign Born, not a Citizen | 39 (75.0%) | 13 (25.0%) |
Health Insurance Coverage by Household Income in Queen City
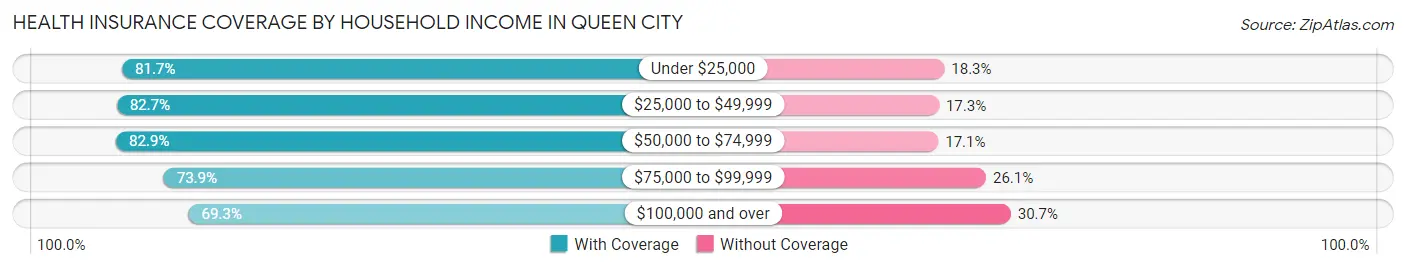
| Household Income | With Coverage | Without Coverage |
| Under $25,000 | 237 (81.7%) | 53 (18.3%) |
| $25,000 to $49,999 | 182 (82.7%) | 38 (17.3%) |
| $50,000 to $74,999 | 87 (82.9%) | 18 (17.1%) |
| $75,000 to $99,999 | 170 (73.9%) | 60 (26.1%) |
| $100,000 and over | 318 (69.3%) | 141 (30.7%) |
Public vs Private Health Insurance Coverage by Age in Queen City
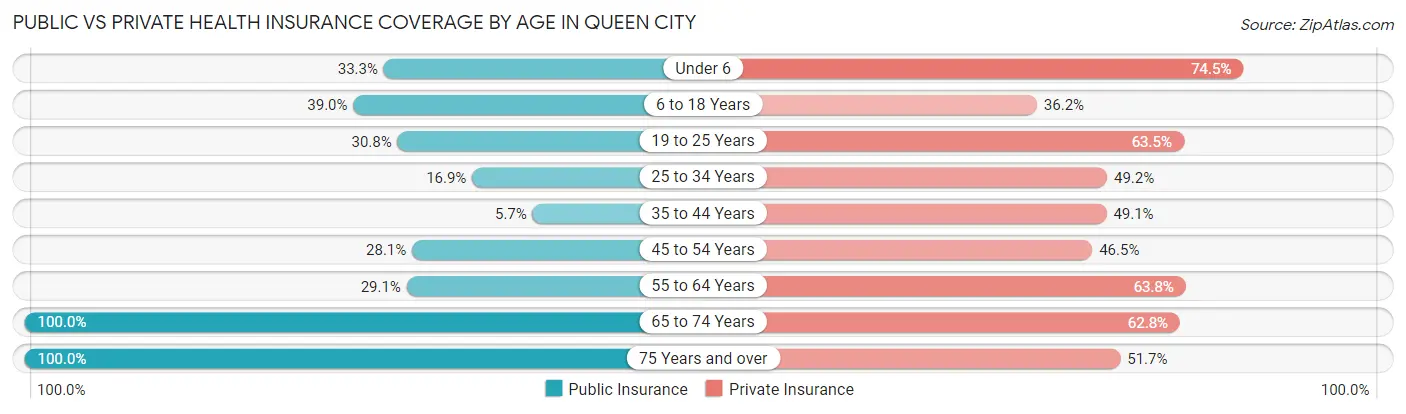
| Age Bracket | Public Insurance | Private Insurance |
| Under 6 | 17 (33.3%) | 38 (74.5%) |
| 6 to 18 Years | 99 (39.0%) | 92 (36.2%) |
| 19 to 25 Years | 16 (30.8%) | 33 (63.5%) |
| 25 to 34 Years | 33 (16.9%) | 96 (49.2%) |
| 35 to 44 Years | 13 (5.7%) | 112 (49.1%) |
| 45 to 54 Years | 32 (28.1%) | 53 (46.5%) |
| 55 to 64 Years | 41 (29.1%) | 90 (63.8%) |
| 65 to 74 Years | 153 (100.0%) | 96 (62.7%) |
| 75 Years and over | 118 (100.0%) | 61 (51.7%) |
| Total | 522 (40.0%) | 671 (51.4%) |
Disability Status by Sex by Age in Queen City
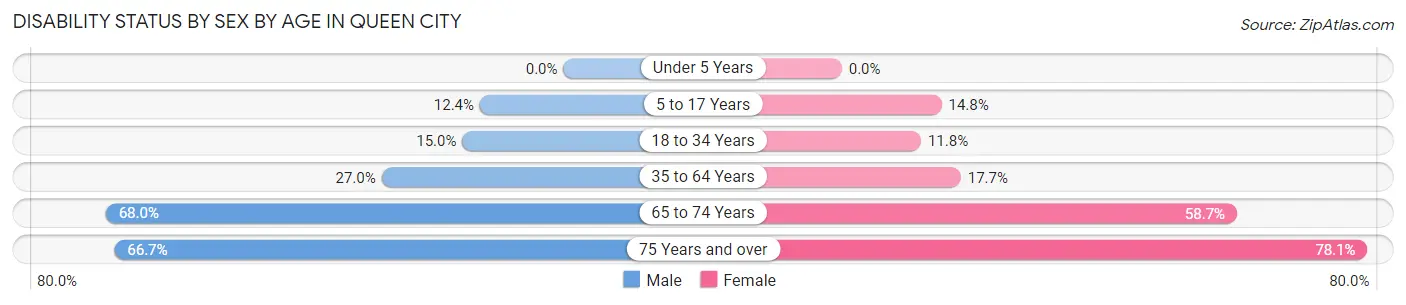
| Age Bracket | Male | Female |
| Under 5 Years | 0 (0.0%) | 0 (0.0%) |
| 5 to 17 Years | 15 (12.4%) | 12 (14.8%) |
| 18 to 34 Years | 18 (15.0%) | 22 (11.8%) |
| 35 to 64 Years | 54 (27.0%) | 50 (17.7%) |
| 65 to 74 Years | 53 (67.9%) | 44 (58.7%) |
| 75 Years and over | 24 (66.7%) | 64 (78.0%) |
Disability Class by Sex by Age in Queen City
Disability Class: Hearing Difficulty
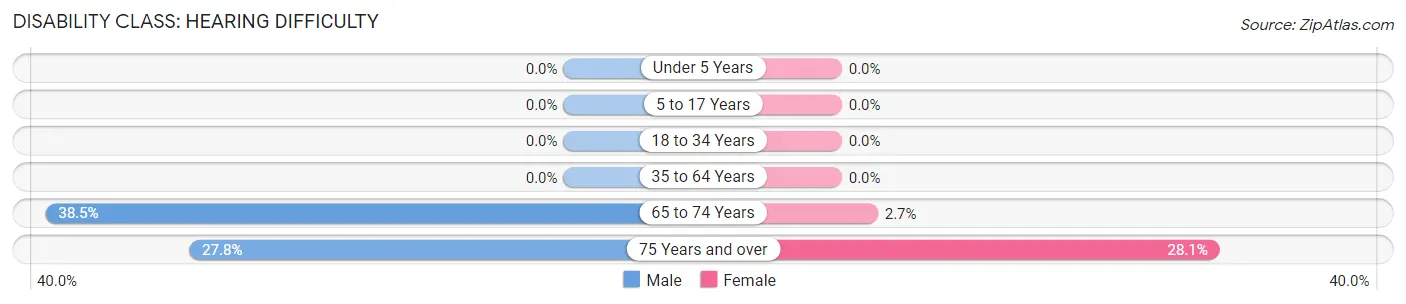
| Age Bracket | Male | Female |
| Under 5 Years | 0 (0.0%) | 0 (0.0%) |
| 5 to 17 Years | 0 (0.0%) | 0 (0.0%) |
| 18 to 34 Years | 0 (0.0%) | 0 (0.0%) |
| 35 to 64 Years | 0 (0.0%) | 0 (0.0%) |
| 65 to 74 Years | 30 (38.5%) | 2 (2.7%) |
| 75 Years and over | 10 (27.8%) | 23 (28.1%) |
Disability Class: Vision Difficulty
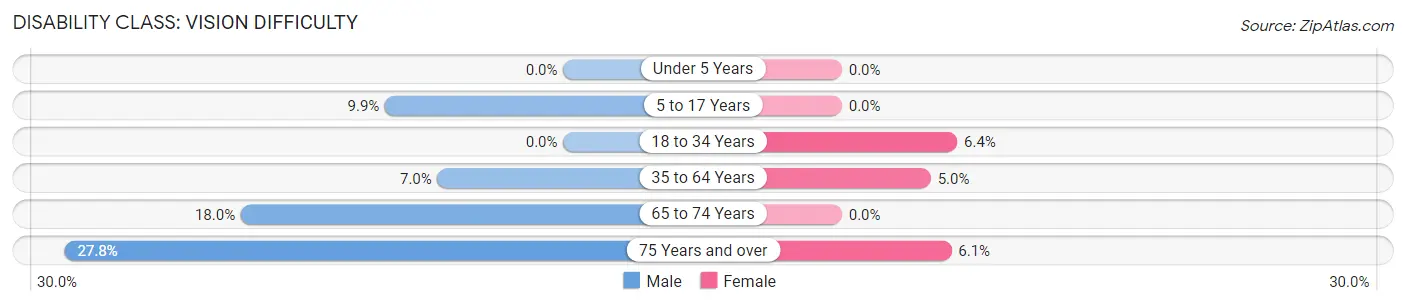
| Age Bracket | Male | Female |
| Under 5 Years | 0 (0.0%) | 0 (0.0%) |
| 5 to 17 Years | 12 (9.9%) | 0 (0.0%) |
| 18 to 34 Years | 0 (0.0%) | 12 (6.4%) |
| 35 to 64 Years | 14 (7.0%) | 14 (5.0%) |
| 65 to 74 Years | 14 (17.9%) | 0 (0.0%) |
| 75 Years and over | 10 (27.8%) | 5 (6.1%) |
Disability Class: Cognitive Difficulty
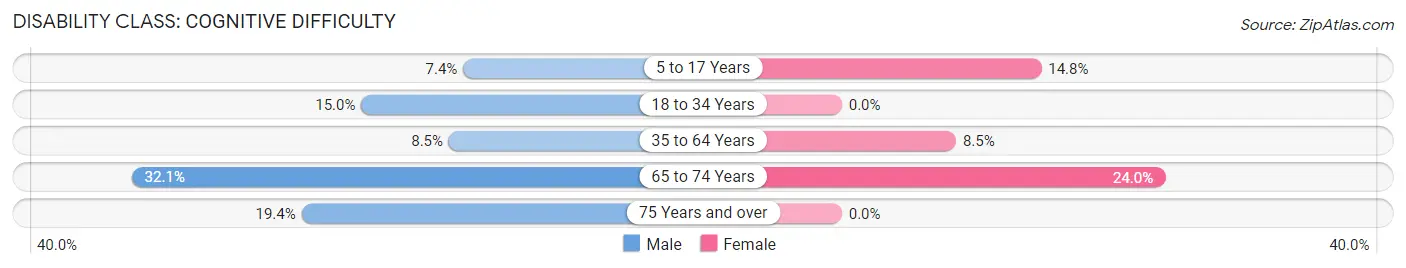
| Age Bracket | Male | Female |
| 5 to 17 Years | 9 (7.4%) | 12 (14.8%) |
| 18 to 34 Years | 18 (15.0%) | 0 (0.0%) |
| 35 to 64 Years | 17 (8.5%) | 24 (8.5%) |
| 65 to 74 Years | 25 (32.1%) | 18 (24.0%) |
| 75 Years and over | 7 (19.4%) | 0 (0.0%) |
Disability Class: Ambulatory Difficulty
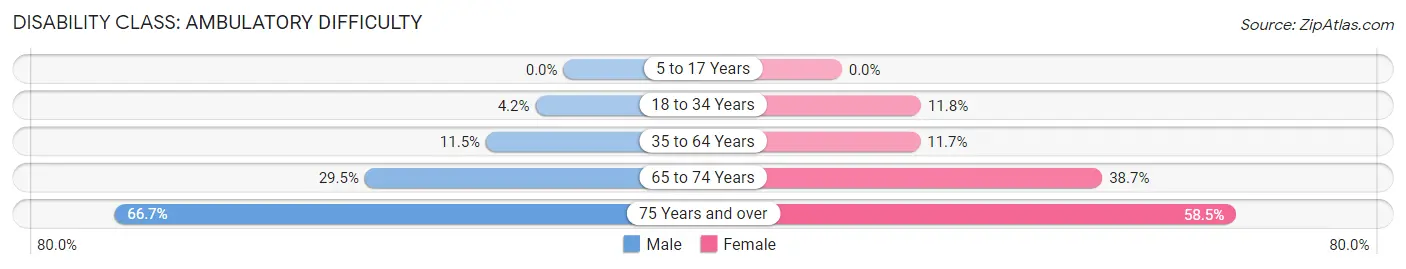
| Age Bracket | Male | Female |
| 5 to 17 Years | 0 (0.0%) | 0 (0.0%) |
| 18 to 34 Years | 5 (4.2%) | 22 (11.8%) |
| 35 to 64 Years | 23 (11.5%) | 33 (11.7%) |
| 65 to 74 Years | 23 (29.5%) | 29 (38.7%) |
| 75 Years and over | 24 (66.7%) | 48 (58.5%) |
Disability Class: Self-Care Difficulty
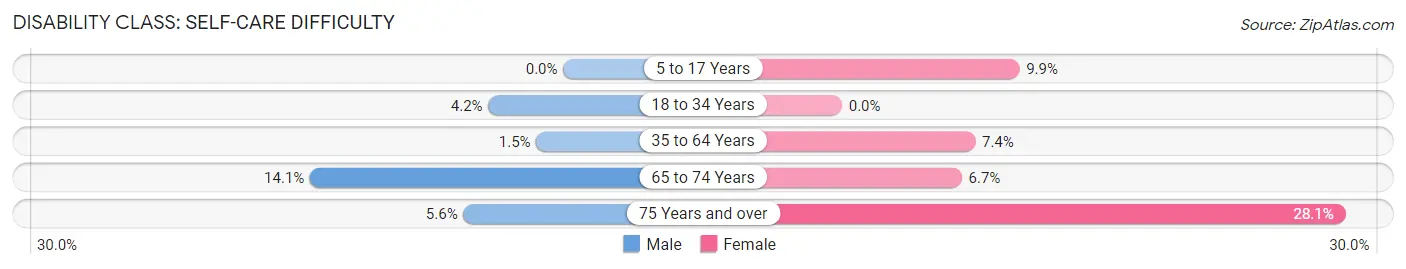
| Age Bracket | Male | Female |
| 5 to 17 Years | 0 (0.0%) | 8 (9.9%) |
| 18 to 34 Years | 5 (4.2%) | 0 (0.0%) |
| 35 to 64 Years | 3 (1.5%) | 21 (7.4%) |
| 65 to 74 Years | 11 (14.1%) | 5 (6.7%) |
| 75 Years and over | 2 (5.6%) | 23 (28.1%) |
Technology Access in Queen City
Computing Device Access in Queen City
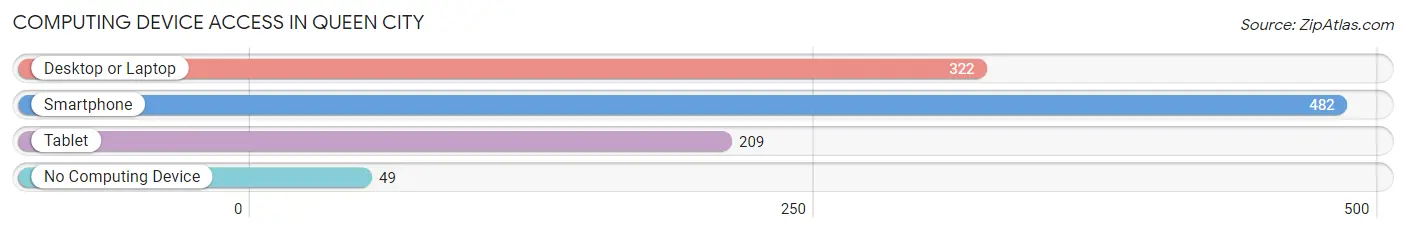
| Device Type | # Households | % Households |
| Desktop or Laptop | 322 | 57.6% |
| Smartphone | 482 | 86.2% |
| Tablet | 209 | 37.4% |
| No Computing Device | 49 | 8.8% |
| Total | 559 | 100.0% |
Internet Access in Queen City
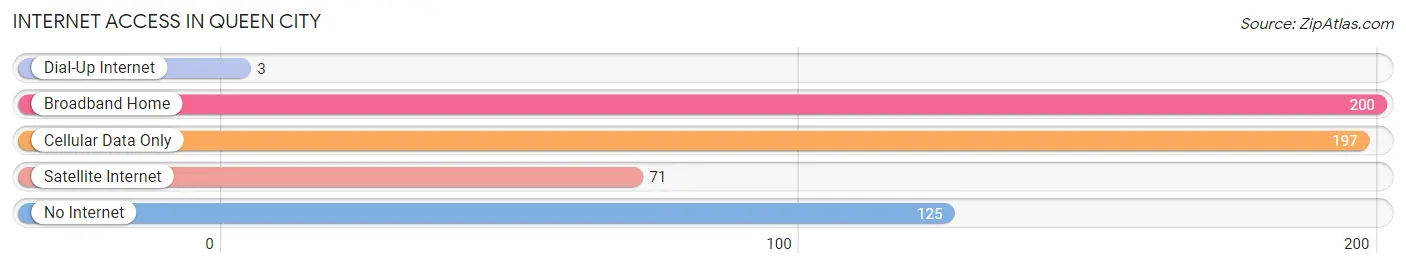
| Internet Type | # Households | % Households |
| Dial-Up Internet | 3 | 0.5% |
| Broadband Home | 200 | 35.8% |
| Cellular Data Only | 197 | 35.2% |
| Satellite Internet | 71 | 12.7% |
| No Internet | 125 | 22.4% |
| Total | 559 | 100.0% |
Queen City Summary
City of Queen City Texas
Queen City, Texas is a small city located in Cass County, Texas. It is situated in the northeast corner of the state, approximately 90 miles east of Dallas and 40 miles south of Texarkana. The city is home to a population of approximately 1,500 people, and is the county seat of Cass County.
History
Queen City was founded in 1871 by a group of settlers from Arkansas. The city was named after Queen Victoria of England, who had recently been crowned. The city was incorporated in 1876, and the first mayor was elected in 1877.
The city grew rapidly in the late 19th century, and by the early 20th century, it had become a major center for cotton production. The city was also home to several sawmills, and the local economy was largely based on timber and cotton production.
In the early 20th century, Queen City was a major stop on the Texas and Pacific Railway. The railway brought new people and businesses to the city, and it helped to spur further growth.
In the mid-20th century, Queen City experienced a period of decline. The cotton industry had largely moved away, and the sawmills had closed. The city was largely forgotten until the late 20th century, when it experienced a resurgence in popularity.
Geography
Queen City is located in the northeast corner of Texas, approximately 90 miles east of Dallas and 40 miles south of Texarkana. The city is situated in the Piney Woods region of the state, and is surrounded by rolling hills and forests. The city is located on the banks of the Sulphur River, and is home to several small lakes and ponds.
The climate in Queen City is humid subtropical, with hot summers and mild winters. The average annual temperature is around 70 degrees Fahrenheit, and the average annual precipitation is around 40 inches.
Economy
The economy of Queen City is largely based on agriculture and timber production. The city is home to several farms and ranches, and the local economy is largely based on the production of cotton, soybeans, and other crops.
The city is also home to several small businesses, including restaurants, retail stores, and service providers. The city is home to several manufacturing companies, and the local economy is also supported by tourism.
Demographics
As of the 2010 census, the population of Queen City was 1,500. The racial makeup of the city was 79.2% White, 17.3% African American, 0.7% Native American, 0.7% Asian, and 2.1% from other races.
The median household income in Queen City was $31,250, and the median family income was $37,500. The per capita income was $17,500. The poverty rate was 22.2%.
Conclusion
Queen City, Texas is a small city located in Cass County, Texas. It is situated in the northeast corner of the state, approximately 90 miles east of Dallas and 40 miles south of Texarkana. The city is home to a population of approximately 1,500 people, and is the county seat of Cass County. The city was founded in 1871, and the local economy is largely based on agriculture and timber production. The racial makeup of the city is 79.2% White, 17.3% African American, 0.7% Native American, 0.7% Asian, and 2.1% from other races. The median household income in Queen City was $31,250, and the poverty rate was 22.2%. Queen City is a small city with a rich history and a bright future.
Common Questions
What is Per Capita Income in Queen City?
Per Capita income in Queen City is $26,594.
What is the Median Family Income in Queen City?
Median Family Income in Queen City is $72,292.
What is the Median Household income in Queen City?
Median Household Income in Queen City is $40,156.
What is Income or Wage Gap in Queen City?
Income or Wage Gap in Queen City is 57.6%.
Women in Queen City earn 42.4 cents for every dollar earned by a man.
What is Family Income Deficit in Queen City?
Family Income Deficit in Queen City is $11,440.
Families that are below poverty line in Queen City earn $11,440 less on average than the poverty threshold level.
What is Inequality or Gini Index in Queen City?
Inequality or Gini Index in Queen City is 0.47.
What is the Total Population of Queen City?
Total Population of Queen City is 1,306.
What is the Total Male Population of Queen City?
Total Male Population of Queen City is 582.
What is the Total Female Population of Queen City?
Total Female Population of Queen City is 724.
What is the Ratio of Males per 100 Females in Queen City?
There are 80.39 Males per 100 Females in Queen City.
What is the Ratio of Females per 100 Males in Queen City?
There are 124.40 Females per 100 Males in Queen City.
What is the Median Population Age in Queen City?
Median Population Age in Queen City is 40.7 Years.
What is the Average Family Size in Queen City
Average Family Size in Queen City is 2.9 People.
What is the Average Household Size in Queen City
Average Household Size in Queen City is 2.3 People.
How Large is the Labor Force in Queen City?
There are 605 People in the Labor Forcein in Queen City.
What is the Percentage of People in the Labor Force in Queen City?
55.7% of People are in the Labor Force in Queen City.
What is the Unemployment Rate in Queen City?
Unemployment Rate in Queen City is 3.1%.