Combes, TX Map & Demographics
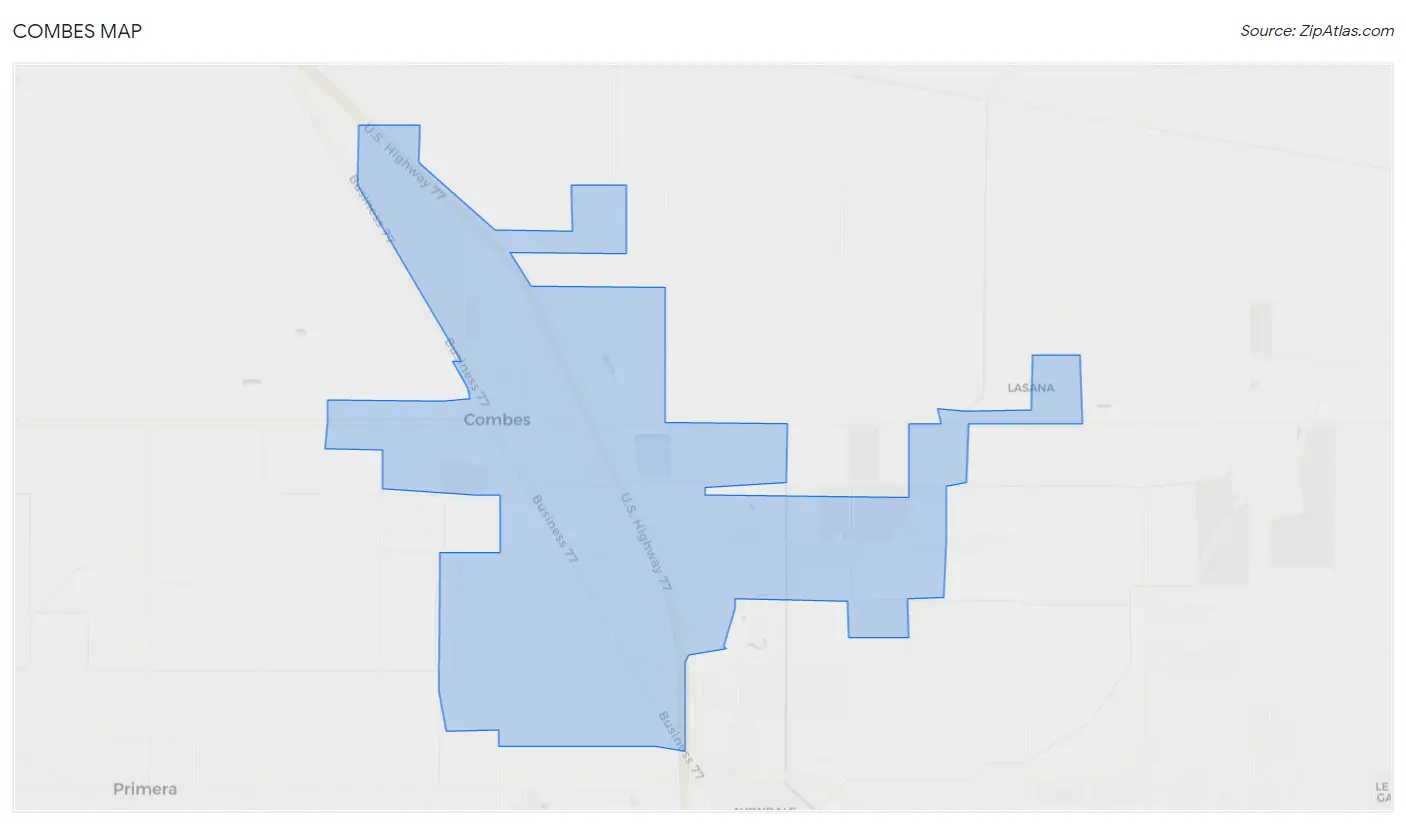
Combes Map
Combes Overview
$20,892
PER CAPITA INCOME
$59,440
AVG FAMILY INCOME
$39,555
AVG HOUSEHOLD INCOME
19.2%
WAGE / INCOME GAP [ % ]
80.8¢/ $1
WAGE / INCOME GAP [ $ ]
0.41
INEQUALITY / GINI INDEX
3,141
TOTAL POPULATION
1,513
MALE POPULATION
1,628
FEMALE POPULATION
92.94
MALES / 100 FEMALES
107.60
FEMALES / 100 MALES
37.1
MEDIAN AGE
3.7
AVG FAMILY SIZE
2.9
AVG HOUSEHOLD SIZE
1,410
LABOR FORCE [ PEOPLE ]
61.0%
PERCENT IN LABOR FORCE
1.7%
UNEMPLOYMENT RATE
Combes Zip Codes
Combes Area Codes
Income in Combes
Income Overview in Combes
Per Capita Income in Combes is $20,892, while median incomes of families and households are $59,440 and $39,555 respectively.
| Characteristic | Number | Measure |
| Per Capita Income | 3,141 | $20,892 |
| Median Family Income | 719 | $59,440 |
| Mean Family Income | 719 | $68,549 |
| Median Household Income | 1,084 | $39,555 |
| Mean Household Income | 1,084 | $58,391 |
| Income Deficit | 719 | $0 |
| Wage / Income Gap (%) | 3,141 | 19.25% |
| Wage / Income Gap ($) | 3,141 | 80.75¢ per $1 |
| Gini / Inequality Index | 3,141 | 0.41 |
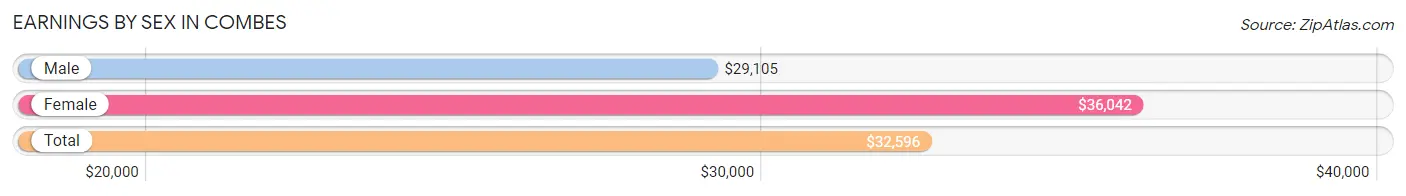
Earnings by Sex in Combes
Average Earnings in Combes are $32,596, $29,105 for men and $36,042 for women, a difference of 19.3%.
| Sex | Number | Average Earnings |
| Male | 840 (57.5%) | $29,105 |
| Female | 622 (42.5%) | $36,042 |
| Total | 1,462 (100.0%) | $32,596 |
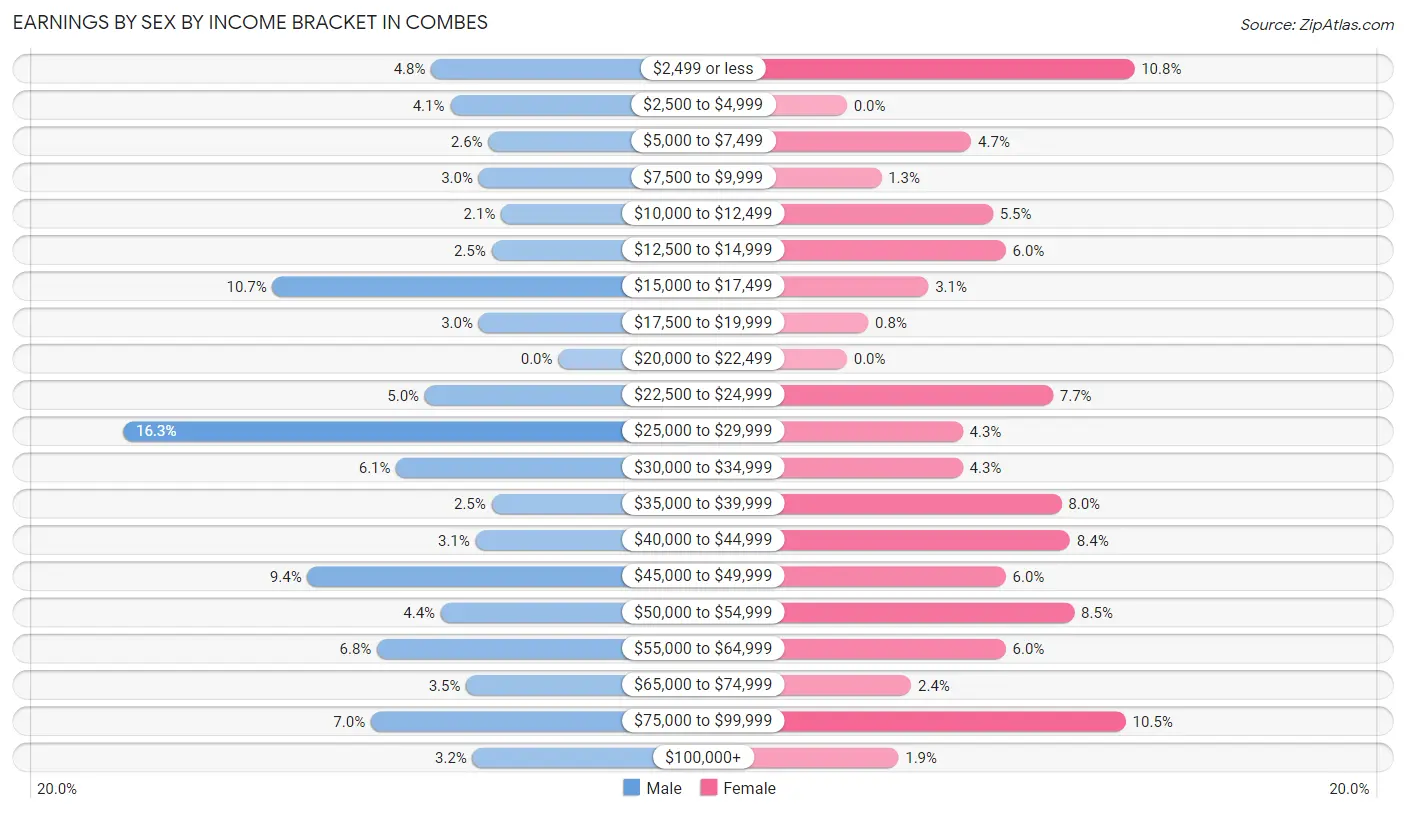
Earnings by Sex by Income Bracket in Combes
The most common earnings brackets in Combes are $25,000 to $29,999 for men (137 | 16.3%) and $2,499 or less for women (67 | 10.8%).
| Income | Male | Female |
| $2,499 or less | 40 (4.8%) | 67 (10.8%) |
| $2,500 to $4,999 | 34 (4.1%) | 0 (0.0%) |
| $5,000 to $7,499 | 22 (2.6%) | 29 (4.7%) |
| $7,500 to $9,999 | 25 (3.0%) | 8 (1.3%) |
| $10,000 to $12,499 | 18 (2.1%) | 34 (5.5%) |
| $12,500 to $14,999 | 21 (2.5%) | 37 (5.9%) |
| $15,000 to $17,499 | 90 (10.7%) | 19 (3.0%) |
| $17,500 to $19,999 | 25 (3.0%) | 5 (0.8%) |
| $20,000 to $22,499 | 0 (0.0%) | 0 (0.0%) |
| $22,500 to $24,999 | 42 (5.0%) | 48 (7.7%) |
| $25,000 to $29,999 | 137 (16.3%) | 27 (4.3%) |
| $30,000 to $34,999 | 51 (6.1%) | 27 (4.3%) |
| $35,000 to $39,999 | 21 (2.5%) | 50 (8.0%) |
| $40,000 to $44,999 | 26 (3.1%) | 52 (8.4%) |
| $45,000 to $49,999 | 79 (9.4%) | 37 (5.9%) |
| $50,000 to $54,999 | 37 (4.4%) | 53 (8.5%) |
| $55,000 to $64,999 | 57 (6.8%) | 37 (5.9%) |
| $65,000 to $74,999 | 29 (3.5%) | 15 (2.4%) |
| $75,000 to $99,999 | 59 (7.0%) | 65 (10.4%) |
| $100,000+ | 27 (3.2%) | 12 (1.9%) |
| Total | 840 (100.0%) | 622 (100.0%) |
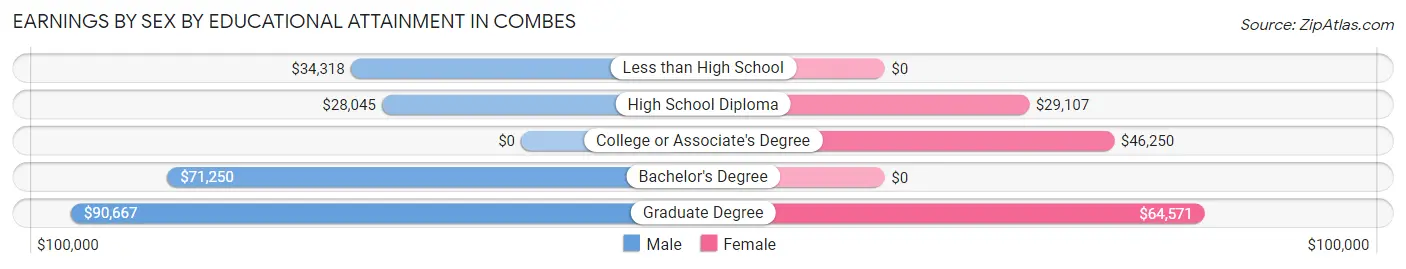
Earnings by Sex by Educational Attainment in Combes
Average earnings in Combes are $33,258 for men and $40,324 for women, a difference of 17.5%. Men with an educational attainment of graduate degree enjoy the highest average annual earnings of $90,667, while those with high school diploma education earn the least with $28,045. Women with an educational attainment of graduate degree earn the most with the average annual earnings of $64,571, while those with high school diploma education have the smallest earnings of $29,107.
| Educational Attainment | Male Income | Female Income |
| Less than High School | $34,318 | $0 |
| High School Diploma | $28,045 | $29,107 |
| College or Associate's Degree | - | - |
| Bachelor's Degree | $71,250 | $0 |
| Graduate Degree | $90,667 | $64,571 |
| Total | $33,258 | $40,324 |
Family Income in Combes
Family Income Brackets in Combes
According to the Combes family income data, there are 158 families falling into the $50,000 to $74,999 income range, which is the most common income bracket and makes up 22.0% of all families. Conversely, the less than $10,000 income bracket is the least frequent group with only 20 families (2.8%) belonging to this category.
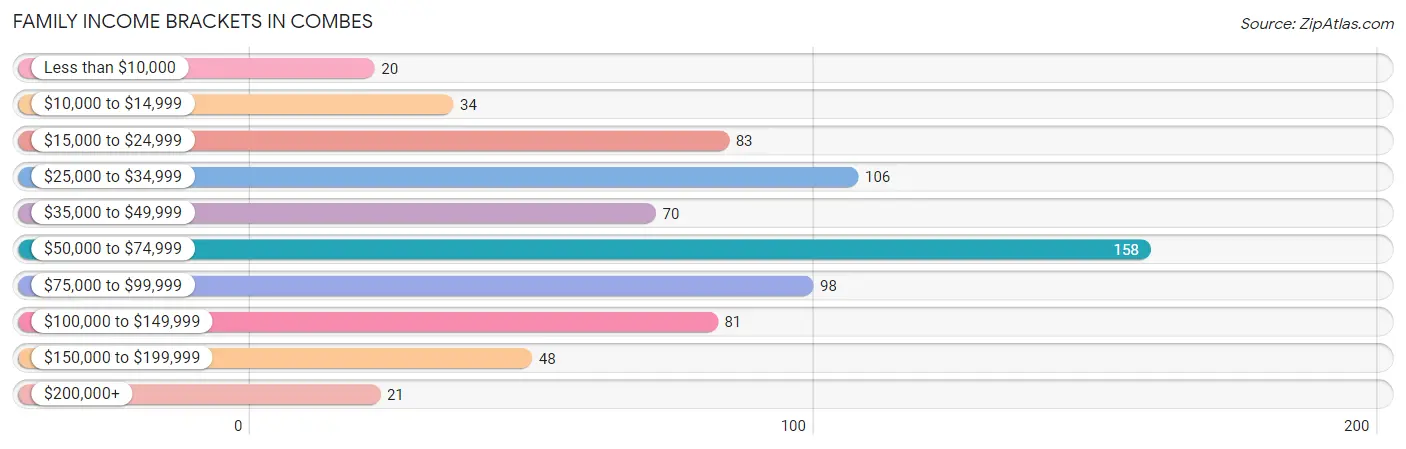
| Income Bracket | # Families | % Families |
| Less than $10,000 | 20 | 2.8% |
| $10,000 to $14,999 | 34 | 4.7% |
| $15,000 to $24,999 | 83 | 11.5% |
| $25,000 to $34,999 | 106 | 14.7% |
| $35,000 to $49,999 | 70 | 9.7% |
| $50,000 to $74,999 | 158 | 22.0% |
| $75,000 to $99,999 | 98 | 13.6% |
| $100,000 to $149,999 | 81 | 11.3% |
| $150,000 to $199,999 | 48 | 6.7% |
| $200,000+ | 21 | 2.9% |
Family Income by Famaliy Size in Combes
4-person families (153 | 21.3%) account for the highest median family income in Combes with $89,926 per family, while 4-person families (153 | 21.3%) have the highest median income of $22,482 per family member.
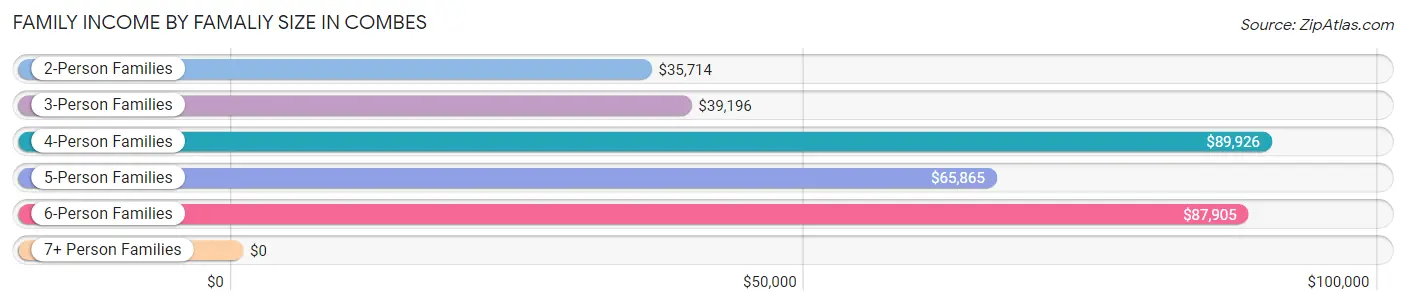
| Income Bracket | # Families | Median Income |
| 2-Person Families | 318 (44.2%) | $35,714 |
| 3-Person Families | 103 (14.3%) | $39,196 |
| 4-Person Families | 153 (21.3%) | $89,926 |
| 5-Person Families | 63 (8.8%) | $65,865 |
| 6-Person Families | 74 (10.3%) | $87,905 |
| 7+ Person Families | 8 (1.1%) | $0 |
| Total | 719 (100.0%) | $59,440 |
Family Income by Number of Earners in Combes
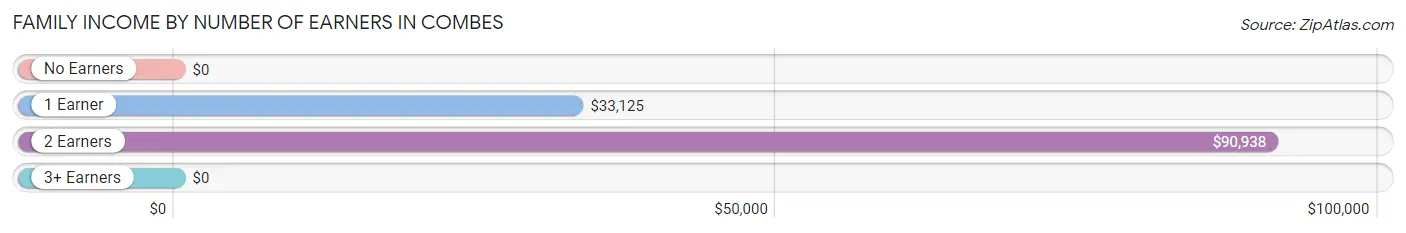
| Number of Earners | # Families | Median Income |
| No Earners | 86 (12.0%) | $0 |
| 1 Earner | 274 (38.1%) | $33,125 |
| 2 Earners | 279 (38.8%) | $90,938 |
| 3+ Earners | 80 (11.1%) | $0 |
| Total | 719 (100.0%) | $59,440 |
Household Income in Combes
Household Income Brackets in Combes
With 203 households falling in the category, the $25,000 to $34,999 income range is the most frequent in Combes, accounting for 18.7% of all households. In contrast, only 21 households (1.9%) fall into the $200,000+ income bracket, making it the least populous group.
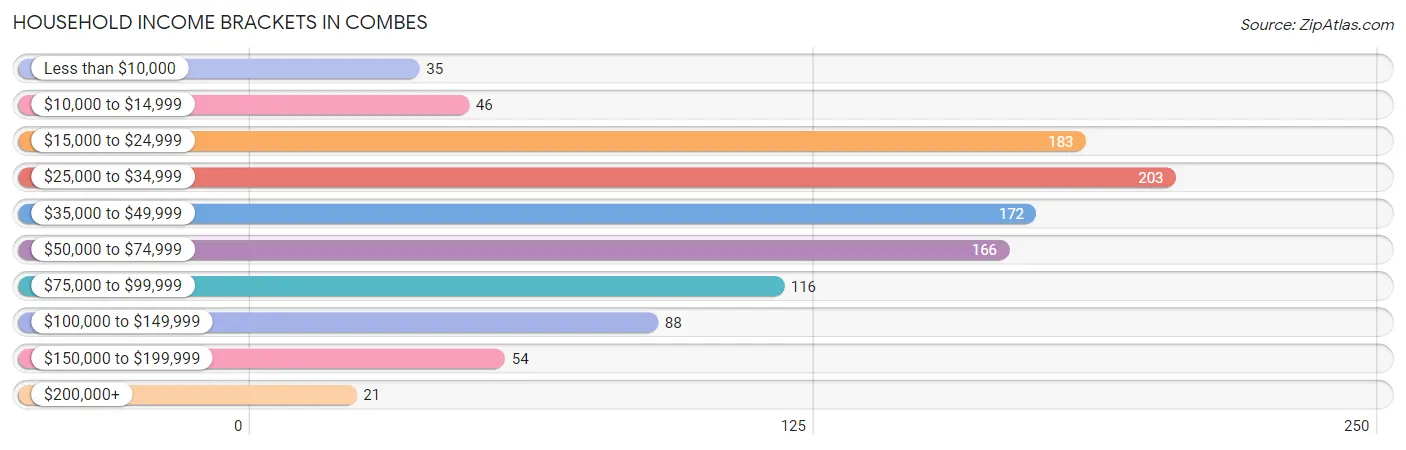
| Income Bracket | # Households | % Households |
| Less than $10,000 | 35 | 3.2% |
| $10,000 to $14,999 | 46 | 4.2% |
| $15,000 to $24,999 | 183 | 16.9% |
| $25,000 to $34,999 | 203 | 18.7% |
| $35,000 to $49,999 | 172 | 15.9% |
| $50,000 to $74,999 | 166 | 15.3% |
| $75,000 to $99,999 | 116 | 10.7% |
| $100,000 to $149,999 | 88 | 8.1% |
| $150,000 to $199,999 | 54 | 5.0% |
| $200,000+ | 21 | 1.9% |
Household Income by Householder Age in Combes
The median household income in Combes is $39,555, with the highest median household income of $62,611 found in the 45 to 64 years age bracket for the primary householder. A total of 452 households (41.7%) fall into this category. Meanwhile, the 15 to 24 years age bracket for the primary householder has the lowest median household income of $0, with 6 households (0.5%) in this group.
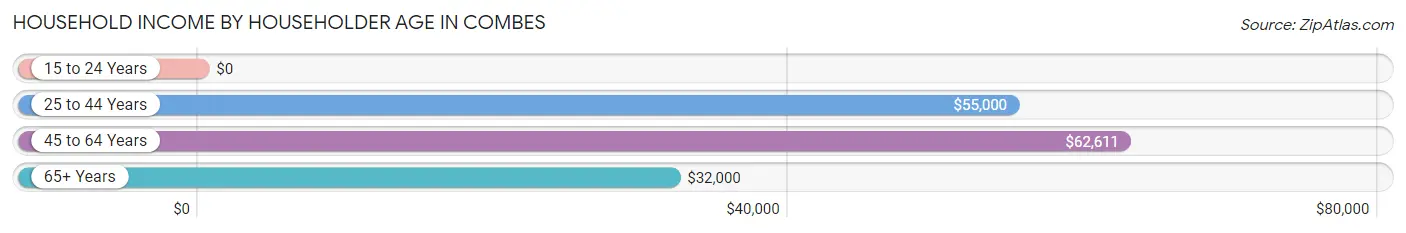
| Income Bracket | # Households | Median Income |
| 15 to 24 Years | 6 (0.5%) | $0 |
| 25 to 44 Years | 260 (24.0%) | $55,000 |
| 45 to 64 Years | 452 (41.7%) | $62,611 |
| 65+ Years | 366 (33.8%) | $32,000 |
| Total | 1,084 (100.0%) | $39,555 |
Poverty in Combes
Income Below Poverty by Sex and Age in Combes
With 18.2% poverty level for males and 16.9% for females among the residents of Combes, 12 to 14 year old males and under 5 year old females are the most vulnerable to poverty, with 88 males (60.3%) and 48 females (47.1%) in their respective age groups living below the poverty level.
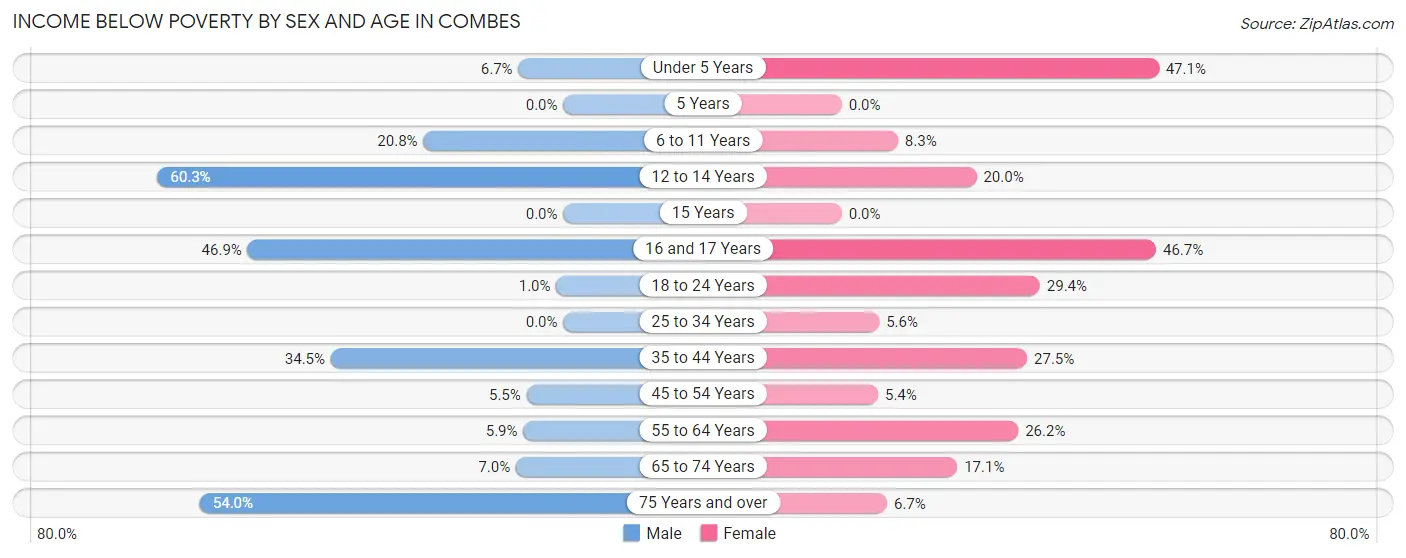
| Age Bracket | Male | Female |
| Under 5 Years | 2 (6.7%) | 48 (47.1%) |
| 5 Years | 0 (0.0%) | 0 (0.0%) |
| 6 to 11 Years | 16 (20.8%) | 20 (8.3%) |
| 12 to 14 Years | 88 (60.3%) | 8 (20.0%) |
| 15 Years | 0 (0.0%) | 0 (0.0%) |
| 16 and 17 Years | 30 (46.9%) | 7 (46.7%) |
| 18 to 24 Years | 2 (1.0%) | 45 (29.4%) |
| 25 to 34 Years | 0 (0.0%) | 5 (5.6%) |
| 35 to 44 Years | 68 (34.5%) | 41 (27.5%) |
| 45 to 54 Years | 9 (5.4%) | 14 (5.4%) |
| 55 to 64 Years | 13 (5.9%) | 49 (26.2%) |
| 65 to 74 Years | 13 (7.0%) | 18 (17.1%) |
| 75 Years and over | 34 (54.0%) | 9 (6.7%) |
| Total | 275 (18.2%) | 264 (16.9%) |
Income Above Poverty by Sex and Age in Combes
According to the poverty statistics in Combes, males aged 15 years and females aged 5 years are the age groups that are most secure financially, with 100.0% of males and 100.0% of females in these age groups living above the poverty line.
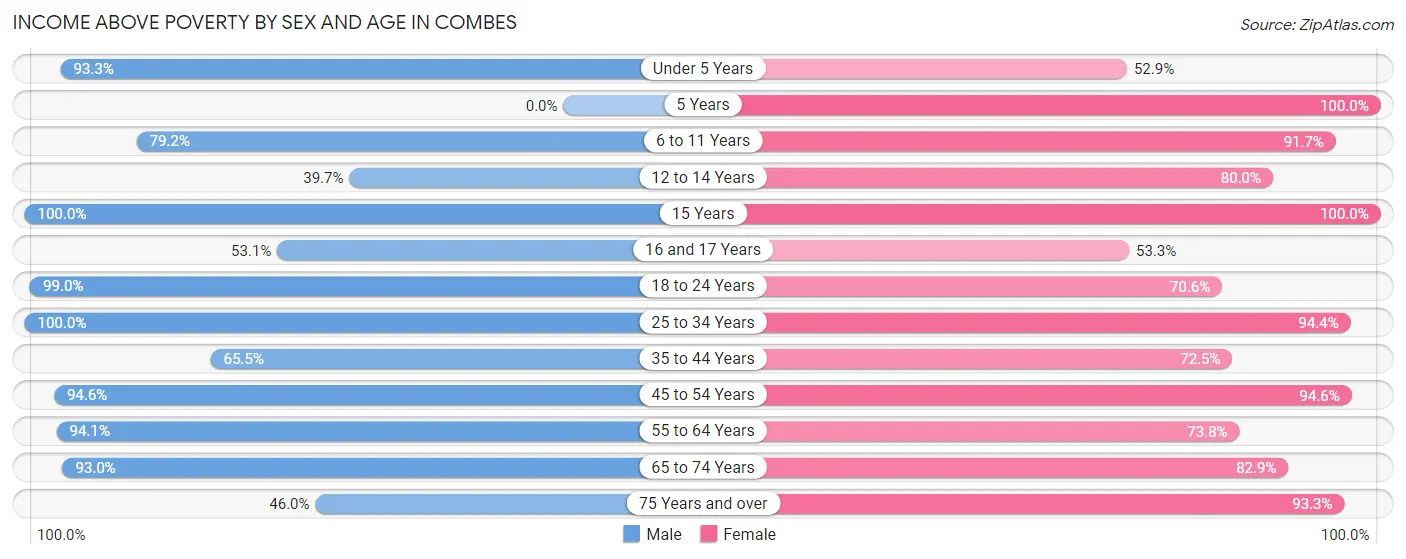
| Age Bracket | Male | Female |
| Under 5 Years | 28 (93.3%) | 54 (52.9%) |
| 5 Years | 0 (0.0%) | 38 (100.0%) |
| 6 to 11 Years | 61 (79.2%) | 220 (91.7%) |
| 12 to 14 Years | 58 (39.7%) | 32 (80.0%) |
| 15 Years | 41 (100.0%) | 54 (100.0%) |
| 16 and 17 Years | 34 (53.1%) | 8 (53.3%) |
| 18 to 24 Years | 190 (99.0%) | 108 (70.6%) |
| 25 to 34 Years | 134 (100.0%) | 85 (94.4%) |
| 35 to 44 Years | 129 (65.5%) | 108 (72.5%) |
| 45 to 54 Years | 156 (94.6%) | 246 (94.6%) |
| 55 to 64 Years | 206 (94.1%) | 138 (73.8%) |
| 65 to 74 Years | 172 (93.0%) | 87 (82.9%) |
| 75 Years and over | 29 (46.0%) | 125 (93.3%) |
| Total | 1,238 (81.8%) | 1,303 (83.2%) |
Income Below Poverty Among Married-Couple Families in Combes
The poverty statistics for married-couple families in Combes show that 12.0% or 46 of the total 384 families live below the poverty line. Families with no children have the highest poverty rate of 19.8%, comprising of 35 families. On the other hand, families with 3 or 4 children have the lowest poverty rate of 0.0%, which includes 0 families.
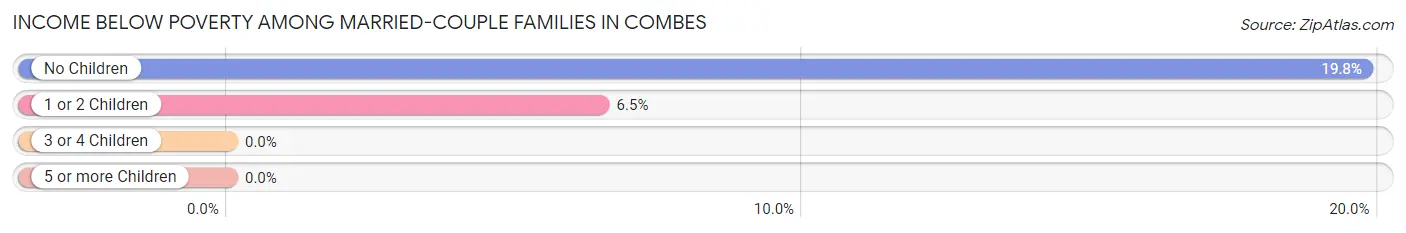
| Children | Above Poverty | Below Poverty |
| No Children | 142 (80.2%) | 35 (19.8%) |
| 1 or 2 Children | 159 (93.5%) | 11 (6.5%) |
| 3 or 4 Children | 37 (100.0%) | 0 (0.0%) |
| 5 or more Children | 0 (0.0%) | 0 (0.0%) |
| Total | 338 (88.0%) | 46 (12.0%) |
Income Below Poverty Among Single-Parent Households in Combes
According to the poverty data in Combes, 41.6% or 57 single-father households and 23.2% or 46 single-mother households are living below the poverty line. Among single-father households, those with 1 or 2 children have the highest poverty rate, with 50 households (100.0%) experiencing poverty. Likewise, among single-mother households, those with 3 or 4 children have the highest poverty rate, with 37 households (100.0%) falling below the poverty line.
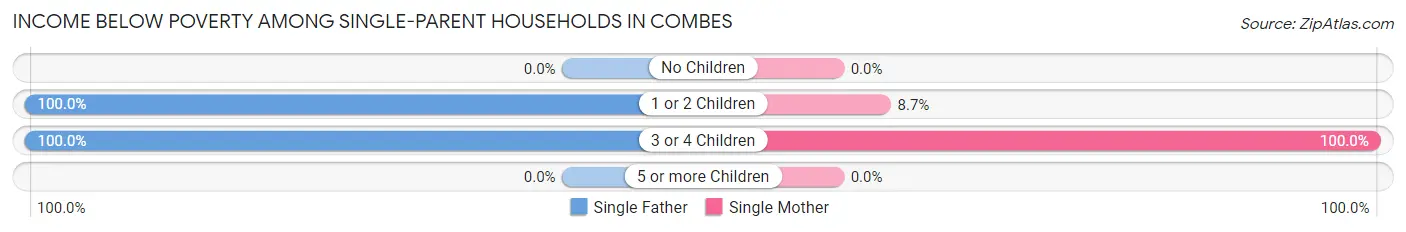
| Children | Single Father | Single Mother |
| No Children | 0 (0.0%) | 0 (0.0%) |
| 1 or 2 Children | 50 (100.0%) | 9 (8.7%) |
| 3 or 4 Children | 7 (100.0%) | 37 (100.0%) |
| 5 or more Children | 0 (0.0%) | 0 (0.0%) |
| Total | 57 (41.6%) | 46 (23.2%) |
Income Below Poverty Among Married-Couple vs Single-Parent Households in Combes
The poverty data for Combes shows that 46 of the married-couple family households (12.0%) and 103 of the single-parent households (30.7%) are living below the poverty level. Within the married-couple family households, those with no children have the highest poverty rate, with 35 households (19.8%) falling below the poverty line. Among the single-parent households, those with 3 or 4 children have the highest poverty rate, with 44 household (100.0%) living below poverty.
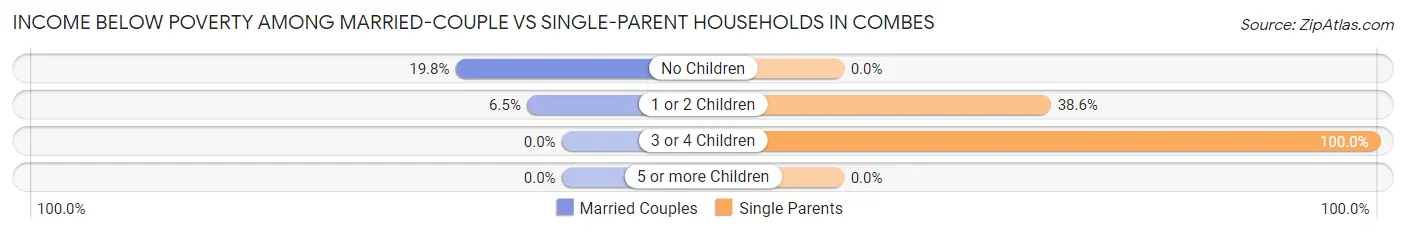
| Children | Married-Couple Families | Single-Parent Households |
| No Children | 35 (19.8%) | 0 (0.0%) |
| 1 or 2 Children | 11 (6.5%) | 59 (38.6%) |
| 3 or 4 Children | 0 (0.0%) | 44 (100.0%) |
| 5 or more Children | 0 (0.0%) | 0 (0.0%) |
| Total | 46 (12.0%) | 103 (30.7%) |
Race in Combes
The most populous races in Combes are Hispanic or Latino (2,597 | 82.7%), White / Caucasian (1,841 | 58.6%), and Two or more Races (897 | 28.6%).
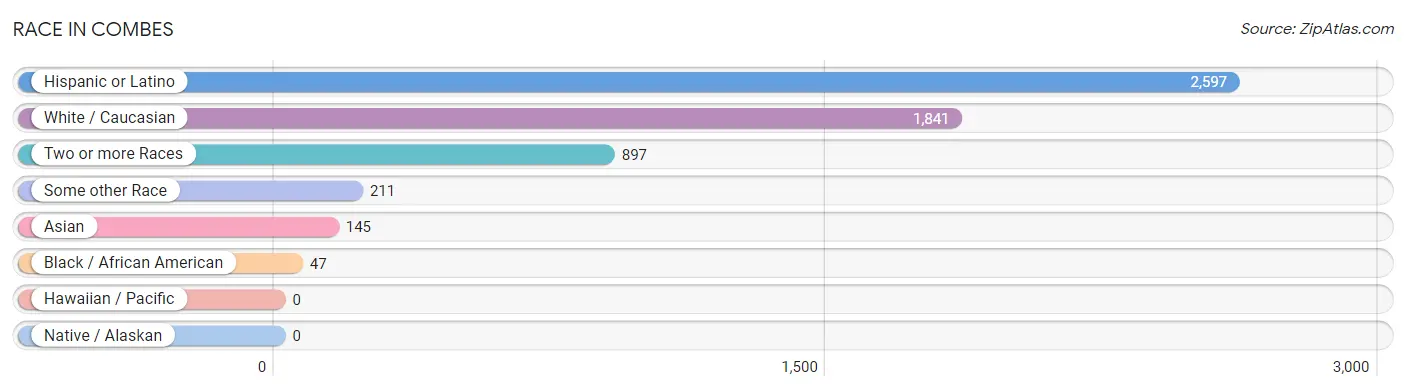
| Race | # Population | % Population |
| Asian | 145 | 4.6% |
| Black / African American | 47 | 1.5% |
| Hawaiian / Pacific | 0 | 0.0% |
| Hispanic or Latino | 2,597 | 82.7% |
| Native / Alaskan | 0 | 0.0% |
| White / Caucasian | 1,841 | 58.6% |
| Two or more Races | 897 | 28.6% |
| Some other Race | 211 | 6.7% |
| Total | 3,141 | 100.0% |
Ancestry in Combes
The most populous ancestries reported in Combes are Mexican (2,513 | 80.0%), Sri Lankan (95 | 3.0%), English (71 | 2.3%), German (61 | 1.9%), and Scandinavian (38 | 1.2%), together accounting for 88.4% of all Combes residents.
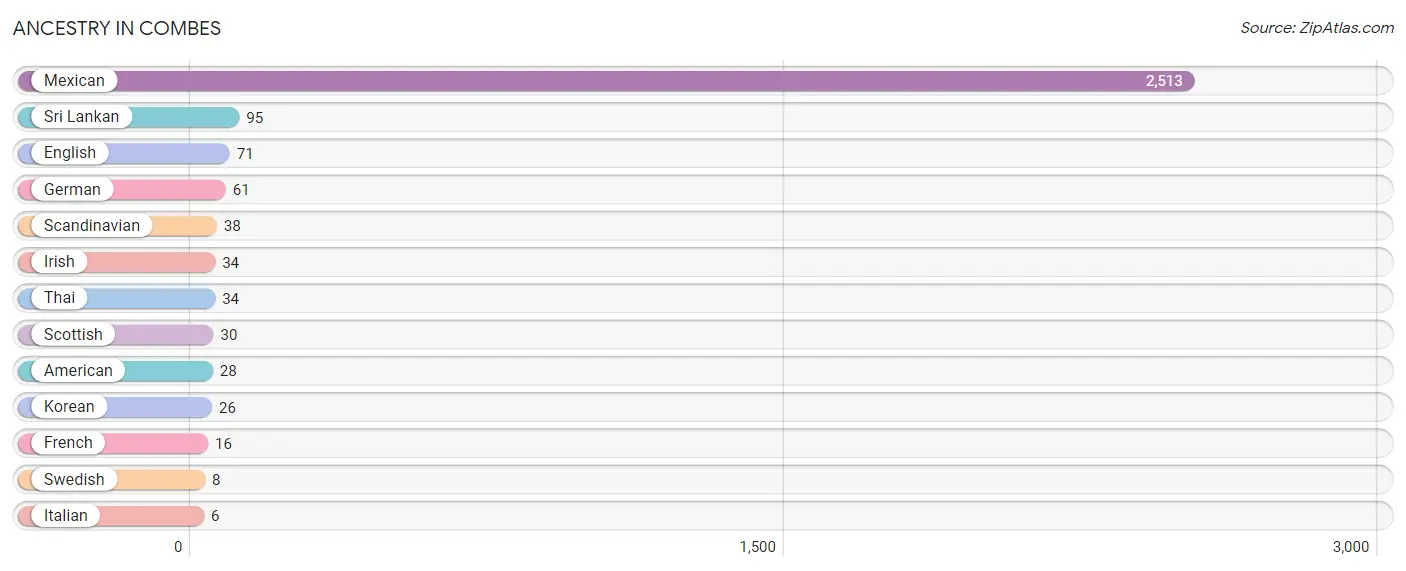
| Ancestry | # Population | % Population |
| American | 28 | 0.9% |
| English | 71 | 2.3% |
| French | 16 | 0.5% |
| German | 61 | 1.9% |
| Irish | 34 | 1.1% |
| Italian | 6 | 0.2% |
| Korean | 26 | 0.8% |
| Mexican | 2,513 | 80.0% |
| Scandinavian | 38 | 1.2% |
| Scottish | 30 | 1.0% |
| Sri Lankan | 95 | 3.0% |
| Swedish | 8 | 0.3% |
| Thai | 34 | 1.1% | View All 13 Rows |
Immigrants in Combes
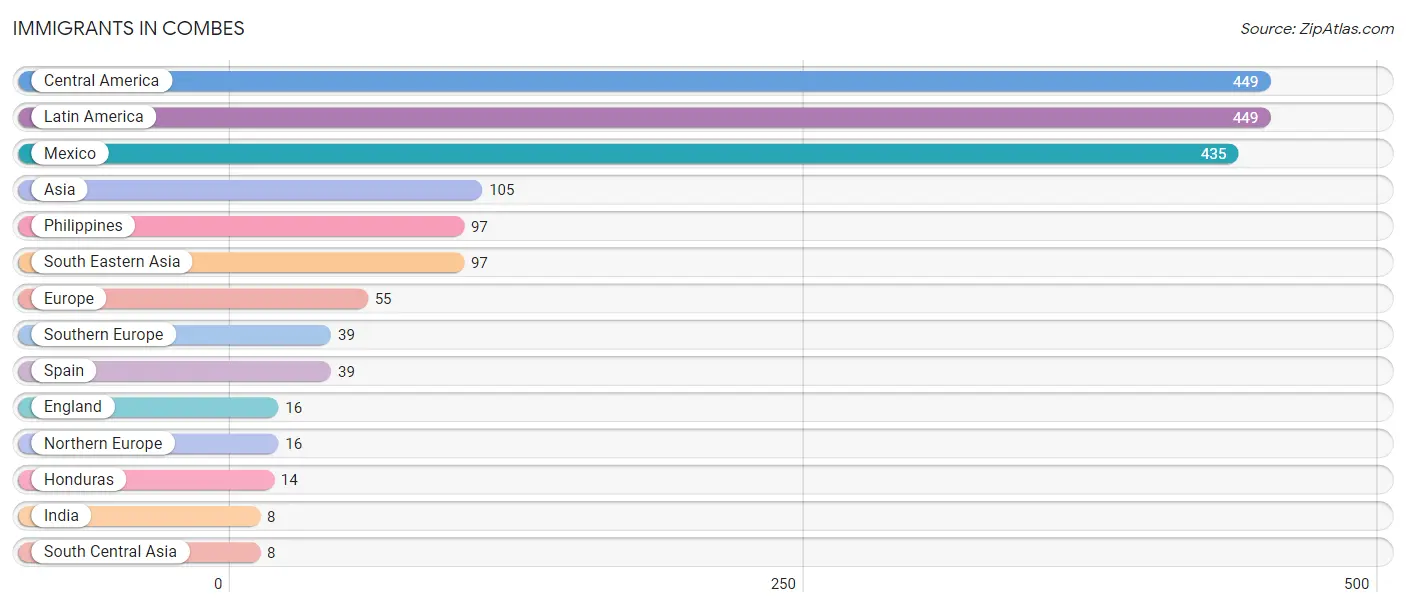
The most numerous immigrant groups reported in Combes came from Central America (449 | 14.3%), Latin America (449 | 14.3%), Mexico (435 | 13.9%), Asia (105 | 3.3%), and Philippines (97 | 3.1%), together accounting for 48.9% of all Combes residents.
| Immigration Origin | # Population | % Population |
| Asia | 105 | 3.3% |
| Central America | 449 | 14.3% |
| England | 16 | 0.5% |
| Europe | 55 | 1.8% |
| Honduras | 14 | 0.4% |
| India | 8 | 0.3% |
| Latin America | 449 | 14.3% |
| Mexico | 435 | 13.9% |
| Northern Europe | 16 | 0.5% |
| Philippines | 97 | 3.1% |
| South Central Asia | 8 | 0.3% |
| South Eastern Asia | 97 | 3.1% |
| Southern Europe | 39 | 1.2% |
| Spain | 39 | 1.2% | View All 14 Rows |
Sex and Age in Combes
Sex and Age in Combes
The most populous age groups in Combes are 10 to 14 Years (172 | 11.4%) for men and 5 to 9 Years (198 | 12.2%) for women.
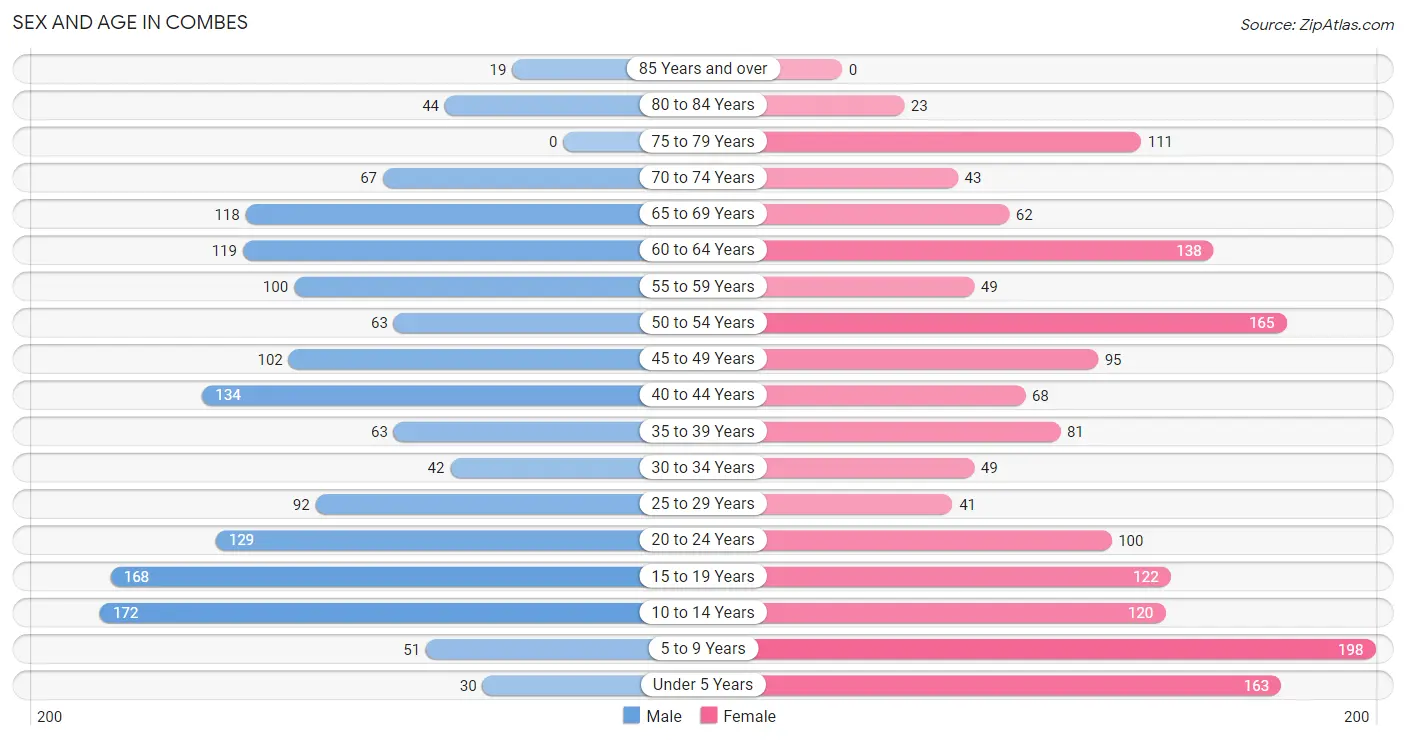
| Age Bracket | Male | Female |
| Under 5 Years | 30 (2.0%) | 163 (10.0%) |
| 5 to 9 Years | 51 (3.4%) | 198 (12.2%) |
| 10 to 14 Years | 172 (11.4%) | 120 (7.4%) |
| 15 to 19 Years | 168 (11.1%) | 122 (7.5%) |
| 20 to 24 Years | 129 (8.5%) | 100 (6.1%) |
| 25 to 29 Years | 92 (6.1%) | 41 (2.5%) |
| 30 to 34 Years | 42 (2.8%) | 49 (3.0%) |
| 35 to 39 Years | 63 (4.2%) | 81 (5.0%) |
| 40 to 44 Years | 134 (8.9%) | 68 (4.2%) |
| 45 to 49 Years | 102 (6.7%) | 95 (5.8%) |
| 50 to 54 Years | 63 (4.2%) | 165 (10.1%) |
| 55 to 59 Years | 100 (6.6%) | 49 (3.0%) |
| 60 to 64 Years | 119 (7.9%) | 138 (8.5%) |
| 65 to 69 Years | 118 (7.8%) | 62 (3.8%) |
| 70 to 74 Years | 67 (4.4%) | 43 (2.6%) |
| 75 to 79 Years | 0 (0.0%) | 111 (6.8%) |
| 80 to 84 Years | 44 (2.9%) | 23 (1.4%) |
| 85 Years and over | 19 (1.3%) | 0 (0.0%) |
| Total | 1,513 (100.0%) | 1,628 (100.0%) |
Families and Households in Combes
Median Family Size in Combes
The median family size in Combes is 3.66 persons per family, with married-couple families (384 | 53.4%) accounting for the largest median family size of 4.02 persons per family. On the other hand, single male/father families (137 | 19.1%) represent the smallest median family size with 2.54 persons per family.
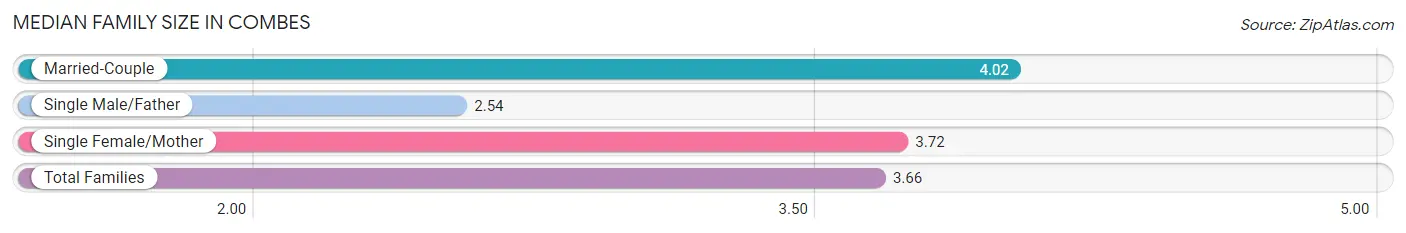
| Family Type | # Families | Family Size |
| Married-Couple | 384 (53.4%) | 4.02 |
| Single Male/Father | 137 (19.1%) | 2.54 |
| Single Female/Mother | 198 (27.5%) | 3.72 |
| Total Families | 719 (100.0%) | 3.66 |
Median Household Size in Combes
The median household size in Combes is 2.90 persons per household, with married-couple households (384 | 35.4%) accounting for the largest median household size of 4.02 persons per household. non-family households (365 | 33.7%) represent the smallest median household size with 1.32 persons per household.
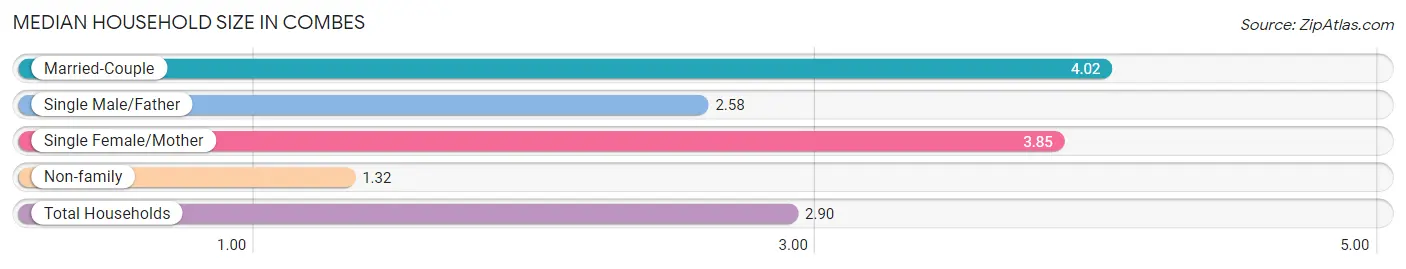
| Household Type | # Households | Household Size |
| Married-Couple | 384 (35.4%) | 4.02 |
| Single Male/Father | 137 (12.6%) | 2.58 |
| Single Female/Mother | 198 (18.3%) | 3.85 |
| Non-family | 365 (33.7%) | 1.32 |
| Total Households | 1,084 (100.0%) | 2.90 |
Household Size by Marriage Status in Combes
Out of a total of 1,084 households in Combes, 719 (66.3%) are family households, while 365 (33.7%) are nonfamily households. The most numerous type of family households are 2-person households, comprising 312, and the most common type of nonfamily households are 1-person households, comprising 301.
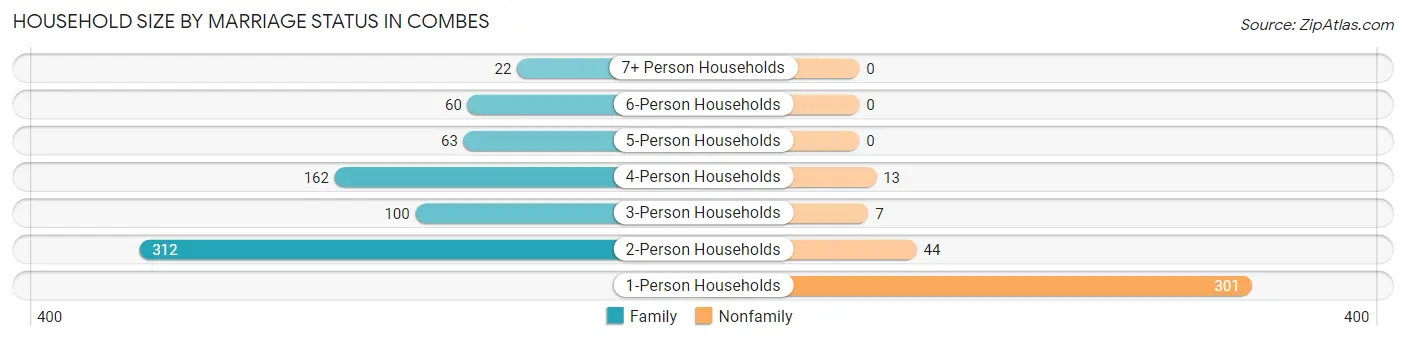
| Household Size | Family Households | Nonfamily Households |
| 1-Person Households | - | 301 (27.8%) |
| 2-Person Households | 312 (28.8%) | 44 (4.1%) |
| 3-Person Households | 100 (9.2%) | 7 (0.6%) |
| 4-Person Households | 162 (14.9%) | 13 (1.2%) |
| 5-Person Households | 63 (5.8%) | 0 (0.0%) |
| 6-Person Households | 60 (5.5%) | 0 (0.0%) |
| 7+ Person Households | 22 (2.0%) | 0 (0.0%) |
| Total | 719 (66.3%) | 365 (33.7%) |
Female Fertility in Combes
Fertility by Age in Combes
Average fertility rate in Combes is 20.0 births per 1,000 women. Women in the age bracket of 20 to 34 years have the highest fertility rate with 26.0 births per 1,000 women. Women in the age bracket of 35 to 50 years acount for 58.3% of all women with births.
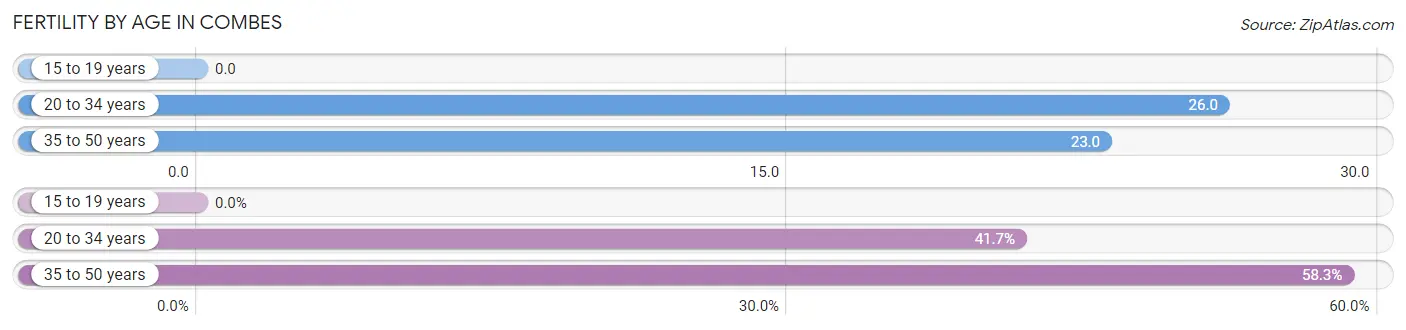
| Age Bracket | Women with Births | Births / 1,000 Women |
| 15 to 19 years | 0 (0.0%) | 0.0 |
| 20 to 34 years | 5 (41.7%) | 26.0 |
| 35 to 50 years | 7 (58.3%) | 23.0 |
| Total | 12 (100.0%) | 20.0 |
Fertility by Age by Marriage Status in Combes
58.3% of women with births (12) in Combes are married. The highest percentage of unmarried women with births falls into 20 to 34 years age bracket with 100.0% of them unmarried at the time of birth, while the lowest percentage of unmarried women with births belong to 35 to 50 years age bracket with 0.0% of them unmarried.
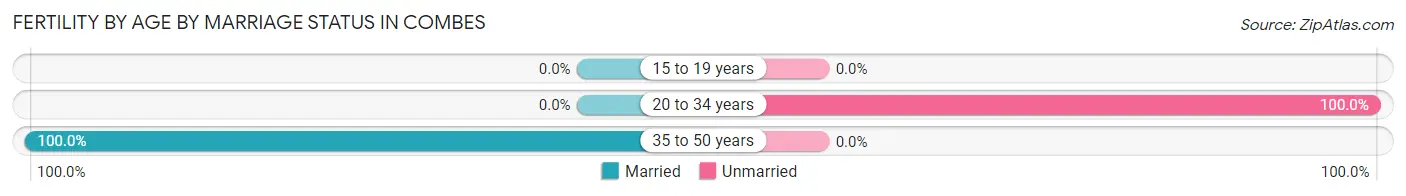
| Age Bracket | Married | Unmarried |
| 15 to 19 years | 0 (0.0%) | 0 (0.0%) |
| 20 to 34 years | 0 (0.0%) | 5 (100.0%) |
| 35 to 50 years | 7 (100.0%) | 0 (0.0%) |
| Total | 7 (58.3%) | 5 (41.7%) |
Fertility by Education in Combes
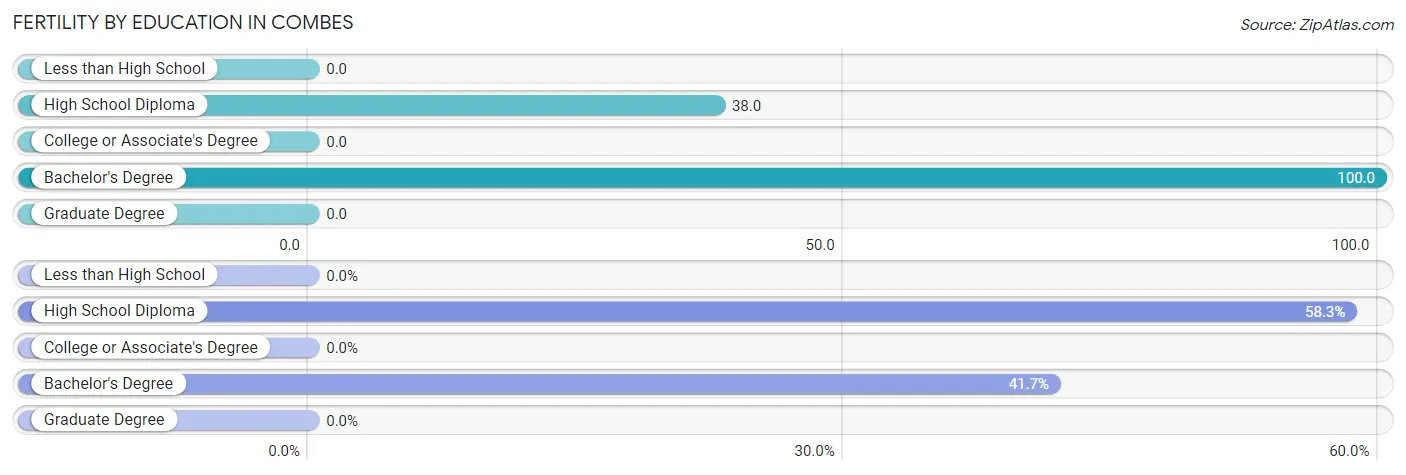
| Educational Attainment | Women with Births | Births / 1,000 Women |
| Less than High School | 0 (0.0%) | 0.0 |
| High School Diploma | 7 (58.3%) | 38.0 |
| College or Associate's Degree | 0 (0.0%) | 0.0 |
| Bachelor's Degree | 5 (41.7%) | 100.0 |
| Graduate Degree | 0 (0.0%) | 0.0 |
| Total | 12 (100.0%) | 20.0 |
Fertility by Education by Marriage Status in Combes
41.7% of women with births in Combes are unmarried. Women with the educational attainment of high school diploma are most likely to be married with 100.0% of them married at childbirth, while women with the educational attainment of bachelor's degree are least likely to be married with 100.0% of them unmarried at childbirth.
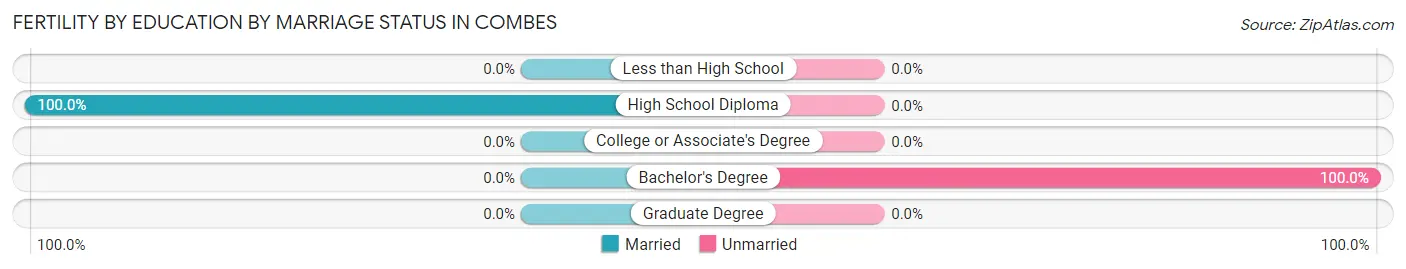
| Educational Attainment | Married | Unmarried |
| Less than High School | 0 (0.0%) | 0 (0.0%) |
| High School Diploma | 7 (100.0%) | 0 (0.0%) |
| College or Associate's Degree | 0 (0.0%) | 0 (0.0%) |
| Bachelor's Degree | 0 (0.0%) | 5 (100.0%) |
| Graduate Degree | 0 (0.0%) | 0 (0.0%) |
| Total | 7 (58.3%) | 5 (41.7%) |
Employment Characteristics in Combes
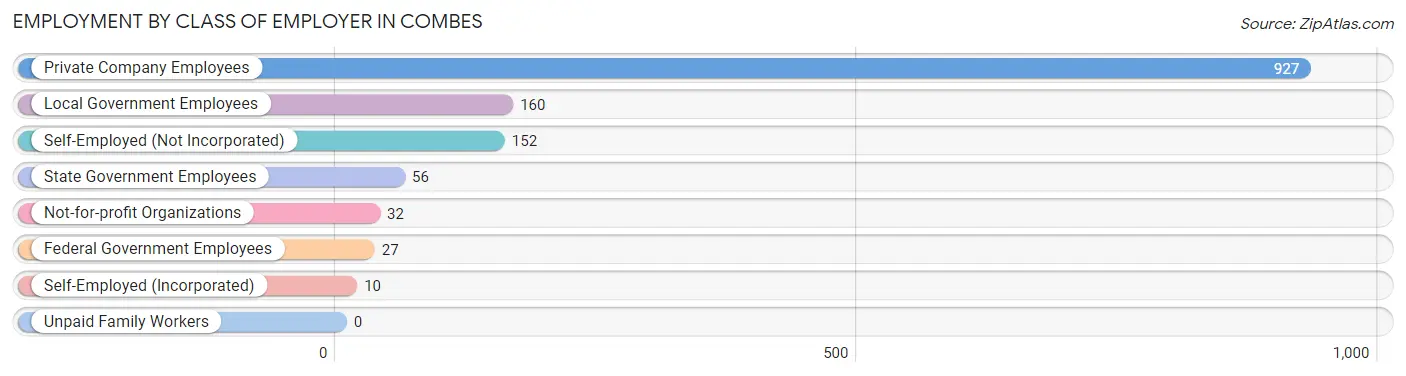
Employment by Class of Employer in Combes
Among the 1,364 employed individuals in Combes, private company employees (927 | 68.0%), local government employees (160 | 11.7%), and self-employed (not incorporated) (152 | 11.1%) make up the most common classes of employment.
| Employer Class | # Employees | % Employees |
| Private Company Employees | 927 | 68.0% |
| Self-Employed (Incorporated) | 10 | 0.7% |
| Self-Employed (Not Incorporated) | 152 | 11.1% |
| Not-for-profit Organizations | 32 | 2.4% |
| Local Government Employees | 160 | 11.7% |
| State Government Employees | 56 | 4.1% |
| Federal Government Employees | 27 | 2.0% |
| Unpaid Family Workers | 0 | 0.0% |
| Total | 1,364 | 100.0% |
Employment Status by Age in Combes
According to the labor force statistics for Combes, out of the total population over 16 years of age (2,312), 61.0% or 1,410 individuals are in the labor force, with 1.7% or 24 of them unemployed. The age group with the highest labor force participation rate is 30 to 34 years, with 82.4% or 75 individuals in the labor force. Within the labor force, the 60 to 64 years age range has the highest percentage of unemployed individuals, with 5.4% or 8 of them being unemployed.
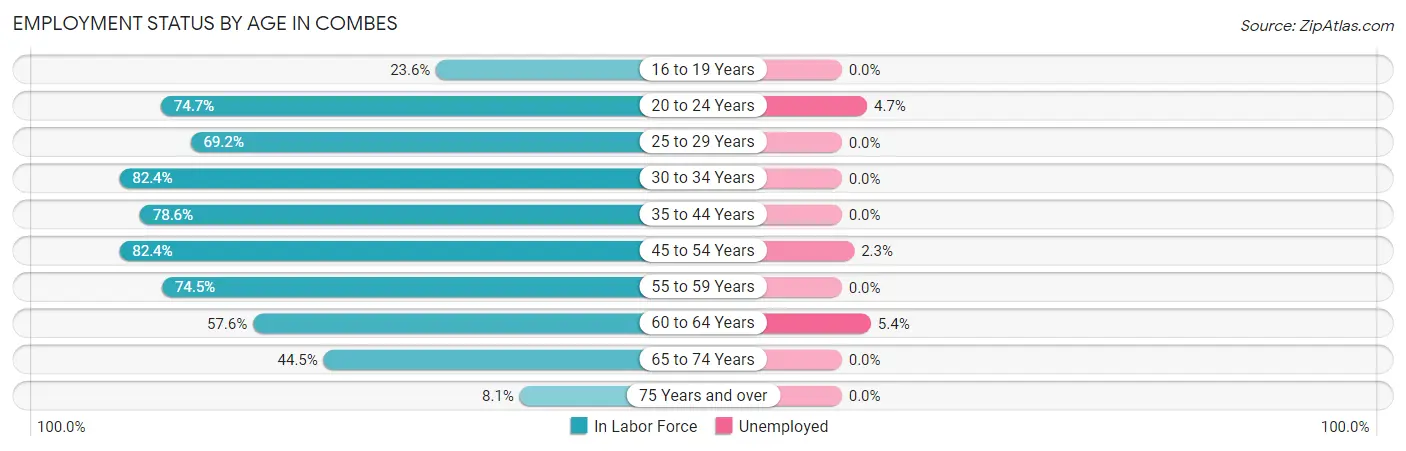
| Age Bracket | In Labor Force | Unemployed |
| 16 to 19 Years | 46 (23.6%) | 0 (0.0%) |
| 20 to 24 Years | 171 (74.7%) | 8 (4.7%) |
| 25 to 29 Years | 92 (69.2%) | 0 (0.0%) |
| 30 to 34 Years | 75 (82.4%) | 0 (0.0%) |
| 35 to 44 Years | 272 (78.6%) | 0 (0.0%) |
| 45 to 54 Years | 350 (82.4%) | 8 (2.3%) |
| 55 to 59 Years | 111 (74.5%) | 0 (0.0%) |
| 60 to 64 Years | 148 (57.6%) | 8 (5.4%) |
| 65 to 74 Years | 129 (44.5%) | 0 (0.0%) |
| 75 Years and over | 16 (8.1%) | 0 (0.0%) |
| Total | 1,410 (61.0%) | 24 (1.7%) |
Employment Status by Educational Attainment in Combes
According to labor force statistics for Combes, 74.8% of individuals (1,048) out of the total population between 25 and 64 years of age (1,401) are in the labor force, with 1.5% or 16 of them being unemployed. The group with the highest labor force participation rate are those with the educational attainment of bachelor's degree or higher, with 95.5% or 193 individuals in the labor force. Within the labor force, individuals with bachelor's degree or higher education have the highest percentage of unemployment, with 4.1% or 8 of them being unemployed.
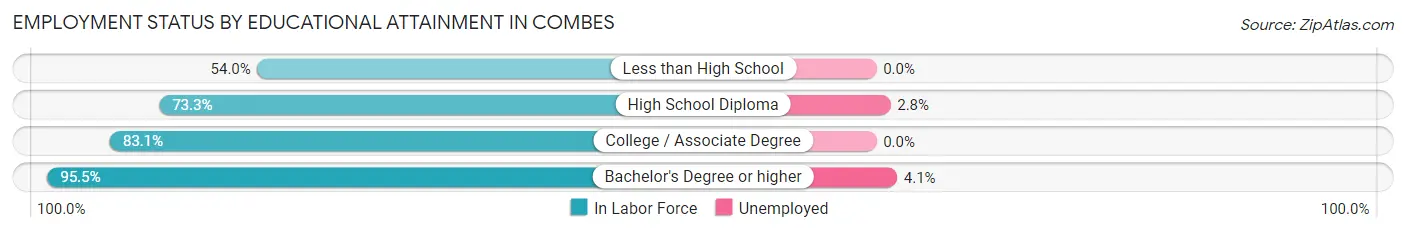
| Educational Attainment | In Labor Force | Unemployed |
| Less than High School | 191 (54.0%) | 0 (0.0%) |
| High School Diploma | 286 (73.3%) | 11 (2.8%) |
| College / Associate Degree | 378 (83.1%) | 0 (0.0%) |
| Bachelor's Degree or higher | 193 (95.5%) | 8 (4.1%) |
| Total | 1,048 (74.8%) | 21 (1.5%) |
Employment Occupations by Sex in Combes
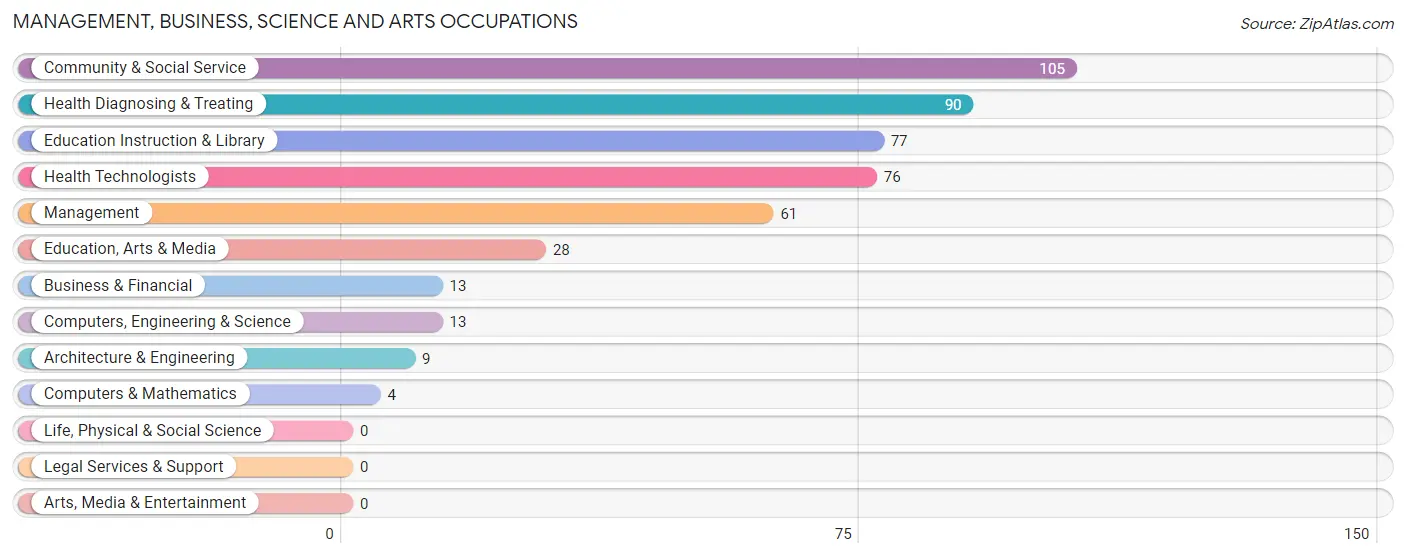
Management, Business, Science and Arts Occupations
The most common Management, Business, Science and Arts occupations in Combes are Community & Social Service (105 | 7.6%), Health Diagnosing & Treating (90 | 6.5%), Education Instruction & Library (77 | 5.6%), Health Technologists (76 | 5.5%), and Management (61 | 4.4%).
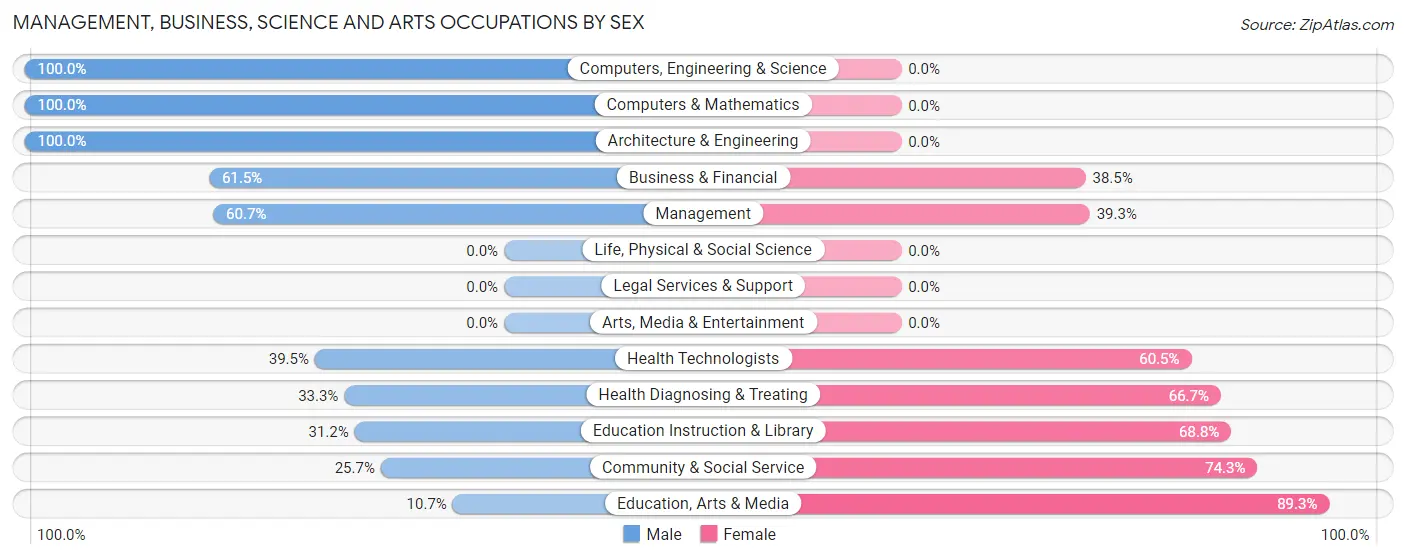
Management, Business, Science and Arts Occupations by Sex
Within the Management, Business, Science and Arts occupations in Combes, the most male-oriented occupations are Computers, Engineering & Science (100.0%), Computers & Mathematics (100.0%), and Architecture & Engineering (100.0%), while the most female-oriented occupations are Education, Arts & Media (89.3%), Community & Social Service (74.3%), and Education Instruction & Library (68.8%).
| Occupation | Male | Female |
| Management | 37 (60.7%) | 24 (39.3%) |
| Business & Financial | 8 (61.5%) | 5 (38.5%) |
| Computers, Engineering & Science | 13 (100.0%) | 0 (0.0%) |
| Computers & Mathematics | 4 (100.0%) | 0 (0.0%) |
| Architecture & Engineering | 9 (100.0%) | 0 (0.0%) |
| Life, Physical & Social Science | 0 (0.0%) | 0 (0.0%) |
| Community & Social Service | 27 (25.7%) | 78 (74.3%) |
| Education, Arts & Media | 3 (10.7%) | 25 (89.3%) |
| Legal Services & Support | 0 (0.0%) | 0 (0.0%) |
| Education Instruction & Library | 24 (31.2%) | 53 (68.8%) |
| Arts, Media & Entertainment | 0 (0.0%) | 0 (0.0%) |
| Health Diagnosing & Treating | 30 (33.3%) | 60 (66.7%) |
| Health Technologists | 30 (39.5%) | 46 (60.5%) |
| Total (Category) | 115 (40.8%) | 167 (59.2%) |
| Total (Overall) | 800 (57.7%) | 586 (42.3%) |
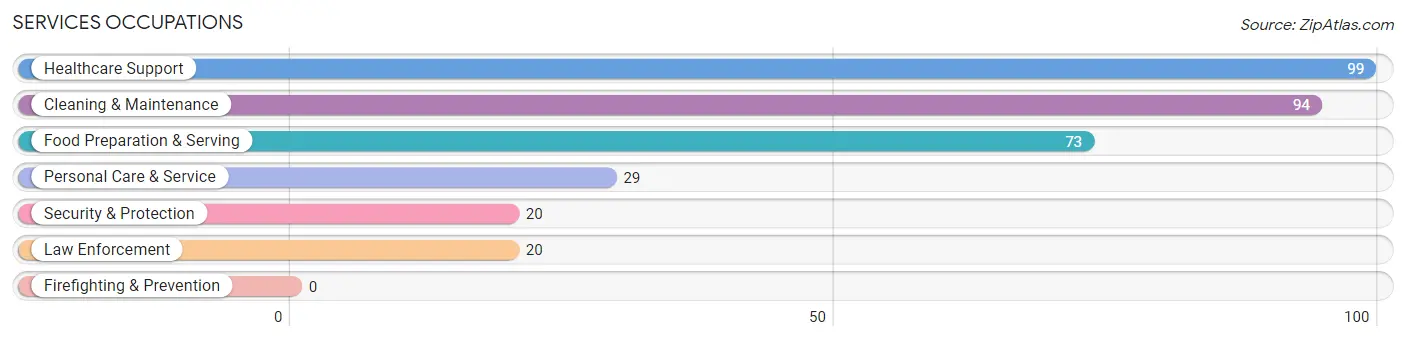
Services Occupations
The most common Services occupations in Combes are Healthcare Support (99 | 7.1%), Cleaning & Maintenance (94 | 6.8%), Food Preparation & Serving (73 | 5.3%), Personal Care & Service (29 | 2.1%), and Security & Protection (20 | 1.4%).
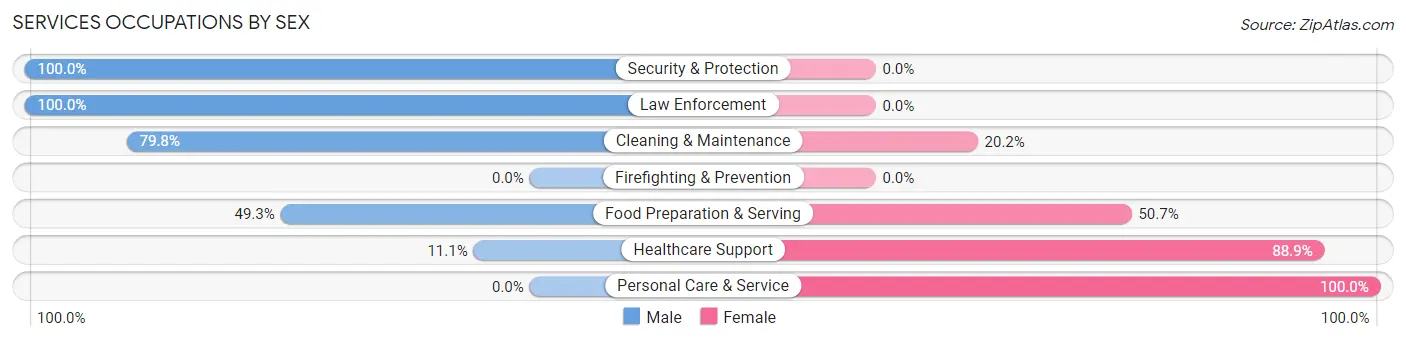
Services Occupations by Sex
Within the Services occupations in Combes, the most male-oriented occupations are Security & Protection (100.0%), Law Enforcement (100.0%), and Cleaning & Maintenance (79.8%), while the most female-oriented occupations are Personal Care & Service (100.0%), Healthcare Support (88.9%), and Food Preparation & Serving (50.7%).
| Occupation | Male | Female |
| Healthcare Support | 11 (11.1%) | 88 (88.9%) |
| Security & Protection | 20 (100.0%) | 0 (0.0%) |
| Firefighting & Prevention | 0 (0.0%) | 0 (0.0%) |
| Law Enforcement | 20 (100.0%) | 0 (0.0%) |
| Food Preparation & Serving | 36 (49.3%) | 37 (50.7%) |
| Cleaning & Maintenance | 75 (79.8%) | 19 (20.2%) |
| Personal Care & Service | 0 (0.0%) | 29 (100.0%) |
| Total (Category) | 142 (45.1%) | 173 (54.9%) |
| Total (Overall) | 800 (57.7%) | 586 (42.3%) |
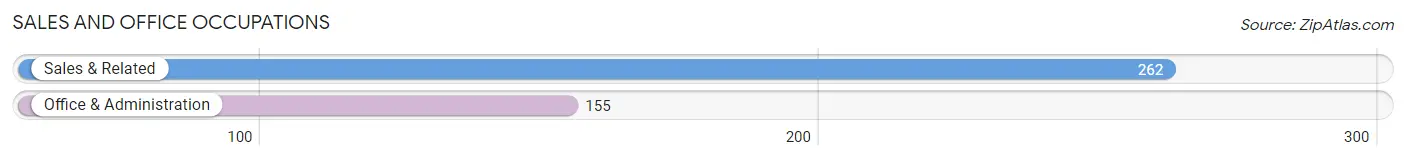
Sales and Office Occupations
The most common Sales and Office occupations in Combes are Sales & Related (262 | 18.9%), and Office & Administration (155 | 11.2%).
Sales and Office Occupations by Sex
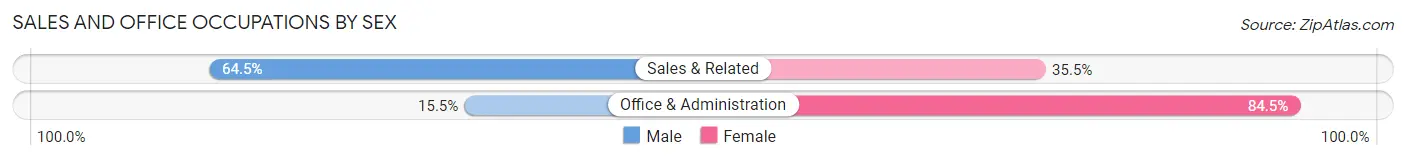
| Occupation | Male | Female |
| Sales & Related | 169 (64.5%) | 93 (35.5%) |
| Office & Administration | 24 (15.5%) | 131 (84.5%) |
| Total (Category) | 193 (46.3%) | 224 (53.7%) |
| Total (Overall) | 800 (57.7%) | 586 (42.3%) |
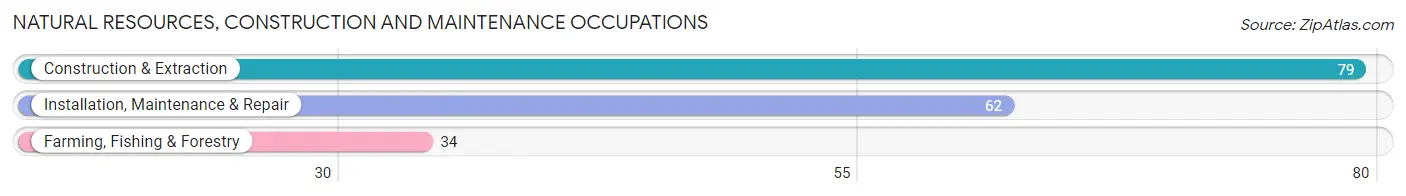
Natural Resources, Construction and Maintenance Occupations
The most common Natural Resources, Construction and Maintenance occupations in Combes are Construction & Extraction (79 | 5.7%), Installation, Maintenance & Repair (62 | 4.5%), and Farming, Fishing & Forestry (34 | 2.5%).
Natural Resources, Construction and Maintenance Occupations by Sex
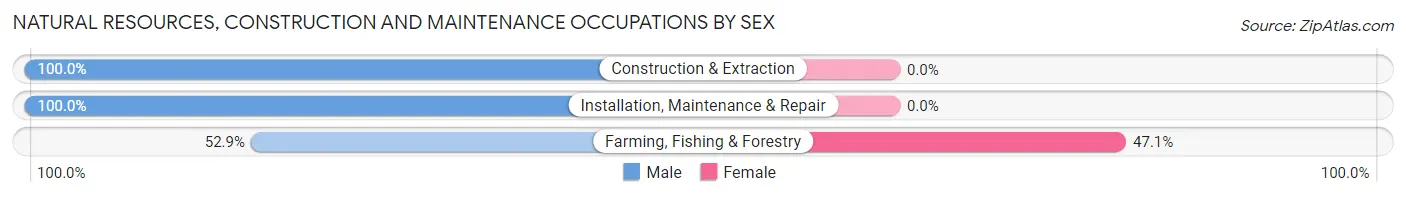
| Occupation | Male | Female |
| Farming, Fishing & Forestry | 18 (52.9%) | 16 (47.1%) |
| Construction & Extraction | 79 (100.0%) | 0 (0.0%) |
| Installation, Maintenance & Repair | 62 (100.0%) | 0 (0.0%) |
| Total (Category) | 159 (90.9%) | 16 (9.1%) |
| Total (Overall) | 800 (57.7%) | 586 (42.3%) |
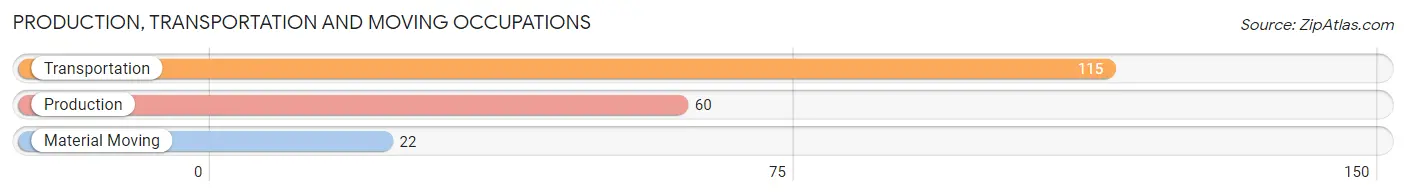
Production, Transportation and Moving Occupations
The most common Production, Transportation and Moving occupations in Combes are Transportation (115 | 8.3%), Production (60 | 4.3%), and Material Moving (22 | 1.6%).
Production, Transportation and Moving Occupations by Sex
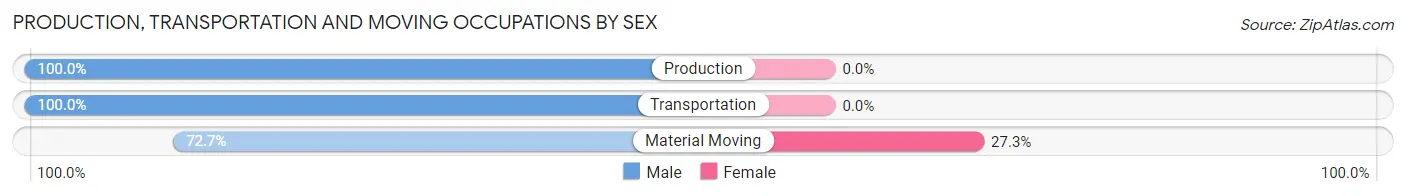
| Occupation | Male | Female |
| Production | 60 (100.0%) | 0 (0.0%) |
| Transportation | 115 (100.0%) | 0 (0.0%) |
| Material Moving | 16 (72.7%) | 6 (27.3%) |
| Total (Category) | 191 (97.0%) | 6 (3.0%) |
| Total (Overall) | 800 (57.7%) | 586 (42.3%) |
Employment Industries by Sex in Combes
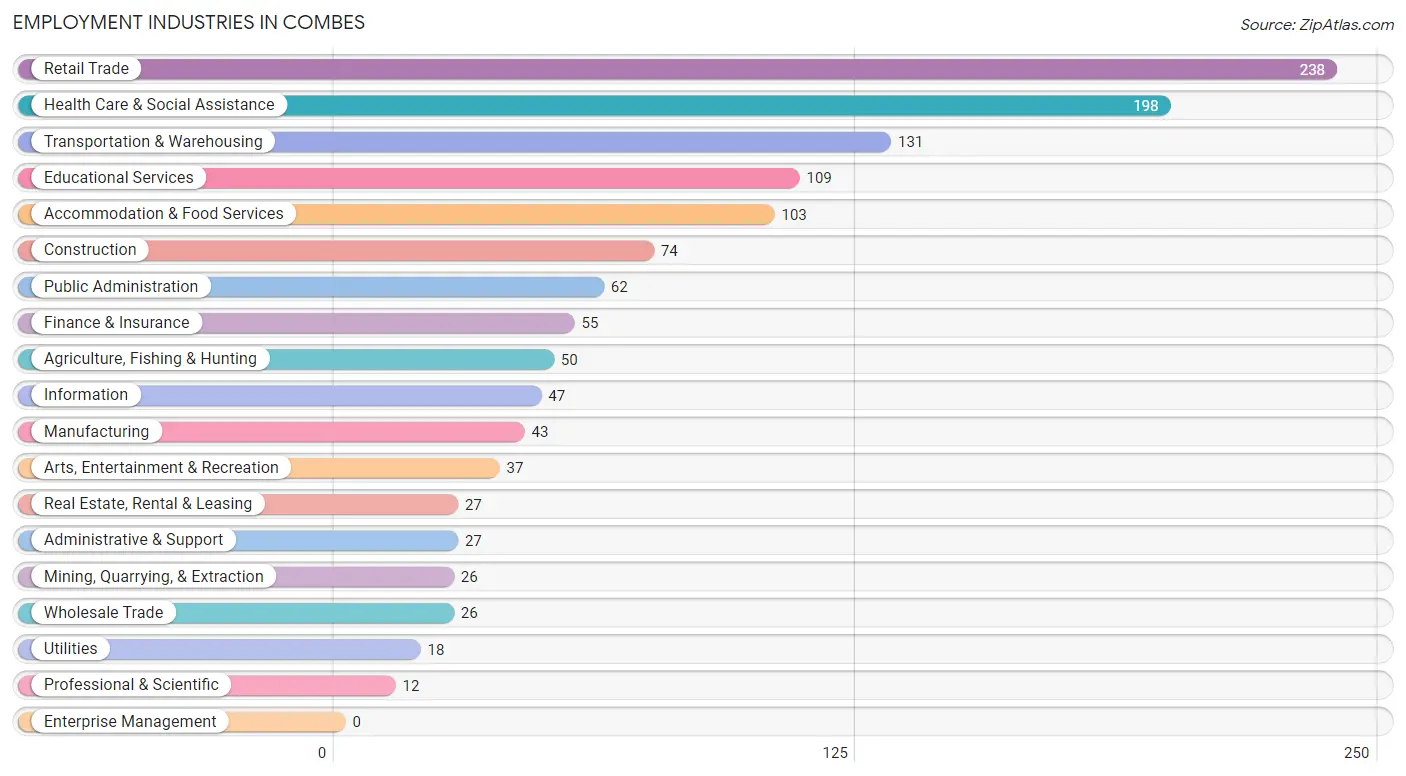
Employment Industries in Combes
The major employment industries in Combes include Retail Trade (238 | 17.2%), Health Care & Social Assistance (198 | 14.3%), Transportation & Warehousing (131 | 9.5%), Educational Services (109 | 7.9%), and Accommodation & Food Services (103 | 7.4%).
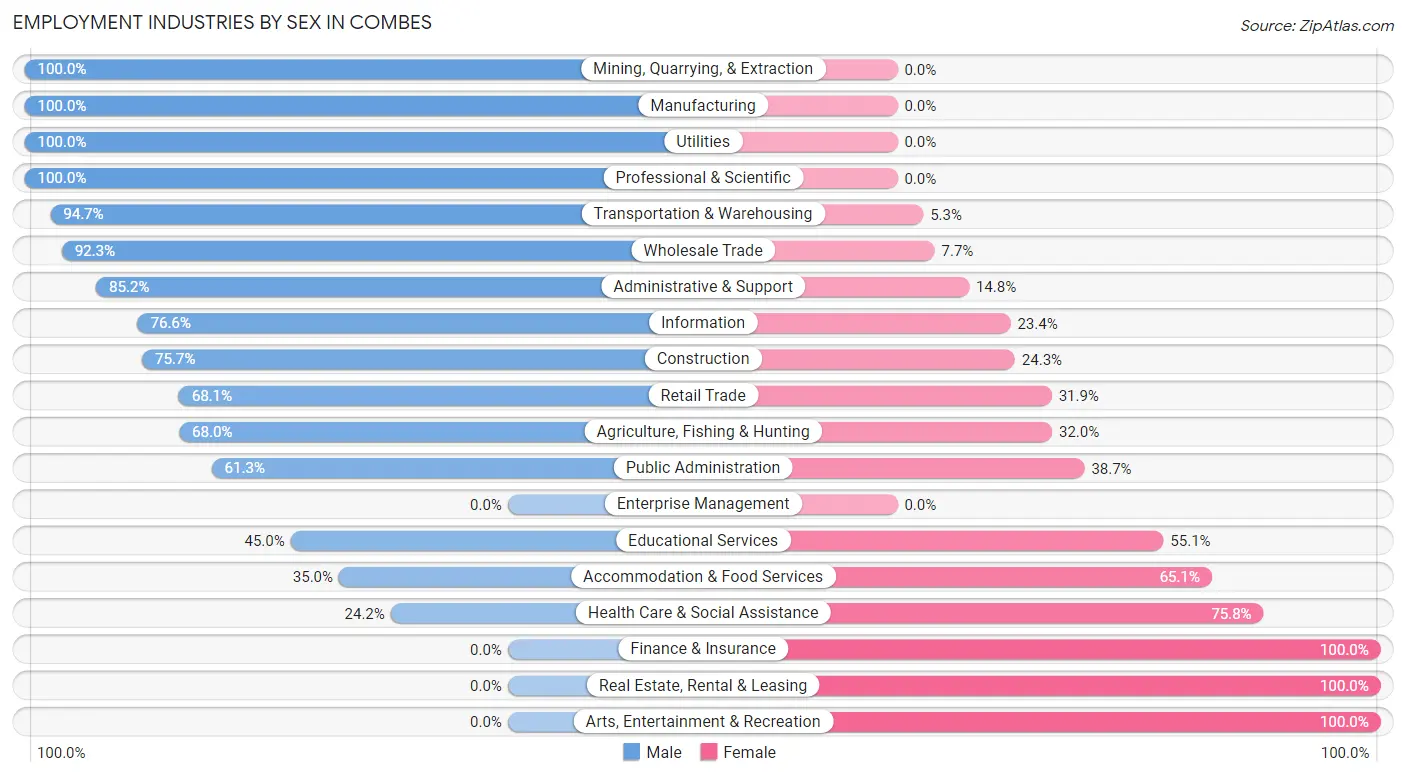
Employment Industries by Sex in Combes
The Combes industries that see more men than women are Mining, Quarrying, & Extraction (100.0%), Manufacturing (100.0%), and Utilities (100.0%), whereas the industries that tend to have a higher number of women are Finance & Insurance (100.0%), Real Estate, Rental & Leasing (100.0%), and Arts, Entertainment & Recreation (100.0%).
| Industry | Male | Female |
| Agriculture, Fishing & Hunting | 34 (68.0%) | 16 (32.0%) |
| Mining, Quarrying, & Extraction | 26 (100.0%) | 0 (0.0%) |
| Construction | 56 (75.7%) | 18 (24.3%) |
| Manufacturing | 43 (100.0%) | 0 (0.0%) |
| Wholesale Trade | 24 (92.3%) | 2 (7.7%) |
| Retail Trade | 162 (68.1%) | 76 (31.9%) |
| Transportation & Warehousing | 124 (94.7%) | 7 (5.3%) |
| Utilities | 18 (100.0%) | 0 (0.0%) |
| Information | 36 (76.6%) | 11 (23.4%) |
| Finance & Insurance | 0 (0.0%) | 55 (100.0%) |
| Real Estate, Rental & Leasing | 0 (0.0%) | 27 (100.0%) |
| Professional & Scientific | 12 (100.0%) | 0 (0.0%) |
| Enterprise Management | 0 (0.0%) | 0 (0.0%) |
| Administrative & Support | 23 (85.2%) | 4 (14.8%) |
| Educational Services | 49 (45.0%) | 60 (55.0%) |
| Health Care & Social Assistance | 48 (24.2%) | 150 (75.8%) |
| Arts, Entertainment & Recreation | 0 (0.0%) | 37 (100.0%) |
| Accommodation & Food Services | 36 (34.9%) | 67 (65.0%) |
| Public Administration | 38 (61.3%) | 24 (38.7%) |
| Total | 800 (57.7%) | 586 (42.3%) |
Education in Combes
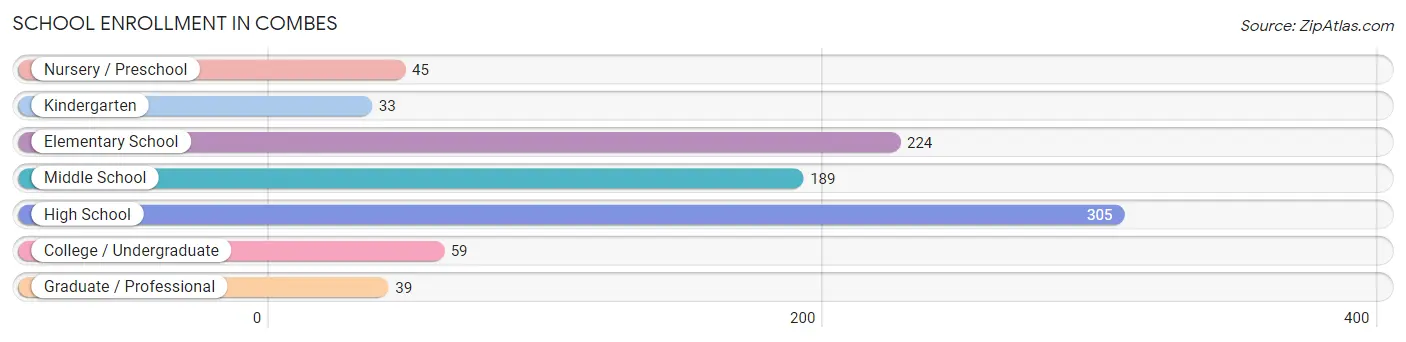
School Enrollment in Combes
The most common levels of schooling among the 894 students in Combes are high school (305 | 34.1%), elementary school (224 | 25.1%), and middle school (189 | 21.1%).
| School Level | # Students | % Students |
| Nursery / Preschool | 45 | 5.0% |
| Kindergarten | 33 | 3.7% |
| Elementary School | 224 | 25.1% |
| Middle School | 189 | 21.1% |
| High School | 305 | 34.1% |
| College / Undergraduate | 59 | 6.6% |
| Graduate / Professional | 39 | 4.4% |
| Total | 894 | 100.0% |
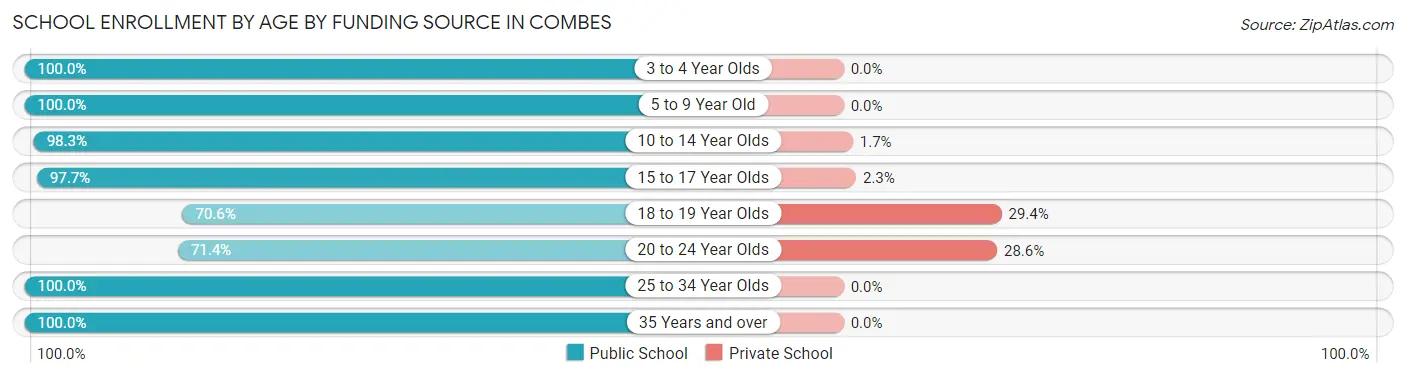
School Enrollment by Age by Funding Source in Combes
Out of a total of 894 students who are enrolled in schools in Combes, 41 (4.6%) attend a private institution, while the remaining 853 (95.4%) are enrolled in public schools. The age group of 18 to 19 year olds has the highest likelihood of being enrolled in private schools, with 20 (29.4% in the age bracket) enrolled. Conversely, the age group of 3 to 4 year olds has the lowest likelihood of being enrolled in a private school, with 30 (100.0% in the age bracket) attending a public institution.
| Age Bracket | Public School | Private School |
| 3 to 4 Year Olds | 30 (100.0%) | 0 (0.0%) |
| 5 to 9 Year Old | 249 (100.0%) | 0 (0.0%) |
| 10 to 14 Year Olds | 287 (98.3%) | 5 (1.7%) |
| 15 to 17 Year Olds | 170 (97.7%) | 4 (2.3%) |
| 18 to 19 Year Olds | 48 (70.6%) | 20 (29.4%) |
| 20 to 24 Year Olds | 30 (71.4%) | 12 (28.6%) |
| 25 to 34 Year Olds | 3 (100.0%) | 0 (0.0%) |
| 35 Years and over | 36 (100.0%) | 0 (0.0%) |
| Total | 853 (95.4%) | 41 (4.6%) |
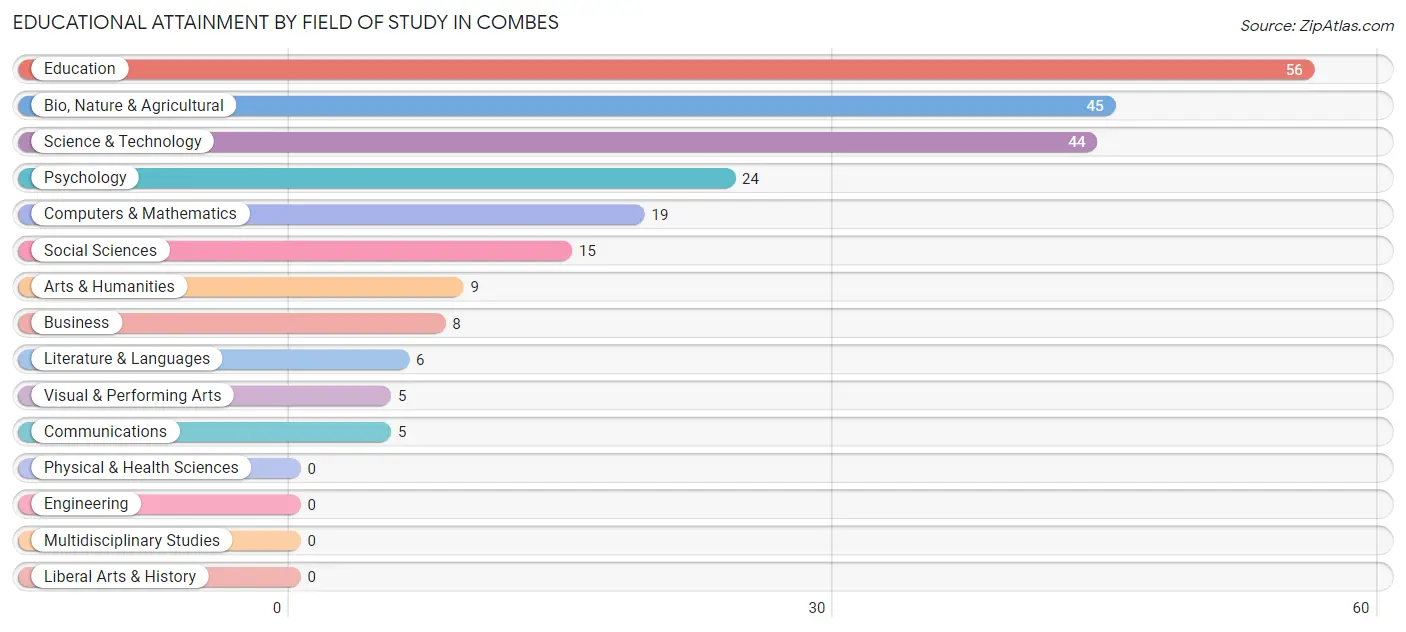
Educational Attainment by Field of Study in Combes
Education (56 | 23.7%), bio, nature & agricultural (45 | 19.1%), science & technology (44 | 18.6%), psychology (24 | 10.2%), and computers & mathematics (19 | 8.1%) are the most common fields of study among 236 individuals in Combes who have obtained a bachelor's degree or higher.
| Field of Study | # Graduates | % Graduates |
| Computers & Mathematics | 19 | 8.1% |
| Bio, Nature & Agricultural | 45 | 19.1% |
| Physical & Health Sciences | 0 | 0.0% |
| Psychology | 24 | 10.2% |
| Social Sciences | 15 | 6.4% |
| Engineering | 0 | 0.0% |
| Multidisciplinary Studies | 0 | 0.0% |
| Science & Technology | 44 | 18.6% |
| Business | 8 | 3.4% |
| Education | 56 | 23.7% |
| Literature & Languages | 6 | 2.5% |
| Liberal Arts & History | 0 | 0.0% |
| Visual & Performing Arts | 5 | 2.1% |
| Communications | 5 | 2.1% |
| Arts & Humanities | 9 | 3.8% |
| Total | 236 | 100.0% |
Transportation & Commute in Combes
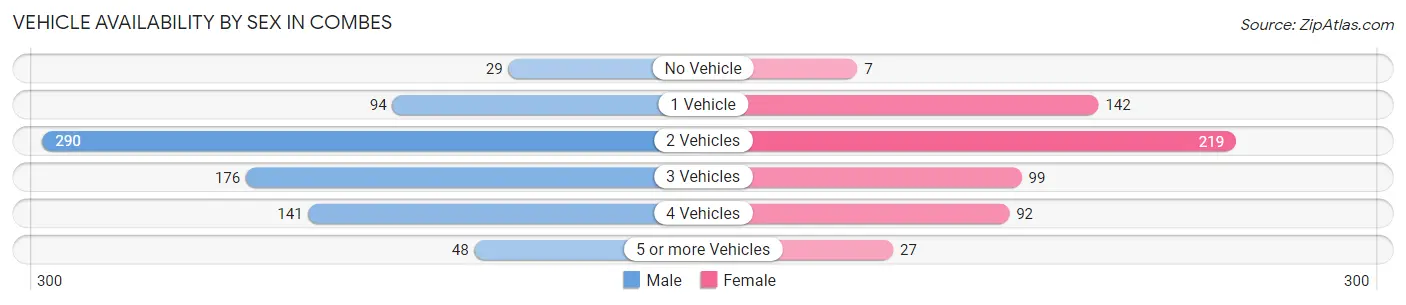
Vehicle Availability by Sex in Combes
The most prevalent vehicle ownership categories in Combes are males with 2 vehicles (290, accounting for 37.3%) and females with 2 vehicles (219, making up 49.5%).
| Vehicles Available | Male | Female |
| No Vehicle | 29 (3.7%) | 7 (1.2%) |
| 1 Vehicle | 94 (12.1%) | 142 (24.2%) |
| 2 Vehicles | 290 (37.3%) | 219 (37.4%) |
| 3 Vehicles | 176 (22.6%) | 99 (16.9%) |
| 4 Vehicles | 141 (18.1%) | 92 (15.7%) |
| 5 or more Vehicles | 48 (6.2%) | 27 (4.6%) |
| Total | 778 (100.0%) | 586 (100.0%) |
Commute Time in Combes
The most frequently occuring commute durations in Combes are 15 to 19 minutes (386 commuters, 30.7%), 10 to 14 minutes (273 commuters, 21.7%), and 5 to 9 minutes (190 commuters, 15.1%).
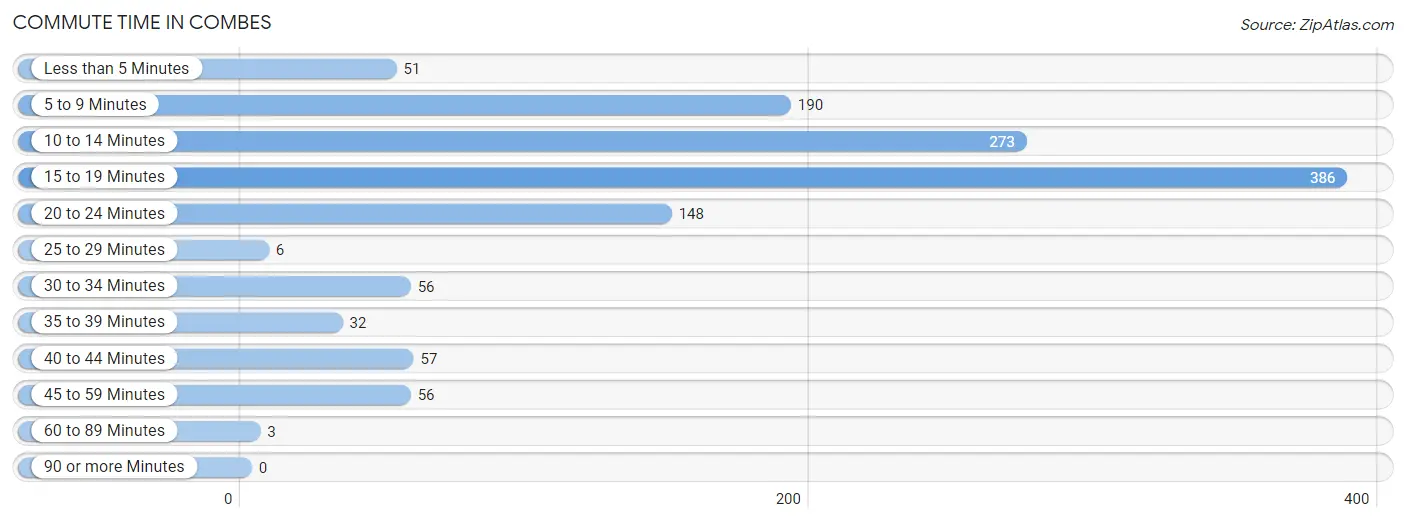
| Commute Time | # Commuters | % Commuters |
| Less than 5 Minutes | 51 | 4.1% |
| 5 to 9 Minutes | 190 | 15.1% |
| 10 to 14 Minutes | 273 | 21.7% |
| 15 to 19 Minutes | 386 | 30.7% |
| 20 to 24 Minutes | 148 | 11.8% |
| 25 to 29 Minutes | 6 | 0.5% |
| 30 to 34 Minutes | 56 | 4.4% |
| 35 to 39 Minutes | 32 | 2.5% |
| 40 to 44 Minutes | 57 | 4.5% |
| 45 to 59 Minutes | 56 | 4.4% |
| 60 to 89 Minutes | 3 | 0.2% |
| 90 or more Minutes | 0 | 0.0% |
Commute Time by Sex in Combes
The most common commute times in Combes are 15 to 19 minutes (220 commuters, 30.5%) for males and 15 to 19 minutes (166 commuters, 30.9%) for females.
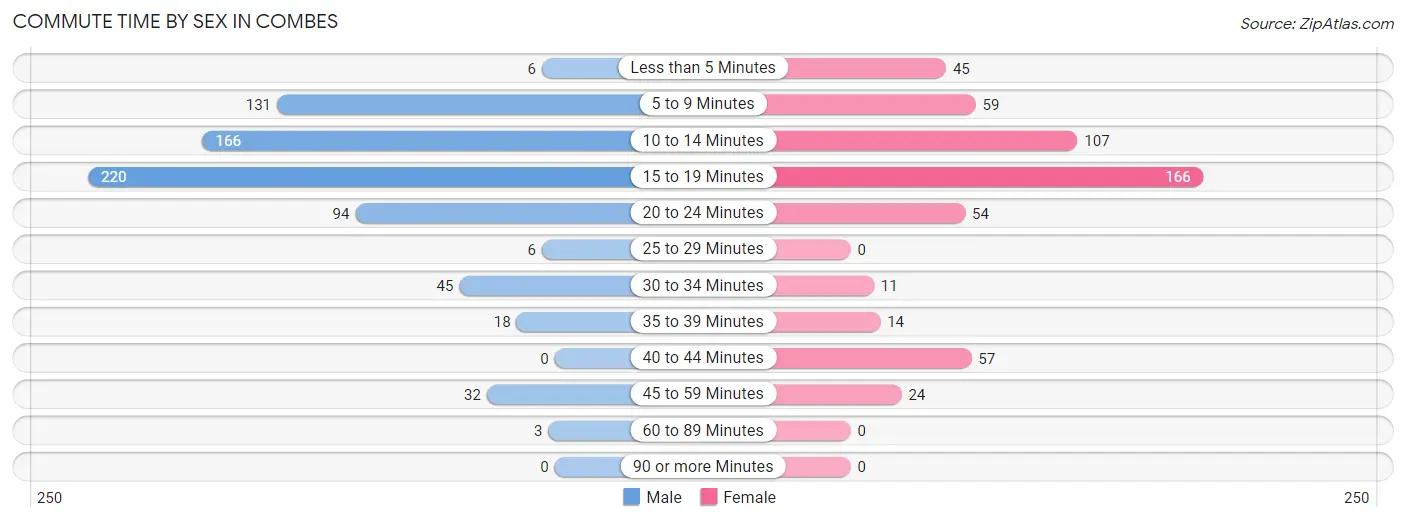
| Commute Time | Male | Female |
| Less than 5 Minutes | 6 (0.8%) | 45 (8.4%) |
| 5 to 9 Minutes | 131 (18.2%) | 59 (11.0%) |
| 10 to 14 Minutes | 166 (23.0%) | 107 (19.9%) |
| 15 to 19 Minutes | 220 (30.5%) | 166 (30.9%) |
| 20 to 24 Minutes | 94 (13.0%) | 54 (10.1%) |
| 25 to 29 Minutes | 6 (0.8%) | 0 (0.0%) |
| 30 to 34 Minutes | 45 (6.2%) | 11 (2.1%) |
| 35 to 39 Minutes | 18 (2.5%) | 14 (2.6%) |
| 40 to 44 Minutes | 0 (0.0%) | 57 (10.6%) |
| 45 to 59 Minutes | 32 (4.4%) | 24 (4.5%) |
| 60 to 89 Minutes | 3 (0.4%) | 0 (0.0%) |
| 90 or more Minutes | 0 (0.0%) | 0 (0.0%) |
Time of Departure to Work by Sex in Combes
The most frequent times of departure to work in Combes are 8:00 AM to 8:29 AM (209, 29.0%) for males and 7:30 AM to 7:59 AM (144, 26.8%) for females.
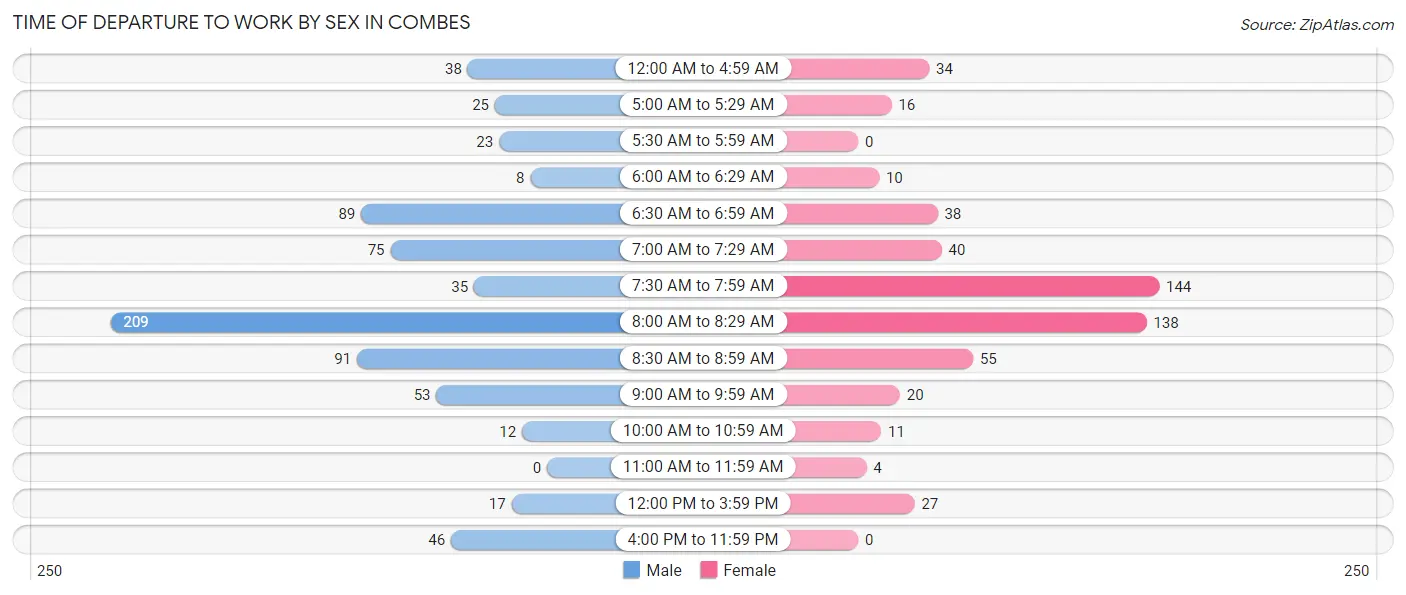
| Time of Departure | Male | Female |
| 12:00 AM to 4:59 AM | 38 (5.3%) | 34 (6.3%) |
| 5:00 AM to 5:29 AM | 25 (3.5%) | 16 (3.0%) |
| 5:30 AM to 5:59 AM | 23 (3.2%) | 0 (0.0%) |
| 6:00 AM to 6:29 AM | 8 (1.1%) | 10 (1.9%) |
| 6:30 AM to 6:59 AM | 89 (12.3%) | 38 (7.1%) |
| 7:00 AM to 7:29 AM | 75 (10.4%) | 40 (7.4%) |
| 7:30 AM to 7:59 AM | 35 (4.9%) | 144 (26.8%) |
| 8:00 AM to 8:29 AM | 209 (29.0%) | 138 (25.7%) |
| 8:30 AM to 8:59 AM | 91 (12.6%) | 55 (10.2%) |
| 9:00 AM to 9:59 AM | 53 (7.3%) | 20 (3.7%) |
| 10:00 AM to 10:59 AM | 12 (1.7%) | 11 (2.1%) |
| 11:00 AM to 11:59 AM | 0 (0.0%) | 4 (0.7%) |
| 12:00 PM to 3:59 PM | 17 (2.4%) | 27 (5.0%) |
| 4:00 PM to 11:59 PM | 46 (6.4%) | 0 (0.0%) |
| Total | 721 (100.0%) | 537 (100.0%) |
Housing Occupancy in Combes
Occupancy by Ownership in Combes
Of the total 1,084 dwellings in Combes, owner-occupied units account for 887 (81.8%), while renter-occupied units make up 197 (18.2%).
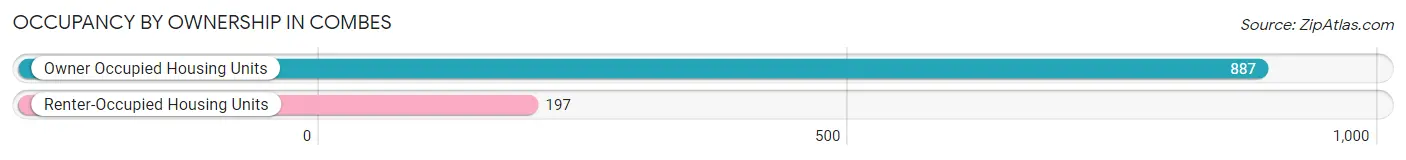
| Occupancy | # Housing Units | % Housing Units |
| Owner Occupied Housing Units | 887 | 81.8% |
| Renter-Occupied Housing Units | 197 | 18.2% |
| Total Occupied Housing Units | 1,084 | 100.0% |
Occupancy by Household Size in Combes
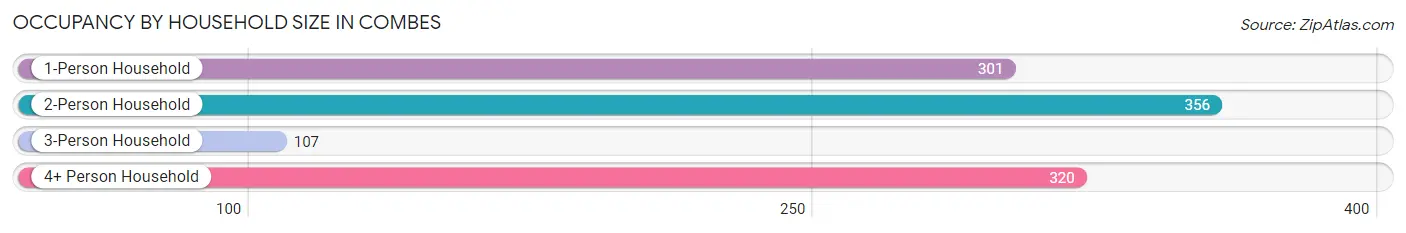
| Household Size | # Housing Units | % Housing Units |
| 1-Person Household | 301 | 27.8% |
| 2-Person Household | 356 | 32.8% |
| 3-Person Household | 107 | 9.9% |
| 4+ Person Household | 320 | 29.5% |
| Total Housing Units | 1,084 | 100.0% |
Occupancy by Ownership by Household Size in Combes
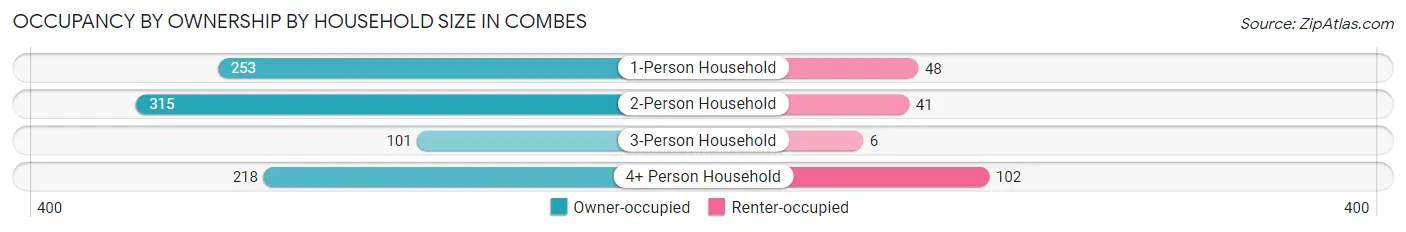
| Household Size | Owner-occupied | Renter-occupied |
| 1-Person Household | 253 (84.1%) | 48 (16.0%) |
| 2-Person Household | 315 (88.5%) | 41 (11.5%) |
| 3-Person Household | 101 (94.4%) | 6 (5.6%) |
| 4+ Person Household | 218 (68.1%) | 102 (31.9%) |
| Total Housing Units | 887 (81.8%) | 197 (18.2%) |
Occupancy by Educational Attainment in Combes
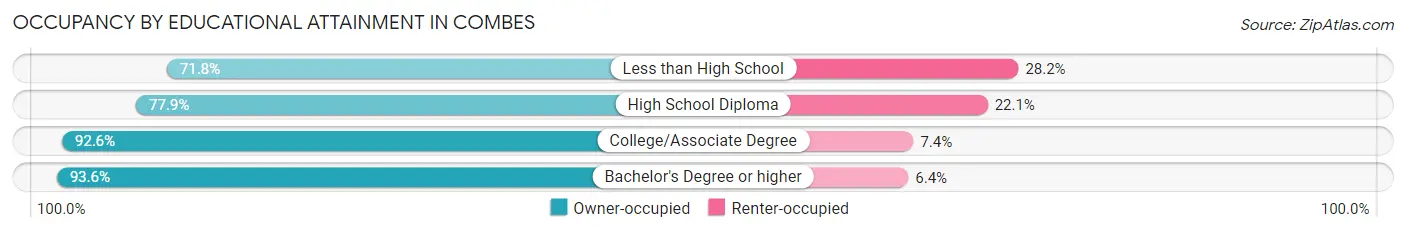
| Household Size | Owner-occupied | Renter-occupied |
| Less than High School | 257 (71.8%) | 101 (28.2%) |
| High School Diploma | 229 (77.9%) | 65 (22.1%) |
| College/Associate Degree | 313 (92.6%) | 25 (7.4%) |
| Bachelor's Degree or higher | 88 (93.6%) | 6 (6.4%) |
Occupancy by Age of Householder in Combes
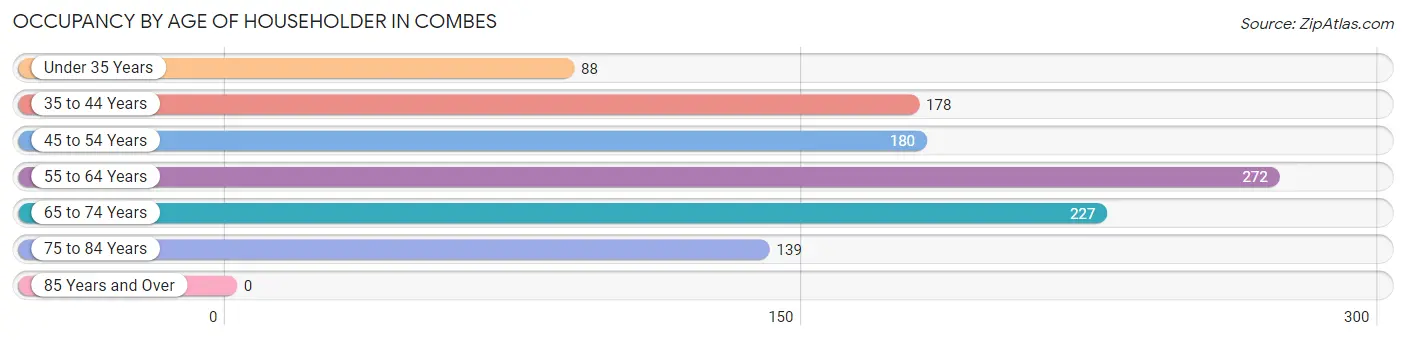
| Age Bracket | # Households | % Households |
| Under 35 Years | 88 | 8.1% |
| 35 to 44 Years | 178 | 16.4% |
| 45 to 54 Years | 180 | 16.6% |
| 55 to 64 Years | 272 | 25.1% |
| 65 to 74 Years | 227 | 20.9% |
| 75 to 84 Years | 139 | 12.8% |
| 85 Years and Over | 0 | 0.0% |
| Total | 1,084 | 100.0% |
Housing Finances in Combes
Median Income by Occupancy in Combes
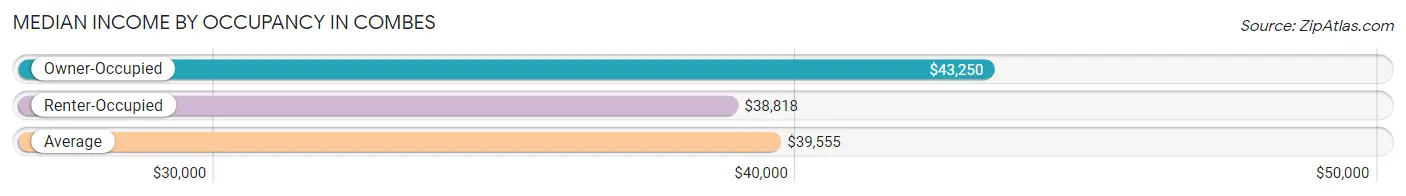
| Occupancy Type | # Households | Median Income |
| Owner-Occupied | 887 (81.8%) | $43,250 |
| Renter-Occupied | 197 (18.2%) | $38,818 |
| Average | 1,084 (100.0%) | $39,555 |
Occupancy by Householder Income Bracket in Combes
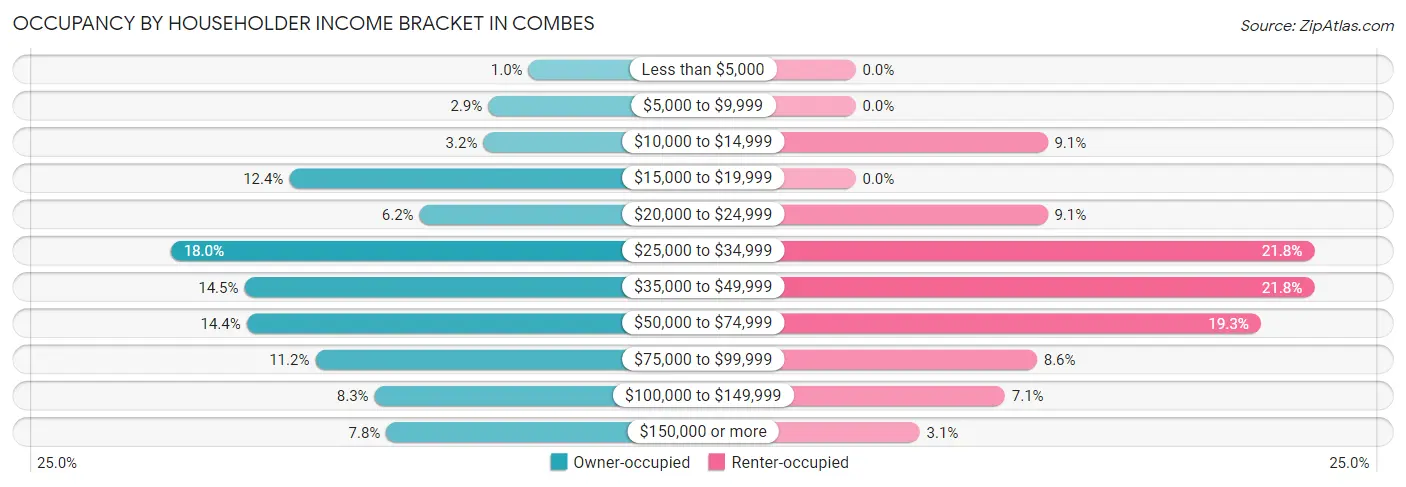
| Income Bracket | Owner-occupied | Renter-occupied |
| Less than $5,000 | 9 (1.0%) | 0 (0.0%) |
| $5,000 to $9,999 | 26 (2.9%) | 0 (0.0%) |
| $10,000 to $14,999 | 28 (3.2%) | 18 (9.1%) |
| $15,000 to $19,999 | 110 (12.4%) | 0 (0.0%) |
| $20,000 to $24,999 | 55 (6.2%) | 18 (9.1%) |
| $25,000 to $34,999 | 160 (18.0%) | 43 (21.8%) |
| $35,000 to $49,999 | 129 (14.5%) | 43 (21.8%) |
| $50,000 to $74,999 | 128 (14.4%) | 38 (19.3%) |
| $75,000 to $99,999 | 99 (11.2%) | 17 (8.6%) |
| $100,000 to $149,999 | 74 (8.3%) | 14 (7.1%) |
| $150,000 or more | 69 (7.8%) | 6 (3.0%) |
| Total | 887 (100.0%) | 197 (100.0%) |
Monthly Housing Cost Tiers in Combes
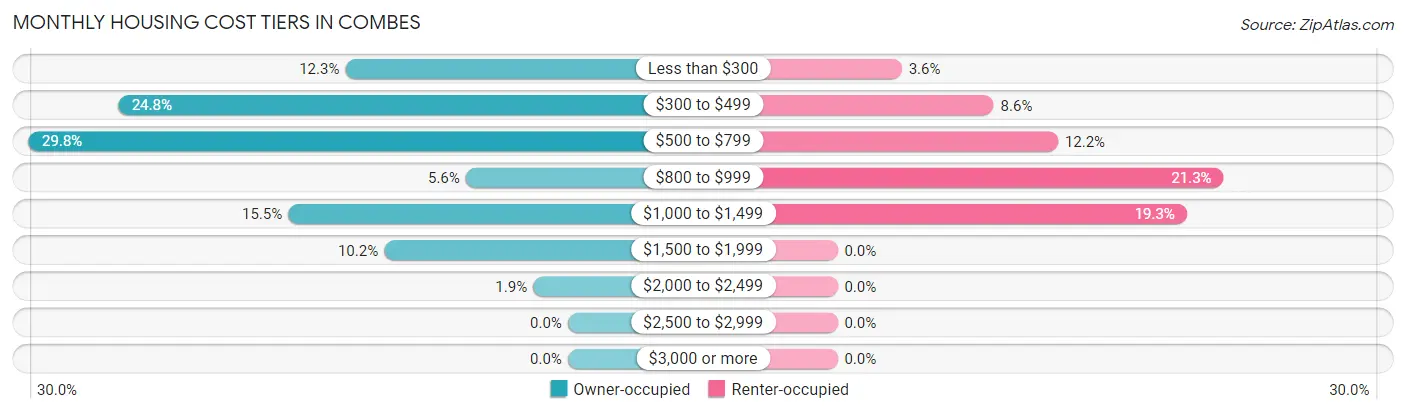
| Monthly Cost | Owner-occupied | Renter-occupied |
| Less than $300 | 109 (12.3%) | 7 (3.5%) |
| $300 to $499 | 220 (24.8%) | 17 (8.6%) |
| $500 to $799 | 264 (29.8%) | 24 (12.2%) |
| $800 to $999 | 50 (5.6%) | 42 (21.3%) |
| $1,000 to $1,499 | 137 (15.4%) | 38 (19.3%) |
| $1,500 to $1,999 | 90 (10.2%) | 0 (0.0%) |
| $2,000 to $2,499 | 17 (1.9%) | 0 (0.0%) |
| $2,500 to $2,999 | 0 (0.0%) | 0 (0.0%) |
| $3,000 or more | 0 (0.0%) | 0 (0.0%) |
| Total | 887 (100.0%) | 197 (100.0%) |
Physical Housing Characteristics in Combes
Housing Structures in Combes
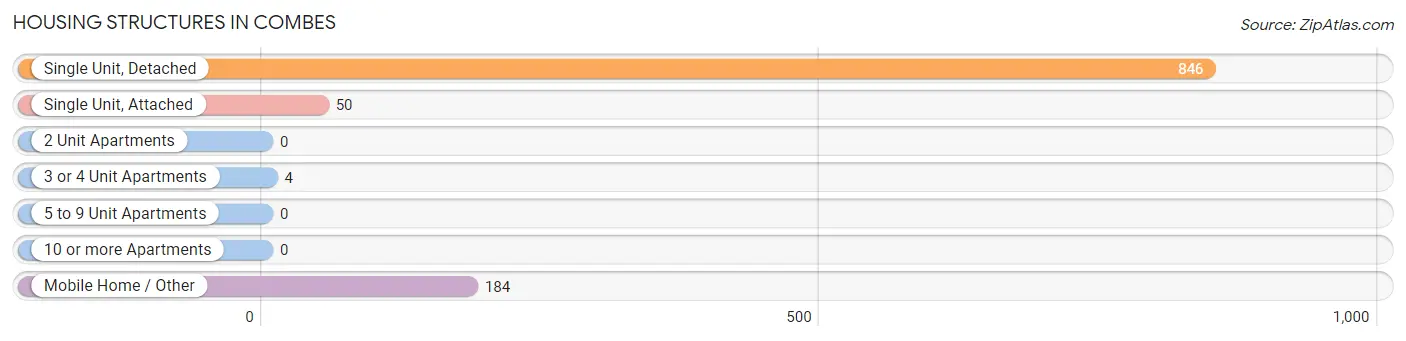
| Structure Type | # Housing Units | % Housing Units |
| Single Unit, Detached | 846 | 78.0% |
| Single Unit, Attached | 50 | 4.6% |
| 2 Unit Apartments | 0 | 0.0% |
| 3 or 4 Unit Apartments | 4 | 0.4% |
| 5 to 9 Unit Apartments | 0 | 0.0% |
| 10 or more Apartments | 0 | 0.0% |
| Mobile Home / Other | 184 | 17.0% |
| Total | 1,084 | 100.0% |
Housing Structures by Occupancy in Combes
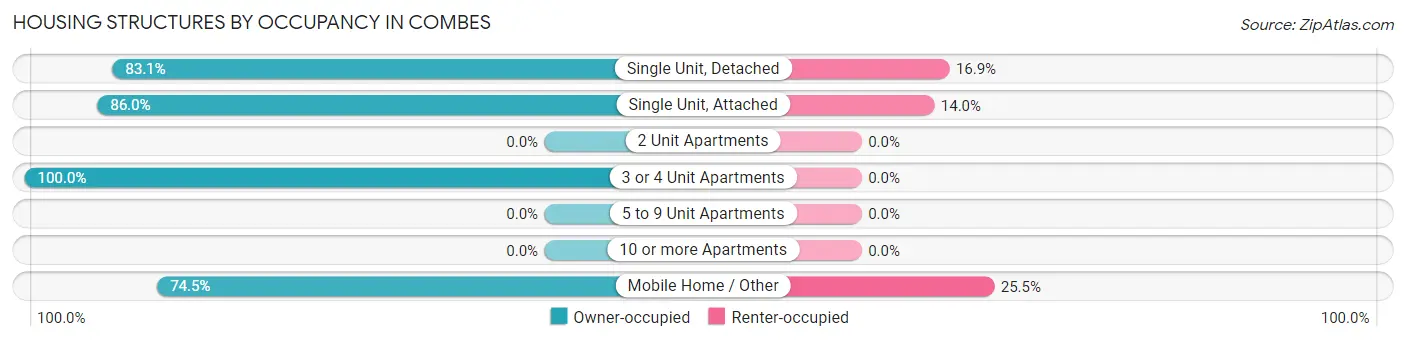
| Structure Type | Owner-occupied | Renter-occupied |
| Single Unit, Detached | 703 (83.1%) | 143 (16.9%) |
| Single Unit, Attached | 43 (86.0%) | 7 (14.0%) |
| 2 Unit Apartments | 0 (0.0%) | 0 (0.0%) |
| 3 or 4 Unit Apartments | 4 (100.0%) | 0 (0.0%) |
| 5 to 9 Unit Apartments | 0 (0.0%) | 0 (0.0%) |
| 10 or more Apartments | 0 (0.0%) | 0 (0.0%) |
| Mobile Home / Other | 137 (74.5%) | 47 (25.5%) |
| Total | 887 (81.8%) | 197 (18.2%) |
Housing Structures by Number of Rooms in Combes
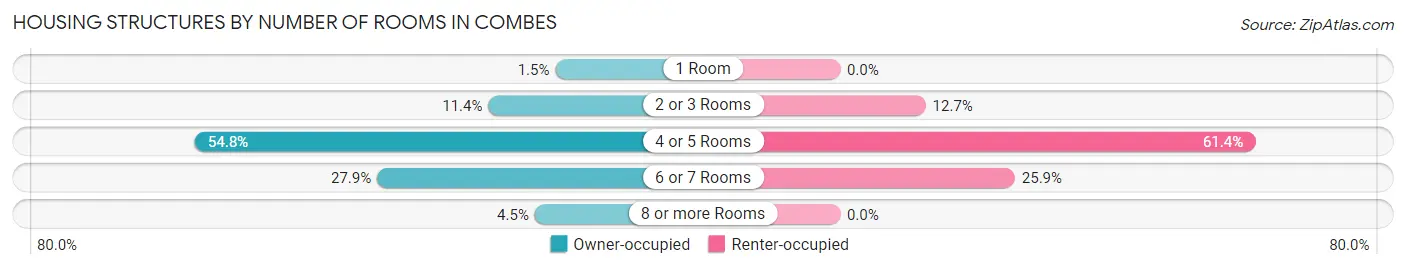
| Number of Rooms | Owner-occupied | Renter-occupied |
| 1 Room | 13 (1.5%) | 0 (0.0%) |
| 2 or 3 Rooms | 101 (11.4%) | 25 (12.7%) |
| 4 or 5 Rooms | 486 (54.8%) | 121 (61.4%) |
| 6 or 7 Rooms | 247 (27.9%) | 51 (25.9%) |
| 8 or more Rooms | 40 (4.5%) | 0 (0.0%) |
| Total | 887 (100.0%) | 197 (100.0%) |
Housing Structure by Heating Type in Combes
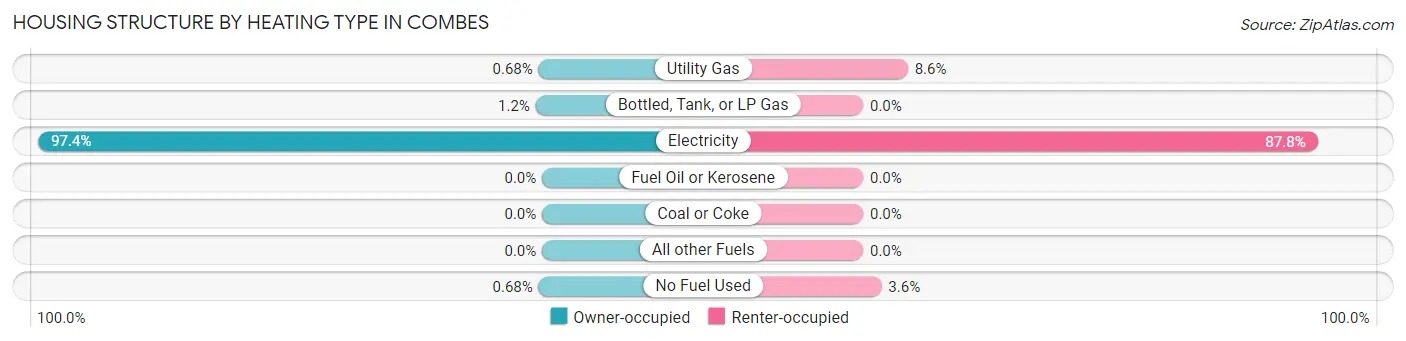
| Heating Type | Owner-occupied | Renter-occupied |
| Utility Gas | 6 (0.7%) | 17 (8.6%) |
| Bottled, Tank, or LP Gas | 11 (1.2%) | 0 (0.0%) |
| Electricity | 864 (97.4%) | 173 (87.8%) |
| Fuel Oil or Kerosene | 0 (0.0%) | 0 (0.0%) |
| Coal or Coke | 0 (0.0%) | 0 (0.0%) |
| All other Fuels | 0 (0.0%) | 0 (0.0%) |
| No Fuel Used | 6 (0.7%) | 7 (3.5%) |
| Total | 887 (100.0%) | 197 (100.0%) |
Household Vehicle Usage in Combes
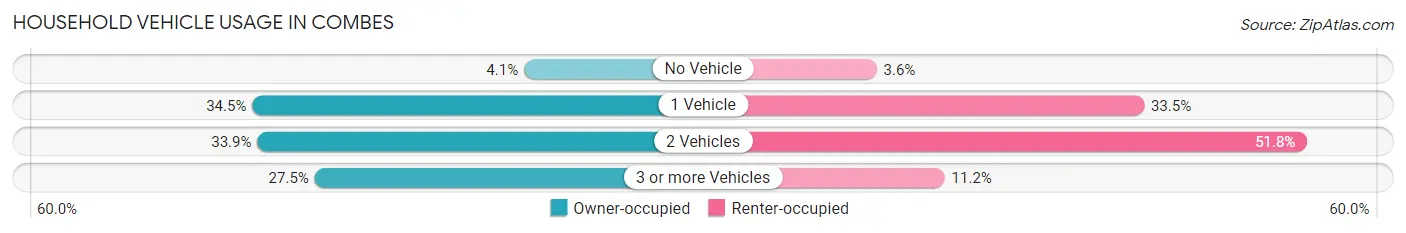
| Vehicles per Household | Owner-occupied | Renter-occupied |
| No Vehicle | 36 (4.1%) | 7 (3.5%) |
| 1 Vehicle | 306 (34.5%) | 66 (33.5%) |
| 2 Vehicles | 301 (33.9%) | 102 (51.8%) |
| 3 or more Vehicles | 244 (27.5%) | 22 (11.2%) |
| Total | 887 (100.0%) | 197 (100.0%) |
Real Estate & Mortgages in Combes
Real Estate and Mortgage Overview in Combes
| Characteristic | Without Mortgage | With Mortgage |
| Housing Units | 590 | 297 |
| Median Property Value | $84,700 | $167,500 |
| Median Household Income | $32,250 | $57 |
| Monthly Housing Costs | $470 | $0 |
| Real Estate Taxes | $1,008 | $0 |
Property Value by Mortgage Status in Combes
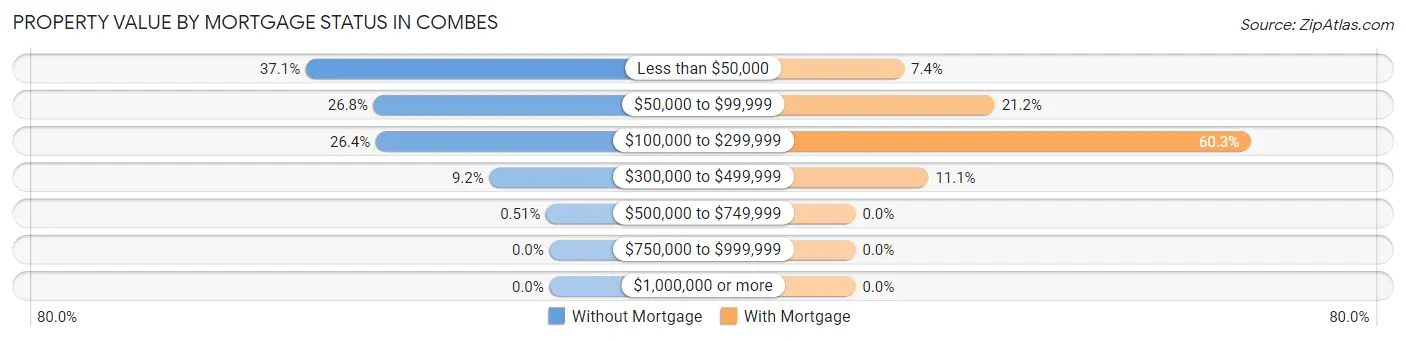
| Property Value | Without Mortgage | With Mortgage |
| Less than $50,000 | 219 (37.1%) | 22 (7.4%) |
| $50,000 to $99,999 | 158 (26.8%) | 63 (21.2%) |
| $100,000 to $299,999 | 156 (26.4%) | 179 (60.3%) |
| $300,000 to $499,999 | 54 (9.1%) | 33 (11.1%) |
| $500,000 to $749,999 | 3 (0.5%) | 0 (0.0%) |
| $750,000 to $999,999 | 0 (0.0%) | 0 (0.0%) |
| $1,000,000 or more | 0 (0.0%) | 0 (0.0%) |
| Total | 590 (100.0%) | 297 (100.0%) |
Household Income by Mortgage Status in Combes
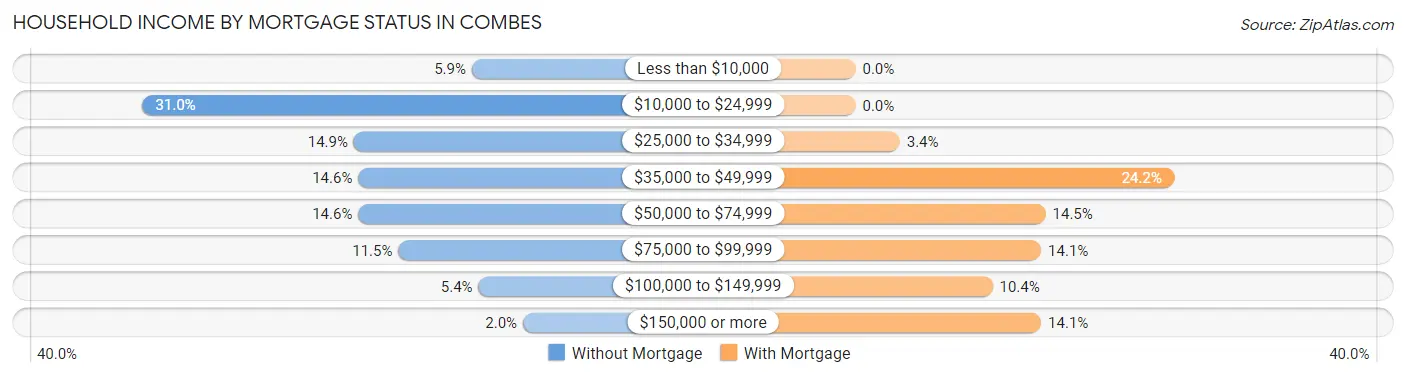
| Household Income | Without Mortgage | With Mortgage |
| Less than $10,000 | 35 (5.9%) | 0 (0.0%) |
| $10,000 to $24,999 | 183 (31.0%) | 0 (0.0%) |
| $25,000 to $34,999 | 88 (14.9%) | 10 (3.4%) |
| $35,000 to $49,999 | 86 (14.6%) | 72 (24.2%) |
| $50,000 to $74,999 | 86 (14.6%) | 43 (14.5%) |
| $75,000 to $99,999 | 68 (11.5%) | 42 (14.1%) |
| $100,000 to $149,999 | 32 (5.4%) | 31 (10.4%) |
| $150,000 or more | 12 (2.0%) | 42 (14.1%) |
| Total | 590 (100.0%) | 297 (100.0%) |
Property Value to Household Income Ratio in Combes
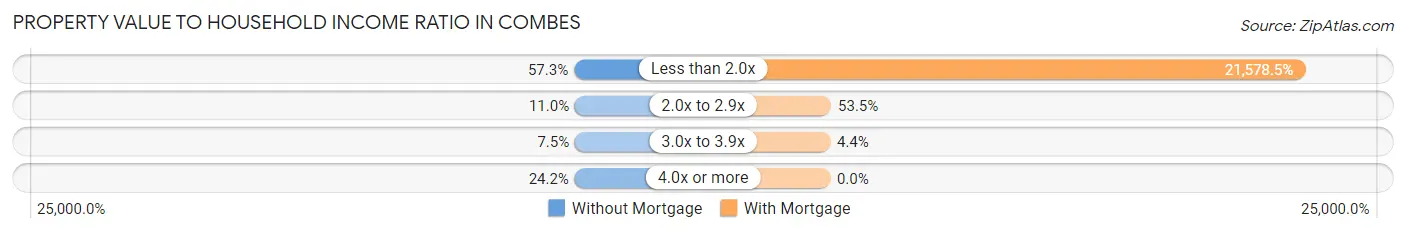
| Value-to-Income Ratio | Without Mortgage | With Mortgage |
| Less than 2.0x | 338 (57.3%) | 64,088 (21,578.5%) |
| 2.0x to 2.9x | 65 (11.0%) | 159 (53.5%) |
| 3.0x to 3.9x | 44 (7.5%) | 13 (4.4%) |
| 4.0x or more | 143 (24.2%) | 0 (0.0%) |
| Total | 590 (100.0%) | 297 (100.0%) |
Real Estate Taxes by Mortgage Status in Combes
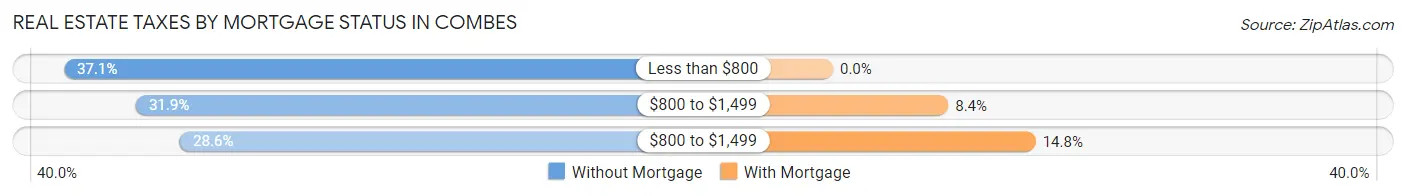
| Property Taxes | Without Mortgage | With Mortgage |
| Less than $800 | 219 (37.1%) | 0 (0.0%) |
| $800 to $1,499 | 188 (31.9%) | 25 (8.4%) |
| $800 to $1,499 | 169 (28.6%) | 44 (14.8%) |
| Total | 590 (100.0%) | 297 (100.0%) |
Health & Disability in Combes
Health Insurance Coverage by Age in Combes
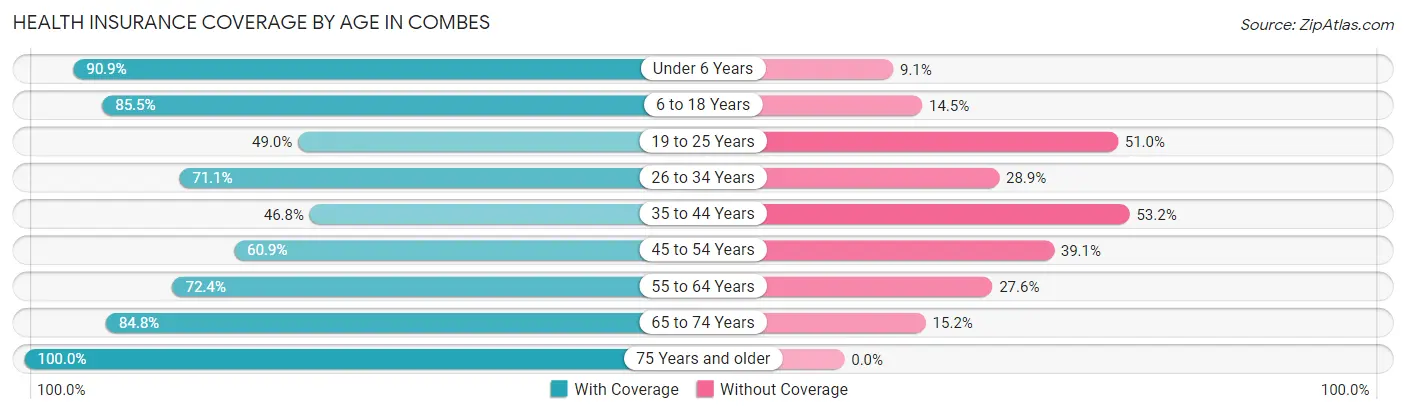
| Age Bracket | With Coverage | Without Coverage |
| Under 6 Years | 210 (90.9%) | 21 (9.1%) |
| 6 to 18 Years | 637 (85.5%) | 108 (14.5%) |
| 19 to 25 Years | 147 (49.0%) | 153 (51.0%) |
| 26 to 34 Years | 143 (71.1%) | 58 (28.9%) |
| 35 to 44 Years | 162 (46.8%) | 184 (53.2%) |
| 45 to 54 Years | 259 (60.9%) | 166 (39.1%) |
| 55 to 64 Years | 294 (72.4%) | 112 (27.6%) |
| 65 to 74 Years | 246 (84.8%) | 44 (15.2%) |
| 75 Years and older | 197 (100.0%) | 0 (0.0%) |
| Total | 2,295 (73.1%) | 846 (26.9%) |
Health Insurance Coverage by Citizenship Status in Combes
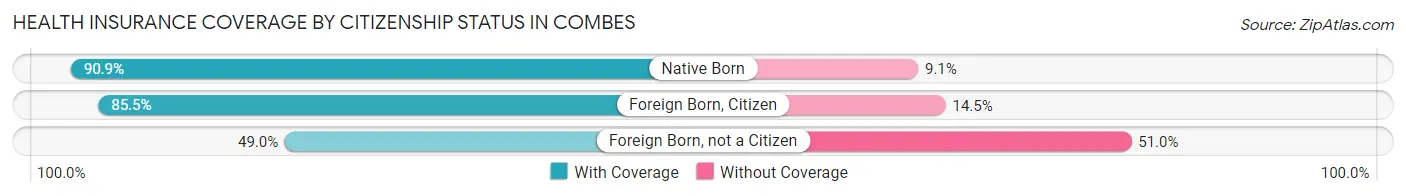
| Citizenship Status | With Coverage | Without Coverage |
| Native Born | 210 (90.9%) | 21 (9.1%) |
| Foreign Born, Citizen | 637 (85.5%) | 108 (14.5%) |
| Foreign Born, not a Citizen | 147 (49.0%) | 153 (51.0%) |
Health Insurance Coverage by Household Income in Combes
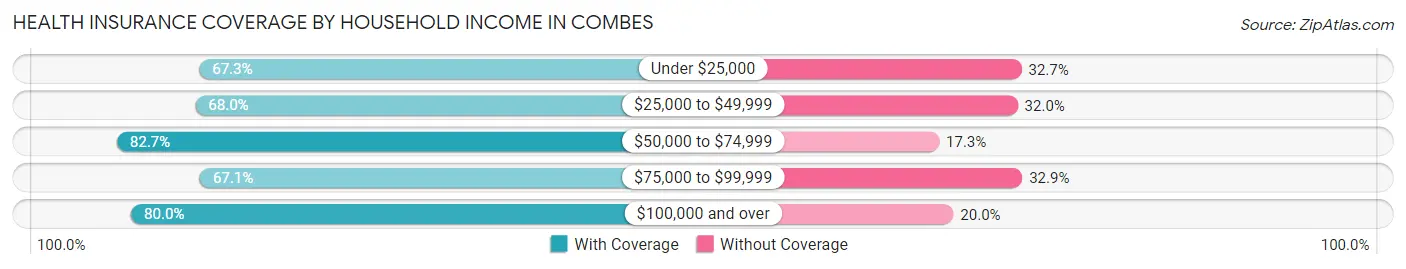
| Household Income | With Coverage | Without Coverage |
| Under $25,000 | 300 (67.3%) | 146 (32.7%) |
| $25,000 to $49,999 | 635 (68.0%) | 299 (32.0%) |
| $50,000 to $74,999 | 464 (82.7%) | 97 (17.3%) |
| $75,000 to $99,999 | 335 (67.1%) | 164 (32.9%) |
| $100,000 and over | 561 (80.0%) | 140 (20.0%) |
Public vs Private Health Insurance Coverage by Age in Combes
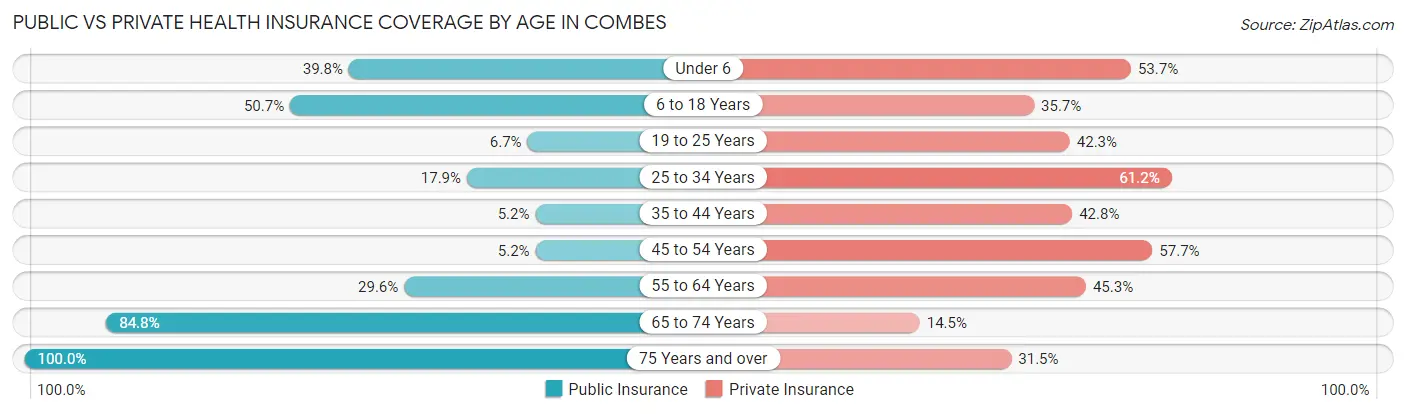
| Age Bracket | Public Insurance | Private Insurance |
| Under 6 | 92 (39.8%) | 124 (53.7%) |
| 6 to 18 Years | 378 (50.7%) | 266 (35.7%) |
| 19 to 25 Years | 20 (6.7%) | 127 (42.3%) |
| 25 to 34 Years | 36 (17.9%) | 123 (61.2%) |
| 35 to 44 Years | 18 (5.2%) | 148 (42.8%) |
| 45 to 54 Years | 22 (5.2%) | 245 (57.7%) |
| 55 to 64 Years | 120 (29.6%) | 184 (45.3%) |
| 65 to 74 Years | 246 (84.8%) | 42 (14.5%) |
| 75 Years and over | 197 (100.0%) | 62 (31.5%) |
| Total | 1,129 (35.9%) | 1,321 (42.1%) |
Disability Status by Sex by Age in Combes
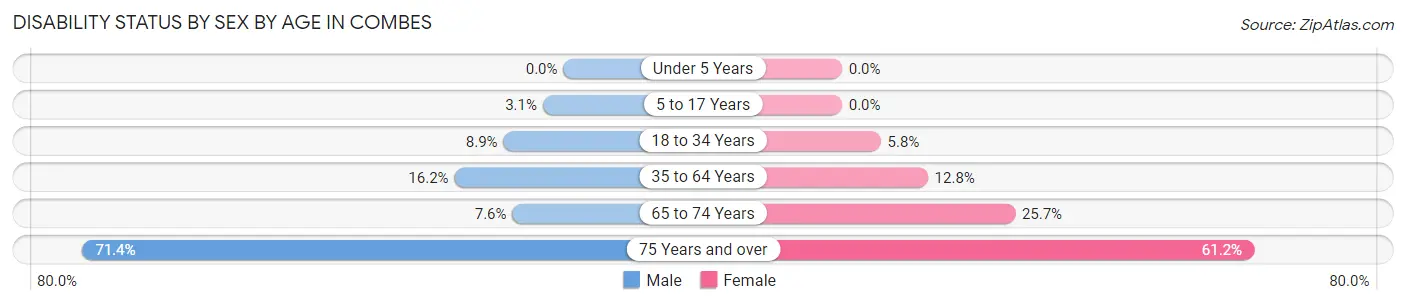
| Age Bracket | Male | Female |
| Under 5 Years | 0 (0.0%) | 0 (0.0%) |
| 5 to 17 Years | 10 (3.0%) | 0 (0.0%) |
| 18 to 34 Years | 29 (8.9%) | 14 (5.8%) |
| 35 to 64 Years | 94 (16.2%) | 76 (12.8%) |
| 65 to 74 Years | 14 (7.6%) | 27 (25.7%) |
| 75 Years and over | 45 (71.4%) | 82 (61.2%) |
Disability Class by Sex by Age in Combes
Disability Class: Hearing Difficulty
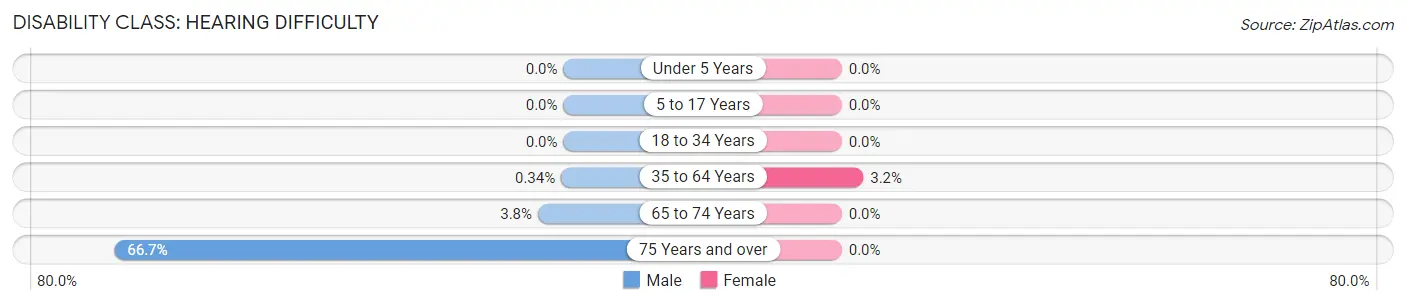
| Age Bracket | Male | Female |
| Under 5 Years | 0 (0.0%) | 0 (0.0%) |
| 5 to 17 Years | 0 (0.0%) | 0 (0.0%) |
| 18 to 34 Years | 0 (0.0%) | 0 (0.0%) |
| 35 to 64 Years | 2 (0.3%) | 19 (3.2%) |
| 65 to 74 Years | 7 (3.8%) | 0 (0.0%) |
| 75 Years and over | 42 (66.7%) | 0 (0.0%) |
Disability Class: Vision Difficulty
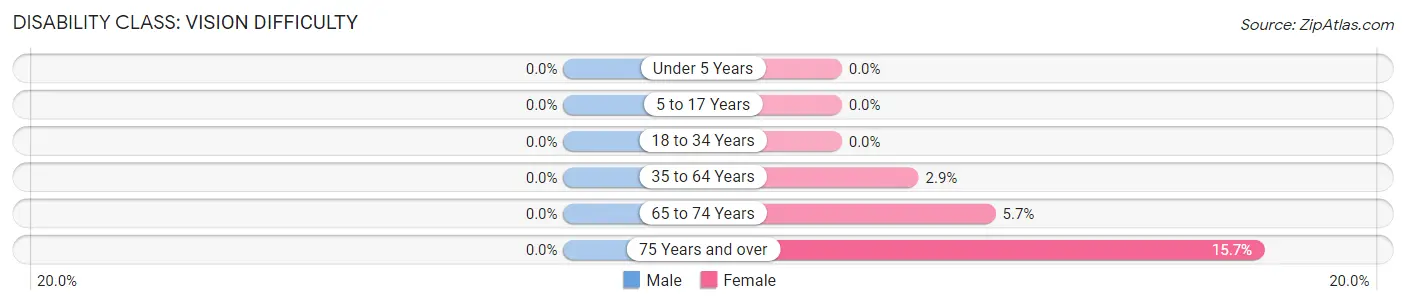
| Age Bracket | Male | Female |
| Under 5 Years | 0 (0.0%) | 0 (0.0%) |
| 5 to 17 Years | 0 (0.0%) | 0 (0.0%) |
| 18 to 34 Years | 0 (0.0%) | 0 (0.0%) |
| 35 to 64 Years | 0 (0.0%) | 17 (2.9%) |
| 65 to 74 Years | 0 (0.0%) | 6 (5.7%) |
| 75 Years and over | 0 (0.0%) | 21 (15.7%) |
Disability Class: Cognitive Difficulty
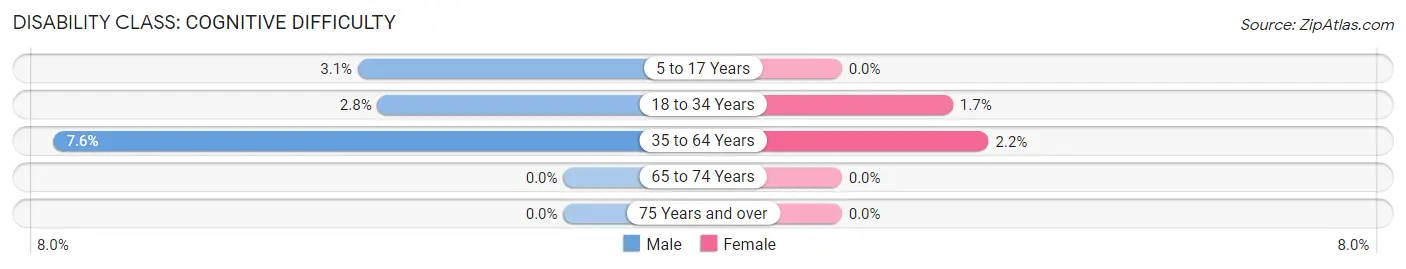
| Age Bracket | Male | Female |
| 5 to 17 Years | 10 (3.0%) | 0 (0.0%) |
| 18 to 34 Years | 9 (2.8%) | 4 (1.7%) |
| 35 to 64 Years | 44 (7.6%) | 13 (2.2%) |
| 65 to 74 Years | 0 (0.0%) | 0 (0.0%) |
| 75 Years and over | 0 (0.0%) | 0 (0.0%) |
Disability Class: Ambulatory Difficulty
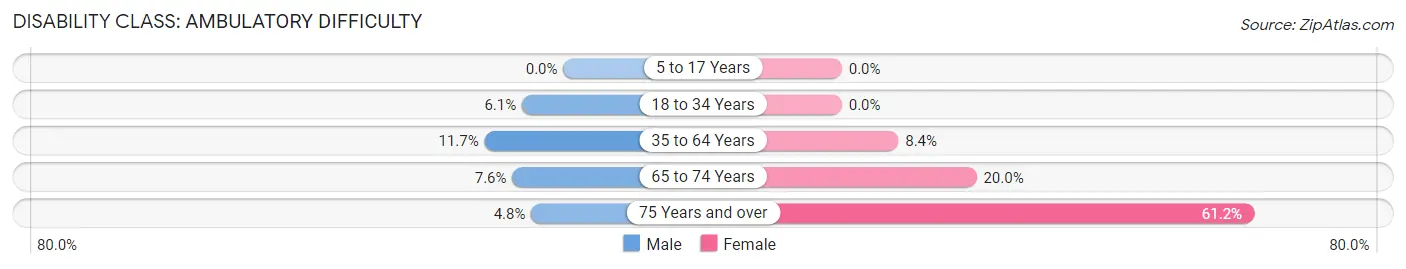
| Age Bracket | Male | Female |
| 5 to 17 Years | 0 (0.0%) | 0 (0.0%) |
| 18 to 34 Years | 20 (6.1%) | 0 (0.0%) |
| 35 to 64 Years | 68 (11.7%) | 50 (8.4%) |
| 65 to 74 Years | 14 (7.6%) | 21 (20.0%) |
| 75 Years and over | 3 (4.8%) | 82 (61.2%) |
Disability Class: Self-Care Difficulty
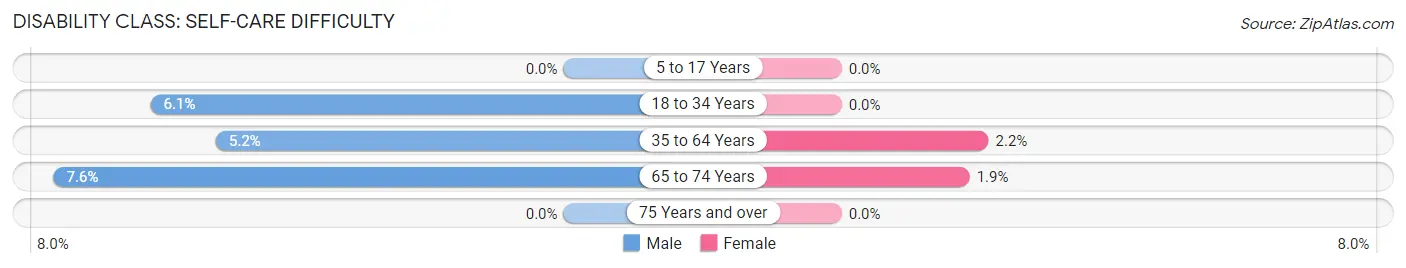
| Age Bracket | Male | Female |
| 5 to 17 Years | 0 (0.0%) | 0 (0.0%) |
| 18 to 34 Years | 20 (6.1%) | 0 (0.0%) |
| 35 to 64 Years | 30 (5.2%) | 13 (2.2%) |
| 65 to 74 Years | 14 (7.6%) | 2 (1.9%) |
| 75 Years and over | 0 (0.0%) | 0 (0.0%) |
Technology Access in Combes
Computing Device Access in Combes
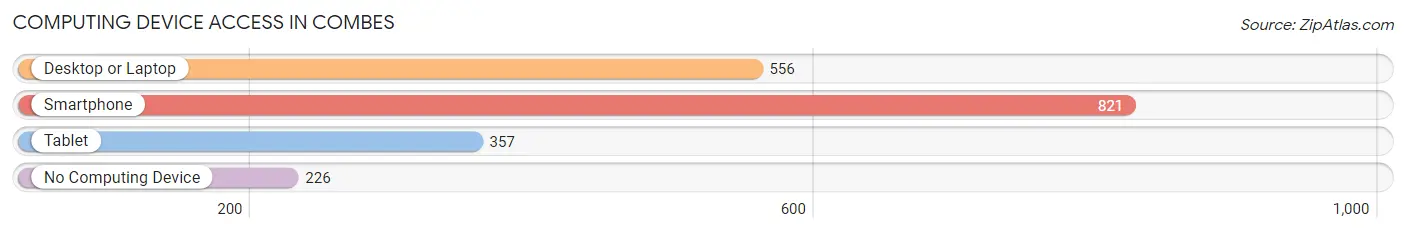
| Device Type | # Households | % Households |
| Desktop or Laptop | 556 | 51.3% |
| Smartphone | 821 | 75.7% |
| Tablet | 357 | 32.9% |
| No Computing Device | 226 | 20.8% |
| Total | 1,084 | 100.0% |
Internet Access in Combes
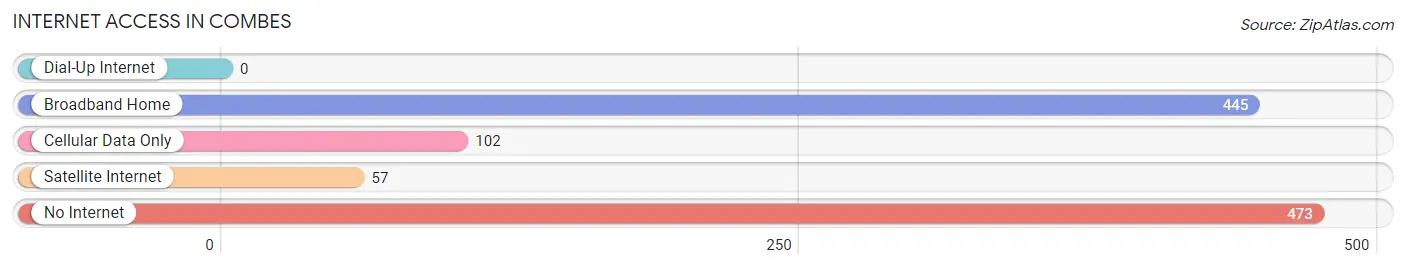
| Internet Type | # Households | % Households |
| Dial-Up Internet | 0 | 0.0% |
| Broadband Home | 445 | 41.0% |
| Cellular Data Only | 102 | 9.4% |
| Satellite Internet | 57 | 5.3% |
| No Internet | 473 | 43.6% |
| Total | 1,084 | 100.0% |
Combes Summary
Combes is a small unincorporated community located in the southern part of Hidalgo County, Texas. It is situated about 10 miles east of the city of Harlingen and about 20 miles west of the city of McAllen. The population of Combes was estimated to be 1,845 in 2019.
History
Combes was founded in the early 1900s by a group of settlers from the nearby town of Harlingen. The settlers were attracted to the area due to its fertile soil and abundant water supply. The town was originally named “Combes Station” after the local railroad station. The name was later shortened to “Combes”.
The town grew rapidly in the early 20th century, and by the 1930s it had become a thriving agricultural center. The town was home to several cotton gins, a cottonseed oil mill, and a number of other businesses.
In the 1950s, Combes began to experience a decline in population as many of its residents moved away in search of better economic opportunities. The town’s population continued to decline until the late 1990s, when it began to experience a resurgence due to its proximity to the cities of Harlingen and McAllen.
Geography
Combes is located in the southern part of Hidalgo County, Texas. It is situated about 10 miles east of the city of Harlingen and about 20 miles west of the city of McAllen. The town is located in the Rio Grande Valley, which is a region of south Texas known for its fertile soil and abundant water supply.
The climate in Combes is subtropical, with hot summers and mild winters. The average annual temperature is 73°F, and the average annual precipitation is 22 inches.
Economy
The economy of Combes is largely based on agriculture. The town is home to several cotton gins, a cottonseed oil mill, and a number of other businesses. The town is also home to a number of small businesses, including restaurants, convenience stores, and auto repair shops.
The town is also home to a number of manufacturing companies, including a plastics factory and a furniture factory. The town is also home to a number of service-based businesses, including a medical clinic and a number of law firms.
Demographics
The population of Combes was estimated to be 1,845 in 2019. The town is predominantly Hispanic, with a population that is 97.3% Hispanic and 2.7% non-Hispanic. The median household income in Combes is $30,945, and the median home value is $90,000. The town has a poverty rate of 28.3%.
The town is served by the Combes Independent School District, which consists of two elementary schools, one middle school, and one high school. The town is also home to a number of churches, including the First Baptist Church of Combes and the Iglesia Bautista de Combes.
Common Questions
What is Per Capita Income in Combes?
Per Capita income in Combes is $20,892.
What is the Median Family Income in Combes?
Median Family Income in Combes is $59,440.
What is the Median Household income in Combes?
Median Household Income in Combes is $39,555.
What is Income or Wage Gap in Combes?
Income or Wage Gap in Combes is 19.2%.
Women in Combes earn 80.8 cents for every dollar earned by a man.
What is Inequality or Gini Index in Combes?
Inequality or Gini Index in Combes is 0.41.
What is the Total Population of Combes?
Total Population of Combes is 3,141.
What is the Total Male Population of Combes?
Total Male Population of Combes is 1,513.
What is the Total Female Population of Combes?
Total Female Population of Combes is 1,628.
What is the Ratio of Males per 100 Females in Combes?
There are 92.94 Males per 100 Females in Combes.
What is the Ratio of Females per 100 Males in Combes?
There are 107.60 Females per 100 Males in Combes.
What is the Median Population Age in Combes?
Median Population Age in Combes is 37.1 Years.
What is the Average Family Size in Combes
Average Family Size in Combes is 3.7 People.
What is the Average Household Size in Combes
Average Household Size in Combes is 2.9 People.
How Large is the Labor Force in Combes?
There are 1,410 People in the Labor Forcein in Combes.
What is the Percentage of People in the Labor Force in Combes?
61.0% of People are in the Labor Force in Combes.
What is the Unemployment Rate in Combes?
Unemployment Rate in Combes is 1.7%.