Richland, SD Map & Demographics
Richland Map
Richland Overview
$16,586
PER CAPITA INCOME
$51,111
AVG FAMILY INCOME
$40,938
AVG HOUSEHOLD INCOME
0.34
INEQUALITY / GINI INDEX
168
TOTAL POPULATION
100
MALE POPULATION
68
FEMALE POPULATION
147.06
MALES / 100 FEMALES
68.00
FEMALES / 100 MALES
26.7
MEDIAN AGE
4.8
AVG FAMILY SIZE
3.3
AVG HOUSEHOLD SIZE
70
LABOR FORCE [ PEOPLE ]
52.2%
PERCENT IN LABOR FORCE
17.2%
UNEMPLOYMENT RATE
Income in Richland
Income Overview in Richland
Per Capita Income in Richland is $16,586, while median incomes of families and households are $51,111 and $40,938 respectively.
| Characteristic | Number | Measure |
| Per Capita Income | 168 | $16,586 |
| Median Family Income | 28 | $51,111 |
| Mean Family Income | 28 | $54,079 |
| Median Household Income | 51 | $40,938 |
| Mean Household Income | 51 | $43,390 |
| Income Deficit | 28 | $0 |
| Wage / Income Gap (%) | 168 | 0.00% |
| Wage / Income Gap ($) | 168 | 100.00¢ per $1 |
| Gini / Inequality Index | 168 | 0.34 |
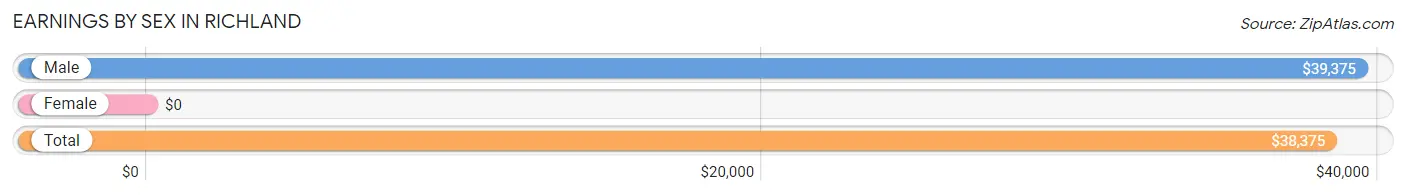
Earnings by Sex in Richland
| Sex | Number | Average Earnings |
| Male | 30 (42.9%) | $39,375 |
| Female | 40 (57.1%) | $0 |
| Total | 70 (100.0%) | $38,375 |
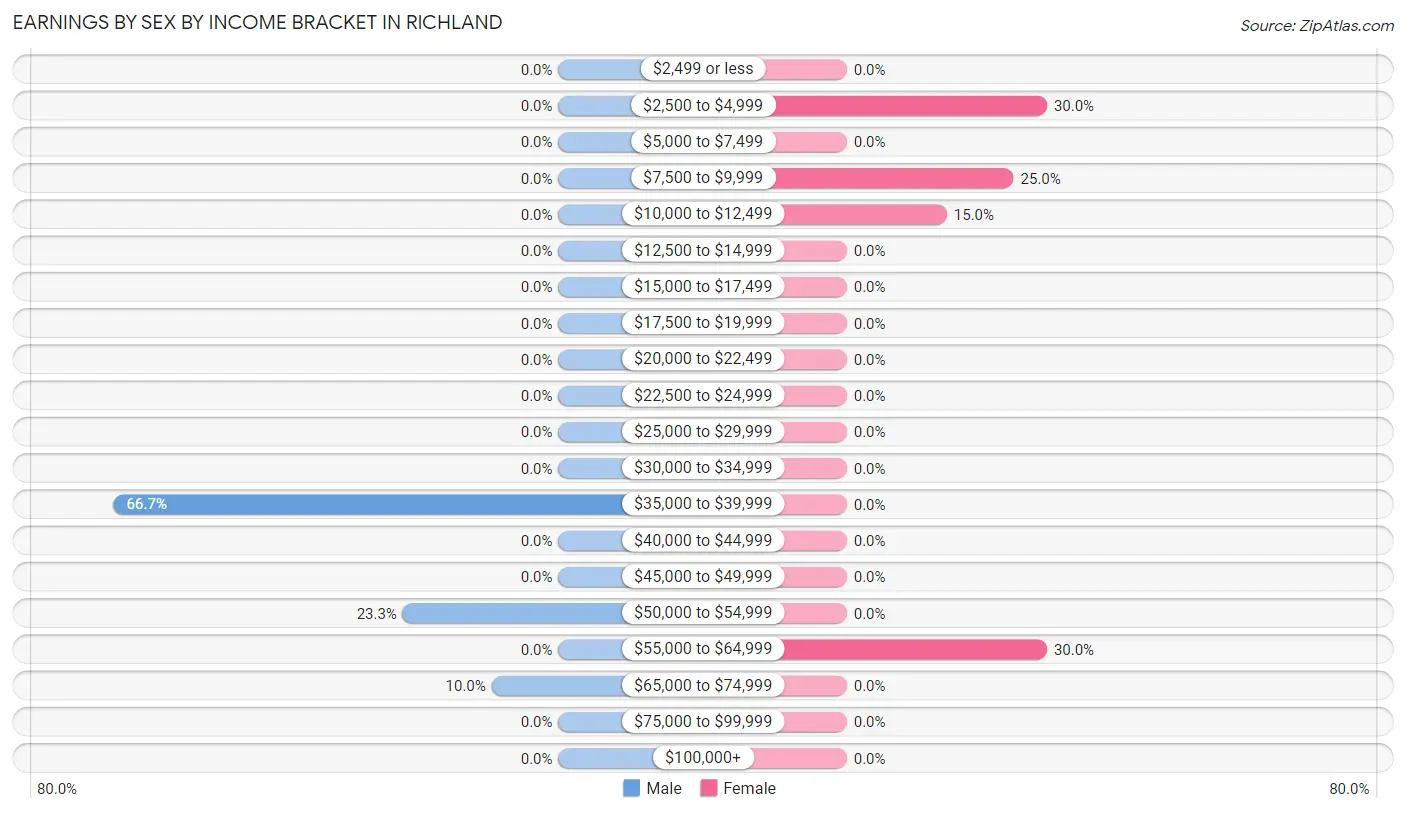
Earnings by Sex by Income Bracket in Richland
The most common earnings brackets in Richland are $35,000 to $39,999 for men (20 | 66.7%) and $2,500 to $4,999 for women (12 | 30.0%).
| Income | Male | Female |
| $2,499 or less | 0 (0.0%) | 0 (0.0%) |
| $2,500 to $4,999 | 0 (0.0%) | 12 (30.0%) |
| $5,000 to $7,499 | 0 (0.0%) | 0 (0.0%) |
| $7,500 to $9,999 | 0 (0.0%) | 10 (25.0%) |
| $10,000 to $12,499 | 0 (0.0%) | 6 (15.0%) |
| $12,500 to $14,999 | 0 (0.0%) | 0 (0.0%) |
| $15,000 to $17,499 | 0 (0.0%) | 0 (0.0%) |
| $17,500 to $19,999 | 0 (0.0%) | 0 (0.0%) |
| $20,000 to $22,499 | 0 (0.0%) | 0 (0.0%) |
| $22,500 to $24,999 | 0 (0.0%) | 0 (0.0%) |
| $25,000 to $29,999 | 0 (0.0%) | 0 (0.0%) |
| $30,000 to $34,999 | 0 (0.0%) | 0 (0.0%) |
| $35,000 to $39,999 | 20 (66.7%) | 0 (0.0%) |
| $40,000 to $44,999 | 0 (0.0%) | 0 (0.0%) |
| $45,000 to $49,999 | 0 (0.0%) | 0 (0.0%) |
| $50,000 to $54,999 | 7 (23.3%) | 0 (0.0%) |
| $55,000 to $64,999 | 0 (0.0%) | 12 (30.0%) |
| $65,000 to $74,999 | 3 (10.0%) | 0 (0.0%) |
| $75,000 to $99,999 | 0 (0.0%) | 0 (0.0%) |
| $100,000+ | 0 (0.0%) | 0 (0.0%) |
| Total | 30 (100.0%) | 40 (100.0%) |
Earnings by Sex by Educational Attainment in Richland
| Educational Attainment | Male Income | Female Income |
| Less than High School | - | - |
| High School Diploma | - | - |
| College or Associate's Degree | - | - |
| Bachelor's Degree | - | - |
| Graduate Degree | - | - |
| Total | $52,679 | $0 |
Family Income in Richland
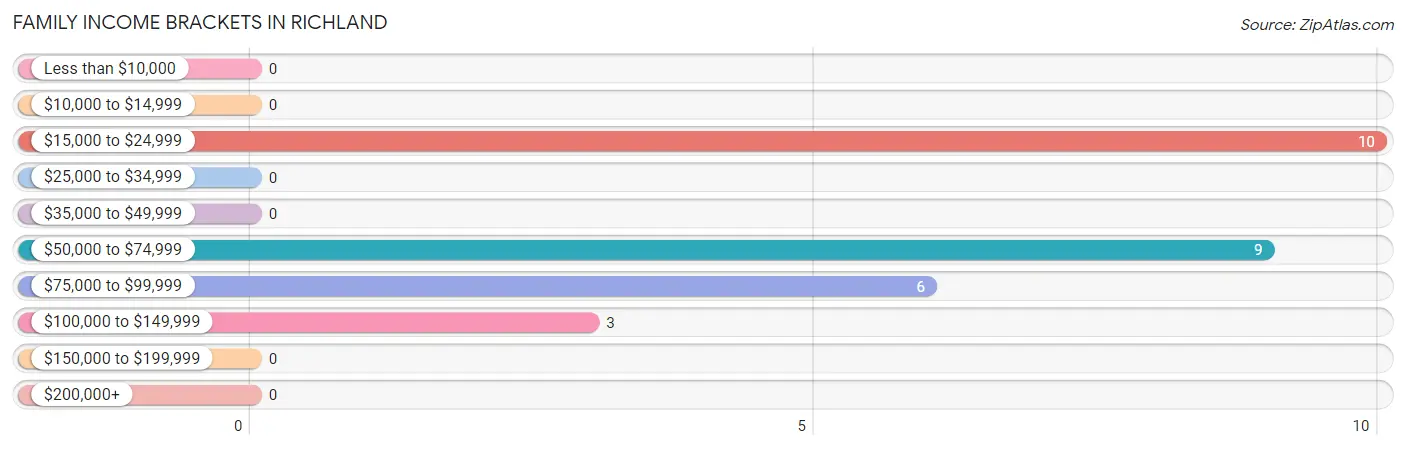
Family Income Brackets in Richland
According to the Richland family income data, there are 10 families falling into the $15,000 to $24,999 income range, which is the most common income bracket and makes up 35.7% of all families.
| Income Bracket | # Families | % Families |
| Less than $10,000 | 0 | 0.0% |
| $10,000 to $14,999 | 0 | 0.0% |
| $15,000 to $24,999 | 10 | 35.7% |
| $25,000 to $34,999 | 0 | 0.0% |
| $35,000 to $49,999 | 0 | 0.0% |
| $50,000 to $74,999 | 9 | 32.1% |
| $75,000 to $99,999 | 6 | 21.4% |
| $100,000 to $149,999 | 3 | 10.7% |
| $150,000 to $199,999 | 0 | 0.0% |
| $200,000+ | 0 | 0.0% |
Family Income by Famaliy Size in Richland
| Income Bracket | # Families | Median Income |
| 2-Person Families | 9 (32.1%) | $0 |
| 3-Person Families | 10 (35.7%) | $0 |
| 4-Person Families | 3 (10.7%) | $0 |
| 5-Person Families | 6 (21.4%) | $0 |
| 6-Person Families | 0 (0.0%) | $0 |
| 7+ Person Families | 0 (0.0%) | $0 |
| Total | 28 (100.0%) | $51,111 |
Family Income by Number of Earners in Richland
| Number of Earners | # Families | Median Income |
| No Earners | 0 (0.0%) | $0 |
| 1 Earner | 19 (67.9%) | $0 |
| 2 Earners | 9 (32.1%) | $0 |
| 3+ Earners | 0 (0.0%) | $0 |
| Total | 28 (100.0%) | $51,111 |
Household Income in Richland
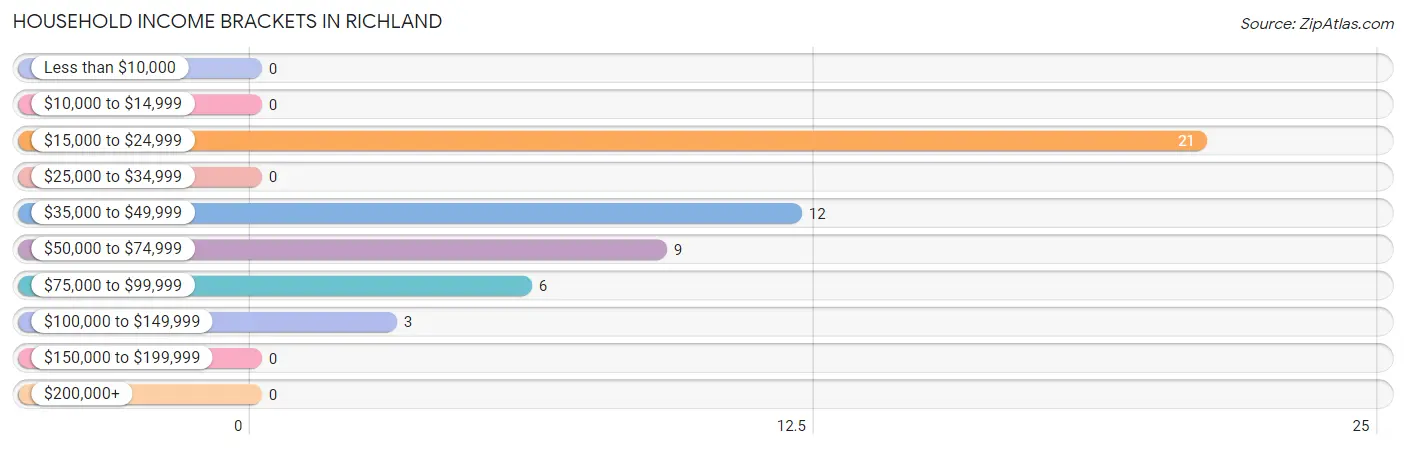
Household Income Brackets in Richland
With 21 households falling in the category, the $15,000 to $24,999 income range is the most frequent in Richland, accounting for 41.2% of all households.
| Income Bracket | # Households | % Households |
| Less than $10,000 | 0 | 0.0% |
| $10,000 to $14,999 | 0 | 0.0% |
| $15,000 to $24,999 | 21 | 41.2% |
| $25,000 to $34,999 | 0 | 0.0% |
| $35,000 to $49,999 | 12 | 23.5% |
| $50,000 to $74,999 | 9 | 17.6% |
| $75,000 to $99,999 | 6 | 11.8% |
| $100,000 to $149,999 | 3 | 5.9% |
| $150,000 to $199,999 | 0 | 0.0% |
| $200,000+ | 0 | 0.0% |
Household Income by Householder Age in Richland
| Income Bracket | # Households | Median Income |
| 15 to 24 Years | 12 (23.5%) | $0 |
| 25 to 44 Years | 6 (11.8%) | $0 |
| 45 to 64 Years | 33 (64.7%) | $0 |
| 65+ Years | 0 (0.0%) | $0 |
| Total | 51 (100.0%) | $40,938 |
Poverty in Richland
Income Below Poverty by Sex and Age in Richland
With 19.0% poverty level for males and 32.4% for females among the residents of Richland, 35 to 44 year old males and 18 to 24 year old females are the most vulnerable to poverty, with 9 males (56.2%) and 12 females (100.0%) in their respective age groups living below the poverty level.
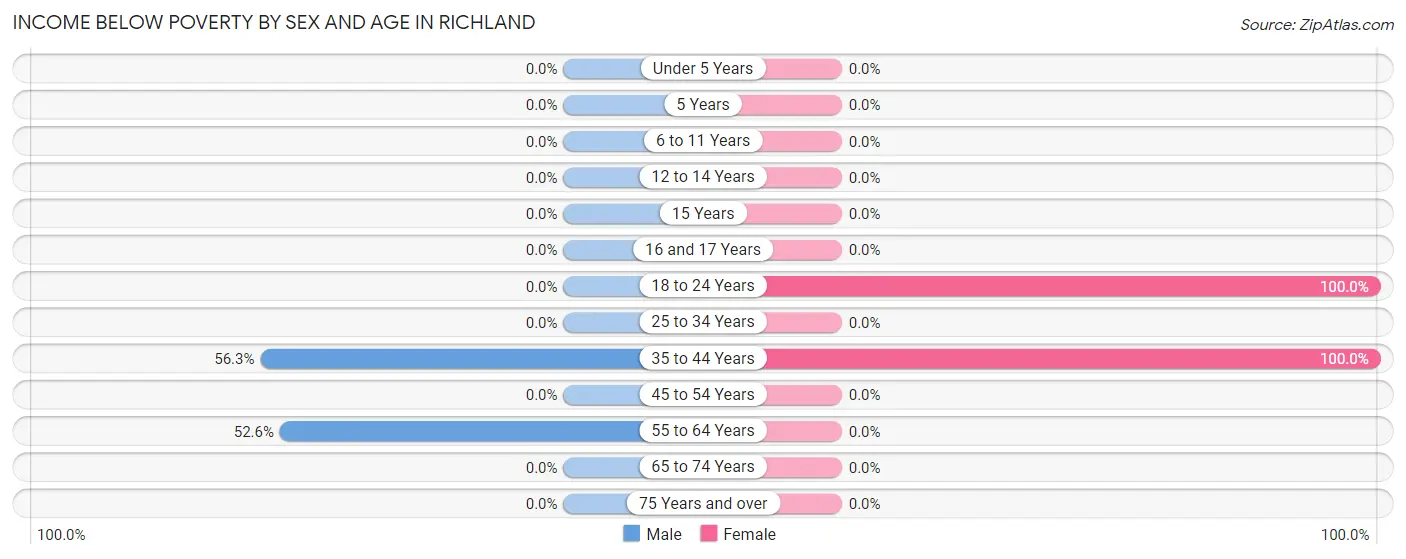
| Age Bracket | Male | Female |
| Under 5 Years | 0 (0.0%) | 0 (0.0%) |
| 5 Years | 0 (0.0%) | 0 (0.0%) |
| 6 to 11 Years | 0 (0.0%) | 0 (0.0%) |
| 12 to 14 Years | 0 (0.0%) | 0 (0.0%) |
| 15 Years | 0 (0.0%) | 0 (0.0%) |
| 16 and 17 Years | 0 (0.0%) | 0 (0.0%) |
| 18 to 24 Years | 0 (0.0%) | 12 (100.0%) |
| 25 to 34 Years | 0 (0.0%) | 0 (0.0%) |
| 35 to 44 Years | 9 (56.2%) | 10 (100.0%) |
| 45 to 54 Years | 0 (0.0%) | 0 (0.0%) |
| 55 to 64 Years | 10 (52.6%) | 0 (0.0%) |
| 65 to 74 Years | 0 (0.0%) | 0 (0.0%) |
| 75 Years and over | 0 (0.0%) | 0 (0.0%) |
| Total | 19 (19.0%) | 22 (32.4%) |
Income Above Poverty by Sex and Age in Richland
According to the poverty statistics in Richland, males aged under 5 years and females aged 6 to 11 years are the age groups that are most secure financially, with 100.0% of males and 100.0% of females in these age groups living above the poverty line.
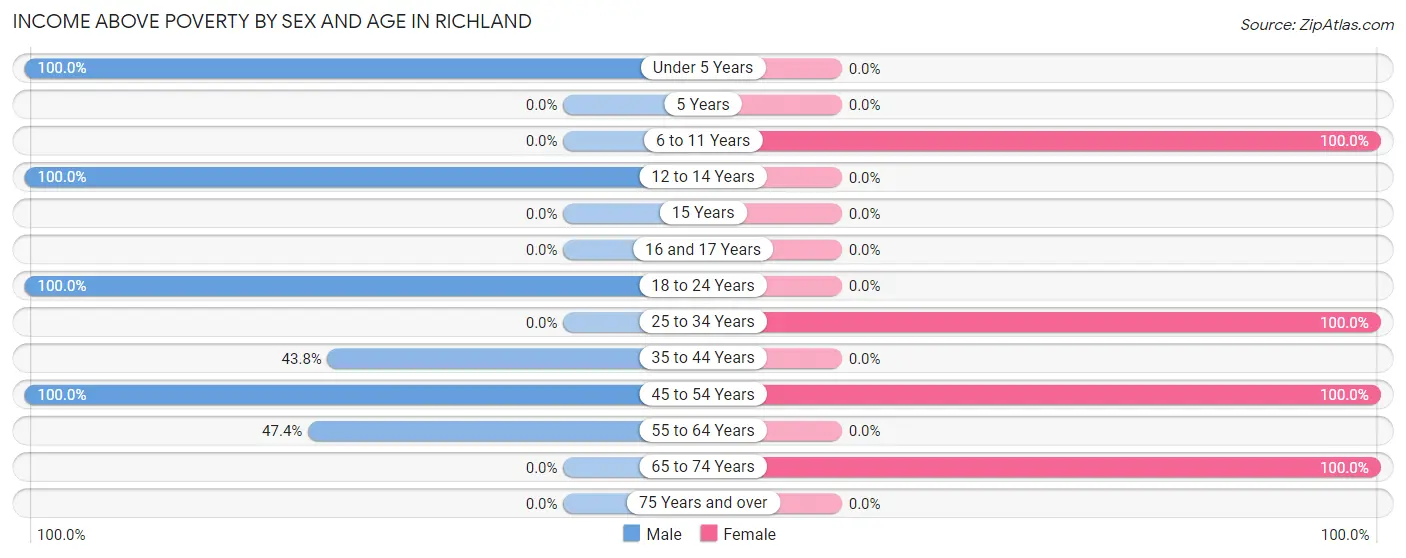
| Age Bracket | Male | Female |
| Under 5 Years | 14 (100.0%) | 0 (0.0%) |
| 5 Years | 0 (0.0%) | 0 (0.0%) |
| 6 to 11 Years | 0 (0.0%) | 6 (100.0%) |
| 12 to 14 Years | 14 (100.0%) | 0 (0.0%) |
| 15 Years | 0 (0.0%) | 0 (0.0%) |
| 16 and 17 Years | 0 (0.0%) | 0 (0.0%) |
| 18 to 24 Years | 34 (100.0%) | 0 (0.0%) |
| 25 to 34 Years | 0 (0.0%) | 6 (100.0%) |
| 35 to 44 Years | 7 (43.8%) | 0 (0.0%) |
| 45 to 54 Years | 3 (100.0%) | 23 (100.0%) |
| 55 to 64 Years | 9 (47.4%) | 0 (0.0%) |
| 65 to 74 Years | 0 (0.0%) | 11 (100.0%) |
| 75 Years and over | 0 (0.0%) | 0 (0.0%) |
| Total | 81 (81.0%) | 46 (67.6%) |
Income Below Poverty Among Married-Couple Families in Richland
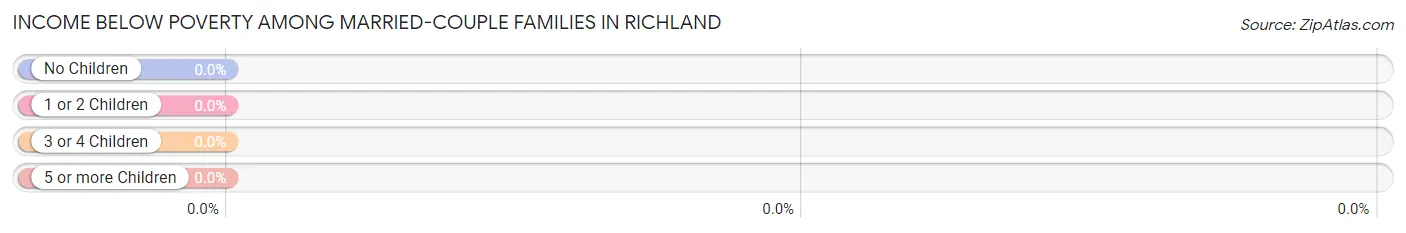
| Children | Above Poverty | Below Poverty |
| No Children | 9 (100.0%) | 0 (0.0%) |
| 1 or 2 Children | 3 (100.0%) | 0 (0.0%) |
| 3 or 4 Children | 6 (100.0%) | 0 (0.0%) |
| 5 or more Children | 0 (0.0%) | 0 (0.0%) |
| Total | 18 (100.0%) | 0 (0.0%) |
Income Below Poverty Among Single-Parent Households in Richland
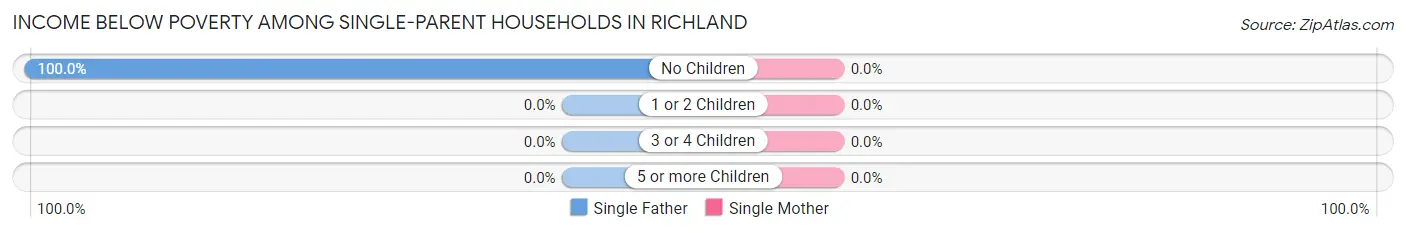
| Children | Single Father | Single Mother |
| No Children | 10 (100.0%) | 0 (0.0%) |
| 1 or 2 Children | 0 (0.0%) | 0 (0.0%) |
| 3 or 4 Children | 0 (0.0%) | 0 (0.0%) |
| 5 or more Children | 0 (0.0%) | 0 (0.0%) |
| Total | 10 (100.0%) | 0 (0.0%) |
Income Below Poverty Among Married-Couple vs Single-Parent Households in Richland
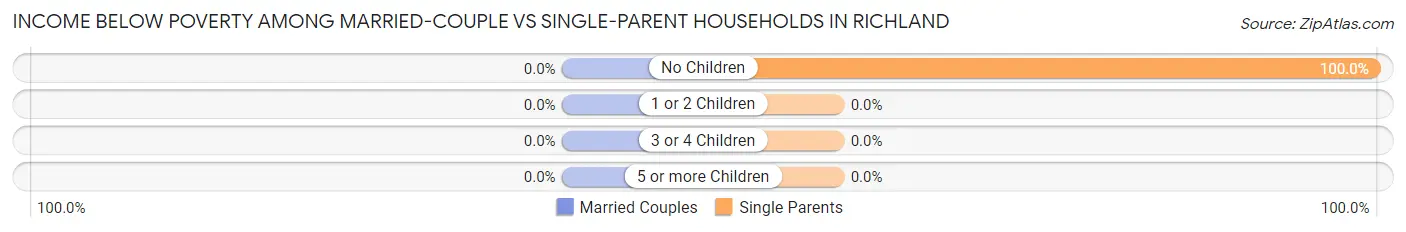
| Children | Married-Couple Families | Single-Parent Households |
| No Children | 0 (0.0%) | 10 (100.0%) |
| 1 or 2 Children | 0 (0.0%) | 0 (0.0%) |
| 3 or 4 Children | 0 (0.0%) | 0 (0.0%) |
| 5 or more Children | 0 (0.0%) | 0 (0.0%) |
| Total | 0 (0.0%) | 10 (100.0%) |
Race in Richland
The most populous races in Richland are , and White / Caucasian (168 | 100.0%).
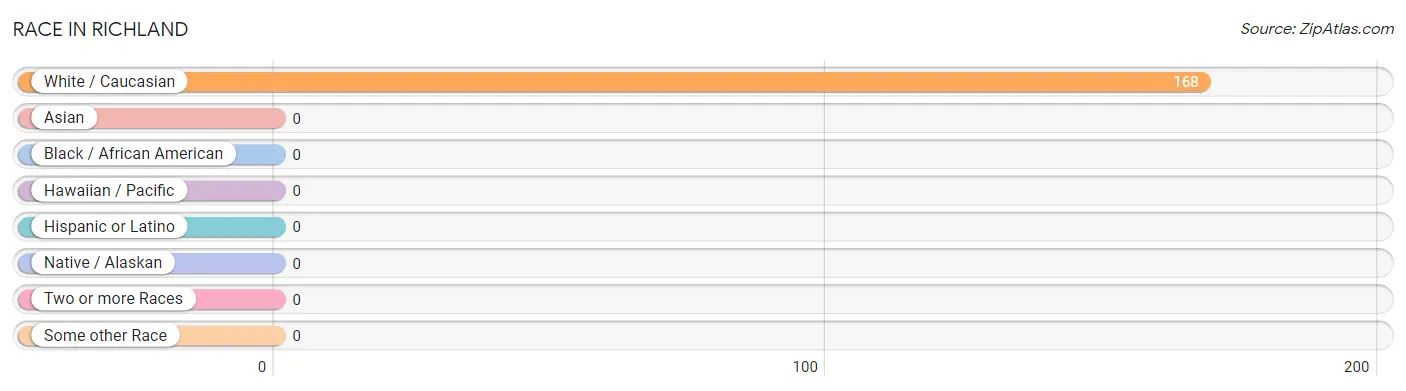
| Race | # Population | % Population |
| Asian | 0 | 0.0% |
| Black / African American | 0 | 0.0% |
| Hawaiian / Pacific | 0 | 0.0% |
| Hispanic or Latino | 0 | 0.0% |
| Native / Alaskan | 0 | 0.0% |
| White / Caucasian | 168 | 100.0% |
| Two or more Races | 0 | 0.0% |
| Some other Race | 0 | 0.0% |
| Total | 168 | 100.0% |
Ancestry in Richland
The most populous ancestries reported in Richland are Scandinavian (37 | 22.0%), European (23 | 13.7%), German (21 | 12.5%), Irish (21 | 12.5%), and Swedish (12 | 7.1%), together accounting for 67.8% of all Richland residents.
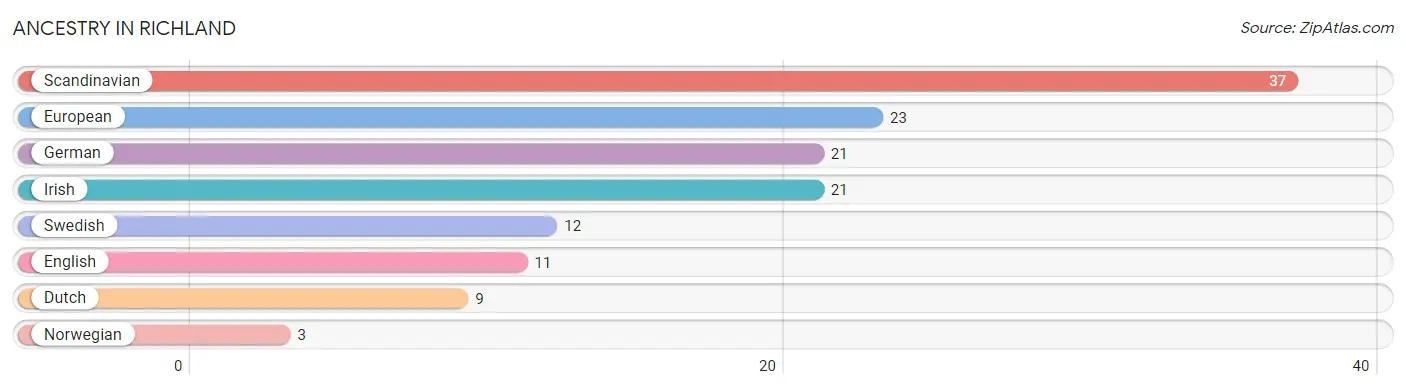
| Ancestry | # Population | % Population |
| Dutch | 9 | 5.4% |
| English | 11 | 6.6% |
| European | 23 | 13.7% |
| German | 21 | 12.5% |
| Irish | 21 | 12.5% |
| Norwegian | 3 | 1.8% |
| Scandinavian | 37 | 22.0% |
| Swedish | 12 | 7.1% | View All 8 Rows |
Immigrants in Richland

| Immigration Origin | # Population | % Population | View All 0 Rows |
Sex and Age in Richland
Sex and Age in Richland
The most populous age groups in Richland are 15 to 19 Years (23 | 23.0%) for men and 20 to 24 Years (12 | 17.6%) for women.
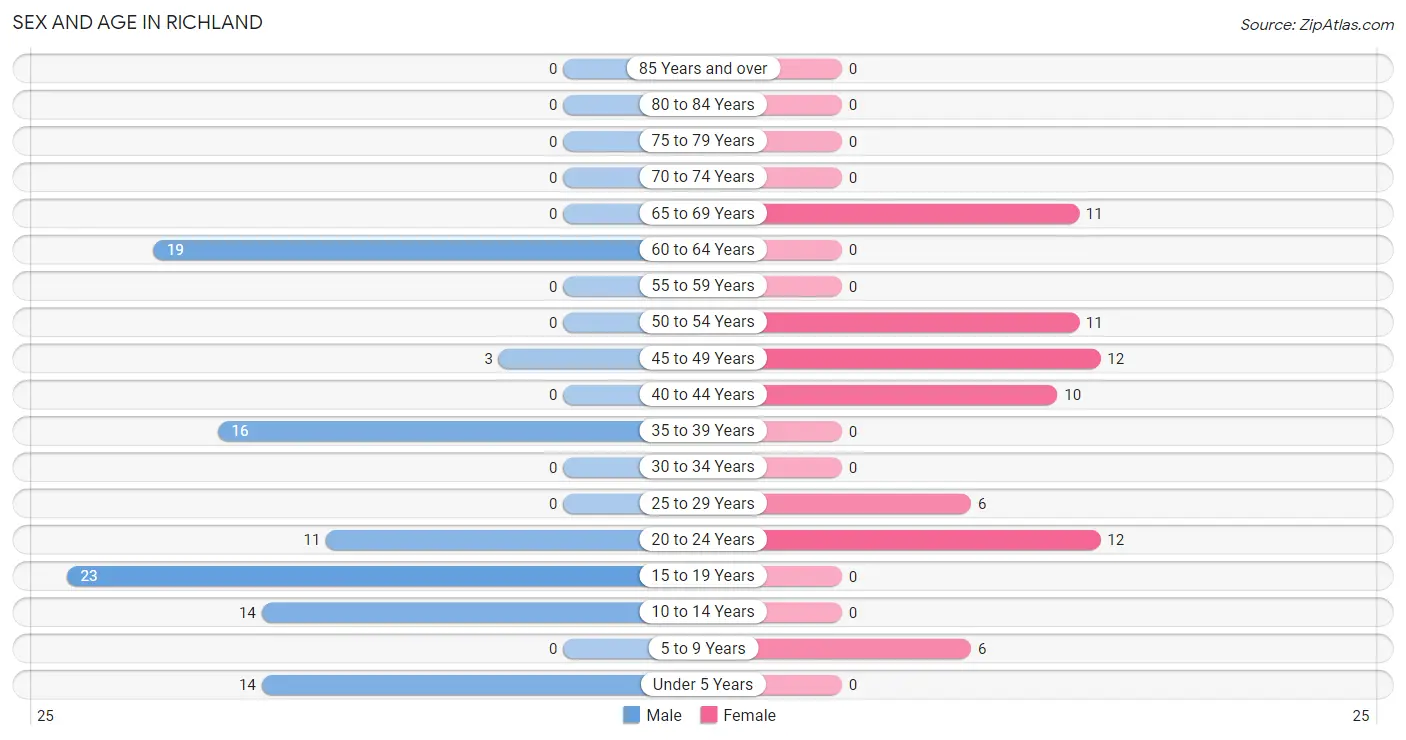
| Age Bracket | Male | Female |
| Under 5 Years | 14 (14.0%) | 0 (0.0%) |
| 5 to 9 Years | 0 (0.0%) | 6 (8.8%) |
| 10 to 14 Years | 14 (14.0%) | 0 (0.0%) |
| 15 to 19 Years | 23 (23.0%) | 0 (0.0%) |
| 20 to 24 Years | 11 (11.0%) | 12 (17.6%) |
| 25 to 29 Years | 0 (0.0%) | 6 (8.8%) |
| 30 to 34 Years | 0 (0.0%) | 0 (0.0%) |
| 35 to 39 Years | 16 (16.0%) | 0 (0.0%) |
| 40 to 44 Years | 0 (0.0%) | 10 (14.7%) |
| 45 to 49 Years | 3 (3.0%) | 12 (17.6%) |
| 50 to 54 Years | 0 (0.0%) | 11 (16.2%) |
| 55 to 59 Years | 0 (0.0%) | 0 (0.0%) |
| 60 to 64 Years | 19 (19.0%) | 0 (0.0%) |
| 65 to 69 Years | 0 (0.0%) | 11 (16.2%) |
| 70 to 74 Years | 0 (0.0%) | 0 (0.0%) |
| 75 to 79 Years | 0 (0.0%) | 0 (0.0%) |
| 80 to 84 Years | 0 (0.0%) | 0 (0.0%) |
| 85 Years and over | 0 (0.0%) | 0 (0.0%) |
| Total | 100 (100.0%) | 68 (100.0%) |
Families and Households in Richland
Median Family Size in Richland
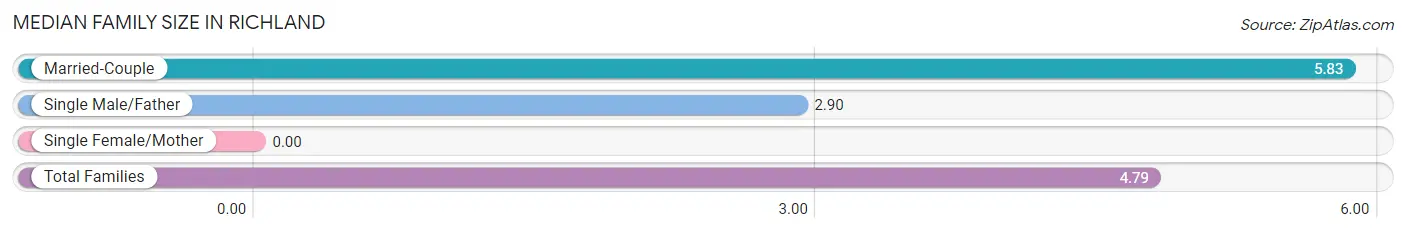
| Family Type | # Families | Family Size |
| Married-Couple | 18 (64.3%) | 5.83 |
| Single Male/Father | 10 (35.7%) | 2.90 |
| Single Female/Mother | 0 (0.0%) | - |
| Total Families | 28 (100.0%) | 4.79 |
Median Household Size in Richland
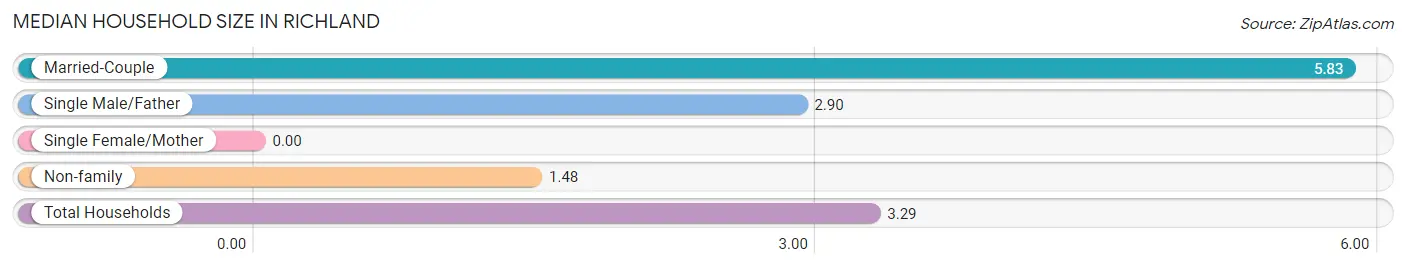
| Household Type | # Households | Household Size |
| Married-Couple | 18 (35.3%) | 5.83 |
| Single Male/Father | 10 (19.6%) | 2.90 |
| Single Female/Mother | 0 (0.0%) | - |
| Non-family | 23 (45.1%) | 1.48 |
| Total Households | 51 (100.0%) | 3.29 |
Household Size by Marriage Status in Richland
Out of a total of 51 households in Richland, 28 (54.9%) are family households, while 23 (45.1%) are nonfamily households. The most numerous type of family households are 3-person households, comprising 10, and the most common type of nonfamily households are 2-person households, comprising 12.
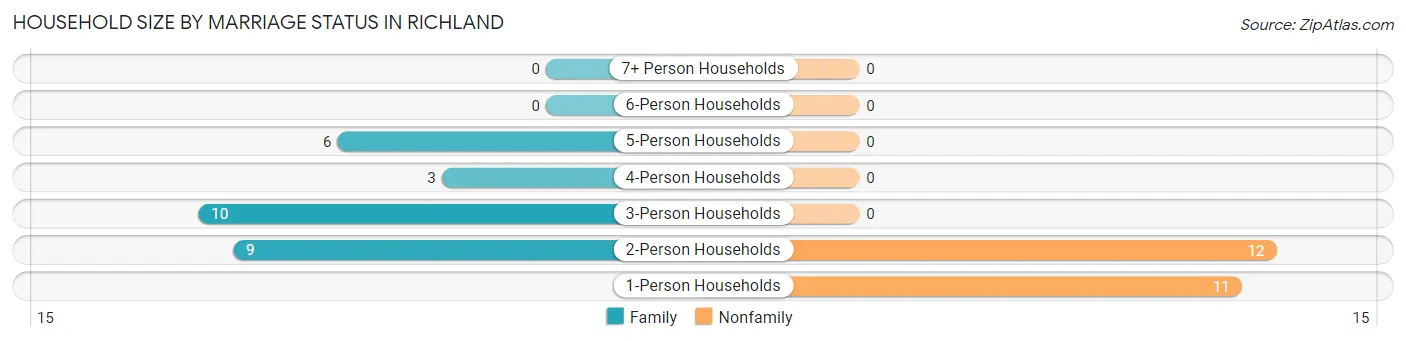
| Household Size | Family Households | Nonfamily Households |
| 1-Person Households | - | 11 (21.6%) |
| 2-Person Households | 9 (17.6%) | 12 (23.5%) |
| 3-Person Households | 10 (19.6%) | 0 (0.0%) |
| 4-Person Households | 3 (5.9%) | 0 (0.0%) |
| 5-Person Households | 6 (11.8%) | 0 (0.0%) |
| 6-Person Households | 0 (0.0%) | 0 (0.0%) |
| 7+ Person Households | 0 (0.0%) | 0 (0.0%) |
| Total | 28 (54.9%) | 23 (45.1%) |
Female Fertility in Richland
Fertility by Age in Richland
Average fertility rate in Richland is 150.0 births per 1,000 women. Women in the age bracket of 20 to 34 years have the highest fertility rate with 333.0 births per 1,000 women. Women in the age bracket of 20 to 34 years acount for 100.0% of all women with births.
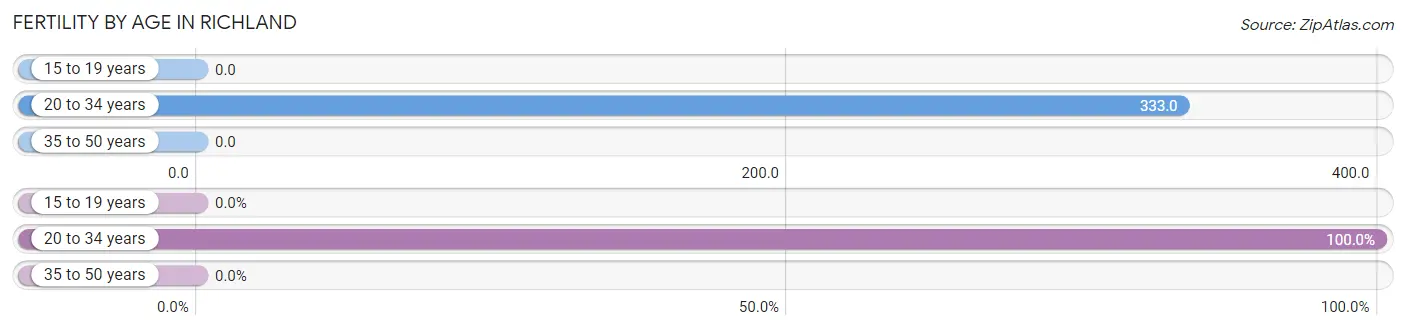
| Age Bracket | Women with Births | Births / 1,000 Women |
| 15 to 19 years | 0 (0.0%) | 0.0 |
| 20 to 34 years | 6 (100.0%) | 333.0 |
| 35 to 50 years | 0 (0.0%) | 0.0 |
| Total | 6 (100.0%) | 150.0 |
Fertility by Age by Marriage Status in Richland
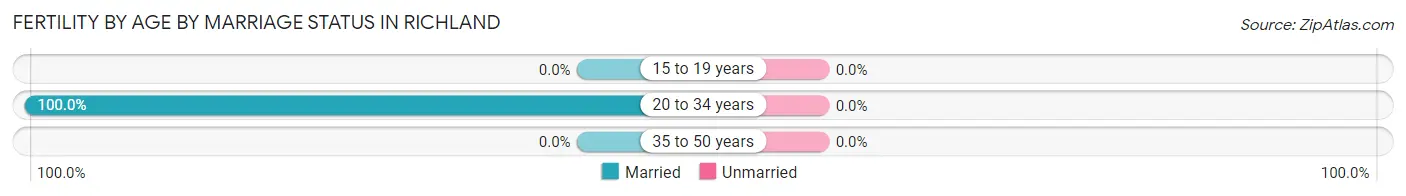
| Age Bracket | Married | Unmarried |
| 15 to 19 years | 0 (0.0%) | 0 (0.0%) |
| 20 to 34 years | 6 (100.0%) | 0 (0.0%) |
| 35 to 50 years | 0 (0.0%) | 0 (0.0%) |
| Total | 6 (100.0%) | 0 (0.0%) |
Fertility by Education in Richland
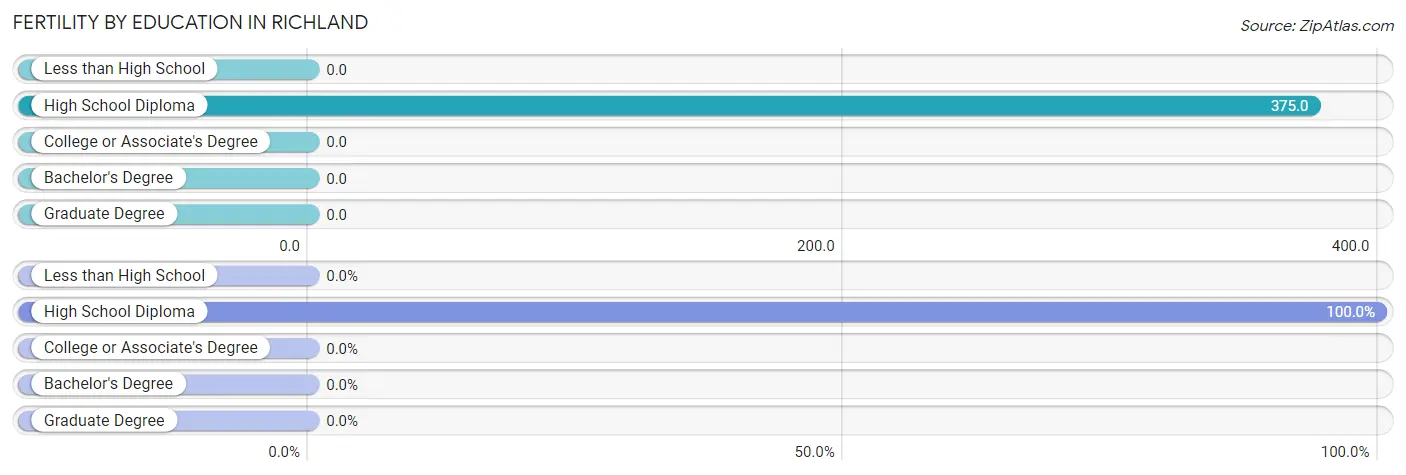
| Educational Attainment | Women with Births | Births / 1,000 Women |
| Less than High School | 0 (0.0%) | 0.0 |
| High School Diploma | 6 (100.0%) | 375.0 |
| College or Associate's Degree | 0 (0.0%) | 0.0 |
| Bachelor's Degree | 0 (0.0%) | 0.0 |
| Graduate Degree | 0 (0.0%) | 0.0 |
| Total | 6 (100.0%) | 150.0 |
Fertility by Education by Marriage Status in Richland
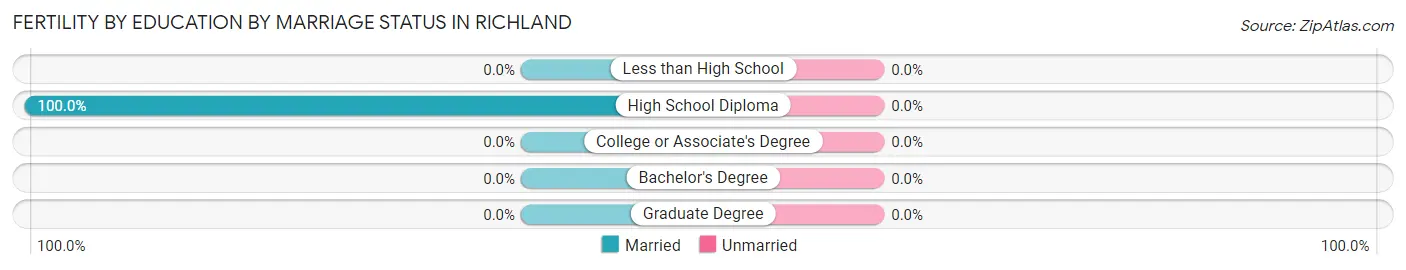
| Educational Attainment | Married | Unmarried |
| Less than High School | 0 (0.0%) | 0 (0.0%) |
| High School Diploma | 6 (100.0%) | 0 (0.0%) |
| College or Associate's Degree | 0 (0.0%) | 0 (0.0%) |
| Bachelor's Degree | 0 (0.0%) | 0 (0.0%) |
| Graduate Degree | 0 (0.0%) | 0 (0.0%) |
| Total | 6 (100.0%) | 0 (0.0%) |
Employment Characteristics in Richland
Employment by Class of Employer in Richland
Among the 60 employed individuals in Richland, private company employees (27 | 45.0%), not-for-profit organizations (12 | 20.0%), and federal government employees (12 | 20.0%) make up the most common classes of employment.
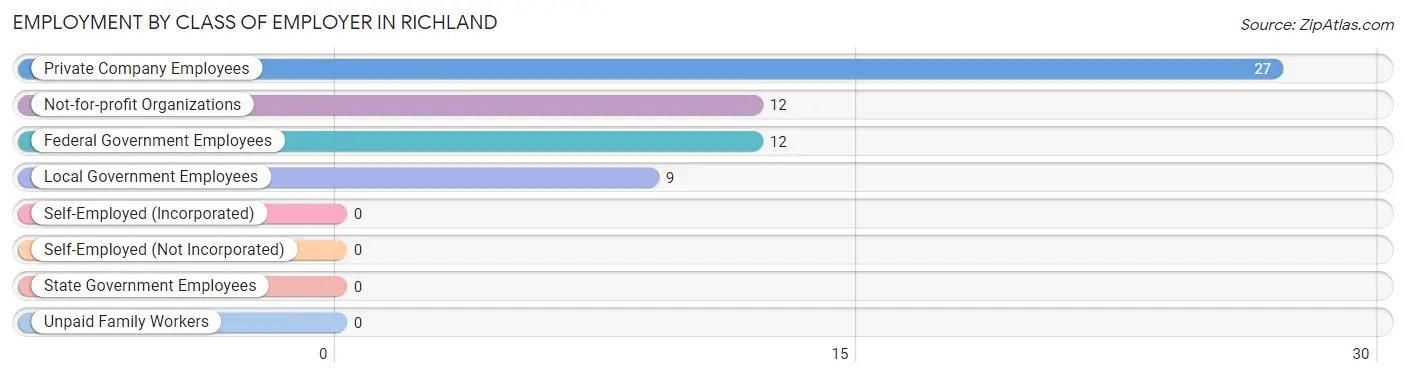
| Employer Class | # Employees | % Employees |
| Private Company Employees | 27 | 45.0% |
| Self-Employed (Incorporated) | 0 | 0.0% |
| Self-Employed (Not Incorporated) | 0 | 0.0% |
| Not-for-profit Organizations | 12 | 20.0% |
| Local Government Employees | 9 | 15.0% |
| State Government Employees | 0 | 0.0% |
| Federal Government Employees | 12 | 20.0% |
| Unpaid Family Workers | 0 | 0.0% |
| Total | 60 | 100.0% |
Employment Status by Age in Richland
According to the labor force statistics for Richland, out of the total population over 16 years of age (134), 52.2% or 70 individuals are in the labor force, with 17.2% or 12 of them unemployed. The age group with the highest labor force participation rate is 20 to 24 years, with 100.0% or 23 individuals in the labor force. Within the labor force, the 35 to 44 years age range has the highest percentage of unemployed individuals, with 58.8% or 10 of them being unemployed.
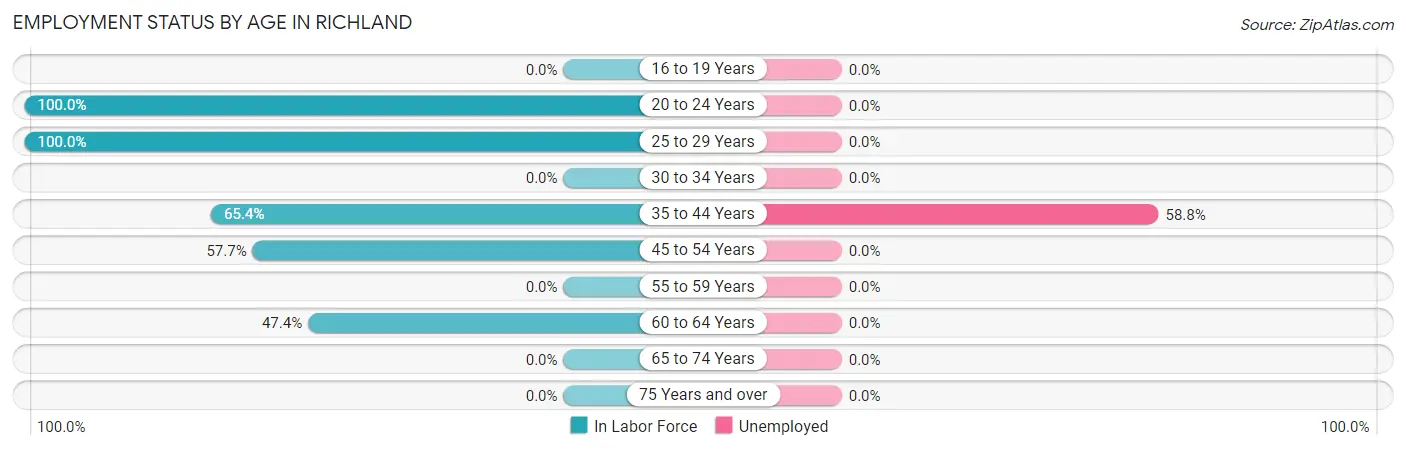
| Age Bracket | In Labor Force | Unemployed |
| 16 to 19 Years | 0 (0.0%) | 0 (0.0%) |
| 20 to 24 Years | 23 (100.0%) | 0 (0.0%) |
| 25 to 29 Years | 6 (100.0%) | 0 (0.0%) |
| 30 to 34 Years | 0 (0.0%) | 0 (0.0%) |
| 35 to 44 Years | 17 (65.4%) | 10 (58.8%) |
| 45 to 54 Years | 15 (57.7%) | 0 (0.0%) |
| 55 to 59 Years | 0 (0.0%) | 0 (0.0%) |
| 60 to 64 Years | 9 (47.4%) | 0 (0.0%) |
| 65 to 74 Years | 0 (0.0%) | 0 (0.0%) |
| 75 Years and over | 0 (0.0%) | 0 (0.0%) |
| Total | 70 (52.2%) | 12 (17.2%) |
Employment Status by Educational Attainment in Richland
According to labor force statistics for Richland, 61.0% of individuals (47) out of the total population between 25 and 64 years of age (77) are in the labor force, with 21.3% or 10 of them being unemployed. The group with the highest labor force participation rate are those with the educational attainment of college / associate degree, with 100.0% or 7 individuals in the labor force. Within the labor force, individuals with high school diploma education have the highest percentage of unemployment, with 62.5% or 10 of them being unemployed.
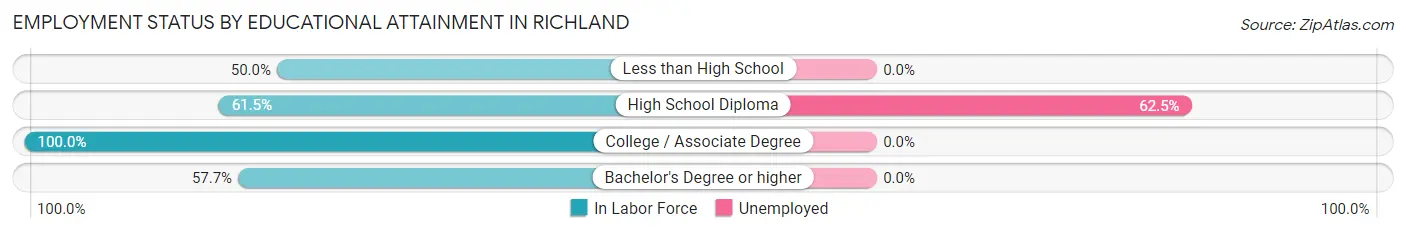
| Educational Attainment | In Labor Force | Unemployed |
| Less than High School | 9 (50.0%) | 0 (0.0%) |
| High School Diploma | 16 (61.5%) | 16 (62.5%) |
| College / Associate Degree | 7 (100.0%) | 0 (0.0%) |
| Bachelor's Degree or higher | 15 (57.7%) | 0 (0.0%) |
| Total | 47 (61.0%) | 16 (21.3%) |
Employment Occupations by Sex in Richland
Management, Business, Science and Arts Occupations
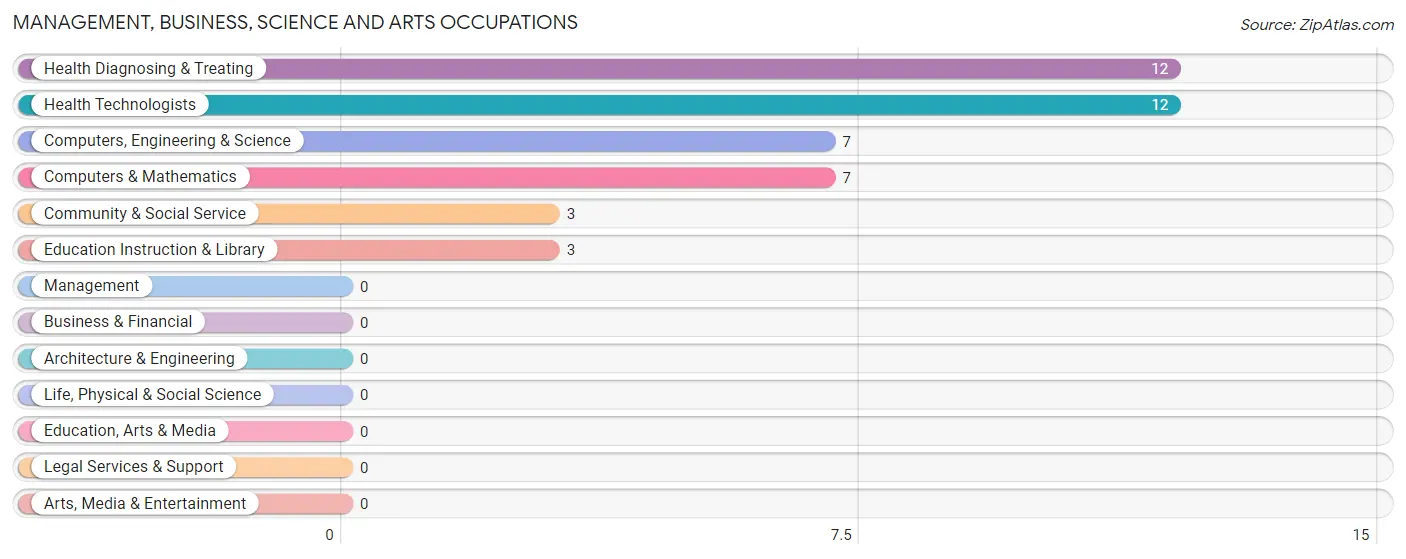
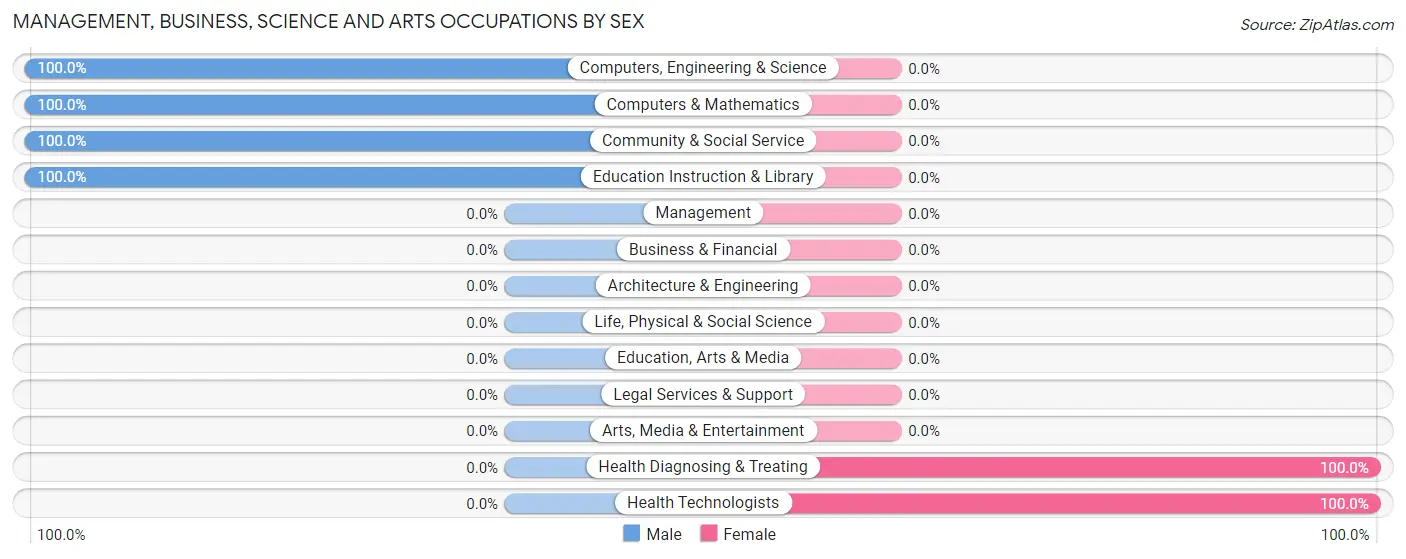
The most common Management, Business, Science and Arts occupations in Richland are Health Diagnosing & Treating (12 | 25.0%), Health Technologists (12 | 25.0%), Computers, Engineering & Science (7 | 14.6%), Computers & Mathematics (7 | 14.6%), and Community & Social Service (3 | 6.2%).
Management, Business, Science and Arts Occupations by Sex
Within the Management, Business, Science and Arts occupations in Richland, the most male-oriented occupations are Computers, Engineering & Science (100.0%), Computers & Mathematics (100.0%), and Community & Social Service (100.0%), while the most female-oriented occupations are Health Diagnosing & Treating (100.0%), and Health Technologists (100.0%).
| Occupation | Male | Female |
| Management | 0 (0.0%) | 0 (0.0%) |
| Business & Financial | 0 (0.0%) | 0 (0.0%) |
| Computers, Engineering & Science | 7 (100.0%) | 0 (0.0%) |
| Computers & Mathematics | 7 (100.0%) | 0 (0.0%) |
| Architecture & Engineering | 0 (0.0%) | 0 (0.0%) |
| Life, Physical & Social Science | 0 (0.0%) | 0 (0.0%) |
| Community & Social Service | 3 (100.0%) | 0 (0.0%) |
| Education, Arts & Media | 0 (0.0%) | 0 (0.0%) |
| Legal Services & Support | 0 (0.0%) | 0 (0.0%) |
| Education Instruction & Library | 3 (100.0%) | 0 (0.0%) |
| Arts, Media & Entertainment | 0 (0.0%) | 0 (0.0%) |
| Health Diagnosing & Treating | 0 (0.0%) | 12 (100.0%) |
| Health Technologists | 0 (0.0%) | 12 (100.0%) |
| Total (Category) | 10 (45.5%) | 12 (54.5%) |
| Total (Overall) | 30 (62.5%) | 18 (37.5%) |
Services Occupations
Services Occupations by Sex
| Occupation | Male | Female |
| Healthcare Support | 0 (0.0%) | 0 (0.0%) |
| Security & Protection | 0 (0.0%) | 0 (0.0%) |
| Firefighting & Prevention | 0 (0.0%) | 0 (0.0%) |
| Law Enforcement | 0 (0.0%) | 0 (0.0%) |
| Food Preparation & Serving | 0 (0.0%) | 0 (0.0%) |
| Cleaning & Maintenance | 0 (0.0%) | 0 (0.0%) |
| Personal Care & Service | 0 (0.0%) | 0 (0.0%) |
| Total (Category) | 0 (0.0%) | 0 (0.0%) |
| Total (Overall) | 30 (62.5%) | 18 (37.5%) |
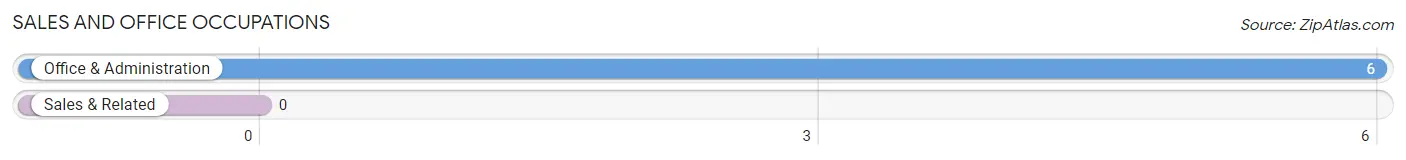
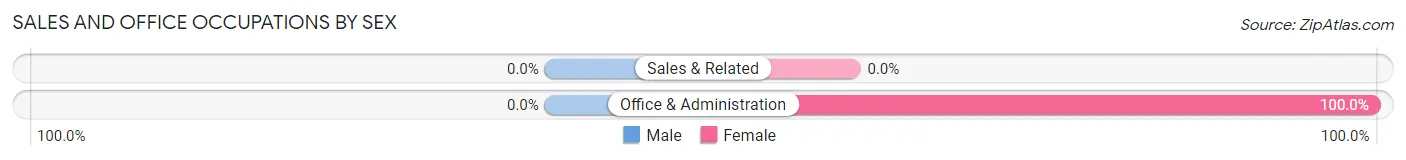
Sales and Office Occupations
The most common Sales and Office occupations in Richland are , and Office & Administration (6 | 12.5%).
Sales and Office Occupations by Sex
| Occupation | Male | Female |
| Sales & Related | 0 (0.0%) | 0 (0.0%) |
| Office & Administration | 0 (0.0%) | 6 (100.0%) |
| Total (Category) | 0 (0.0%) | 6 (100.0%) |
| Total (Overall) | 30 (62.5%) | 18 (37.5%) |
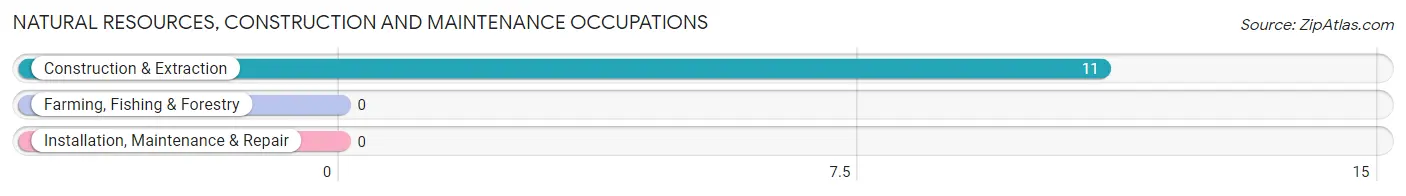
Natural Resources, Construction and Maintenance Occupations
The most common Natural Resources, Construction and Maintenance occupations in Richland are , and Construction & Extraction (11 | 22.9%).
Natural Resources, Construction and Maintenance Occupations by Sex
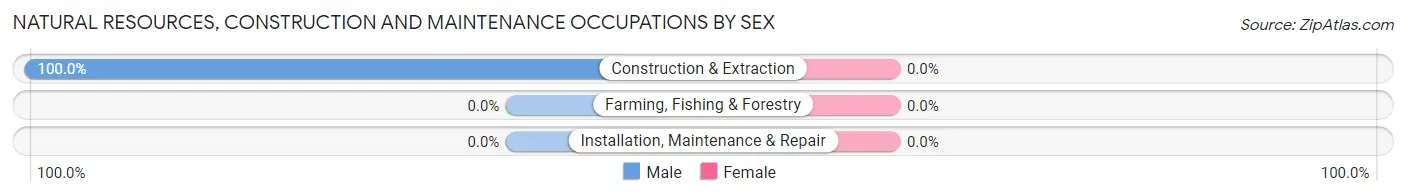
| Occupation | Male | Female |
| Farming, Fishing & Forestry | 0 (0.0%) | 0 (0.0%) |
| Construction & Extraction | 11 (100.0%) | 0 (0.0%) |
| Installation, Maintenance & Repair | 0 (0.0%) | 0 (0.0%) |
| Total (Category) | 11 (100.0%) | 0 (0.0%) |
| Total (Overall) | 30 (62.5%) | 18 (37.5%) |
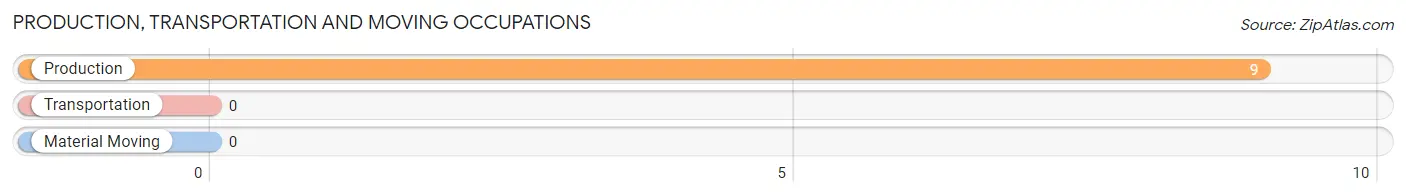
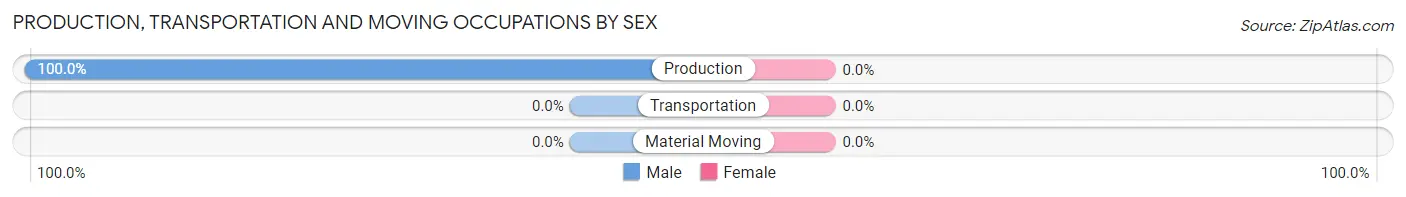
Production, Transportation and Moving Occupations
The most common Production, Transportation and Moving occupations in Richland are , and Production (9 | 18.8%).
Production, Transportation and Moving Occupations by Sex
| Occupation | Male | Female |
| Production | 9 (100.0%) | 0 (0.0%) |
| Transportation | 0 (0.0%) | 0 (0.0%) |
| Material Moving | 0 (0.0%) | 0 (0.0%) |
| Total (Category) | 9 (100.0%) | 0 (0.0%) |
| Total (Overall) | 30 (62.5%) | 18 (37.5%) |
Employment Industries by Sex in Richland
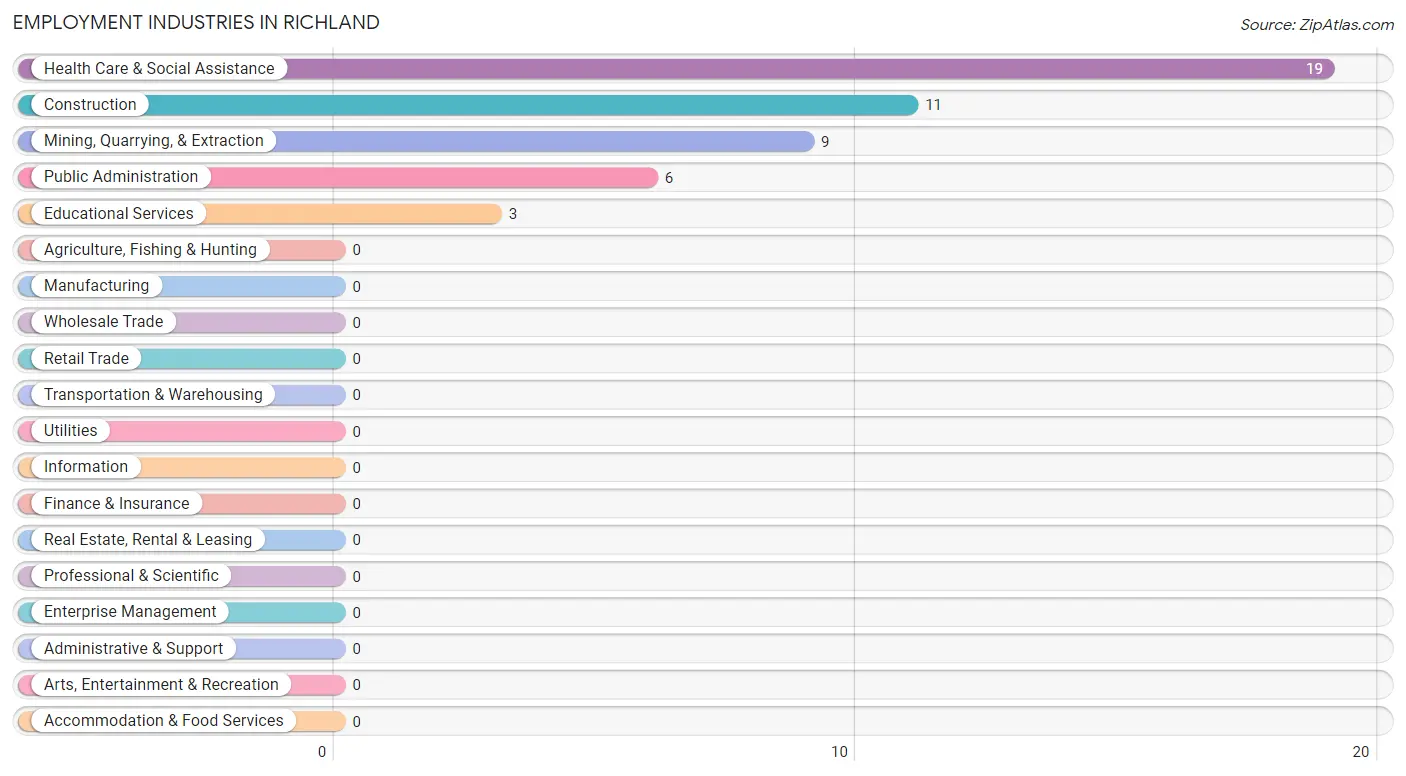
Employment Industries in Richland
The major employment industries in Richland include Health Care & Social Assistance (19 | 39.6%), Construction (11 | 22.9%), Mining, Quarrying, & Extraction (9 | 18.8%), Public Administration (6 | 12.5%), and Educational Services (3 | 6.2%).
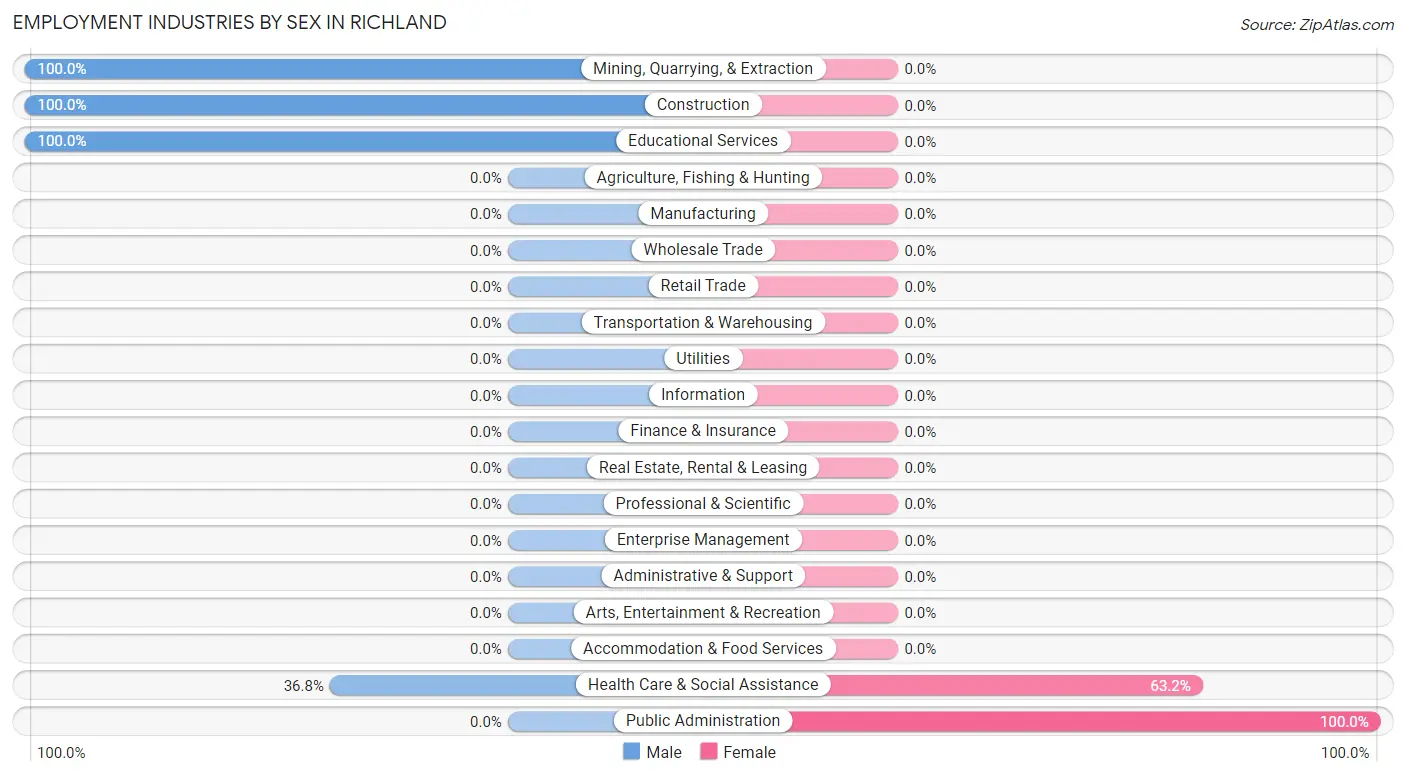
Employment Industries by Sex in Richland
The Richland industries that see more men than women are Mining, Quarrying, & Extraction (100.0%), Construction (100.0%), and Educational Services (100.0%), whereas the industries that tend to have a higher number of women are Public Administration (100.0%), and Health Care & Social Assistance (63.2%).
| Industry | Male | Female |
| Agriculture, Fishing & Hunting | 0 (0.0%) | 0 (0.0%) |
| Mining, Quarrying, & Extraction | 9 (100.0%) | 0 (0.0%) |
| Construction | 11 (100.0%) | 0 (0.0%) |
| Manufacturing | 0 (0.0%) | 0 (0.0%) |
| Wholesale Trade | 0 (0.0%) | 0 (0.0%) |
| Retail Trade | 0 (0.0%) | 0 (0.0%) |
| Transportation & Warehousing | 0 (0.0%) | 0 (0.0%) |
| Utilities | 0 (0.0%) | 0 (0.0%) |
| Information | 0 (0.0%) | 0 (0.0%) |
| Finance & Insurance | 0 (0.0%) | 0 (0.0%) |
| Real Estate, Rental & Leasing | 0 (0.0%) | 0 (0.0%) |
| Professional & Scientific | 0 (0.0%) | 0 (0.0%) |
| Enterprise Management | 0 (0.0%) | 0 (0.0%) |
| Administrative & Support | 0 (0.0%) | 0 (0.0%) |
| Educational Services | 3 (100.0%) | 0 (0.0%) |
| Health Care & Social Assistance | 7 (36.8%) | 12 (63.2%) |
| Arts, Entertainment & Recreation | 0 (0.0%) | 0 (0.0%) |
| Accommodation & Food Services | 0 (0.0%) | 0 (0.0%) |
| Public Administration | 0 (0.0%) | 6 (100.0%) |
| Total | 30 (62.5%) | 18 (37.5%) |
Education in Richland
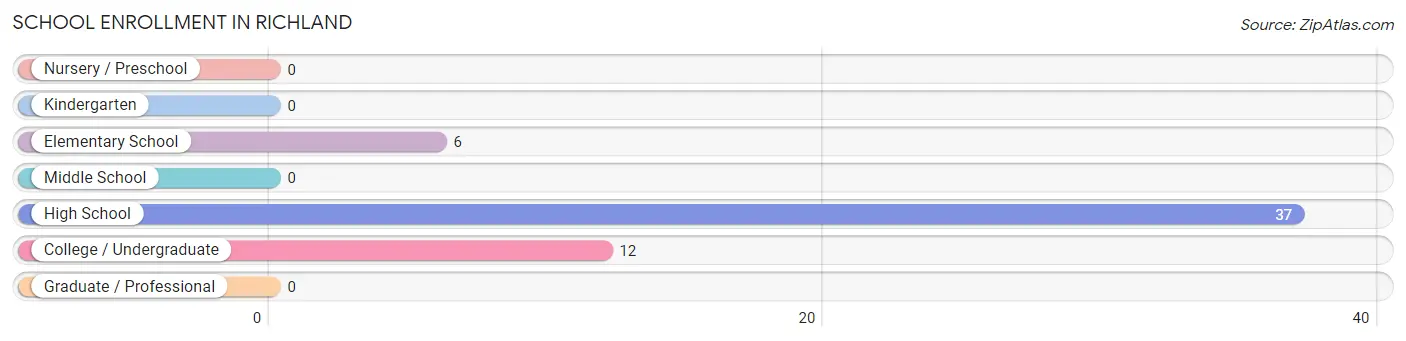
School Enrollment in Richland
The most common levels of schooling among the 55 students in Richland are high school (37 | 67.3%), college / undergraduate (12 | 21.8%), and elementary school (6 | 10.9%).
| School Level | # Students | % Students |
| Nursery / Preschool | 0 | 0.0% |
| Kindergarten | 0 | 0.0% |
| Elementary School | 6 | 10.9% |
| Middle School | 0 | 0.0% |
| High School | 37 | 67.3% |
| College / Undergraduate | 12 | 21.8% |
| Graduate / Professional | 0 | 0.0% |
| Total | 55 | 100.0% |
School Enrollment by Age by Funding Source in Richland
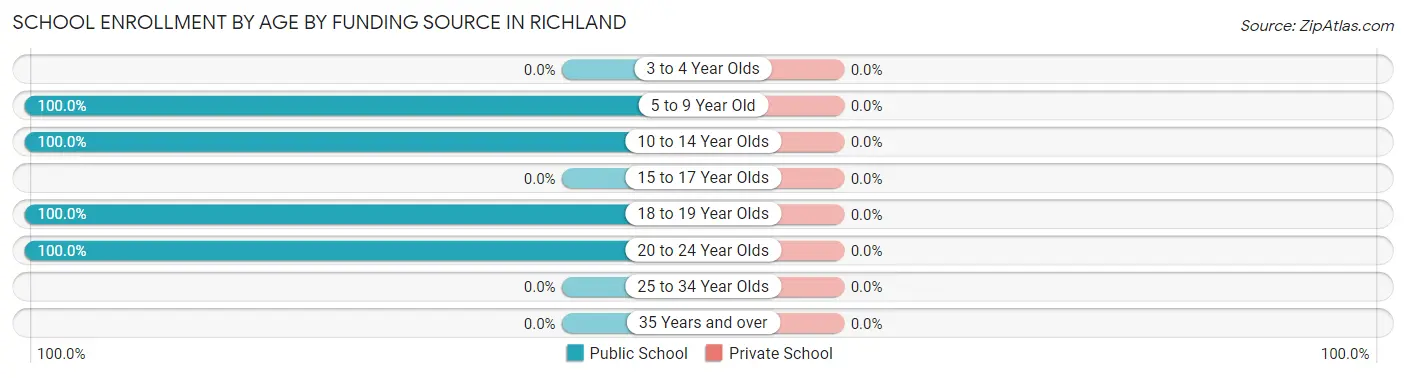
| Age Bracket | Public School | Private School |
| 3 to 4 Year Olds | 0 (0.0%) | 0 (0.0%) |
| 5 to 9 Year Old | 6 (100.0%) | 0 (0.0%) |
| 10 to 14 Year Olds | 14 (100.0%) | 0 (0.0%) |
| 15 to 17 Year Olds | 0 (0.0%) | 0 (0.0%) |
| 18 to 19 Year Olds | 23 (100.0%) | 0 (0.0%) |
| 20 to 24 Year Olds | 12 (100.0%) | 0 (0.0%) |
| 25 to 34 Year Olds | 0 (0.0%) | 0 (0.0%) |
| 35 Years and over | 0 (0.0%) | 0 (0.0%) |
| Total | 55 (100.0%) | 0 (0.0%) |
Educational Attainment by Field of Study in Richland
Arts & humanities (12 | 46.2%), business (11 | 42.3%), and social sciences (3 | 11.5%) are the most common fields of study among 26 individuals in Richland who have obtained a bachelor's degree or higher.
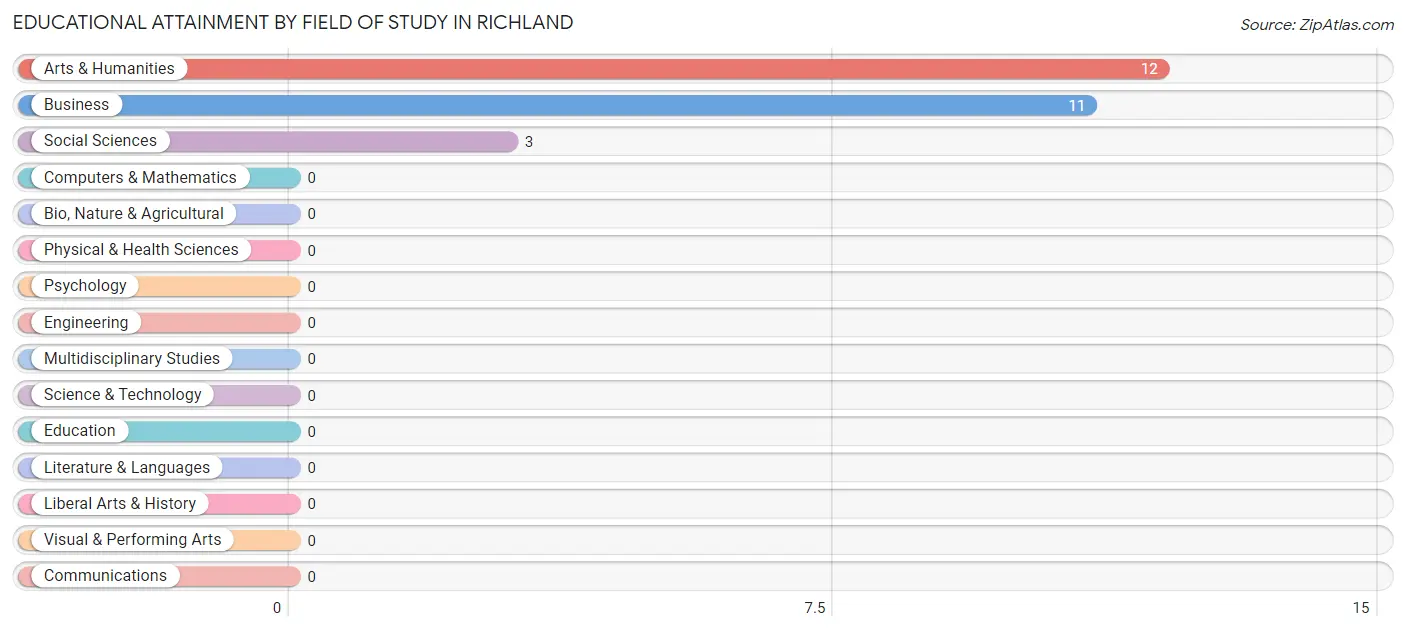
| Field of Study | # Graduates | % Graduates |
| Computers & Mathematics | 0 | 0.0% |
| Bio, Nature & Agricultural | 0 | 0.0% |
| Physical & Health Sciences | 0 | 0.0% |
| Psychology | 0 | 0.0% |
| Social Sciences | 3 | 11.5% |
| Engineering | 0 | 0.0% |
| Multidisciplinary Studies | 0 | 0.0% |
| Science & Technology | 0 | 0.0% |
| Business | 11 | 42.3% |
| Education | 0 | 0.0% |
| Literature & Languages | 0 | 0.0% |
| Liberal Arts & History | 0 | 0.0% |
| Visual & Performing Arts | 0 | 0.0% |
| Communications | 0 | 0.0% |
| Arts & Humanities | 12 | 46.2% |
| Total | 26 | 100.0% |
Transportation & Commute in Richland
Vehicle Availability by Sex in Richland
The most prevalent vehicle ownership categories in Richland are males with 2 vehicles (20, accounting for 66.7%) and females with 2 vehicles (12, making up 66.7%).
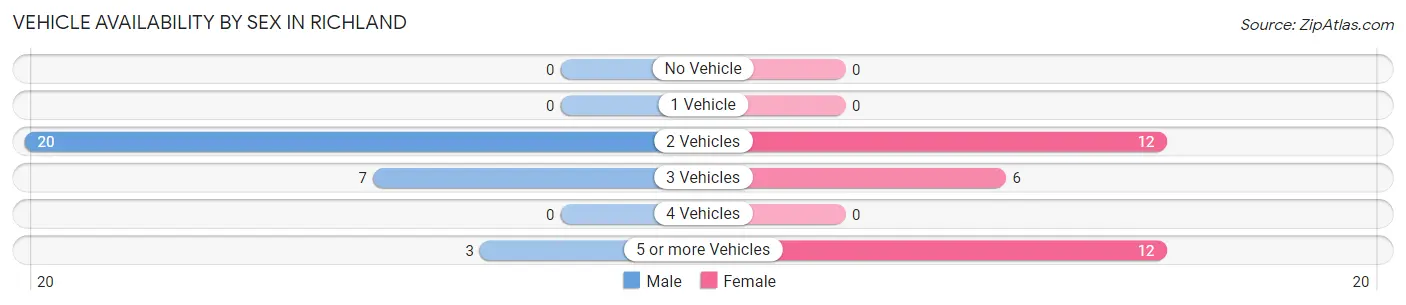
| Vehicles Available | Male | Female |
| No Vehicle | 0 (0.0%) | 0 (0.0%) |
| 1 Vehicle | 0 (0.0%) | 0 (0.0%) |
| 2 Vehicles | 20 (66.7%) | 12 (40.0%) |
| 3 Vehicles | 7 (23.3%) | 6 (20.0%) |
| 4 Vehicles | 0 (0.0%) | 0 (0.0%) |
| 5 or more Vehicles | 3 (10.0%) | 12 (40.0%) |
| Total | 30 (100.0%) | 30 (100.0%) |
Commute Time in Richland
The most frequently occuring commute durations in Richland are 45 to 59 minutes (23 commuters, 38.3%), 40 to 44 minutes (12 commuters, 20.0%), and 35 to 39 minutes (10 commuters, 16.7%).
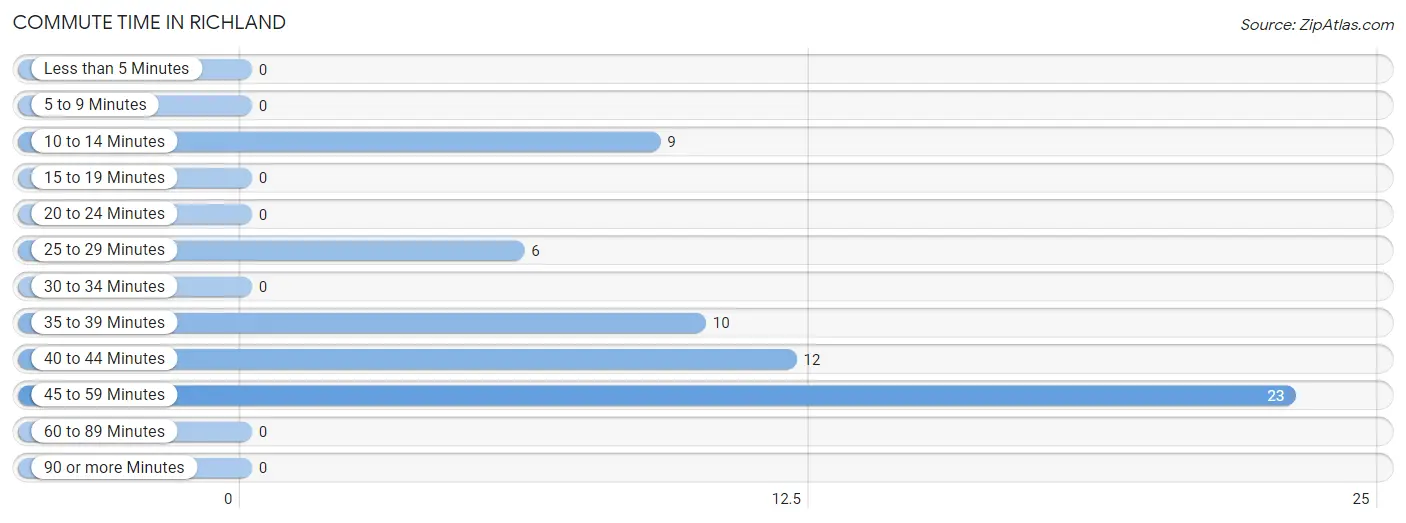
| Commute Time | # Commuters | % Commuters |
| Less than 5 Minutes | 0 | 0.0% |
| 5 to 9 Minutes | 0 | 0.0% |
| 10 to 14 Minutes | 9 | 15.0% |
| 15 to 19 Minutes | 0 | 0.0% |
| 20 to 24 Minutes | 0 | 0.0% |
| 25 to 29 Minutes | 6 | 10.0% |
| 30 to 34 Minutes | 0 | 0.0% |
| 35 to 39 Minutes | 10 | 16.7% |
| 40 to 44 Minutes | 12 | 20.0% |
| 45 to 59 Minutes | 23 | 38.3% |
| 60 to 89 Minutes | 0 | 0.0% |
| 90 or more Minutes | 0 | 0.0% |
Commute Time by Sex in Richland
The most common commute times in Richland are 45 to 59 minutes (11 commuters, 36.7%) for males and 40 to 44 minutes (12 commuters, 40.0%) for females.
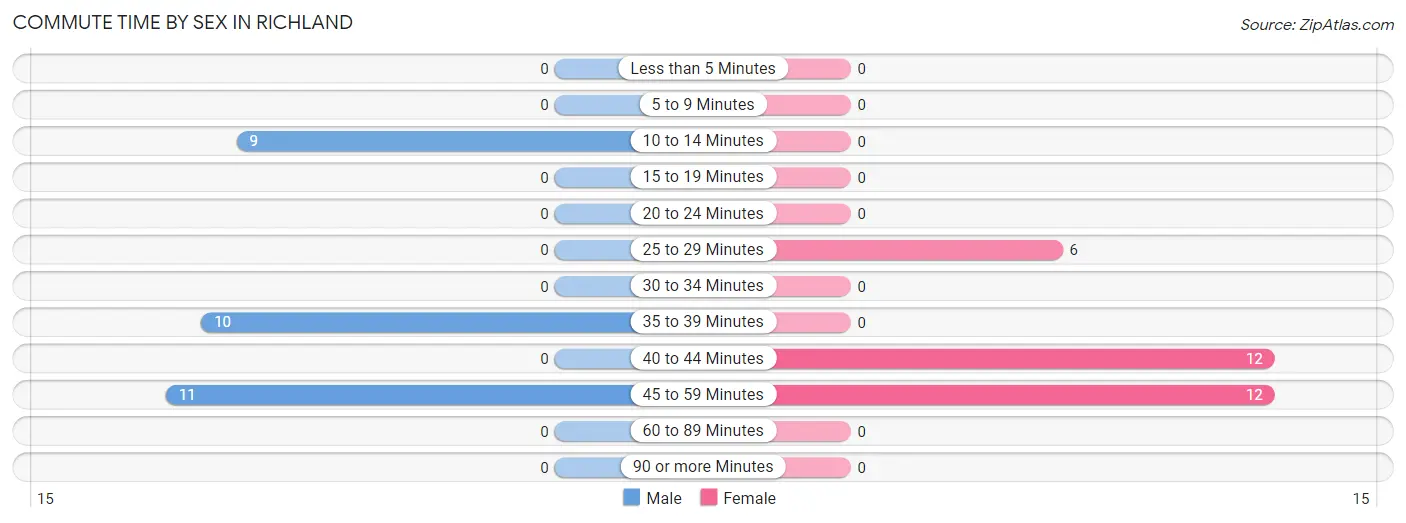
| Commute Time | Male | Female |
| Less than 5 Minutes | 0 (0.0%) | 0 (0.0%) |
| 5 to 9 Minutes | 0 (0.0%) | 0 (0.0%) |
| 10 to 14 Minutes | 9 (30.0%) | 0 (0.0%) |
| 15 to 19 Minutes | 0 (0.0%) | 0 (0.0%) |
| 20 to 24 Minutes | 0 (0.0%) | 0 (0.0%) |
| 25 to 29 Minutes | 0 (0.0%) | 6 (20.0%) |
| 30 to 34 Minutes | 0 (0.0%) | 0 (0.0%) |
| 35 to 39 Minutes | 10 (33.3%) | 0 (0.0%) |
| 40 to 44 Minutes | 0 (0.0%) | 12 (40.0%) |
| 45 to 59 Minutes | 11 (36.7%) | 12 (40.0%) |
| 60 to 89 Minutes | 0 (0.0%) | 0 (0.0%) |
| 90 or more Minutes | 0 (0.0%) | 0 (0.0%) |
Time of Departure to Work by Sex in Richland
The most frequent times of departure to work in Richland are 12:00 AM to 4:59 AM (18, 60.0%) for males and 5:00 AM to 5:29 AM (12, 40.0%) for females.
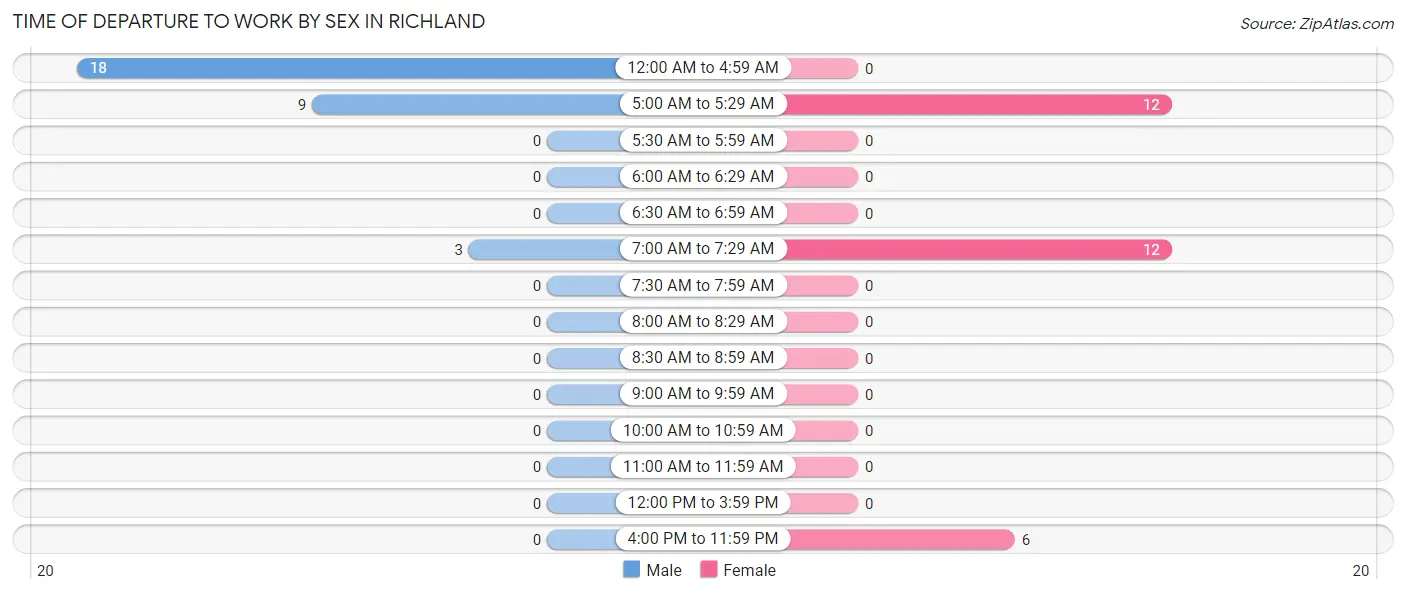
| Time of Departure | Male | Female |
| 12:00 AM to 4:59 AM | 18 (60.0%) | 0 (0.0%) |
| 5:00 AM to 5:29 AM | 9 (30.0%) | 12 (40.0%) |
| 5:30 AM to 5:59 AM | 0 (0.0%) | 0 (0.0%) |
| 6:00 AM to 6:29 AM | 0 (0.0%) | 0 (0.0%) |
| 6:30 AM to 6:59 AM | 0 (0.0%) | 0 (0.0%) |
| 7:00 AM to 7:29 AM | 3 (10.0%) | 12 (40.0%) |
| 7:30 AM to 7:59 AM | 0 (0.0%) | 0 (0.0%) |
| 8:00 AM to 8:29 AM | 0 (0.0%) | 0 (0.0%) |
| 8:30 AM to 8:59 AM | 0 (0.0%) | 0 (0.0%) |
| 9:00 AM to 9:59 AM | 0 (0.0%) | 0 (0.0%) |
| 10:00 AM to 10:59 AM | 0 (0.0%) | 0 (0.0%) |
| 11:00 AM to 11:59 AM | 0 (0.0%) | 0 (0.0%) |
| 12:00 PM to 3:59 PM | 0 (0.0%) | 0 (0.0%) |
| 4:00 PM to 11:59 PM | 0 (0.0%) | 6 (20.0%) |
| Total | 30 (100.0%) | 30 (100.0%) |
Housing Occupancy in Richland
Occupancy by Ownership in Richland
Of the total 51 dwellings in Richland, owner-occupied units account for 29 (56.9%), while renter-occupied units make up 22 (43.1%).
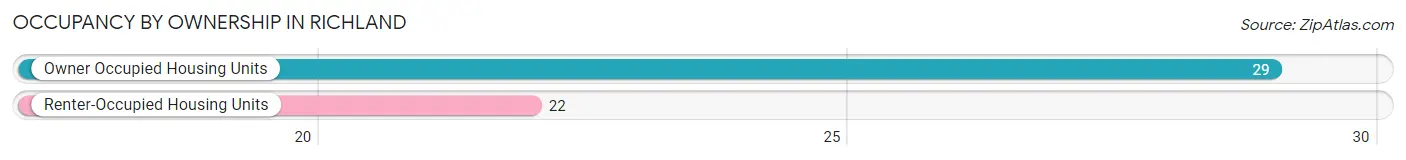
| Occupancy | # Housing Units | % Housing Units |
| Owner Occupied Housing Units | 29 | 56.9% |
| Renter-Occupied Housing Units | 22 | 43.1% |
| Total Occupied Housing Units | 51 | 100.0% |
Occupancy by Household Size in Richland
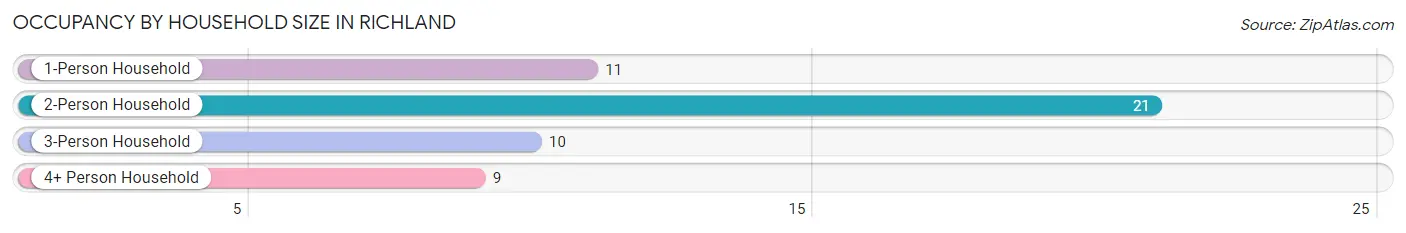
| Household Size | # Housing Units | % Housing Units |
| 1-Person Household | 11 | 21.6% |
| 2-Person Household | 21 | 41.2% |
| 3-Person Household | 10 | 19.6% |
| 4+ Person Household | 9 | 17.6% |
| Total Housing Units | 51 | 100.0% |
Occupancy by Ownership by Household Size in Richland
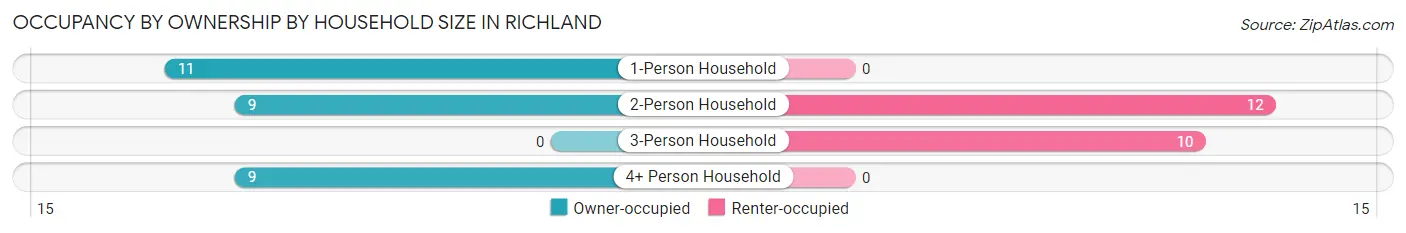
| Household Size | Owner-occupied | Renter-occupied |
| 1-Person Household | 11 (100.0%) | 0 (0.0%) |
| 2-Person Household | 9 (42.9%) | 12 (57.1%) |
| 3-Person Household | 0 (0.0%) | 10 (100.0%) |
| 4+ Person Household | 9 (100.0%) | 0 (0.0%) |
| Total Housing Units | 29 (56.9%) | 22 (43.1%) |
Occupancy by Educational Attainment in Richland
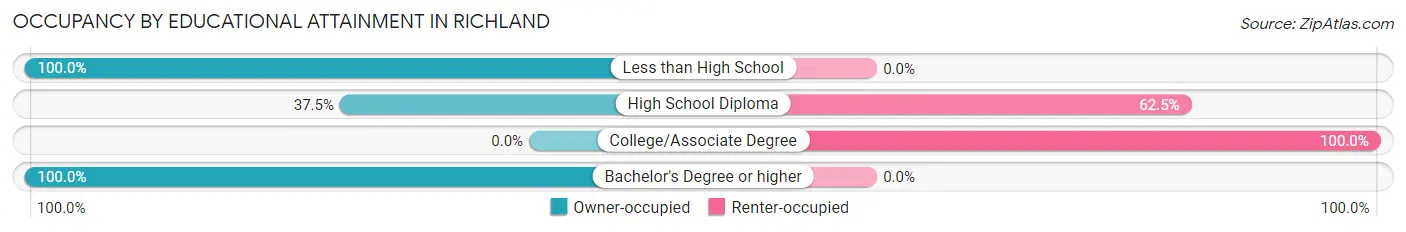
| Household Size | Owner-occupied | Renter-occupied |
| Less than High School | 9 (100.0%) | 0 (0.0%) |
| High School Diploma | 6 (37.5%) | 10 (62.5%) |
| College/Associate Degree | 0 (0.0%) | 12 (100.0%) |
| Bachelor's Degree or higher | 14 (100.0%) | 0 (0.0%) |
Occupancy by Age of Householder in Richland
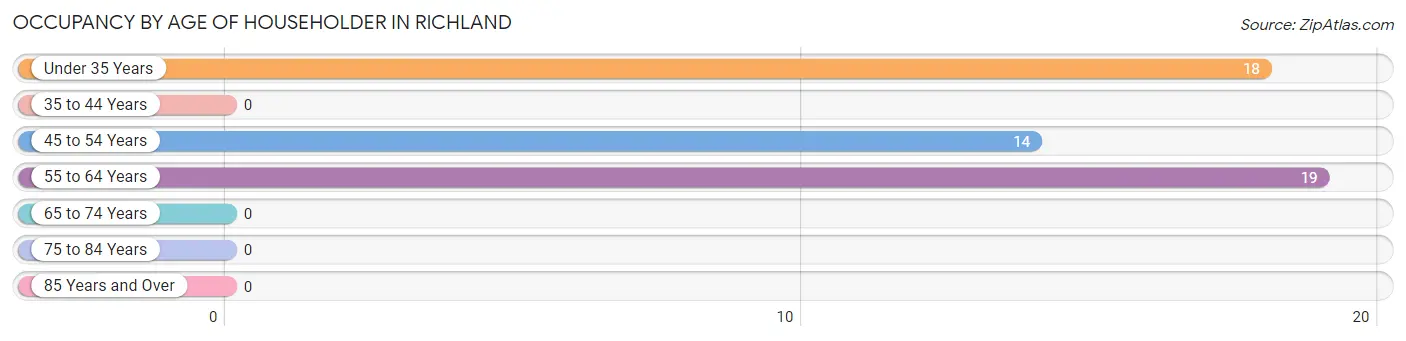
| Age Bracket | # Households | % Households |
| Under 35 Years | 18 | 35.3% |
| 35 to 44 Years | 0 | 0.0% |
| 45 to 54 Years | 14 | 27.5% |
| 55 to 64 Years | 19 | 37.2% |
| 65 to 74 Years | 0 | 0.0% |
| 75 to 84 Years | 0 | 0.0% |
| 85 Years and Over | 0 | 0.0% |
| Total | 51 | 100.0% |
Housing Finances in Richland
Median Income by Occupancy in Richland
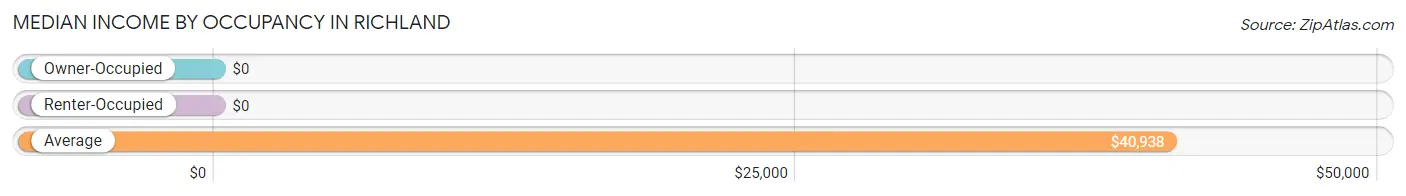
| Occupancy Type | # Households | Median Income |
| Owner-Occupied | 29 (56.9%) | $0 |
| Renter-Occupied | 22 (43.1%) | $0 |
| Average | 51 (100.0%) | $40,938 |
Occupancy by Householder Income Bracket in Richland
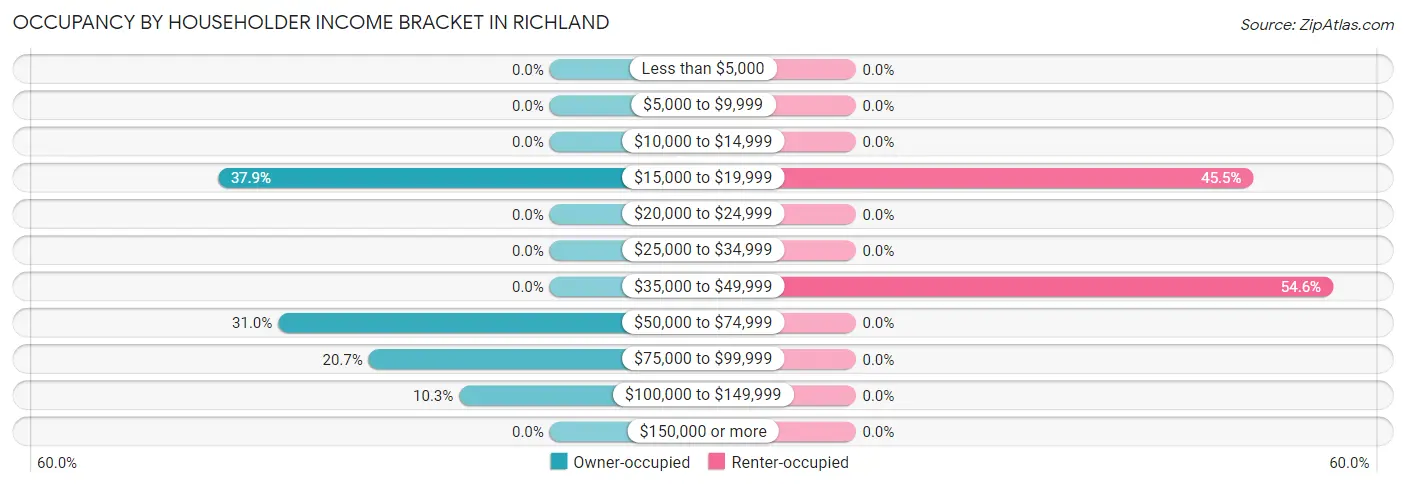
| Income Bracket | Owner-occupied | Renter-occupied |
| Less than $5,000 | 0 (0.0%) | 0 (0.0%) |
| $5,000 to $9,999 | 0 (0.0%) | 0 (0.0%) |
| $10,000 to $14,999 | 0 (0.0%) | 0 (0.0%) |
| $15,000 to $19,999 | 11 (37.9%) | 10 (45.5%) |
| $20,000 to $24,999 | 0 (0.0%) | 0 (0.0%) |
| $25,000 to $34,999 | 0 (0.0%) | 0 (0.0%) |
| $35,000 to $49,999 | 0 (0.0%) | 12 (54.5%) |
| $50,000 to $74,999 | 9 (31.0%) | 0 (0.0%) |
| $75,000 to $99,999 | 6 (20.7%) | 0 (0.0%) |
| $100,000 to $149,999 | 3 (10.3%) | 0 (0.0%) |
| $150,000 or more | 0 (0.0%) | 0 (0.0%) |
| Total | 29 (100.0%) | 22 (100.0%) |
Monthly Housing Cost Tiers in Richland
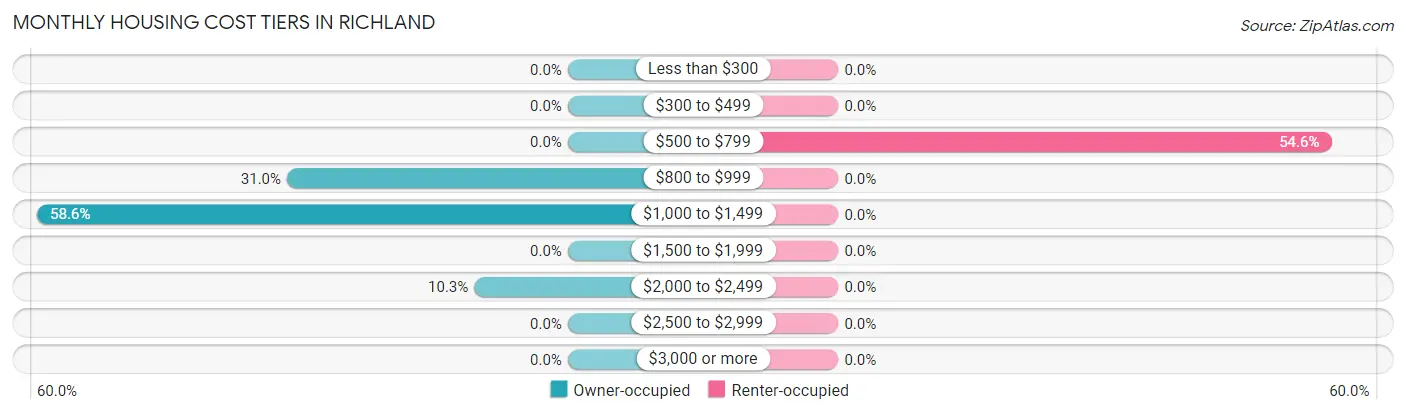
| Monthly Cost | Owner-occupied | Renter-occupied |
| Less than $300 | 0 (0.0%) | 0 (0.0%) |
| $300 to $499 | 0 (0.0%) | 0 (0.0%) |
| $500 to $799 | 0 (0.0%) | 12 (54.5%) |
| $800 to $999 | 9 (31.0%) | 0 (0.0%) |
| $1,000 to $1,499 | 17 (58.6%) | 0 (0.0%) |
| $1,500 to $1,999 | 0 (0.0%) | 0 (0.0%) |
| $2,000 to $2,499 | 3 (10.3%) | 0 (0.0%) |
| $2,500 to $2,999 | 0 (0.0%) | 0 (0.0%) |
| $3,000 or more | 0 (0.0%) | 0 (0.0%) |
| Total | 29 (100.0%) | 22 (100.0%) |
Physical Housing Characteristics in Richland
Housing Structures in Richland
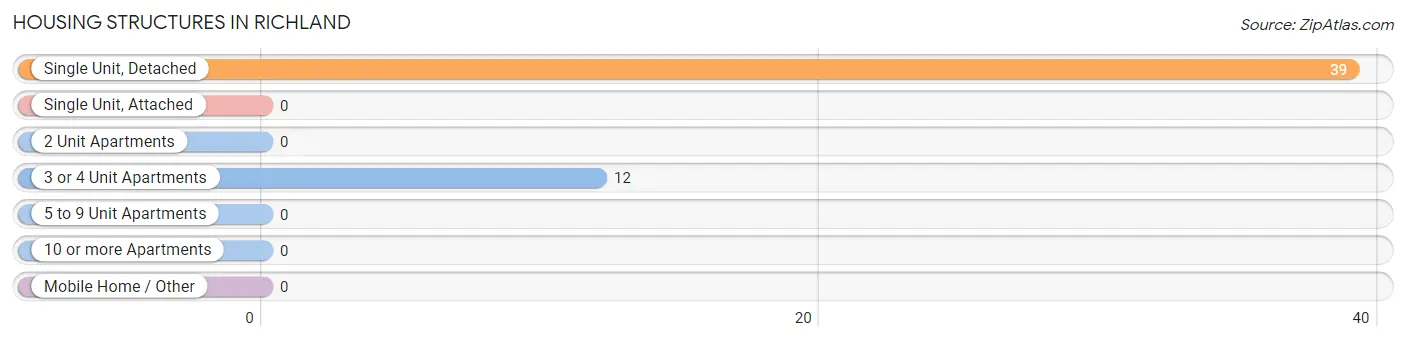
| Structure Type | # Housing Units | % Housing Units |
| Single Unit, Detached | 39 | 76.5% |
| Single Unit, Attached | 0 | 0.0% |
| 2 Unit Apartments | 0 | 0.0% |
| 3 or 4 Unit Apartments | 12 | 23.5% |
| 5 to 9 Unit Apartments | 0 | 0.0% |
| 10 or more Apartments | 0 | 0.0% |
| Mobile Home / Other | 0 | 0.0% |
| Total | 51 | 100.0% |
Housing Structures by Occupancy in Richland
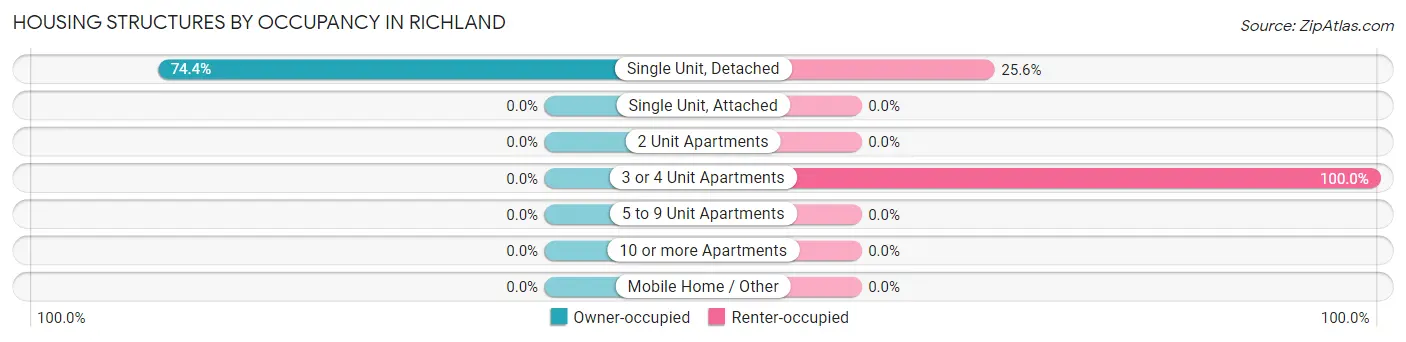
| Structure Type | Owner-occupied | Renter-occupied |
| Single Unit, Detached | 29 (74.4%) | 10 (25.6%) |
| Single Unit, Attached | 0 (0.0%) | 0 (0.0%) |
| 2 Unit Apartments | 0 (0.0%) | 0 (0.0%) |
| 3 or 4 Unit Apartments | 0 (0.0%) | 12 (100.0%) |
| 5 to 9 Unit Apartments | 0 (0.0%) | 0 (0.0%) |
| 10 or more Apartments | 0 (0.0%) | 0 (0.0%) |
| Mobile Home / Other | 0 (0.0%) | 0 (0.0%) |
| Total | 29 (56.9%) | 22 (43.1%) |
Housing Structures by Number of Rooms in Richland
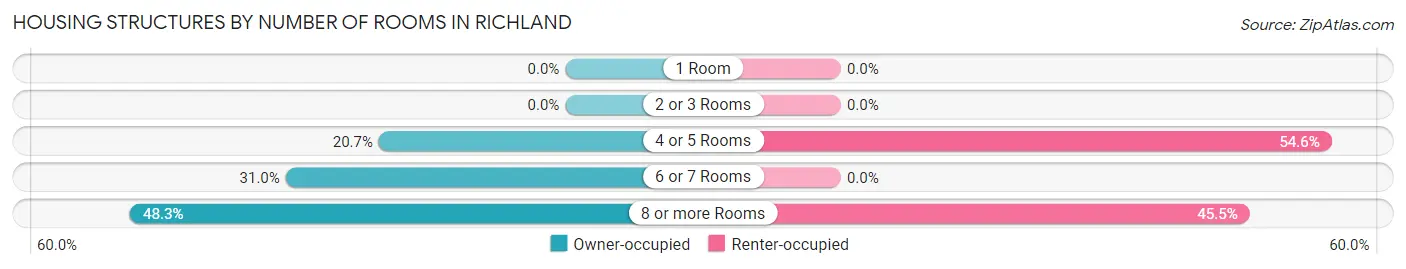
| Number of Rooms | Owner-occupied | Renter-occupied |
| 1 Room | 0 (0.0%) | 0 (0.0%) |
| 2 or 3 Rooms | 0 (0.0%) | 0 (0.0%) |
| 4 or 5 Rooms | 6 (20.7%) | 12 (54.5%) |
| 6 or 7 Rooms | 9 (31.0%) | 0 (0.0%) |
| 8 or more Rooms | 14 (48.3%) | 10 (45.5%) |
| Total | 29 (100.0%) | 22 (100.0%) |
Housing Structure by Heating Type in Richland
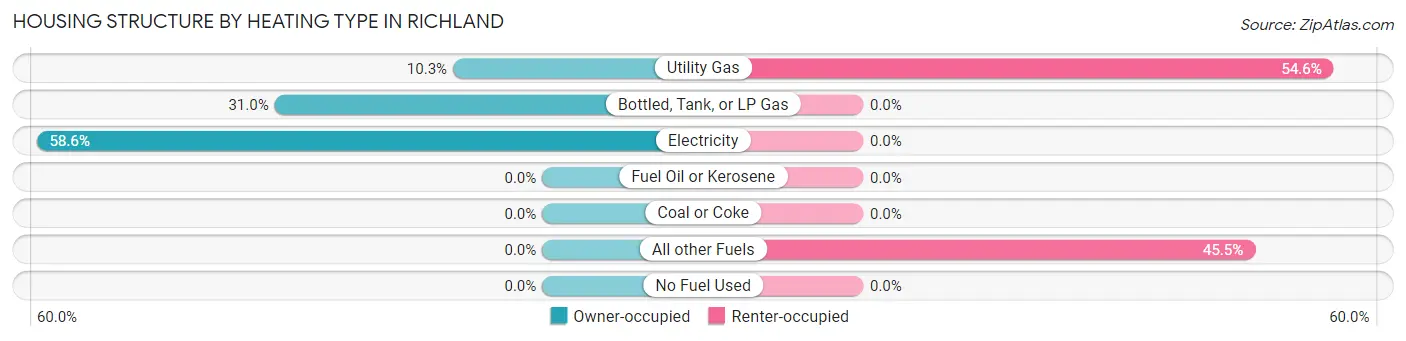
| Heating Type | Owner-occupied | Renter-occupied |
| Utility Gas | 3 (10.3%) | 12 (54.5%) |
| Bottled, Tank, or LP Gas | 9 (31.0%) | 0 (0.0%) |
| Electricity | 17 (58.6%) | 0 (0.0%) |
| Fuel Oil or Kerosene | 0 (0.0%) | 0 (0.0%) |
| Coal or Coke | 0 (0.0%) | 0 (0.0%) |
| All other Fuels | 0 (0.0%) | 10 (45.5%) |
| No Fuel Used | 0 (0.0%) | 0 (0.0%) |
| Total | 29 (100.0%) | 22 (100.0%) |
Household Vehicle Usage in Richland
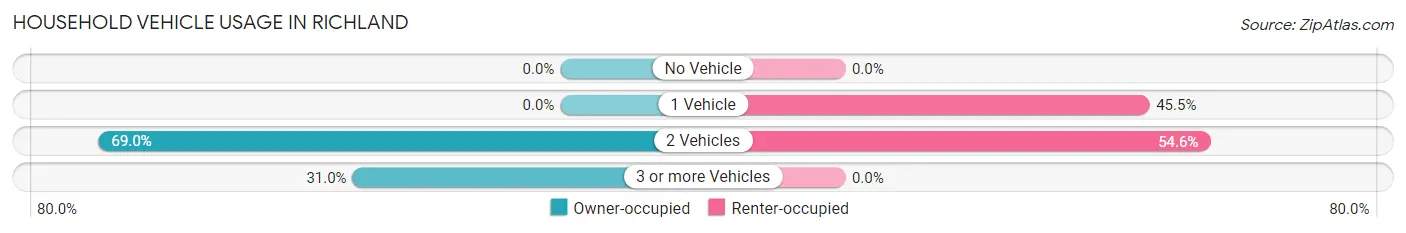
| Vehicles per Household | Owner-occupied | Renter-occupied |
| No Vehicle | 0 (0.0%) | 0 (0.0%) |
| 1 Vehicle | 0 (0.0%) | 10 (45.5%) |
| 2 Vehicles | 20 (69.0%) | 12 (54.5%) |
| 3 or more Vehicles | 9 (31.0%) | 0 (0.0%) |
| Total | 29 (100.0%) | 22 (100.0%) |
Real Estate & Mortgages in Richland
Real Estate and Mortgage Overview in Richland
| Characteristic | Without Mortgage | With Mortgage |
| Housing Units | 20 | 9 |
| Median Property Value | - | - |
| Median Household Income | - | - |
| Monthly Housing Costs | - | - |
| Real Estate Taxes | - | - |
Property Value by Mortgage Status in Richland
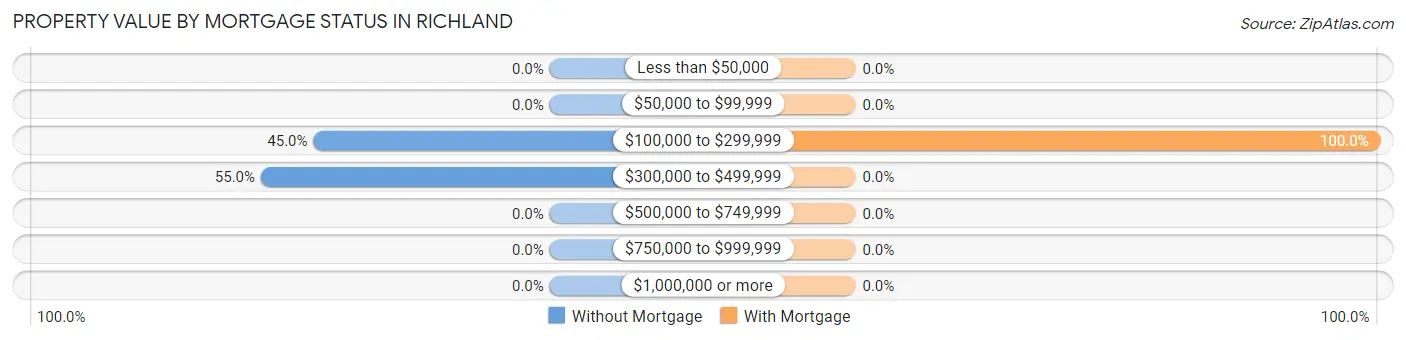
| Property Value | Without Mortgage | With Mortgage |
| Less than $50,000 | 0 (0.0%) | 0 (0.0%) |
| $50,000 to $99,999 | 0 (0.0%) | 0 (0.0%) |
| $100,000 to $299,999 | 9 (45.0%) | 9 (100.0%) |
| $300,000 to $499,999 | 11 (55.0%) | 0 (0.0%) |
| $500,000 to $749,999 | 0 (0.0%) | 0 (0.0%) |
| $750,000 to $999,999 | 0 (0.0%) | 0 (0.0%) |
| $1,000,000 or more | 0 (0.0%) | 0 (0.0%) |
| Total | 20 (100.0%) | 9 (100.0%) |
Household Income by Mortgage Status in Richland
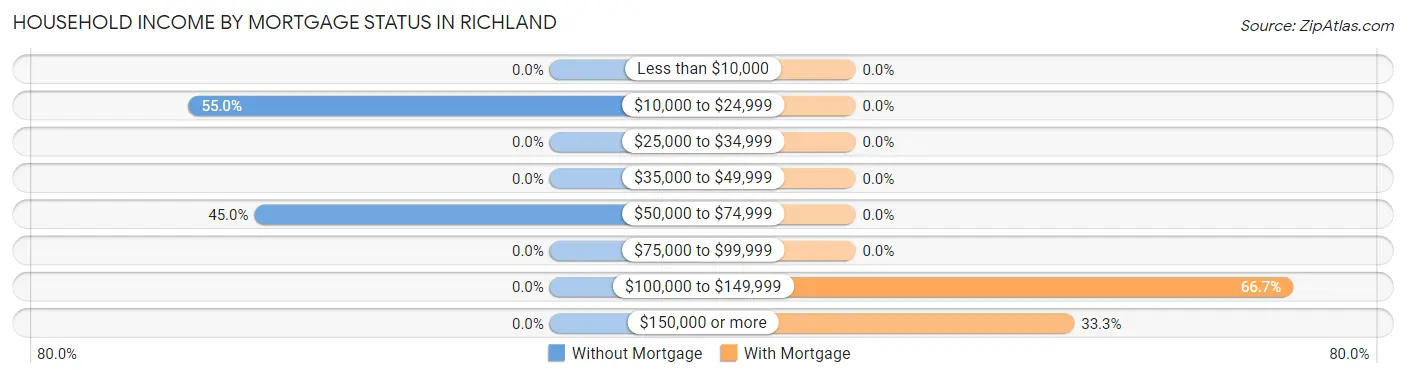
| Household Income | Without Mortgage | With Mortgage |
| Less than $10,000 | 0 (0.0%) | 0 (0.0%) |
| $10,000 to $24,999 | 11 (55.0%) | 0 (0.0%) |
| $25,000 to $34,999 | 0 (0.0%) | 0 (0.0%) |
| $35,000 to $49,999 | 0 (0.0%) | 0 (0.0%) |
| $50,000 to $74,999 | 9 (45.0%) | 0 (0.0%) |
| $75,000 to $99,999 | 0 (0.0%) | 0 (0.0%) |
| $100,000 to $149,999 | 0 (0.0%) | 6 (66.7%) |
| $150,000 or more | 0 (0.0%) | 3 (33.3%) |
| Total | 20 (100.0%) | 9 (100.0%) |
Property Value to Household Income Ratio in Richland
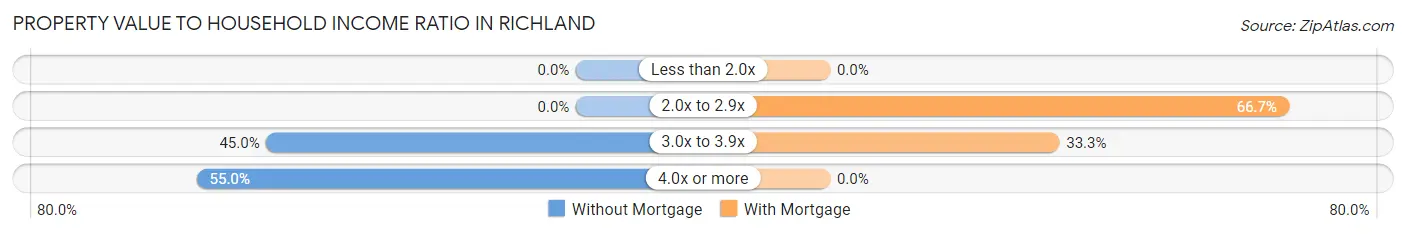
| Value-to-Income Ratio | Without Mortgage | With Mortgage |
| Less than 2.0x | 0 (0.0%) | 0 (0.0%) |
| 2.0x to 2.9x | 0 (0.0%) | 6 (66.7%) |
| 3.0x to 3.9x | 9 (45.0%) | 3 (33.3%) |
| 4.0x or more | 11 (55.0%) | 0 (0.0%) |
| Total | 20 (100.0%) | 9 (100.0%) |
Real Estate Taxes by Mortgage Status in Richland
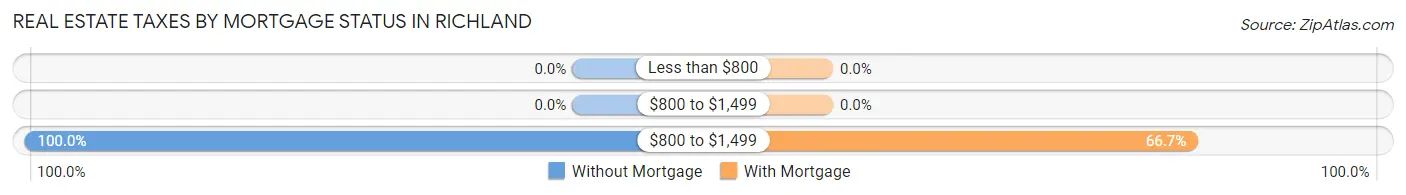
| Property Taxes | Without Mortgage | With Mortgage |
| Less than $800 | 0 (0.0%) | 0 (0.0%) |
| $800 to $1,499 | 0 (0.0%) | 0 (0.0%) |
| $800 to $1,499 | 20 (100.0%) | 6 (66.7%) |
| Total | 20 (100.0%) | 9 (100.0%) |
Health & Disability in Richland
Health Insurance Coverage by Age in Richland
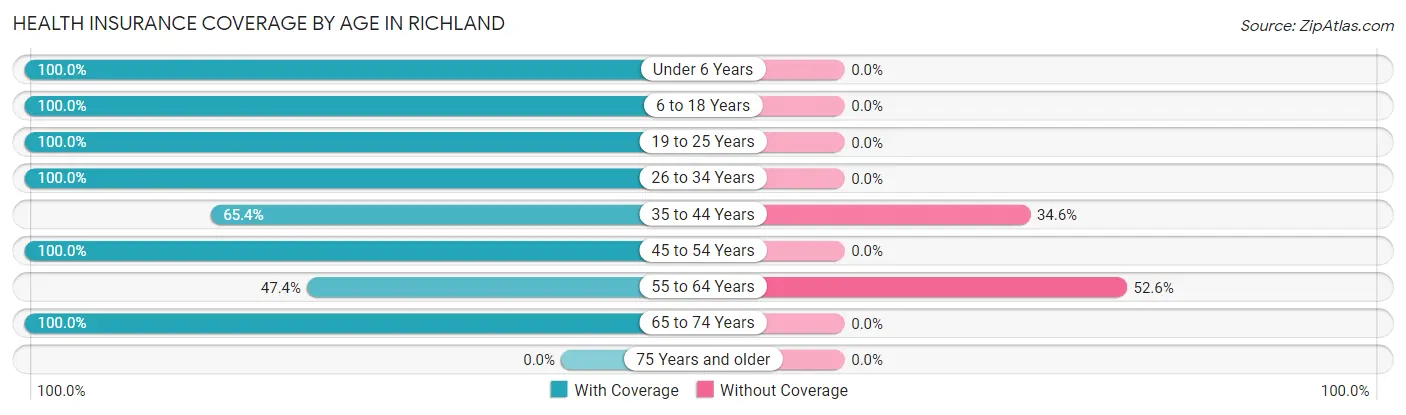
| Age Bracket | With Coverage | Without Coverage |
| Under 6 Years | 14 (100.0%) | 0 (0.0%) |
| 6 to 18 Years | 43 (100.0%) | 0 (0.0%) |
| 19 to 25 Years | 11 (100.0%) | 0 (0.0%) |
| 26 to 34 Years | 6 (100.0%) | 0 (0.0%) |
| 35 to 44 Years | 17 (65.4%) | 9 (34.6%) |
| 45 to 54 Years | 26 (100.0%) | 0 (0.0%) |
| 55 to 64 Years | 9 (47.4%) | 10 (52.6%) |
| 65 to 74 Years | 11 (100.0%) | 0 (0.0%) |
| 75 Years and older | 0 (0.0%) | 0 (0.0%) |
| Total | 137 (87.8%) | 19 (12.2%) |
Health Insurance Coverage by Citizenship Status in Richland
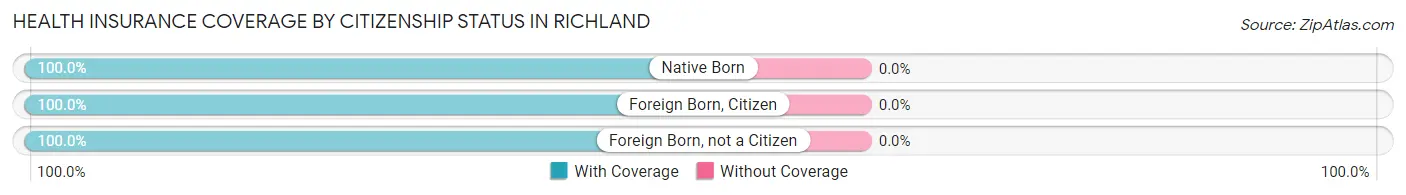
| Citizenship Status | With Coverage | Without Coverage |
| Native Born | 14 (100.0%) | 0 (0.0%) |
| Foreign Born, Citizen | 43 (100.0%) | 0 (0.0%) |
| Foreign Born, not a Citizen | 11 (100.0%) | 0 (0.0%) |
Health Insurance Coverage by Household Income in Richland
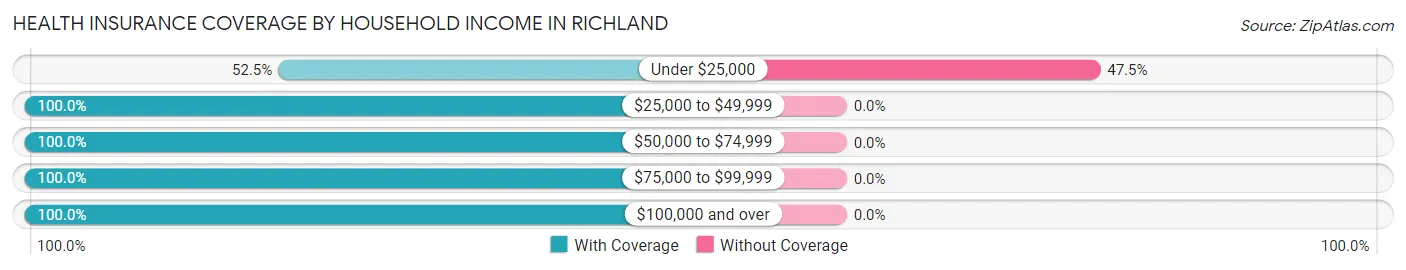
| Household Income | With Coverage | Without Coverage |
| Under $25,000 | 21 (52.5%) | 19 (47.5%) |
| $25,000 to $49,999 | 11 (100.0%) | 0 (0.0%) |
| $50,000 to $74,999 | 20 (100.0%) | 0 (0.0%) |
| $75,000 to $99,999 | 33 (100.0%) | 0 (0.0%) |
| $100,000 and over | 52 (100.0%) | 0 (0.0%) |
Public vs Private Health Insurance Coverage by Age in Richland
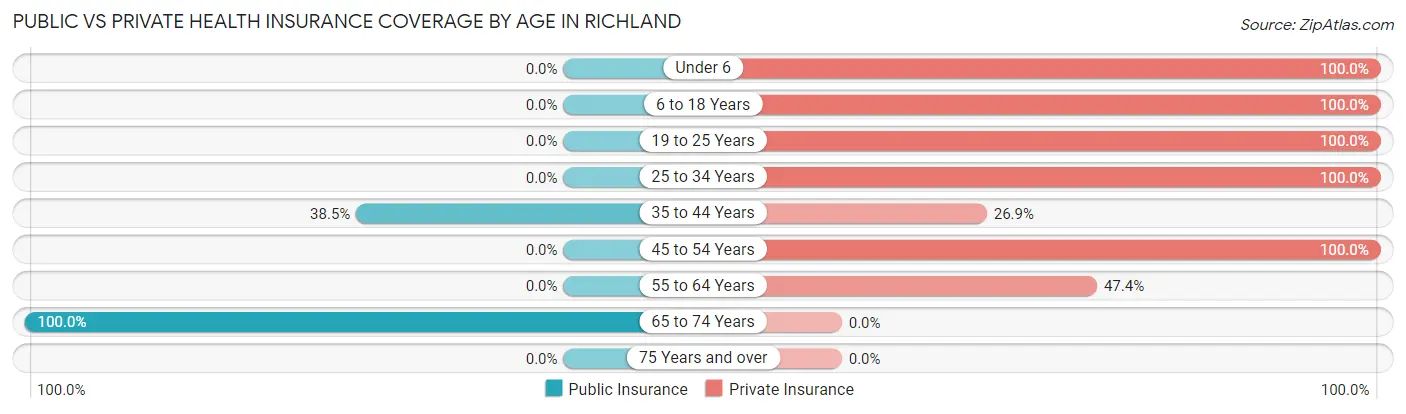
| Age Bracket | Public Insurance | Private Insurance |
| Under 6 | 0 (0.0%) | 14 (100.0%) |
| 6 to 18 Years | 0 (0.0%) | 43 (100.0%) |
| 19 to 25 Years | 0 (0.0%) | 11 (100.0%) |
| 25 to 34 Years | 0 (0.0%) | 6 (100.0%) |
| 35 to 44 Years | 10 (38.5%) | 7 (26.9%) |
| 45 to 54 Years | 0 (0.0%) | 26 (100.0%) |
| 55 to 64 Years | 0 (0.0%) | 9 (47.4%) |
| 65 to 74 Years | 11 (100.0%) | 0 (0.0%) |
| 75 Years and over | 0 (0.0%) | 0 (0.0%) |
| Total | 21 (13.5%) | 116 (74.4%) |
Disability Status by Sex by Age in Richland
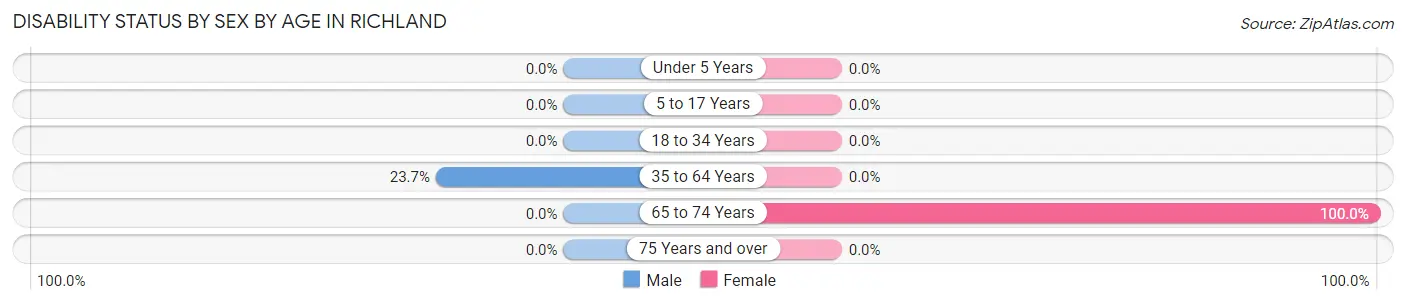
| Age Bracket | Male | Female |
| Under 5 Years | 0 (0.0%) | 0 (0.0%) |
| 5 to 17 Years | 0 (0.0%) | 0 (0.0%) |
| 18 to 34 Years | 0 (0.0%) | 0 (0.0%) |
| 35 to 64 Years | 9 (23.7%) | 0 (0.0%) |
| 65 to 74 Years | 0 (0.0%) | 11 (100.0%) |
| 75 Years and over | 0 (0.0%) | 0 (0.0%) |
Disability Class by Sex by Age in Richland
Disability Class: Hearing Difficulty
| Age Bracket | Male | Female |
| Under 5 Years | 0 (0.0%) | 0 (0.0%) |
| 5 to 17 Years | 0 (0.0%) | 0 (0.0%) |
| 18 to 34 Years | 0 (0.0%) | 0 (0.0%) |
| 35 to 64 Years | 0 (0.0%) | 0 (0.0%) |
| 65 to 74 Years | 0 (0.0%) | 0 (0.0%) |
| 75 Years and over | 0 (0.0%) | 0 (0.0%) |
Disability Class: Vision Difficulty
| Age Bracket | Male | Female |
| Under 5 Years | 0 (0.0%) | 0 (0.0%) |
| 5 to 17 Years | 0 (0.0%) | 0 (0.0%) |
| 18 to 34 Years | 0 (0.0%) | 0 (0.0%) |
| 35 to 64 Years | 9 (23.7%) | 0 (0.0%) |
| 65 to 74 Years | 0 (0.0%) | 0 (0.0%) |
| 75 Years and over | 0 (0.0%) | 0 (0.0%) |
Disability Class: Cognitive Difficulty

| Age Bracket | Male | Female |
| 5 to 17 Years | 0 (0.0%) | 0 (0.0%) |
| 18 to 34 Years | 0 (0.0%) | 0 (0.0%) |
| 35 to 64 Years | 0 (0.0%) | 0 (0.0%) |
| 65 to 74 Years | 0 (0.0%) | 0 (0.0%) |
| 75 Years and over | 0 (0.0%) | 0 (0.0%) |
Disability Class: Ambulatory Difficulty
| Age Bracket | Male | Female |
| 5 to 17 Years | 0 (0.0%) | 0 (0.0%) |
| 18 to 34 Years | 0 (0.0%) | 0 (0.0%) |
| 35 to 64 Years | 0 (0.0%) | 0 (0.0%) |
| 65 to 74 Years | 0 (0.0%) | 11 (100.0%) |
| 75 Years and over | 0 (0.0%) | 0 (0.0%) |
Disability Class: Self-Care Difficulty
| Age Bracket | Male | Female |
| 5 to 17 Years | 0 (0.0%) | 0 (0.0%) |
| 18 to 34 Years | 0 (0.0%) | 0 (0.0%) |
| 35 to 64 Years | 0 (0.0%) | 0 (0.0%) |
| 65 to 74 Years | 0 (0.0%) | 0 (0.0%) |
| 75 Years and over | 0 (0.0%) | 0 (0.0%) |
Technology Access in Richland
Computing Device Access in Richland
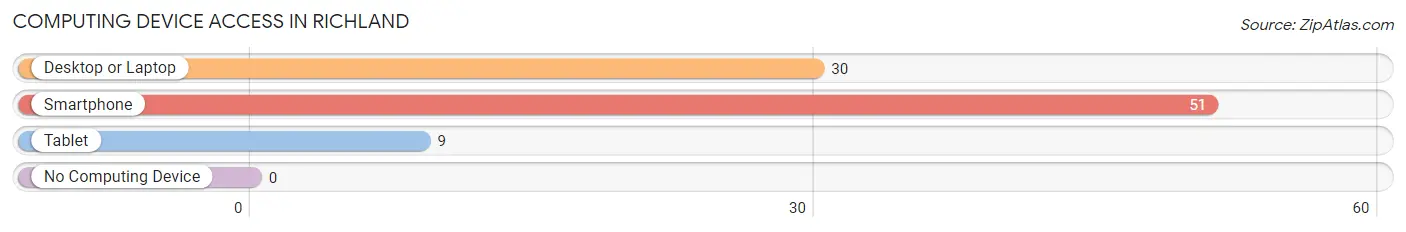
| Device Type | # Households | % Households |
| Desktop or Laptop | 30 | 58.8% |
| Smartphone | 51 | 100.0% |
| Tablet | 9 | 17.6% |
| No Computing Device | 0 | 0.0% |
| Total | 51 | 100.0% |
Internet Access in Richland
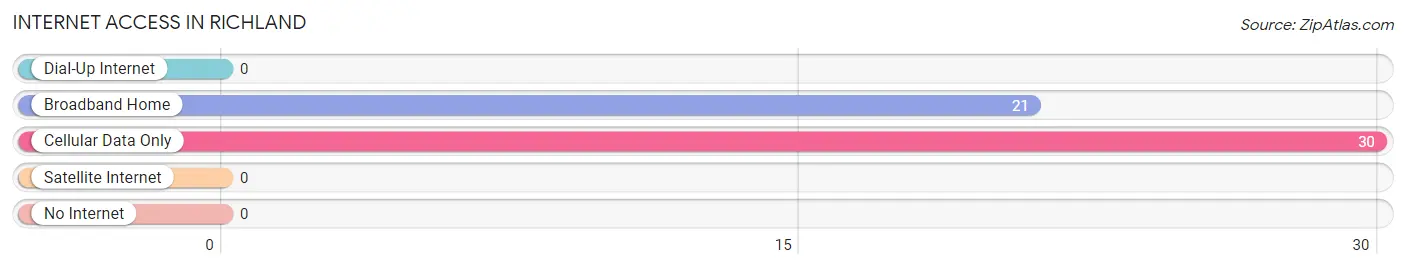
| Internet Type | # Households | % Households |
| Dial-Up Internet | 0 | 0.0% |
| Broadband Home | 21 | 41.2% |
| Cellular Data Only | 30 | 58.8% |
| Satellite Internet | 0 | 0.0% |
| No Internet | 0 | 0.0% |
| Total | 51 | 100.0% |
Richland Summary
Richland, South Dakota is a small town located in the southeastern corner of the state. It is situated in the rolling hills of the Missouri River Valley, and is surrounded by the scenic beauty of the Black Hills. Richland is a rural community with a population of just over 500 people, and is the county seat of Richland County.
History
Richland was founded in 1883 by a group of settlers from Wisconsin. The town was named after the nearby Richland Creek, which was named by the settlers for its abundance of rich soil. The town was incorporated in 1887, and the first post office was established in 1888.
In the early years, Richland was a farming and ranching community. The town was also home to a number of businesses, including a general store, a blacksmith shop, a hotel, and a saloon. The town also had a school, a church, and a newspaper.
In the early 1900s, Richland began to experience a period of growth. The town was connected to the railroad in 1906, and the population began to increase. The town also became a center for the local coal mining industry.
Geography
Richland is located in the southeastern corner of South Dakota, in the Missouri River Valley. The town is situated in the rolling hills of the Black Hills, and is surrounded by the scenic beauty of the area. The town is located about 25 miles from the Nebraska border, and about 50 miles from the Wyoming border.
The climate in Richland is semi-arid, with hot summers and cold winters. The average annual temperature is around 50 degrees Fahrenheit, and the average annual precipitation is around 16 inches.
Economy
The economy of Richland is largely based on agriculture and tourism. The town is home to a number of farms, and the surrounding area is known for its production of wheat, corn, and other grains. The town is also home to a number of tourist attractions, including the Richland County Museum, the Richland County Historical Society, and the Richland County Fairgrounds.
The town is also home to a number of businesses, including a grocery store, a hardware store, a bank, and a number of restaurants. The town is also home to a number of small manufacturing companies, including a furniture factory and a woodworking shop.
Demographics
As of the 2010 census, the population of Richland was 514. The racial makeup of the town was 97.3% White, 0.6% African American, 0.2% Native American, 0.2% Asian, 0.2% from other races, and 1.7% from two or more races. The median household income was $37,500, and the median family income was $45,000.
Richland is a small, rural community with a strong sense of community and a rich history. The town is home to a number of businesses, farms, and tourist attractions, and is a great place to live and work.
Common Questions
What is Per Capita Income in Richland?
Per Capita income in Richland is $16,586.
What is the Median Family Income in Richland?
Median Family Income in Richland is $51,111.
What is the Median Household income in Richland?
Median Household Income in Richland is $40,938.
What is Inequality or Gini Index in Richland?
Inequality or Gini Index in Richland is 0.34.
What is the Total Population of Richland?
Total Population of Richland is 168.
What is the Total Male Population of Richland?
Total Male Population of Richland is 100.
What is the Total Female Population of Richland?
Total Female Population of Richland is 68.
What is the Ratio of Males per 100 Females in Richland?
There are 147.06 Males per 100 Females in Richland.
What is the Ratio of Females per 100 Males in Richland?
There are 68.00 Females per 100 Males in Richland.
What is the Median Population Age in Richland?
Median Population Age in Richland is 26.7 Years.
What is the Average Family Size in Richland
Average Family Size in Richland is 4.8 People.
What is the Average Household Size in Richland
Average Household Size in Richland is 3.3 People.
How Large is the Labor Force in Richland?
There are 70 People in the Labor Forcein in Richland.
What is the Percentage of People in the Labor Force in Richland?
52.2% of People are in the Labor Force in Richland.
What is the Unemployment Rate in Richland?
Unemployment Rate in Richland is 17.2%.