Prescott, OR Map & Demographics
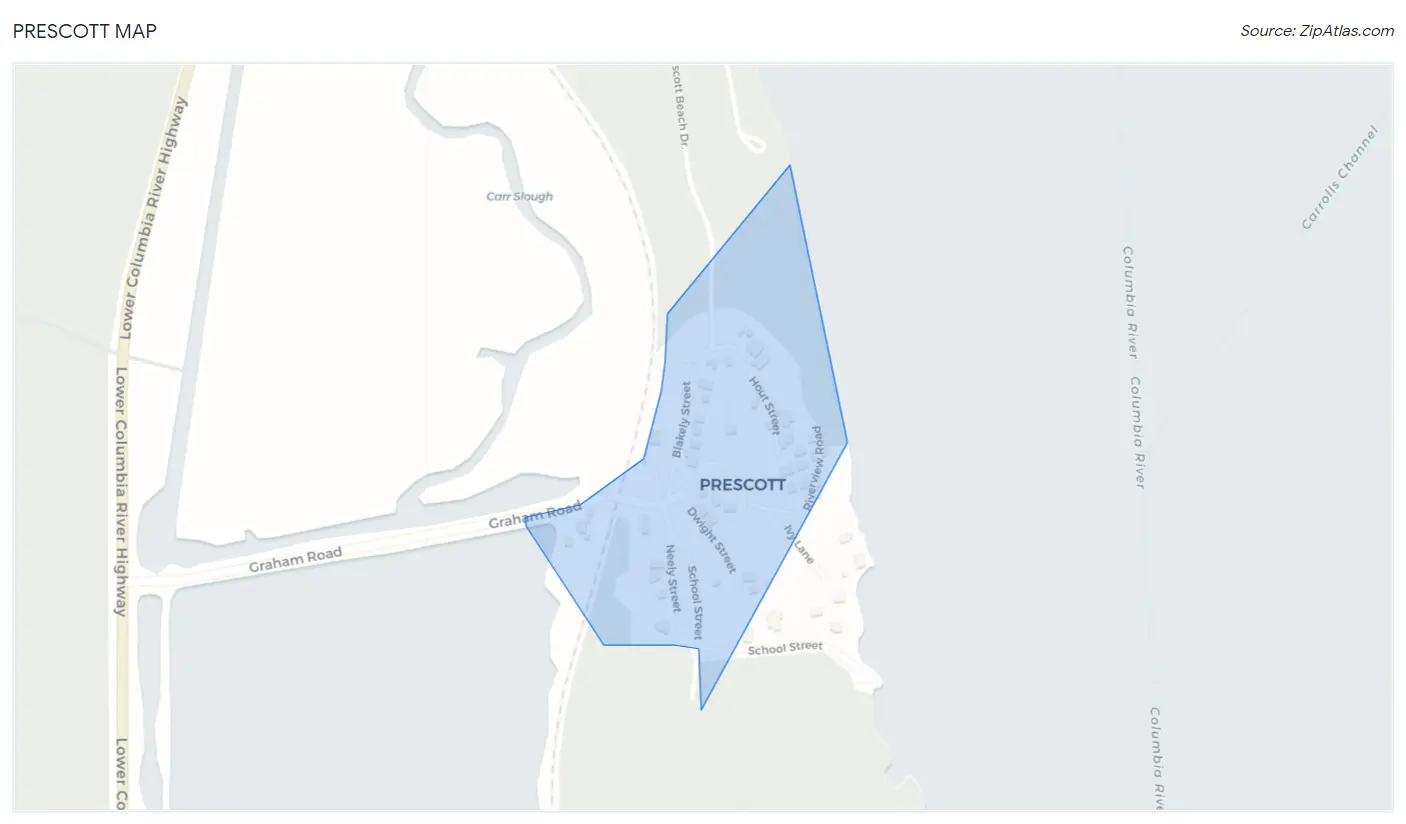
Prescott Map
Prescott Overview
$35,752
PER CAPITA INCOME
$115,250
AVG FAMILY INCOME
0.43
INEQUALITY / GINI INDEX
60
TOTAL POPULATION
28
MALE POPULATION
32
FEMALE POPULATION
87.50
MALES / 100 FEMALES
114.29
FEMALES / 100 MALES
63.4
MEDIAN AGE
2.1
AVG FAMILY SIZE
1.8
AVG HOUSEHOLD SIZE
14
LABOR FORCE [ PEOPLE ]
23.7%
PERCENT IN LABOR FORCE
Income in Prescott
Income Overview in Prescott
| Characteristic | Number | Measure |
| Per Capita Income | 60 | $35,752 |
| Median Family Income | 21 | $115,250 |
| Mean Family Income | 21 | $102,576 |
| Median Household Income | 33 | $0 |
| Mean Household Income | 33 | $74,085 |
| Income Deficit | 21 | $0 |
| Wage / Income Gap (%) | 60 | 0.00% |
| Wage / Income Gap ($) | 60 | 100.00¢ per $1 |
| Gini / Inequality Index | 60 | 0.43 |
Earnings by Sex in Prescott
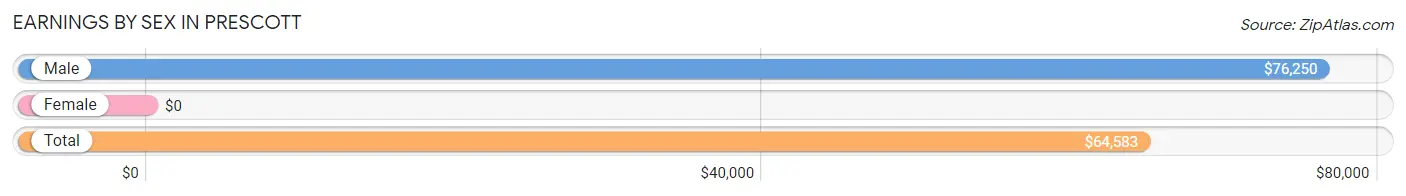
| Sex | Number | Average Earnings |
| Male | 10 (58.8%) | $76,250 |
| Female | 7 (41.2%) | $0 |
| Total | 17 (100.0%) | $64,583 |
Earnings by Sex by Income Bracket in Prescott
The most common earnings brackets in Prescott are $75,000 to $99,999 for men (5 | 50.0%) and $55,000 to $64,999 for women (3 | 42.9%).
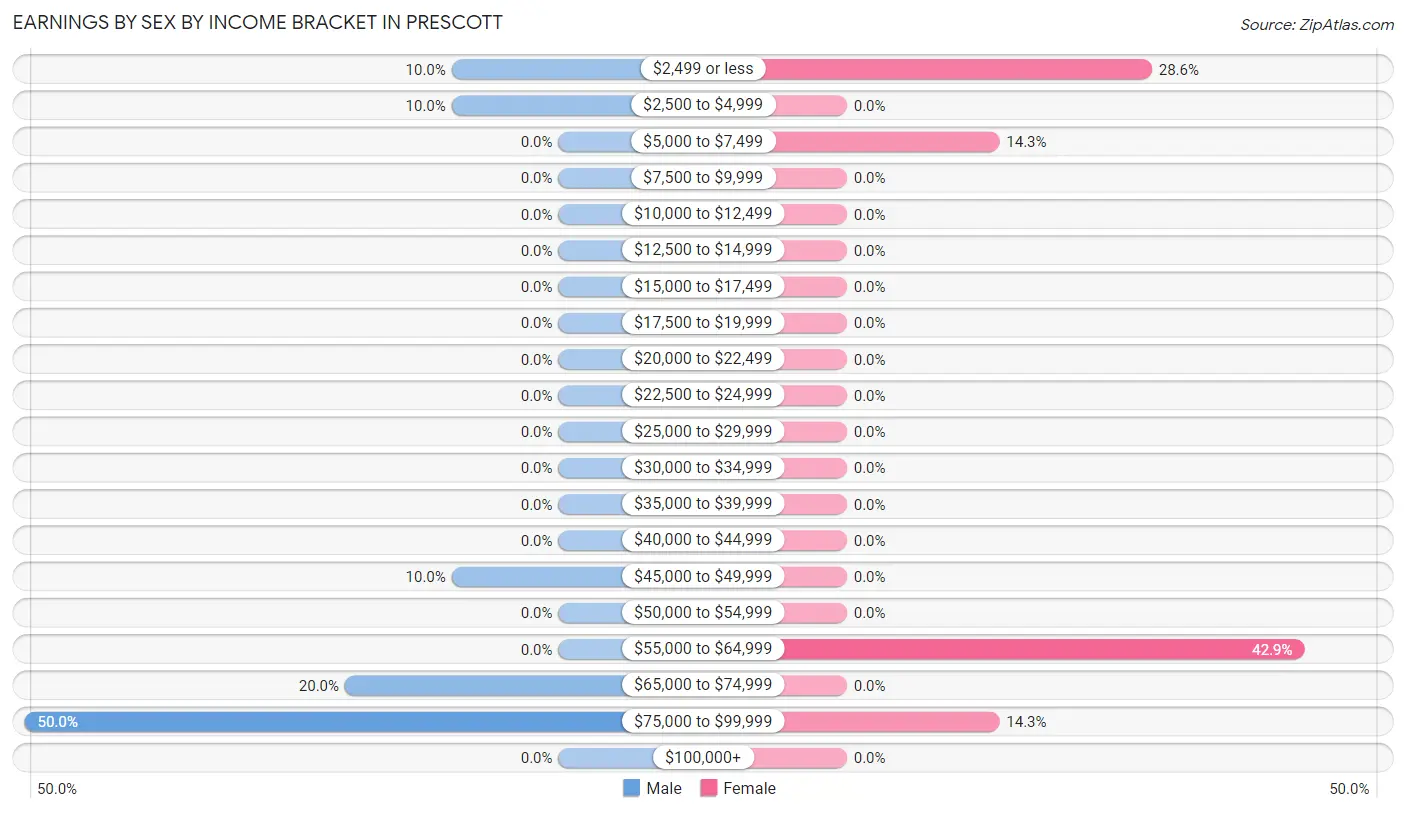
| Income | Male | Female |
| $2,499 or less | 1 (10.0%) | 2 (28.6%) |
| $2,500 to $4,999 | 1 (10.0%) | 0 (0.0%) |
| $5,000 to $7,499 | 0 (0.0%) | 1 (14.3%) |
| $7,500 to $9,999 | 0 (0.0%) | 0 (0.0%) |
| $10,000 to $12,499 | 0 (0.0%) | 0 (0.0%) |
| $12,500 to $14,999 | 0 (0.0%) | 0 (0.0%) |
| $15,000 to $17,499 | 0 (0.0%) | 0 (0.0%) |
| $17,500 to $19,999 | 0 (0.0%) | 0 (0.0%) |
| $20,000 to $22,499 | 0 (0.0%) | 0 (0.0%) |
| $22,500 to $24,999 | 0 (0.0%) | 0 (0.0%) |
| $25,000 to $29,999 | 0 (0.0%) | 0 (0.0%) |
| $30,000 to $34,999 | 0 (0.0%) | 0 (0.0%) |
| $35,000 to $39,999 | 0 (0.0%) | 0 (0.0%) |
| $40,000 to $44,999 | 0 (0.0%) | 0 (0.0%) |
| $45,000 to $49,999 | 1 (10.0%) | 0 (0.0%) |
| $50,000 to $54,999 | 0 (0.0%) | 0 (0.0%) |
| $55,000 to $64,999 | 0 (0.0%) | 3 (42.9%) |
| $65,000 to $74,999 | 2 (20.0%) | 0 (0.0%) |
| $75,000 to $99,999 | 5 (50.0%) | 1 (14.3%) |
| $100,000+ | 0 (0.0%) | 0 (0.0%) |
| Total | 10 (100.0%) | 7 (100.0%) |
Earnings by Sex by Educational Attainment in Prescott
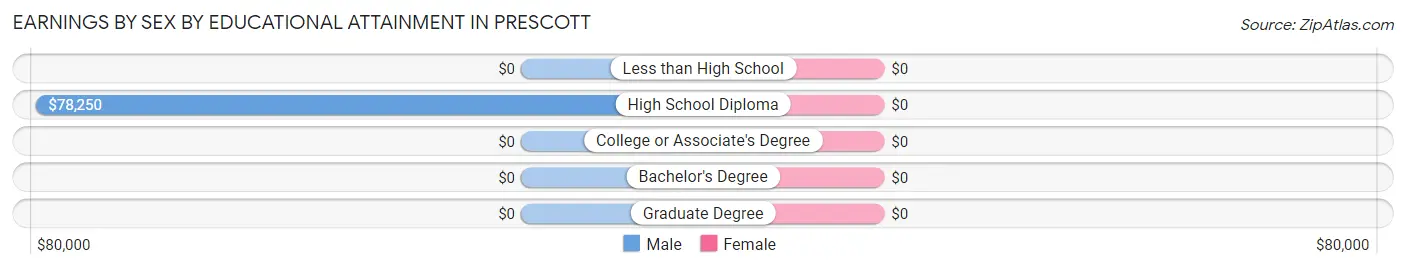
| Educational Attainment | Male Income | Female Income |
| Less than High School | - | - |
| High School Diploma | $78,250 | $0 |
| College or Associate's Degree | - | - |
| Bachelor's Degree | - | - |
| Graduate Degree | - | - |
| Total | $76,250 | $0 |
Family Income in Prescott
Family Income Brackets in Prescott
According to the Prescott family income data, there are 9 families falling into the $100,000 to $149,999 income range, which is the most common income bracket and makes up 42.9% of all families.
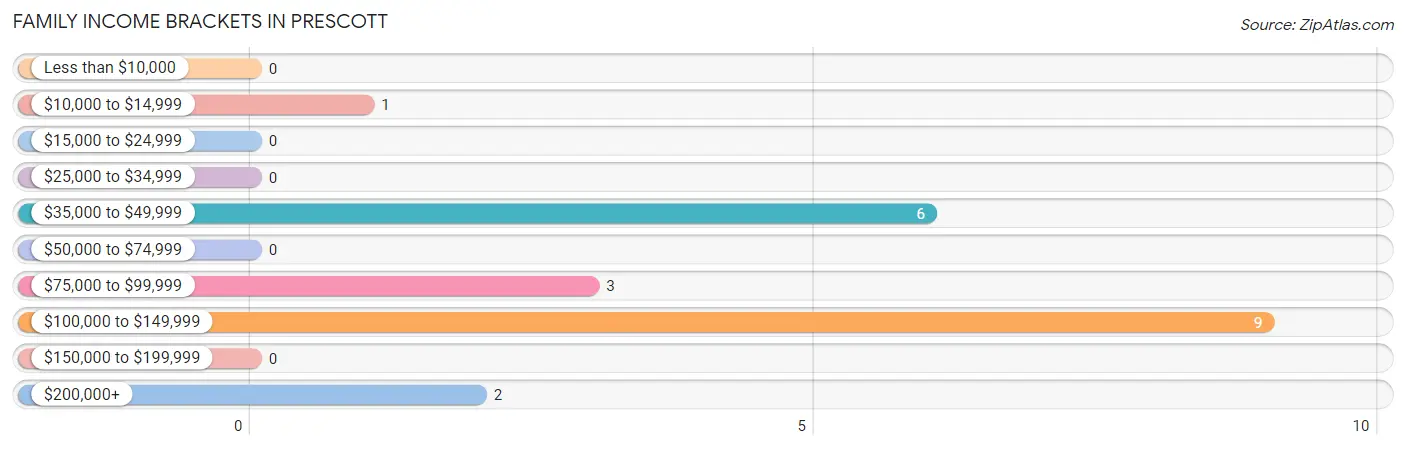
| Income Bracket | # Families | % Families |
| Less than $10,000 | 0 | 0.0% |
| $10,000 to $14,999 | 1 | 4.8% |
| $15,000 to $24,999 | 0 | 0.0% |
| $25,000 to $34,999 | 0 | 0.0% |
| $35,000 to $49,999 | 6 | 28.6% |
| $50,000 to $74,999 | 0 | 0.0% |
| $75,000 to $99,999 | 3 | 14.3% |
| $100,000 to $149,999 | 9 | 42.9% |
| $150,000 to $199,999 | 0 | 0.0% |
| $200,000+ | 2 | 9.5% |
Family Income by Famaliy Size in Prescott
3-person families (11 | 52.4%) account for the highest median family income in Prescott with $116,750 per family, while 3-person families (11 | 52.4%) have the highest median income of $38,917 per family member.
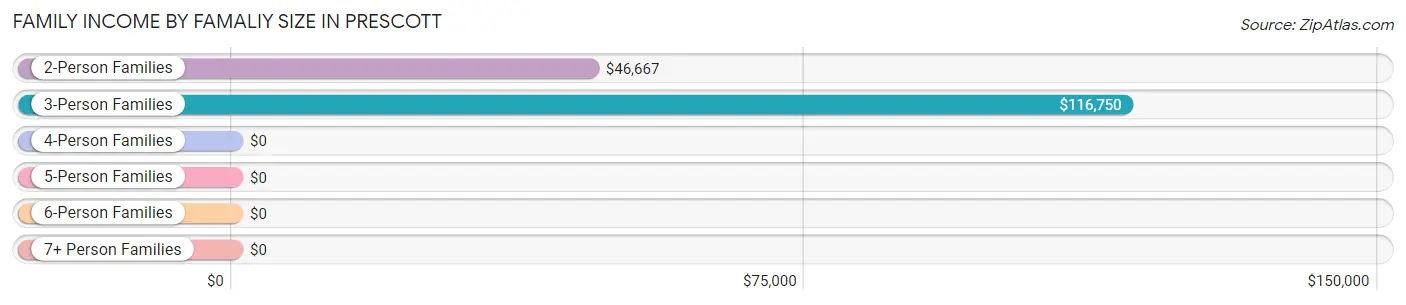
| Income Bracket | # Families | Median Income |
| 2-Person Families | 10 (47.6%) | $46,667 |
| 3-Person Families | 11 (52.4%) | $116,750 |
| 4-Person Families | 0 (0.0%) | $0 |
| 5-Person Families | 0 (0.0%) | $0 |
| 6-Person Families | 0 (0.0%) | $0 |
| 7+ Person Families | 0 (0.0%) | $0 |
| Total | 21 (100.0%) | $115,250 |
Family Income by Number of Earners in Prescott
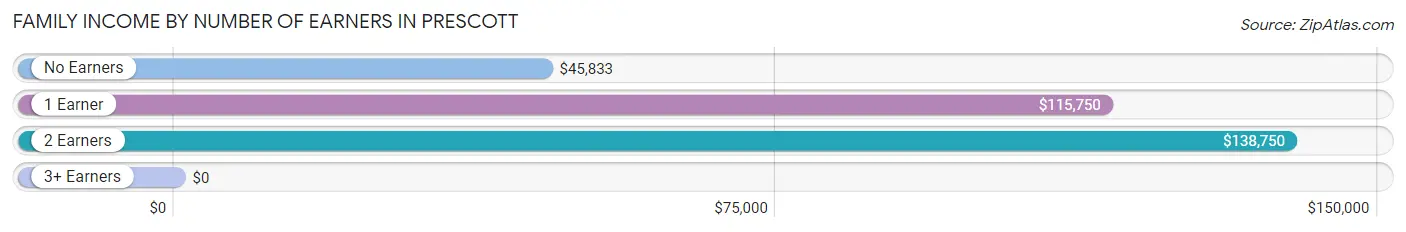
| Number of Earners | # Families | Median Income |
| No Earners | 8 (38.1%) | $45,833 |
| 1 Earner | 7 (33.3%) | $115,750 |
| 2 Earners | 6 (28.6%) | $138,750 |
| 3+ Earners | 0 (0.0%) | $0 |
| Total | 21 (100.0%) | $115,250 |
Household Income in Prescott
Household Income Brackets in Prescott
With 9 households falling in the category, the $15,000 to $24,999 income range is the most frequent in Prescott, accounting for 27.3% of all households.
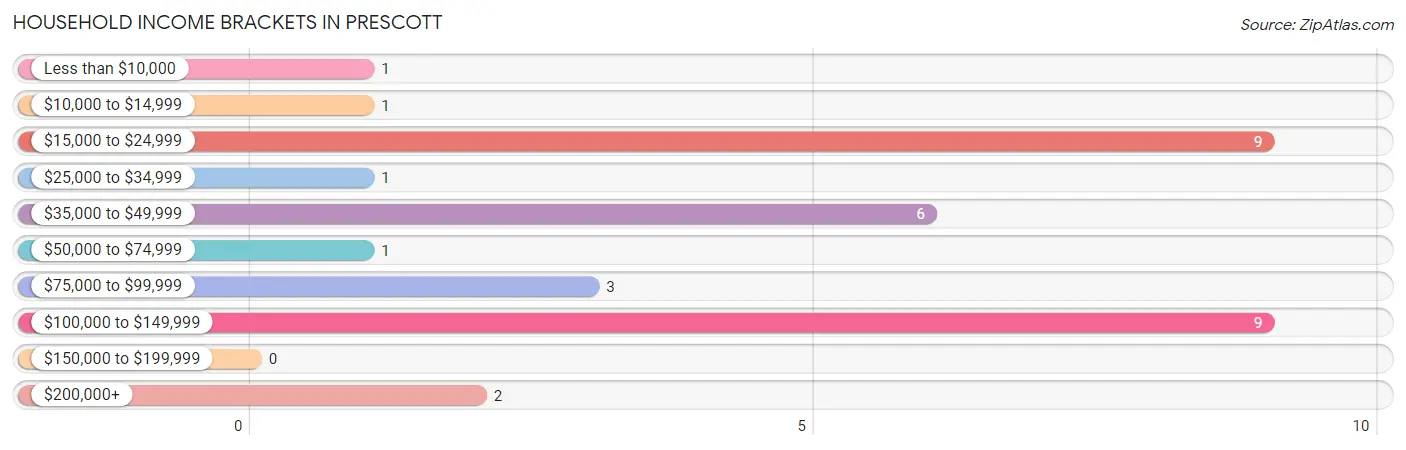
| Income Bracket | # Households | % Households |
| Less than $10,000 | 1 | 3.0% |
| $10,000 to $14,999 | 1 | 3.0% |
| $15,000 to $24,999 | 9 | 27.3% |
| $25,000 to $34,999 | 1 | 3.0% |
| $35,000 to $49,999 | 6 | 18.2% |
| $50,000 to $74,999 | 1 | 3.0% |
| $75,000 to $99,999 | 3 | 9.1% |
| $100,000 to $149,999 | 9 | 27.3% |
| $150,000 to $199,999 | 0 | 0.0% |
| $200,000+ | 2 | 6.1% |
Household Income by Householder Age in Prescott
The median household income in Prescott is $0, with the highest median household income of $22,083 found in the 65+ years age bracket for the primary householder. A total of 14 households (42.4%) fall into this category.
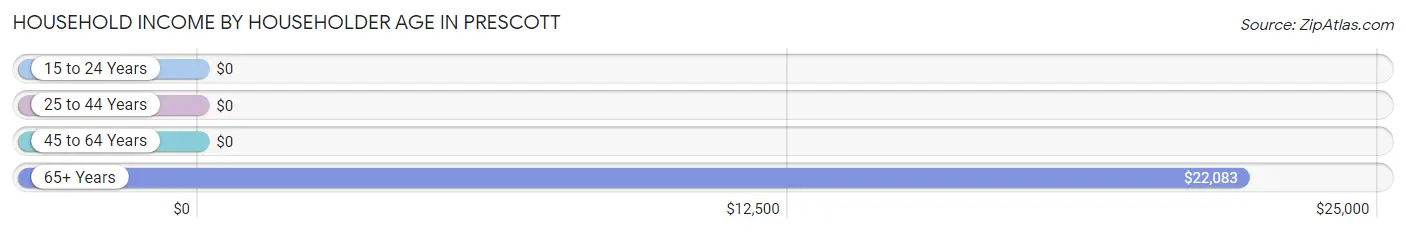
| Income Bracket | # Households | Median Income |
| 15 to 24 Years | 0 (0.0%) | $0 |
| 25 to 44 Years | 3 (9.1%) | $0 |
| 45 to 64 Years | 16 (48.5%) | $0 |
| 65+ Years | 14 (42.4%) | $22,083 |
| Total | 33 (100.0%) | $0 |
Poverty in Prescott
Income Below Poverty by Sex and Age in Prescott
With 10.7% poverty level for males and 15.6% for females among the residents of Prescott, 45 to 54 year old males and 16 and 17 year old females are the most vulnerable to poverty, with 1 males (25.0%) and 1 females (100.0%) in their respective age groups living below the poverty level.
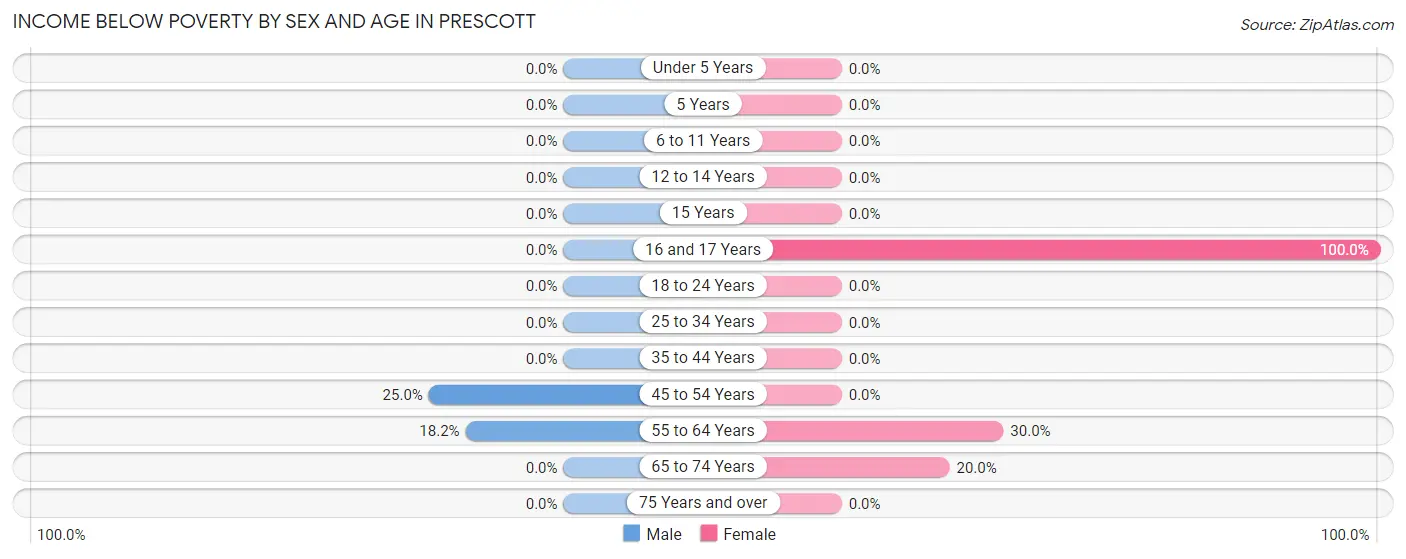
| Age Bracket | Male | Female |
| Under 5 Years | 0 (0.0%) | 0 (0.0%) |
| 5 Years | 0 (0.0%) | 0 (0.0%) |
| 6 to 11 Years | 0 (0.0%) | 0 (0.0%) |
| 12 to 14 Years | 0 (0.0%) | 0 (0.0%) |
| 15 Years | 0 (0.0%) | 0 (0.0%) |
| 16 and 17 Years | 0 (0.0%) | 1 (100.0%) |
| 18 to 24 Years | 0 (0.0%) | 0 (0.0%) |
| 25 to 34 Years | 0 (0.0%) | 0 (0.0%) |
| 35 to 44 Years | 0 (0.0%) | 0 (0.0%) |
| 45 to 54 Years | 1 (25.0%) | 0 (0.0%) |
| 55 to 64 Years | 2 (18.2%) | 3 (30.0%) |
| 65 to 74 Years | 0 (0.0%) | 1 (20.0%) |
| 75 Years and over | 0 (0.0%) | 0 (0.0%) |
| Total | 3 (10.7%) | 5 (15.6%) |
Income Above Poverty by Sex and Age in Prescott
According to the poverty statistics in Prescott, males aged under 5 years and females aged 25 to 34 years are the age groups that are most secure financially, with 100.0% of males and 100.0% of females in these age groups living above the poverty line.
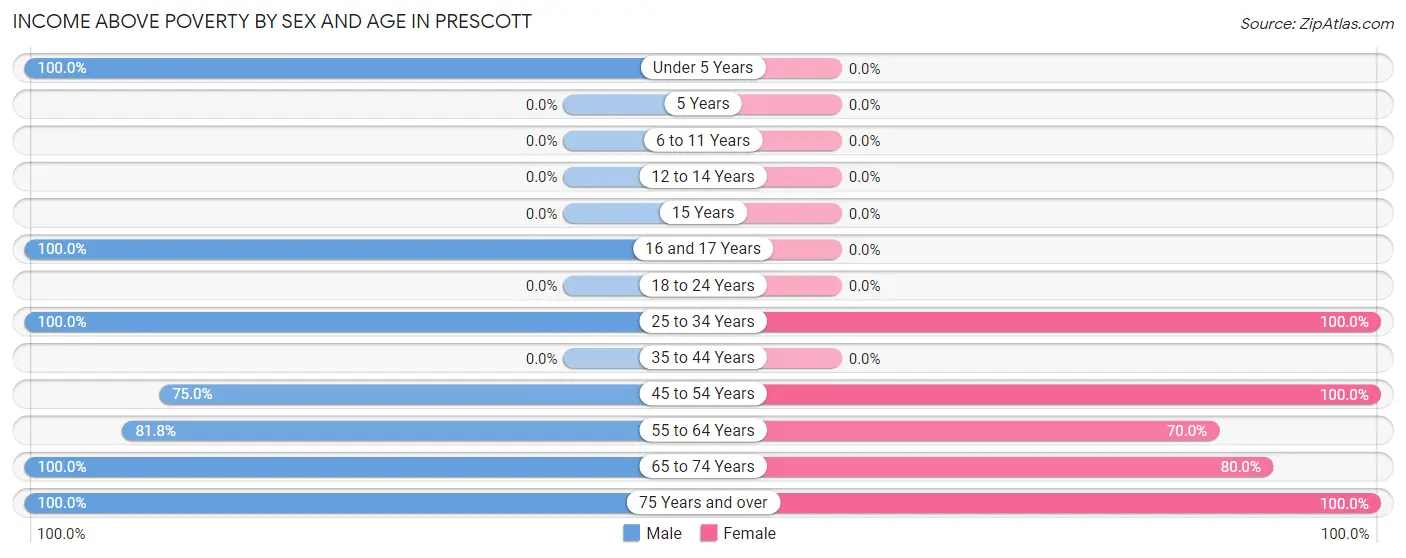
| Age Bracket | Male | Female |
| Under 5 Years | 1 (100.0%) | 0 (0.0%) |
| 5 Years | 0 (0.0%) | 0 (0.0%) |
| 6 to 11 Years | 0 (0.0%) | 0 (0.0%) |
| 12 to 14 Years | 0 (0.0%) | 0 (0.0%) |
| 15 Years | 0 (0.0%) | 0 (0.0%) |
| 16 and 17 Years | 1 (100.0%) | 0 (0.0%) |
| 18 to 24 Years | 0 (0.0%) | 0 (0.0%) |
| 25 to 34 Years | 1 (100.0%) | 3 (100.0%) |
| 35 to 44 Years | 0 (0.0%) | 0 (0.0%) |
| 45 to 54 Years | 3 (75.0%) | 2 (100.0%) |
| 55 to 64 Years | 9 (81.8%) | 7 (70.0%) |
| 65 to 74 Years | 5 (100.0%) | 4 (80.0%) |
| 75 Years and over | 5 (100.0%) | 11 (100.0%) |
| Total | 25 (89.3%) | 27 (84.4%) |
Income Below Poverty Among Married-Couple Families in Prescott
The poverty statistics for married-couple families in Prescott show that 5.9% or 1 of the total 17 families live below the poverty line. Families with no children have the highest poverty rate of 7.7%, comprising of 1 families. On the other hand, families with 1 or 2 children have the lowest poverty rate of 0.0%, which includes 0 families.
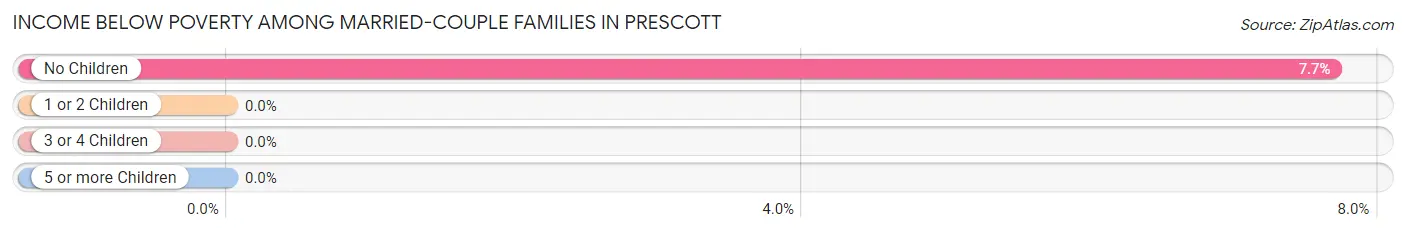
| Children | Above Poverty | Below Poverty |
| No Children | 12 (92.3%) | 1 (7.7%) |
| 1 or 2 Children | 4 (100.0%) | 0 (0.0%) |
| 3 or 4 Children | 0 (0.0%) | 0 (0.0%) |
| 5 or more Children | 0 (0.0%) | 0 (0.0%) |
| Total | 16 (94.1%) | 1 (5.9%) |
Income Below Poverty Among Single-Parent Households in Prescott
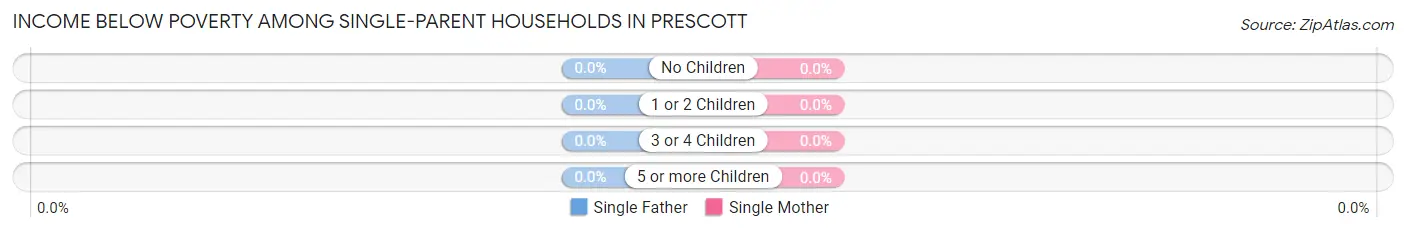
| Children | Single Father | Single Mother |
| No Children | 0 (0.0%) | 0 (0.0%) |
| 1 or 2 Children | 0 (0.0%) | 0 (0.0%) |
| 3 or 4 Children | 0 (0.0%) | 0 (0.0%) |
| 5 or more Children | 0 (0.0%) | 0 (0.0%) |
| Total | 0 (0.0%) | 0 (0.0%) |
Income Below Poverty Among Married-Couple vs Single-Parent Households in Prescott
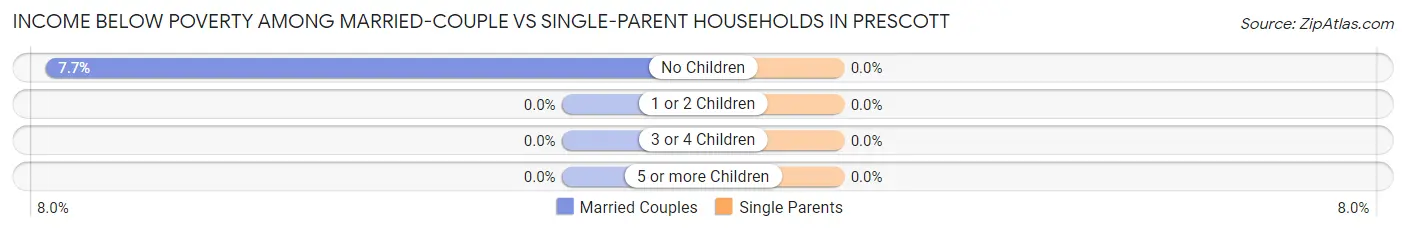
| Children | Married-Couple Families | Single-Parent Households |
| No Children | 1 (7.7%) | 0 (0.0%) |
| 1 or 2 Children | 0 (0.0%) | 0 (0.0%) |
| 3 or 4 Children | 0 (0.0%) | 0 (0.0%) |
| 5 or more Children | 0 (0.0%) | 0 (0.0%) |
| Total | 1 (5.9%) | 0 (0.0%) |
Race in Prescott
The most populous races in Prescott are White / Caucasian (55 | 91.7%), and Two or more Races (5 | 8.3%).
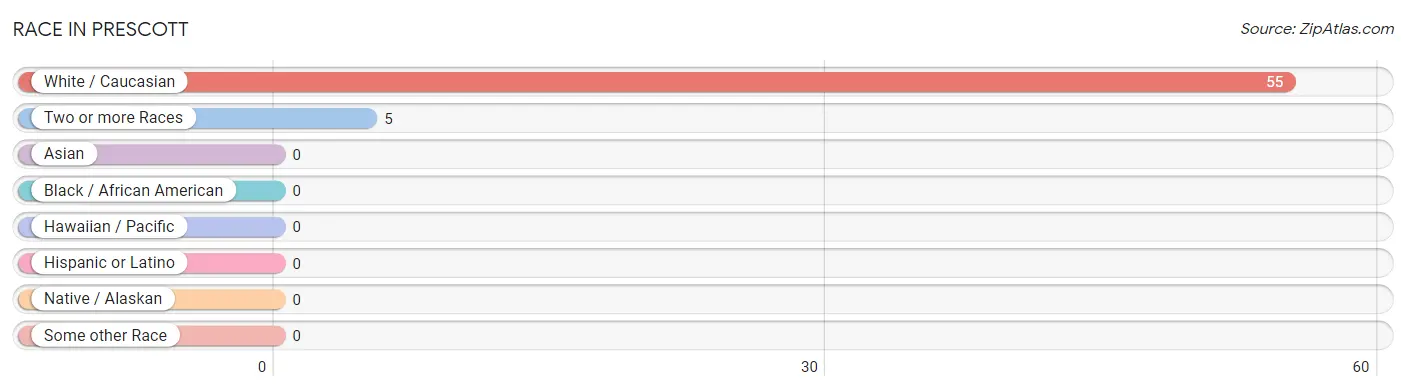
| Race | # Population | % Population |
| Asian | 0 | 0.0% |
| Black / African American | 0 | 0.0% |
| Hawaiian / Pacific | 0 | 0.0% |
| Hispanic or Latino | 0 | 0.0% |
| Native / Alaskan | 0 | 0.0% |
| White / Caucasian | 55 | 91.7% |
| Two or more Races | 5 | 8.3% |
| Some other Race | 0 | 0.0% |
| Total | 60 | 100.0% |
Ancestry in Prescott
The most populous ancestries reported in Prescott are German (23 | 38.3%), Irish (12 | 20.0%), Swiss (6 | 10.0%), Cherokee (5 | 8.3%), and English (5 | 8.3%), together accounting for 85.0% of all Prescott residents.
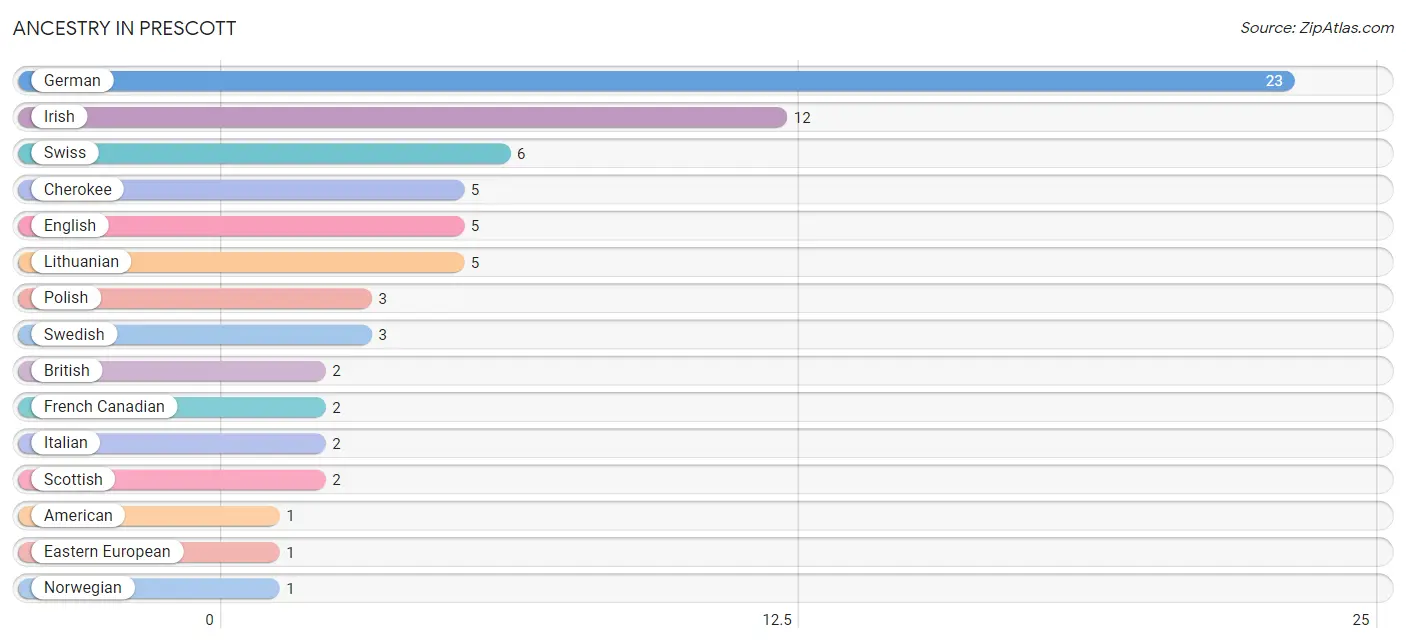
| Ancestry | # Population | % Population |
| American | 1 | 1.7% |
| British | 2 | 3.3% |
| Cherokee | 5 | 8.3% |
| Eastern European | 1 | 1.7% |
| English | 5 | 8.3% |
| French Canadian | 2 | 3.3% |
| German | 23 | 38.3% |
| Irish | 12 | 20.0% |
| Italian | 2 | 3.3% |
| Lithuanian | 5 | 8.3% |
| Norwegian | 1 | 1.7% |
| Polish | 3 | 5.0% |
| Scandinavian | 1 | 1.7% |
| Scottish | 2 | 3.3% |
| Swedish | 3 | 5.0% |
| Swiss | 6 | 10.0% | View All 16 Rows |
Immigrants in Prescott

| Immigration Origin | # Population | % Population | View All 0 Rows |
Sex and Age in Prescott
Sex and Age in Prescott
The most populous age groups in Prescott are 60 to 64 Years (8 | 28.6%) for men and 60 to 64 Years (8 | 25.0%) for women.
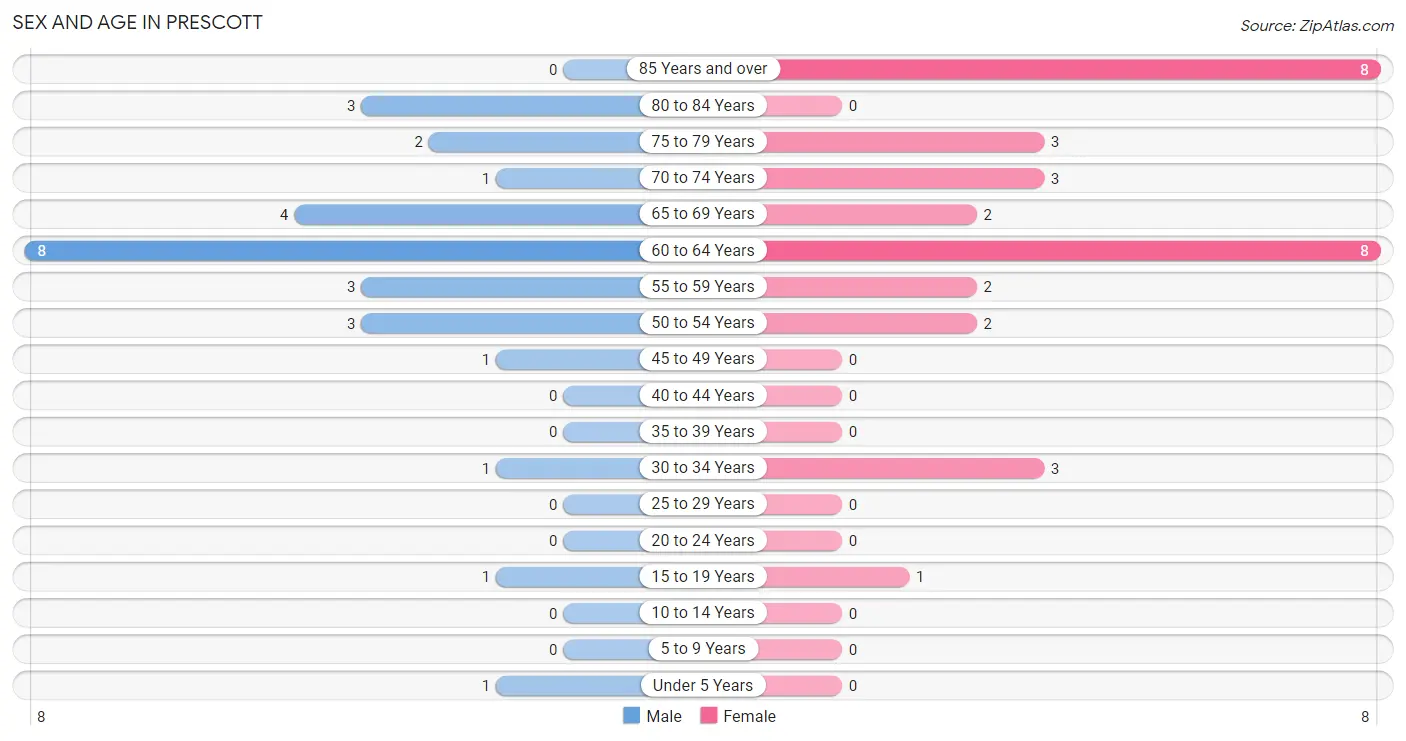
| Age Bracket | Male | Female |
| Under 5 Years | 1 (3.6%) | 0 (0.0%) |
| 5 to 9 Years | 0 (0.0%) | 0 (0.0%) |
| 10 to 14 Years | 0 (0.0%) | 0 (0.0%) |
| 15 to 19 Years | 1 (3.6%) | 1 (3.1%) |
| 20 to 24 Years | 0 (0.0%) | 0 (0.0%) |
| 25 to 29 Years | 0 (0.0%) | 0 (0.0%) |
| 30 to 34 Years | 1 (3.6%) | 3 (9.4%) |
| 35 to 39 Years | 0 (0.0%) | 0 (0.0%) |
| 40 to 44 Years | 0 (0.0%) | 0 (0.0%) |
| 45 to 49 Years | 1 (3.6%) | 0 (0.0%) |
| 50 to 54 Years | 3 (10.7%) | 2 (6.2%) |
| 55 to 59 Years | 3 (10.7%) | 2 (6.2%) |
| 60 to 64 Years | 8 (28.6%) | 8 (25.0%) |
| 65 to 69 Years | 4 (14.3%) | 2 (6.2%) |
| 70 to 74 Years | 1 (3.6%) | 3 (9.4%) |
| 75 to 79 Years | 2 (7.1%) | 3 (9.4%) |
| 80 to 84 Years | 3 (10.7%) | 0 (0.0%) |
| 85 Years and over | 0 (0.0%) | 8 (25.0%) |
| Total | 28 (100.0%) | 32 (100.0%) |
Families and Households in Prescott
Median Family Size in Prescott
The median family size in Prescott is 2.10 persons per family, with single female/mother families (1 | 4.8%) accounting for the largest median family size of 3 persons per family. On the other hand, single male/father families (3 | 14.3%) represent the smallest median family size with 1.67 persons per family.
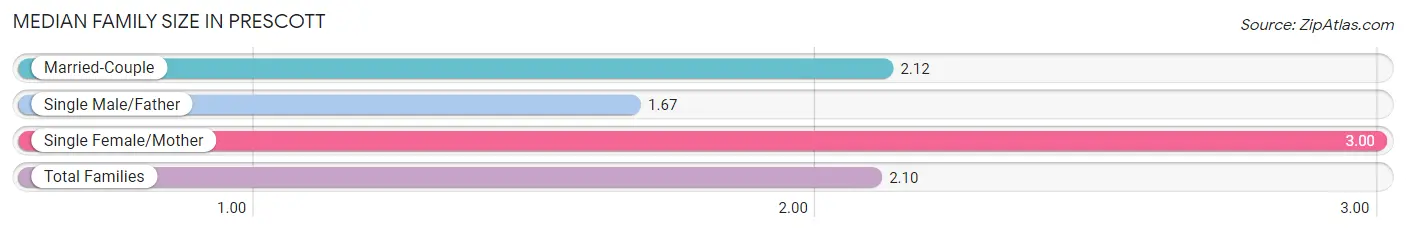
| Family Type | # Families | Family Size |
| Married-Couple | 17 (80.9%) | 2.12 |
| Single Male/Father | 3 (14.3%) | 1.67 |
| Single Female/Mother | 1 (4.8%) | 3.00 |
| Total Families | 21 (100.0%) | 2.10 |
Median Household Size in Prescott
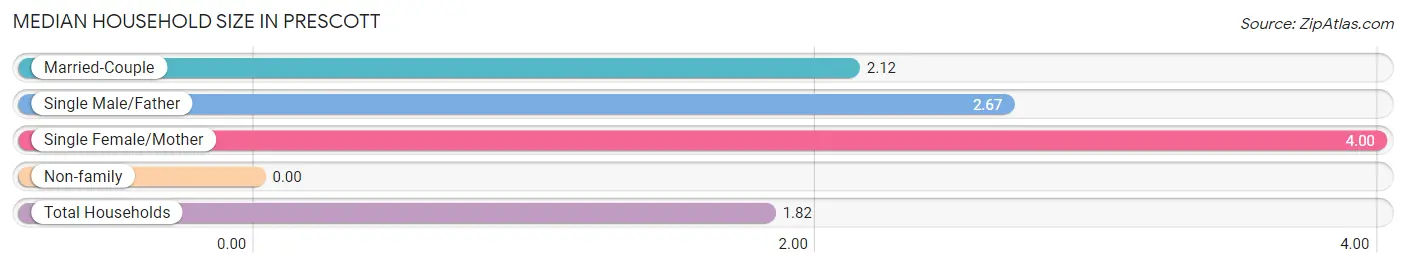
| Household Type | # Households | Household Size |
| Married-Couple | 17 (51.5%) | 2.12 |
| Single Male/Father | 3 (9.1%) | 2.67 |
| Single Female/Mother | 1 (3.0%) | 4.00 |
| Non-family | 12 (36.4%) | - |
| Total Households | 33 (100.0%) | 1.82 |
Household Size by Marriage Status in Prescott
Out of a total of 33 households in Prescott, 21 (63.6%) are family households, while 12 (36.4%) are nonfamily households. The most numerous type of family households are 3-person households, comprising 13, and the most common type of nonfamily households are 1-person households, comprising 12.
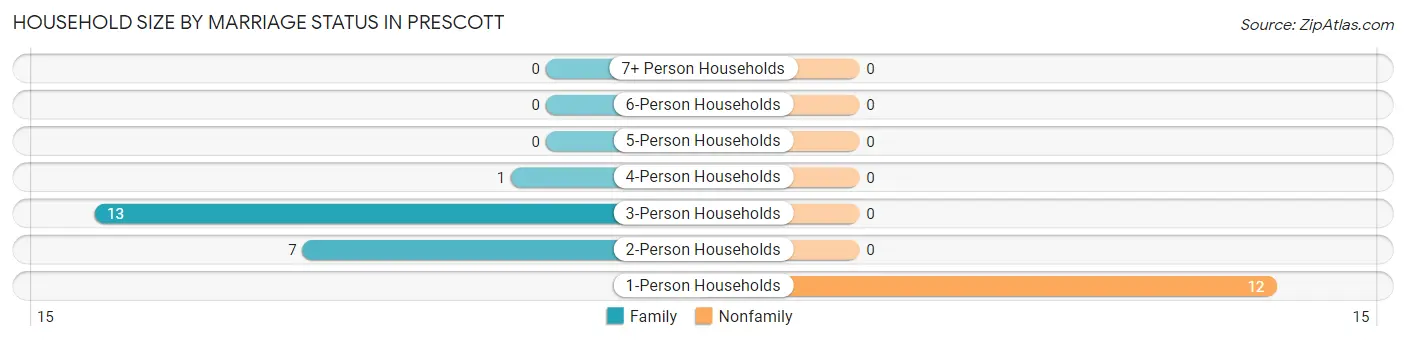
| Household Size | Family Households | Nonfamily Households |
| 1-Person Households | - | 12 (36.4%) |
| 2-Person Households | 7 (21.2%) | 0 (0.0%) |
| 3-Person Households | 13 (39.4%) | 0 (0.0%) |
| 4-Person Households | 1 (3.0%) | 0 (0.0%) |
| 5-Person Households | 0 (0.0%) | 0 (0.0%) |
| 6-Person Households | 0 (0.0%) | 0 (0.0%) |
| 7+ Person Households | 0 (0.0%) | 0 (0.0%) |
| Total | 21 (63.6%) | 12 (36.4%) |
Female Fertility in Prescott
Fertility by Age in Prescott
Average fertility rate in Prescott is 750.0 births per 1,000 women. Women in the age bracket of 20 to 34 years have the highest fertility rate with 1,000.0 births per 1,000 women. Women in the age bracket of 20 to 34 years acount for 100.0% of all women with births.
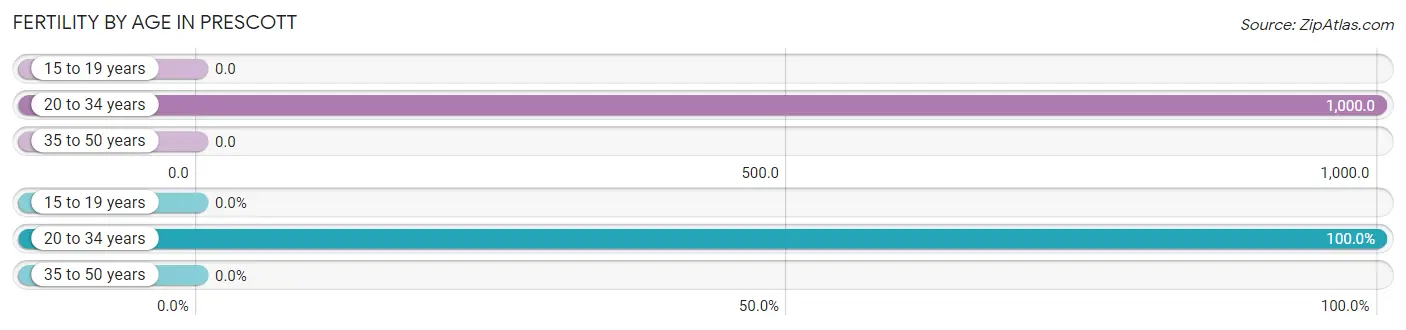
| Age Bracket | Women with Births | Births / 1,000 Women |
| 15 to 19 years | 0 (0.0%) | 0.0 |
| 20 to 34 years | 3 (100.0%) | 1,000.0 |
| 35 to 50 years | 0 (0.0%) | 0.0 |
| Total | 3 (100.0%) | 750.0 |
Fertility by Age by Marriage Status in Prescott
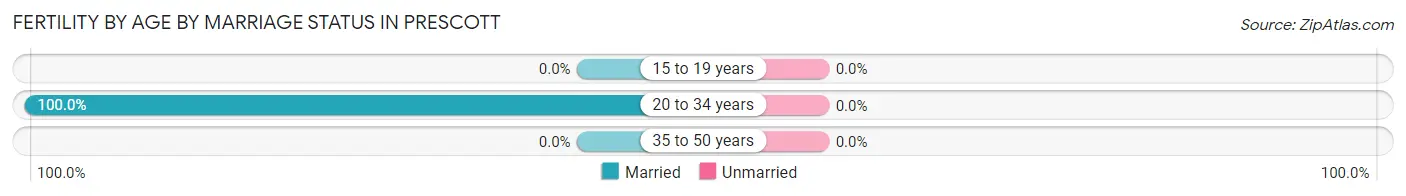
| Age Bracket | Married | Unmarried |
| 15 to 19 years | 0 (0.0%) | 0 (0.0%) |
| 20 to 34 years | 3 (100.0%) | 0 (0.0%) |
| 35 to 50 years | 0 (0.0%) | 0 (0.0%) |
| Total | 3 (100.0%) | 0 (0.0%) |
Fertility by Education in Prescott
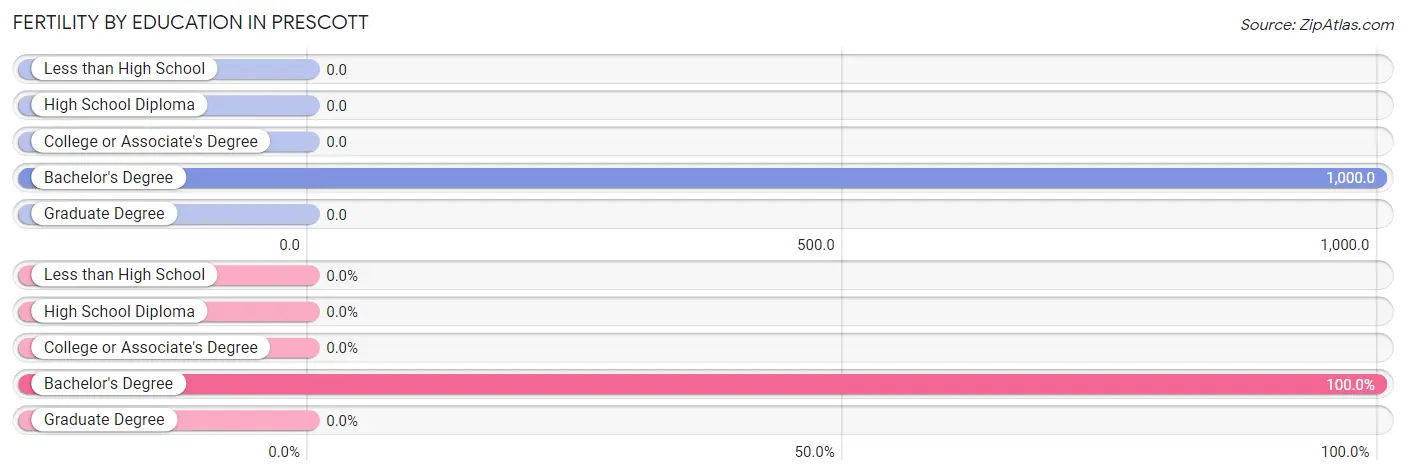
| Educational Attainment | Women with Births | Births / 1,000 Women |
| Less than High School | 0 (0.0%) | 0.0 |
| High School Diploma | 0 (0.0%) | 0.0 |
| College or Associate's Degree | 0 (0.0%) | 0.0 |
| Bachelor's Degree | 3 (100.0%) | 1,000.0 |
| Graduate Degree | 0 (0.0%) | 0.0 |
| Total | 3 (100.0%) | 750.0 |
Fertility by Education by Marriage Status in Prescott
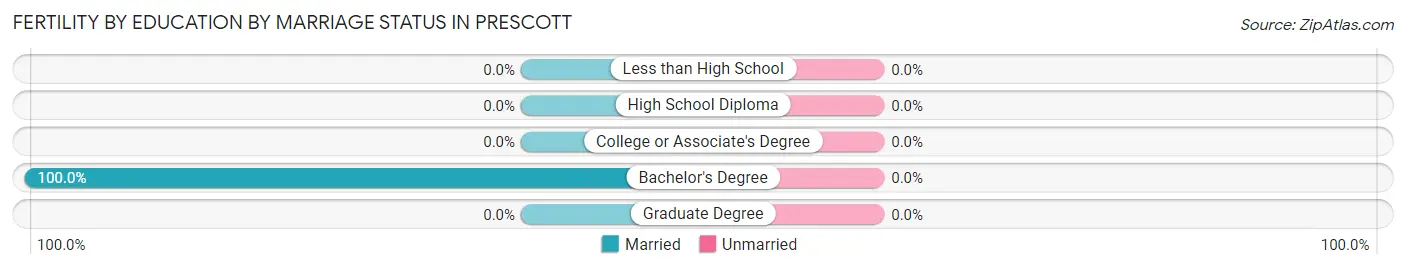
| Educational Attainment | Married | Unmarried |
| Less than High School | 0 (0.0%) | 0 (0.0%) |
| High School Diploma | 0 (0.0%) | 0 (0.0%) |
| College or Associate's Degree | 0 (0.0%) | 0 (0.0%) |
| Bachelor's Degree | 3 (100.0%) | 0 (0.0%) |
| Graduate Degree | 0 (0.0%) | 0 (0.0%) |
| Total | 3 (100.0%) | 0 (0.0%) |
Employment Characteristics in Prescott
Employment by Class of Employer in Prescott
Among the 11 employed individuals in Prescott, private company employees (10 | 90.9%), and self-employed (incorporated) (1 | 9.1%) make up the most common classes of employment.
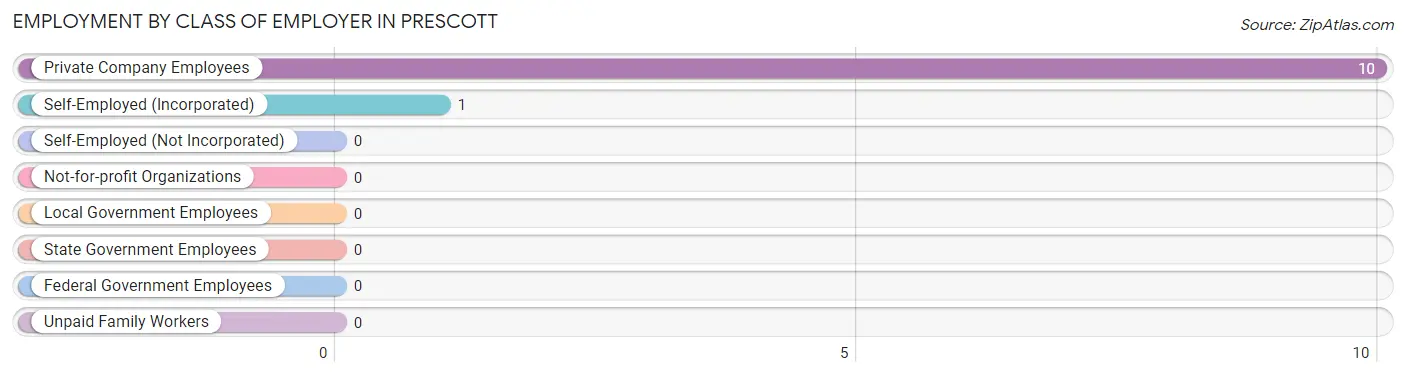
| Employer Class | # Employees | % Employees |
| Private Company Employees | 10 | 90.9% |
| Self-Employed (Incorporated) | 1 | 9.1% |
| Self-Employed (Not Incorporated) | 0 | 0.0% |
| Not-for-profit Organizations | 0 | 0.0% |
| Local Government Employees | 0 | 0.0% |
| State Government Employees | 0 | 0.0% |
| Federal Government Employees | 0 | 0.0% |
| Unpaid Family Workers | 0 | 0.0% |
| Total | 11 | 100.0% |
Employment Status by Age in Prescott
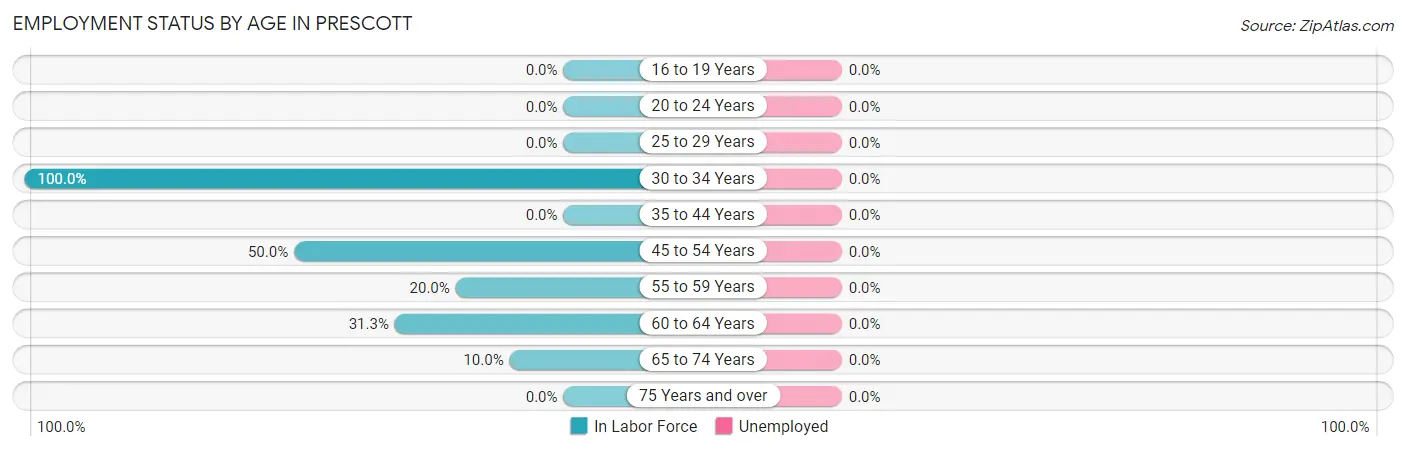
| Age Bracket | In Labor Force | Unemployed |
| 16 to 19 Years | 0 (0.0%) | 0 (0.0%) |
| 20 to 24 Years | 0 (0.0%) | 0 (0.0%) |
| 25 to 29 Years | 0 (0.0%) | 0 (0.0%) |
| 30 to 34 Years | 4 (100.0%) | 0 (0.0%) |
| 35 to 44 Years | 0 (0.0%) | 0 (0.0%) |
| 45 to 54 Years | 3 (50.0%) | 0 (0.0%) |
| 55 to 59 Years | 1 (20.0%) | 0 (0.0%) |
| 60 to 64 Years | 5 (31.3%) | 0 (0.0%) |
| 65 to 74 Years | 1 (10.0%) | 0 (0.0%) |
| 75 Years and over | 0 (0.0%) | 0 (0.0%) |
| Total | 14 (23.7%) | 0 (0.0%) |
Employment Status by Educational Attainment in Prescott
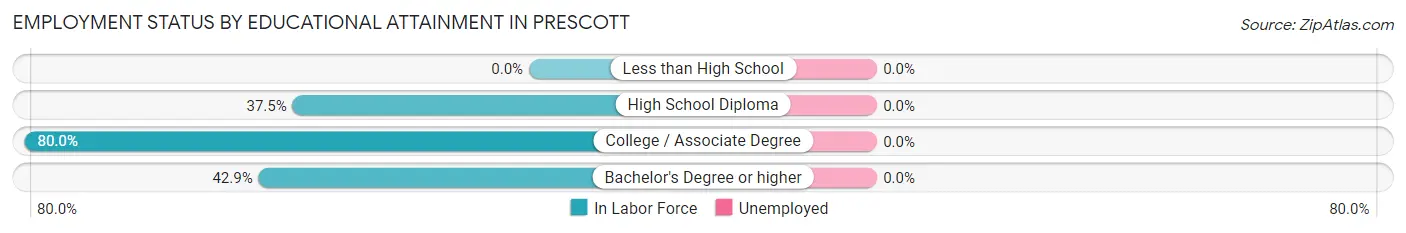
| Educational Attainment | In Labor Force | Unemployed |
| Less than High School | 0 (0.0%) | 0 (0.0%) |
| High School Diploma | 6 (37.5%) | 0 (0.0%) |
| College / Associate Degree | 4 (80.0%) | 0 (0.0%) |
| Bachelor's Degree or higher | 3 (42.9%) | 0 (0.0%) |
| Total | 13 (41.9%) | 0 (0.0%) |
Employment Occupations by Sex in Prescott
Management, Business, Science and Arts Occupations
The most common Management, Business, Science and Arts occupations in Prescott are , and Management (3 | 21.4%).
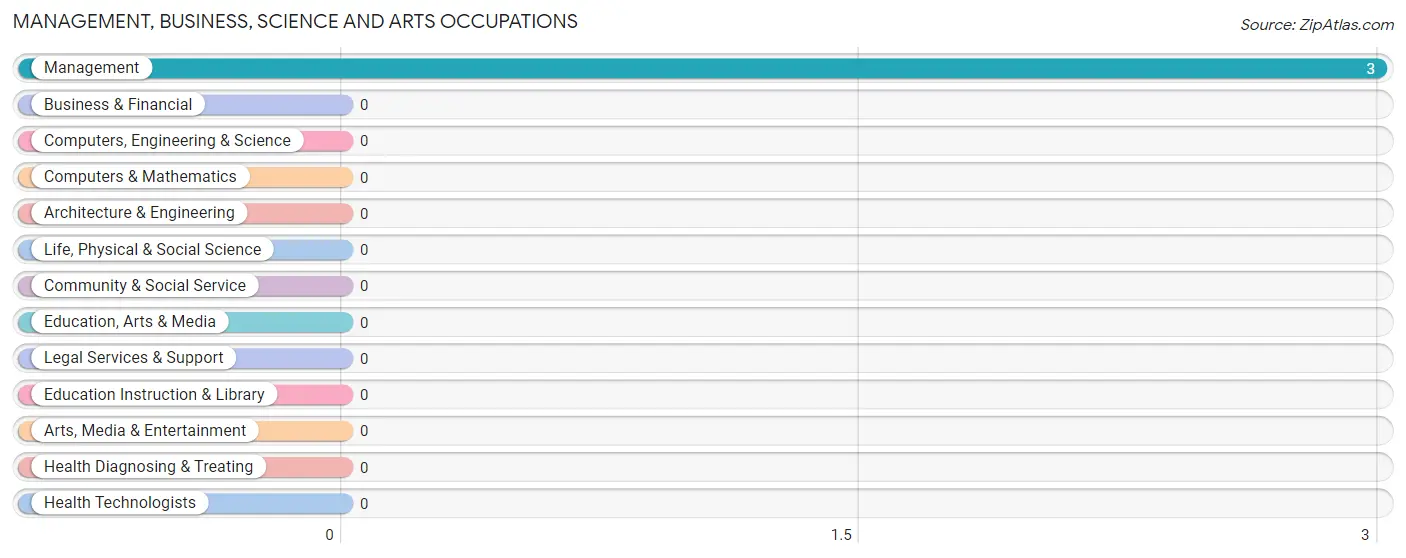
Management, Business, Science and Arts Occupations by Sex
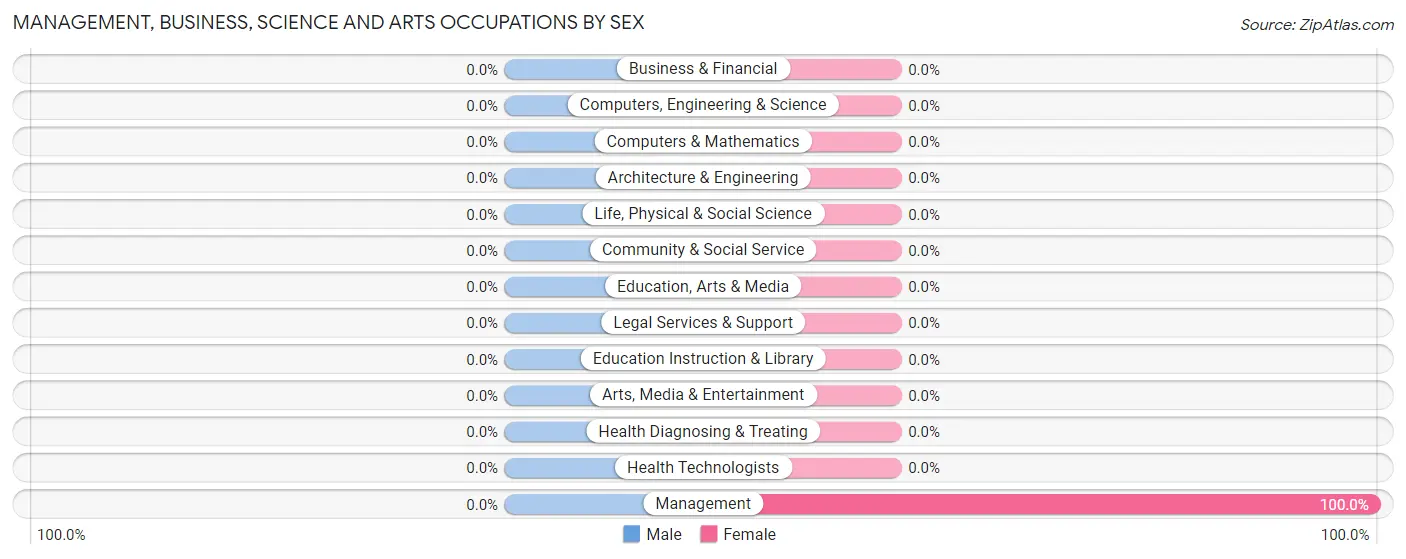
| Occupation | Male | Female |
| Management | 0 (0.0%) | 3 (100.0%) |
| Business & Financial | 0 (0.0%) | 0 (0.0%) |
| Computers, Engineering & Science | 0 (0.0%) | 0 (0.0%) |
| Computers & Mathematics | 0 (0.0%) | 0 (0.0%) |
| Architecture & Engineering | 0 (0.0%) | 0 (0.0%) |
| Life, Physical & Social Science | 0 (0.0%) | 0 (0.0%) |
| Community & Social Service | 0 (0.0%) | 0 (0.0%) |
| Education, Arts & Media | 0 (0.0%) | 0 (0.0%) |
| Legal Services & Support | 0 (0.0%) | 0 (0.0%) |
| Education Instruction & Library | 0 (0.0%) | 0 (0.0%) |
| Arts, Media & Entertainment | 0 (0.0%) | 0 (0.0%) |
| Health Diagnosing & Treating | 0 (0.0%) | 0 (0.0%) |
| Health Technologists | 0 (0.0%) | 0 (0.0%) |
| Total (Category) | 0 (0.0%) | 3 (100.0%) |
| Total (Overall) | 9 (64.3%) | 5 (35.7%) |
Services Occupations
Services Occupations by Sex
| Occupation | Male | Female |
| Healthcare Support | 0 (0.0%) | 0 (0.0%) |
| Security & Protection | 0 (0.0%) | 0 (0.0%) |
| Firefighting & Prevention | 0 (0.0%) | 0 (0.0%) |
| Law Enforcement | 0 (0.0%) | 0 (0.0%) |
| Food Preparation & Serving | 0 (0.0%) | 0 (0.0%) |
| Cleaning & Maintenance | 0 (0.0%) | 0 (0.0%) |
| Personal Care & Service | 0 (0.0%) | 0 (0.0%) |
| Total (Category) | 0 (0.0%) | 0 (0.0%) |
| Total (Overall) | 9 (64.3%) | 5 (35.7%) |
Sales and Office Occupations
The most common Sales and Office occupations in Prescott are , and Sales & Related (2 | 14.3%).
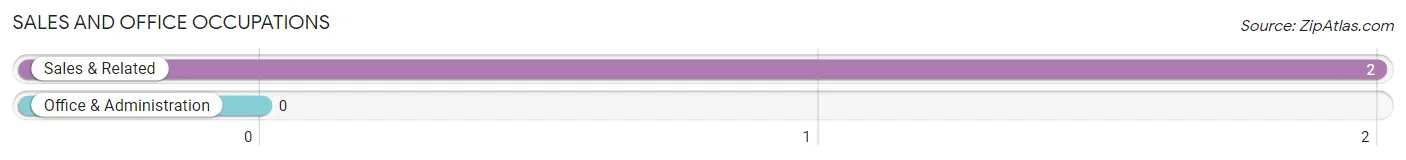
Sales and Office Occupations by Sex
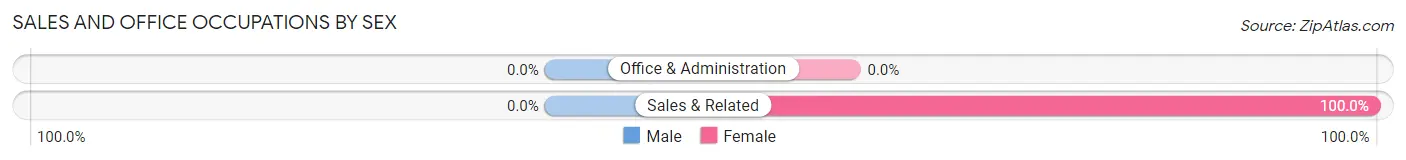
| Occupation | Male | Female |
| Sales & Related | 0 (0.0%) | 2 (100.0%) |
| Office & Administration | 0 (0.0%) | 0 (0.0%) |
| Total (Category) | 0 (0.0%) | 2 (100.0%) |
| Total (Overall) | 9 (64.3%) | 5 (35.7%) |
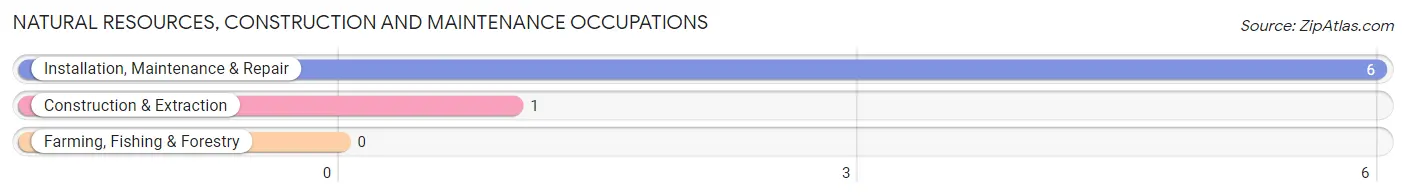
Natural Resources, Construction and Maintenance Occupations
The most common Natural Resources, Construction and Maintenance occupations in Prescott are Installation, Maintenance & Repair (6 | 42.9%), and Construction & Extraction (1 | 7.1%).
Natural Resources, Construction and Maintenance Occupations by Sex
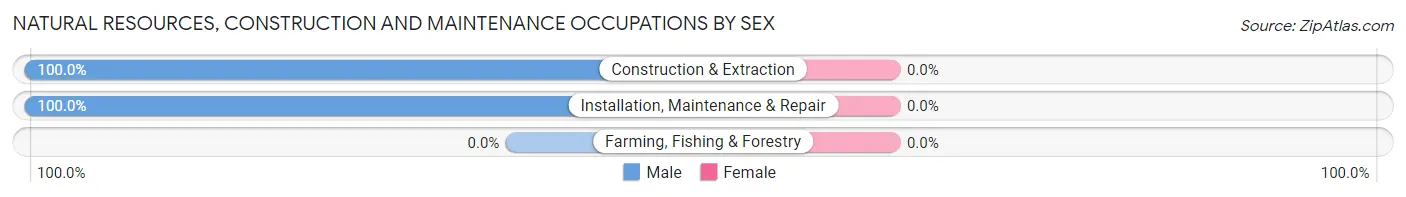
| Occupation | Male | Female |
| Farming, Fishing & Forestry | 0 (0.0%) | 0 (0.0%) |
| Construction & Extraction | 1 (100.0%) | 0 (0.0%) |
| Installation, Maintenance & Repair | 6 (100.0%) | 0 (0.0%) |
| Total (Category) | 7 (100.0%) | 0 (0.0%) |
| Total (Overall) | 9 (64.3%) | 5 (35.7%) |
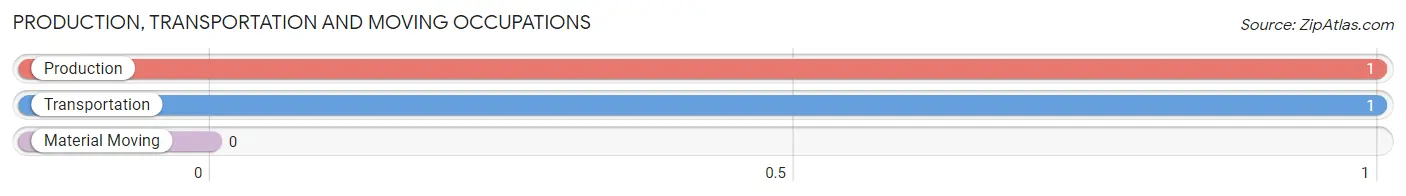
Production, Transportation and Moving Occupations
The most common Production, Transportation and Moving occupations in Prescott are Production (1 | 7.1%), and Transportation (1 | 7.1%).
Production, Transportation and Moving Occupations by Sex
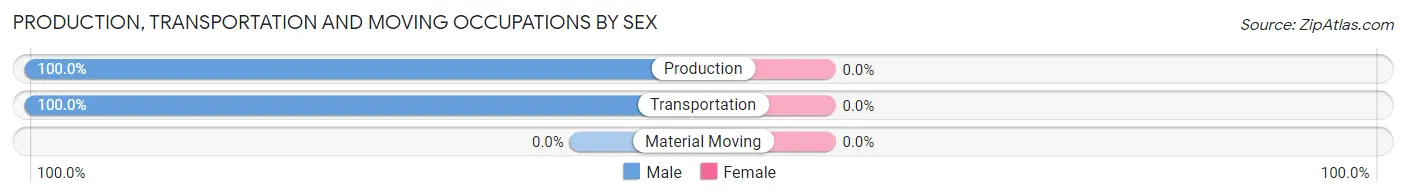
| Occupation | Male | Female |
| Production | 1 (100.0%) | 0 (0.0%) |
| Transportation | 1 (100.0%) | 0 (0.0%) |
| Material Moving | 0 (0.0%) | 0 (0.0%) |
| Total (Category) | 2 (100.0%) | 0 (0.0%) |
| Total (Overall) | 9 (64.3%) | 5 (35.7%) |
Employment Industries by Sex in Prescott
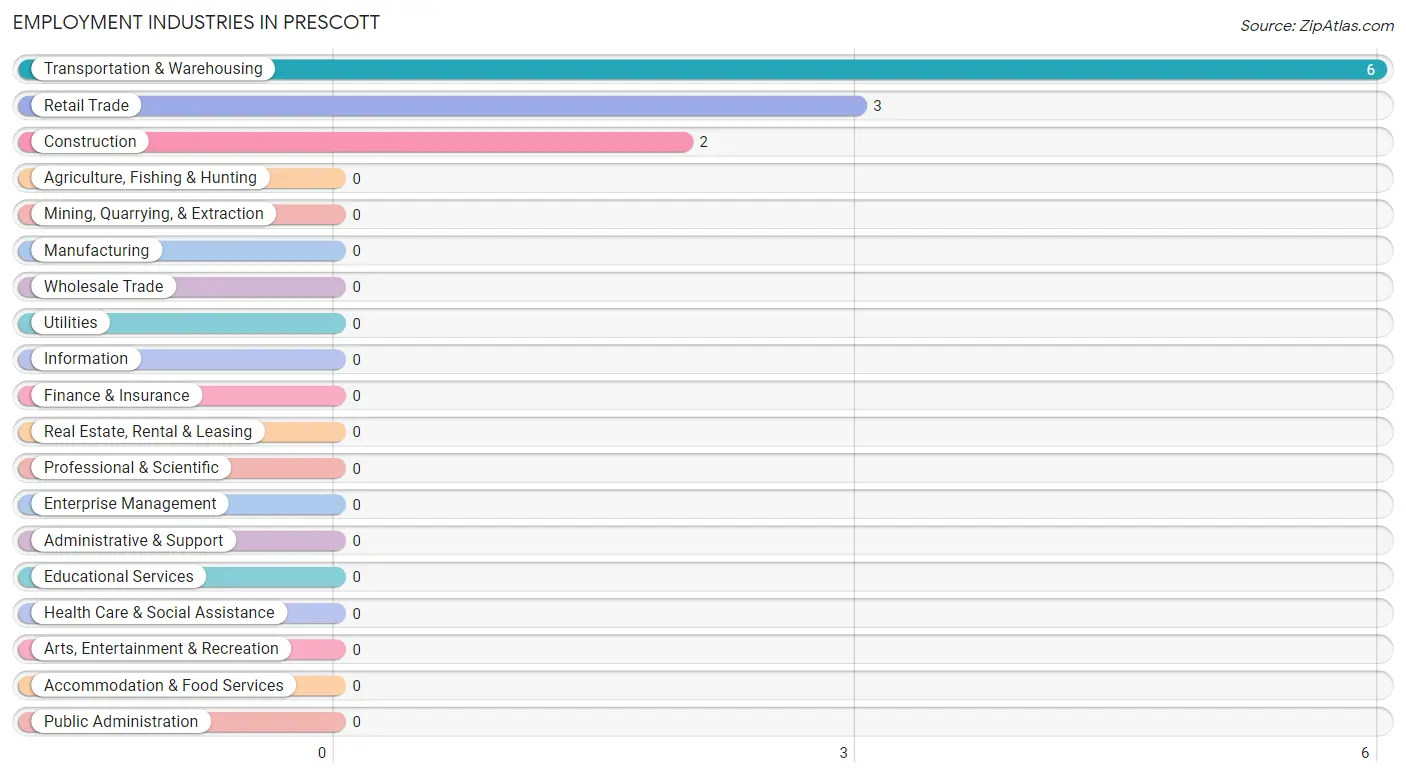
Employment Industries in Prescott
The major employment industries in Prescott include Transportation & Warehousing (6 | 42.9%), Retail Trade (3 | 21.4%), and Construction (2 | 14.3%).
Employment Industries by Sex in Prescott
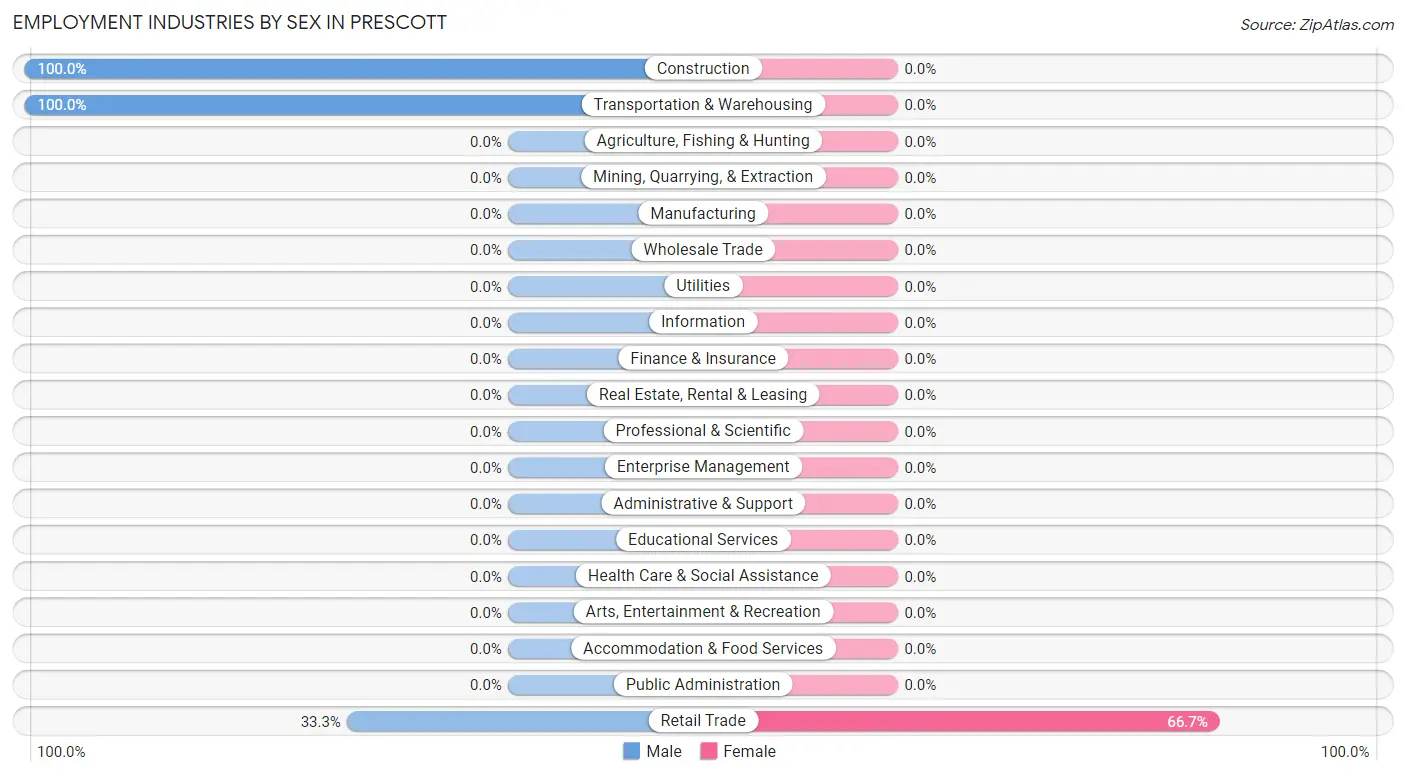
| Industry | Male | Female |
| Agriculture, Fishing & Hunting | 0 (0.0%) | 0 (0.0%) |
| Mining, Quarrying, & Extraction | 0 (0.0%) | 0 (0.0%) |
| Construction | 2 (100.0%) | 0 (0.0%) |
| Manufacturing | 0 (0.0%) | 0 (0.0%) |
| Wholesale Trade | 0 (0.0%) | 0 (0.0%) |
| Retail Trade | 1 (33.3%) | 2 (66.7%) |
| Transportation & Warehousing | 6 (100.0%) | 0 (0.0%) |
| Utilities | 0 (0.0%) | 0 (0.0%) |
| Information | 0 (0.0%) | 0 (0.0%) |
| Finance & Insurance | 0 (0.0%) | 0 (0.0%) |
| Real Estate, Rental & Leasing | 0 (0.0%) | 0 (0.0%) |
| Professional & Scientific | 0 (0.0%) | 0 (0.0%) |
| Enterprise Management | 0 (0.0%) | 0 (0.0%) |
| Administrative & Support | 0 (0.0%) | 0 (0.0%) |
| Educational Services | 0 (0.0%) | 0 (0.0%) |
| Health Care & Social Assistance | 0 (0.0%) | 0 (0.0%) |
| Arts, Entertainment & Recreation | 0 (0.0%) | 0 (0.0%) |
| Accommodation & Food Services | 0 (0.0%) | 0 (0.0%) |
| Public Administration | 0 (0.0%) | 0 (0.0%) |
| Total | 9 (64.3%) | 5 (35.7%) |
Education in Prescott
School Enrollment in Prescott
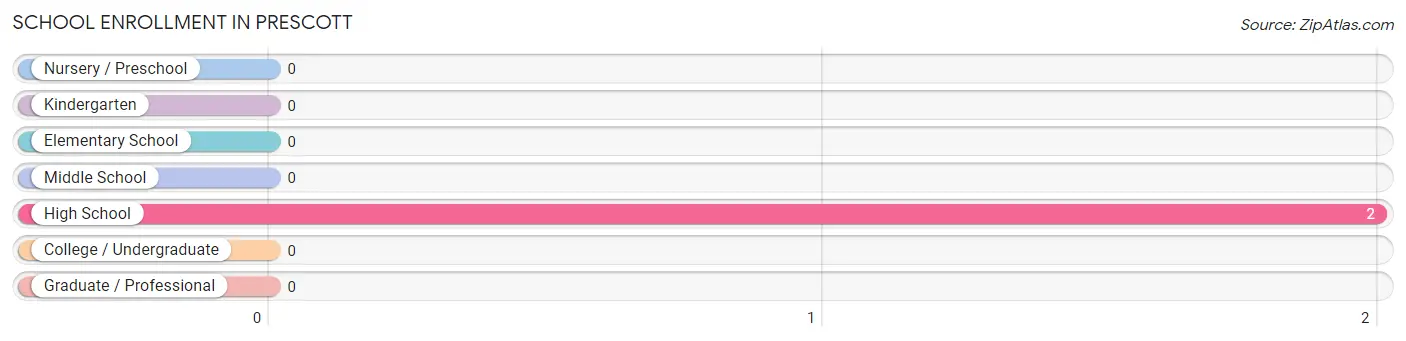
| School Level | # Students | % Students |
| Nursery / Preschool | 0 | 0.0% |
| Kindergarten | 0 | 0.0% |
| Elementary School | 0 | 0.0% |
| Middle School | 0 | 0.0% |
| High School | 2 | 100.0% |
| College / Undergraduate | 0 | 0.0% |
| Graduate / Professional | 0 | 0.0% |
| Total | 2 | 100.0% |
School Enrollment by Age by Funding Source in Prescott
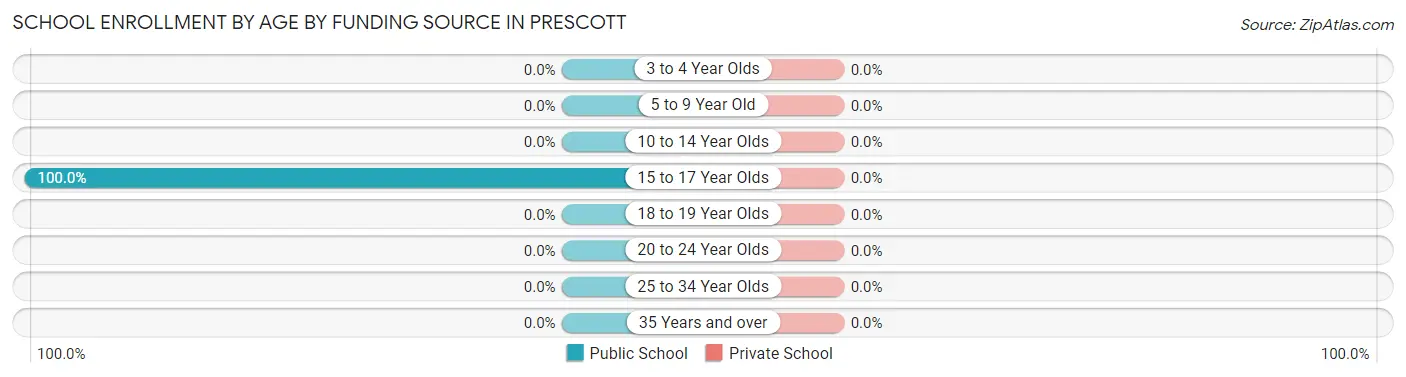
| Age Bracket | Public School | Private School |
| 3 to 4 Year Olds | 0 (0.0%) | 0 (0.0%) |
| 5 to 9 Year Old | 0 (0.0%) | 0 (0.0%) |
| 10 to 14 Year Olds | 0 (0.0%) | 0 (0.0%) |
| 15 to 17 Year Olds | 2 (100.0%) | 0 (0.0%) |
| 18 to 19 Year Olds | 0 (0.0%) | 0 (0.0%) |
| 20 to 24 Year Olds | 0 (0.0%) | 0 (0.0%) |
| 25 to 34 Year Olds | 0 (0.0%) | 0 (0.0%) |
| 35 Years and over | 0 (0.0%) | 0 (0.0%) |
| Total | 2 (100.0%) | 0 (0.0%) |
Educational Attainment by Field of Study in Prescott
Physical & health sciences (3 | 27.3%), education (3 | 27.3%), visual & performing arts (3 | 27.3%), and literature & languages (2 | 18.2%) are the most common fields of study among 11 individuals in Prescott who have obtained a bachelor's degree or higher.
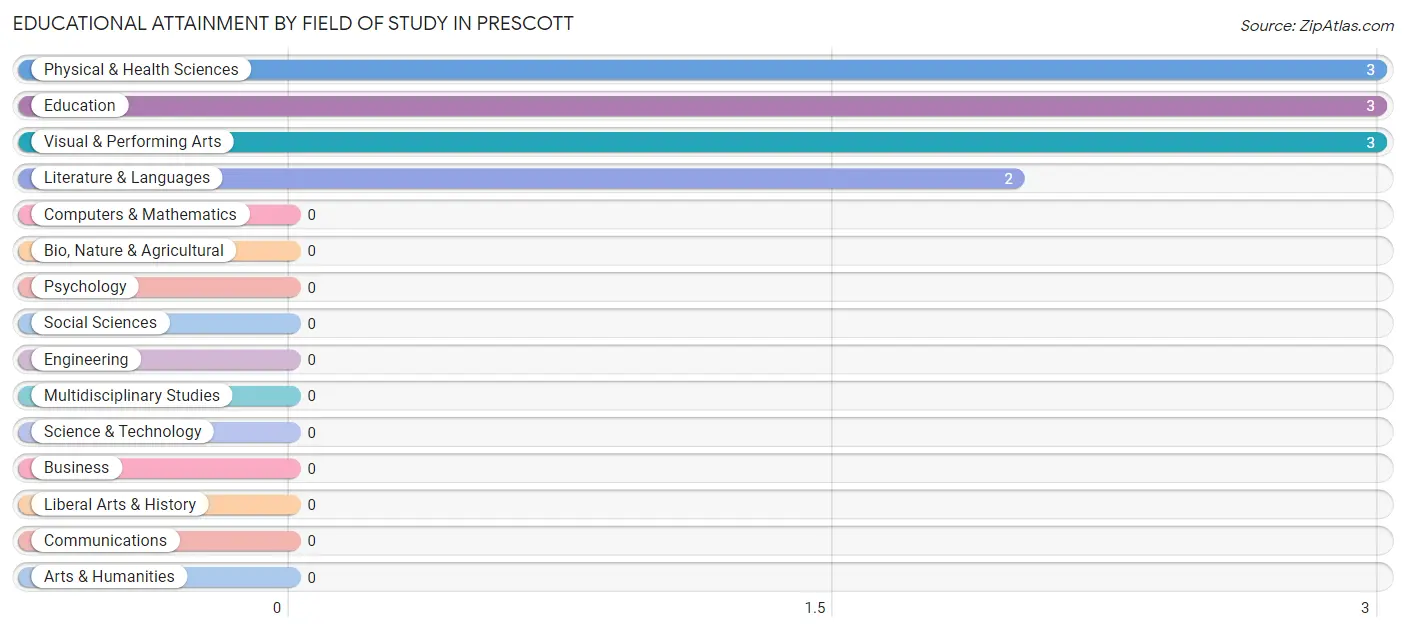
| Field of Study | # Graduates | % Graduates |
| Computers & Mathematics | 0 | 0.0% |
| Bio, Nature & Agricultural | 0 | 0.0% |
| Physical & Health Sciences | 3 | 27.3% |
| Psychology | 0 | 0.0% |
| Social Sciences | 0 | 0.0% |
| Engineering | 0 | 0.0% |
| Multidisciplinary Studies | 0 | 0.0% |
| Science & Technology | 0 | 0.0% |
| Business | 0 | 0.0% |
| Education | 3 | 27.3% |
| Literature & Languages | 2 | 18.2% |
| Liberal Arts & History | 0 | 0.0% |
| Visual & Performing Arts | 3 | 27.3% |
| Communications | 0 | 0.0% |
| Arts & Humanities | 0 | 0.0% |
| Total | 11 | 100.0% |
Transportation & Commute in Prescott
Vehicle Availability by Sex in Prescott
The most prevalent vehicle ownership categories in Prescott are males with 2 vehicles (5, accounting for 55.6%) and females with 2 vehicles (1, making up 250.0%).
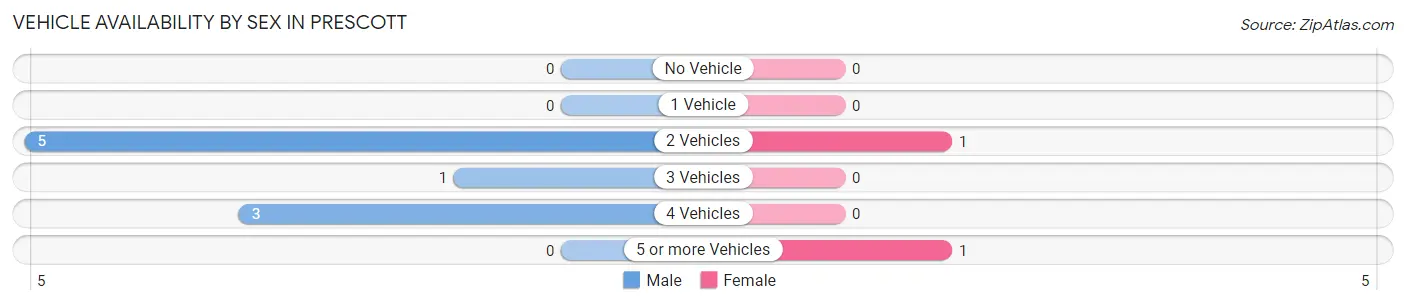
| Vehicles Available | Male | Female |
| No Vehicle | 0 (0.0%) | 0 (0.0%) |
| 1 Vehicle | 0 (0.0%) | 0 (0.0%) |
| 2 Vehicles | 5 (55.6%) | 1 (50.0%) |
| 3 Vehicles | 1 (11.1%) | 0 (0.0%) |
| 4 Vehicles | 3 (33.3%) | 0 (0.0%) |
| 5 or more Vehicles | 0 (0.0%) | 1 (50.0%) |
| Total | 9 (100.0%) | 2 (100.0%) |
Commute Time in Prescott
The most frequently occuring commute durations in Prescott are 60 to 89 minutes (7 commuters, 63.6%), 15 to 19 minutes (1 commuters, 9.1%), and 20 to 24 minutes (1 commuters, 9.1%).
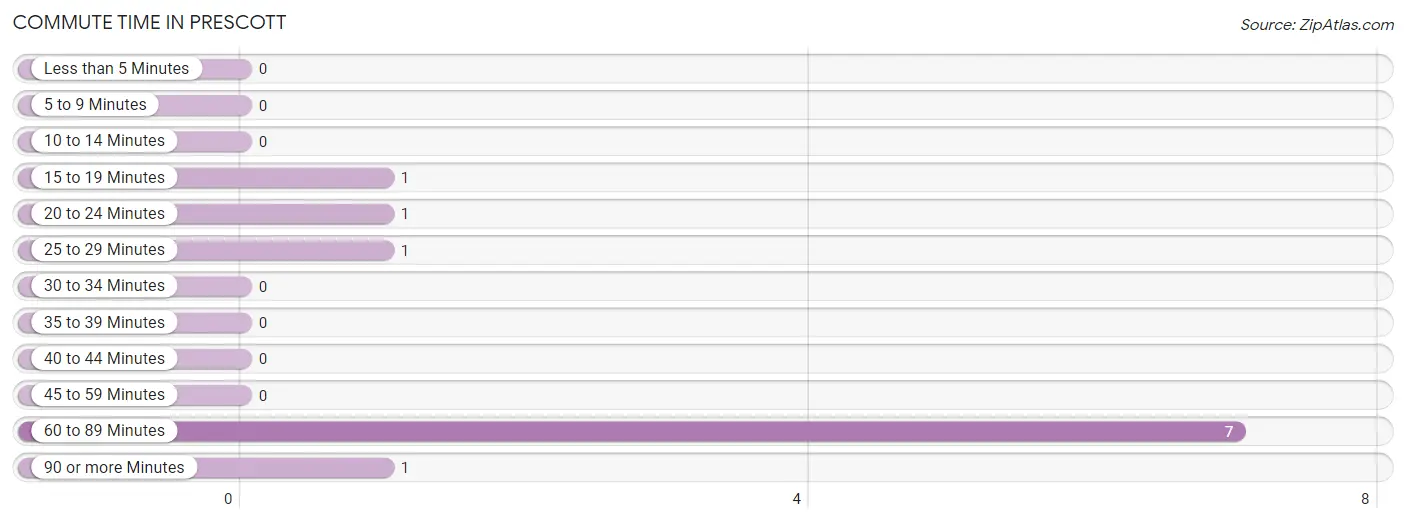
| Commute Time | # Commuters | % Commuters |
| Less than 5 Minutes | 0 | 0.0% |
| 5 to 9 Minutes | 0 | 0.0% |
| 10 to 14 Minutes | 0 | 0.0% |
| 15 to 19 Minutes | 1 | 9.1% |
| 20 to 24 Minutes | 1 | 9.1% |
| 25 to 29 Minutes | 1 | 9.1% |
| 30 to 34 Minutes | 0 | 0.0% |
| 35 to 39 Minutes | 0 | 0.0% |
| 40 to 44 Minutes | 0 | 0.0% |
| 45 to 59 Minutes | 0 | 0.0% |
| 60 to 89 Minutes | 7 | 63.6% |
| 90 or more Minutes | 1 | 9.1% |
Commute Time by Sex in Prescott
The most common commute times in Prescott are 60 to 89 minutes (7 commuters, 77.8%) for males and 20 to 24 minutes (1 commuters, 50.0%) for females.
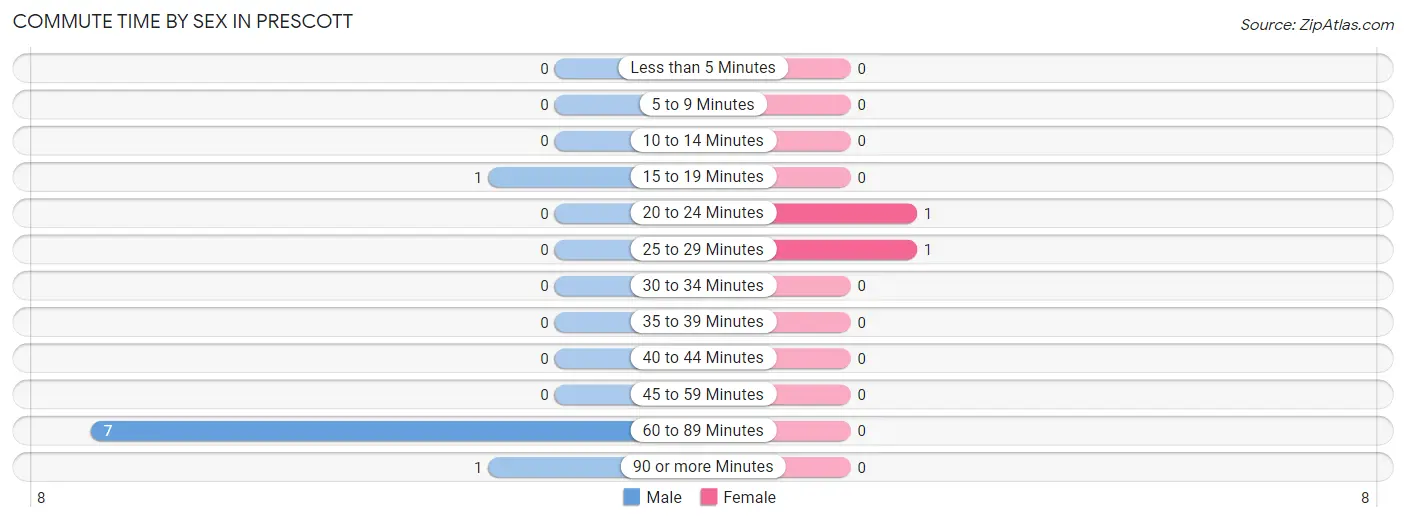
| Commute Time | Male | Female |
| Less than 5 Minutes | 0 (0.0%) | 0 (0.0%) |
| 5 to 9 Minutes | 0 (0.0%) | 0 (0.0%) |
| 10 to 14 Minutes | 0 (0.0%) | 0 (0.0%) |
| 15 to 19 Minutes | 1 (11.1%) | 0 (0.0%) |
| 20 to 24 Minutes | 0 (0.0%) | 1 (50.0%) |
| 25 to 29 Minutes | 0 (0.0%) | 1 (50.0%) |
| 30 to 34 Minutes | 0 (0.0%) | 0 (0.0%) |
| 35 to 39 Minutes | 0 (0.0%) | 0 (0.0%) |
| 40 to 44 Minutes | 0 (0.0%) | 0 (0.0%) |
| 45 to 59 Minutes | 0 (0.0%) | 0 (0.0%) |
| 60 to 89 Minutes | 7 (77.8%) | 0 (0.0%) |
| 90 or more Minutes | 1 (11.1%) | 0 (0.0%) |
Time of Departure to Work by Sex in Prescott
The most frequent times of departure to work in Prescott are 4:00 PM to 11:59 PM (6, 66.7%) for males and 7:30 AM to 7:59 AM (1, 50.0%) for females.
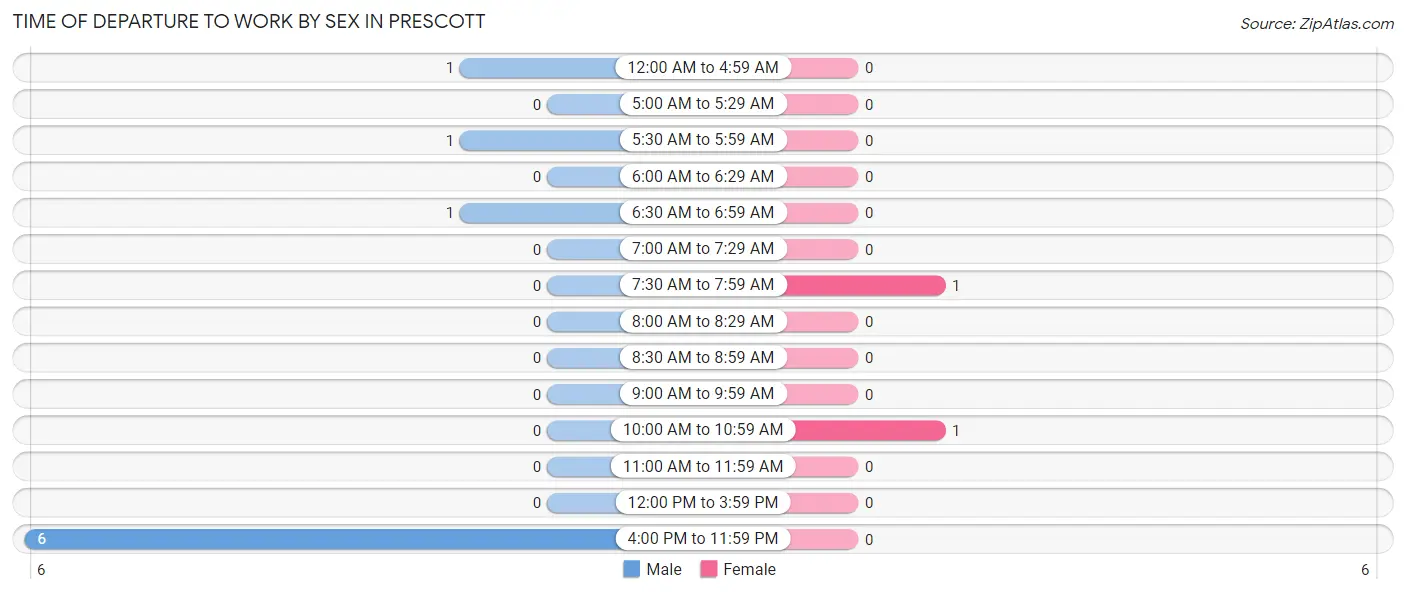
| Time of Departure | Male | Female |
| 12:00 AM to 4:59 AM | 1 (11.1%) | 0 (0.0%) |
| 5:00 AM to 5:29 AM | 0 (0.0%) | 0 (0.0%) |
| 5:30 AM to 5:59 AM | 1 (11.1%) | 0 (0.0%) |
| 6:00 AM to 6:29 AM | 0 (0.0%) | 0 (0.0%) |
| 6:30 AM to 6:59 AM | 1 (11.1%) | 0 (0.0%) |
| 7:00 AM to 7:29 AM | 0 (0.0%) | 0 (0.0%) |
| 7:30 AM to 7:59 AM | 0 (0.0%) | 1 (50.0%) |
| 8:00 AM to 8:29 AM | 0 (0.0%) | 0 (0.0%) |
| 8:30 AM to 8:59 AM | 0 (0.0%) | 0 (0.0%) |
| 9:00 AM to 9:59 AM | 0 (0.0%) | 0 (0.0%) |
| 10:00 AM to 10:59 AM | 0 (0.0%) | 1 (50.0%) |
| 11:00 AM to 11:59 AM | 0 (0.0%) | 0 (0.0%) |
| 12:00 PM to 3:59 PM | 0 (0.0%) | 0 (0.0%) |
| 4:00 PM to 11:59 PM | 6 (66.7%) | 0 (0.0%) |
| Total | 9 (100.0%) | 2 (100.0%) |
Housing Occupancy in Prescott
Occupancy by Ownership in Prescott
Of the total 33 dwellings in Prescott, owner-occupied units account for 26 (78.8%), while renter-occupied units make up 7 (21.2%).
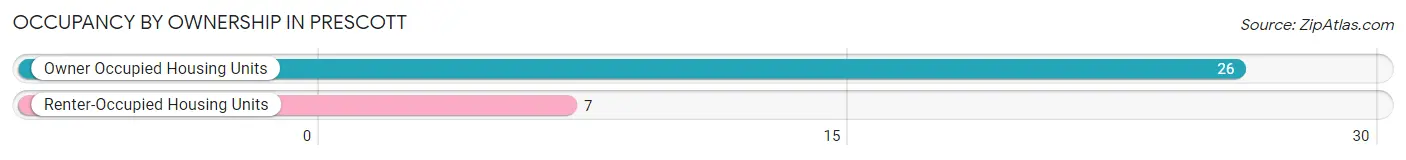
| Occupancy | # Housing Units | % Housing Units |
| Owner Occupied Housing Units | 26 | 78.8% |
| Renter-Occupied Housing Units | 7 | 21.2% |
| Total Occupied Housing Units | 33 | 100.0% |
Occupancy by Household Size in Prescott
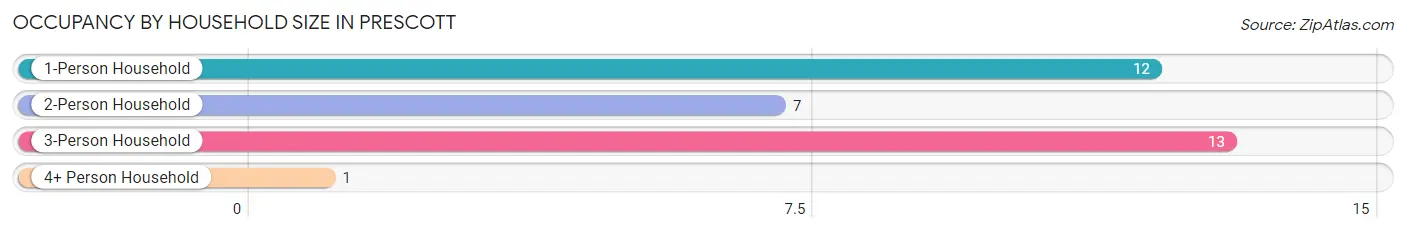
| Household Size | # Housing Units | % Housing Units |
| 1-Person Household | 12 | 36.4% |
| 2-Person Household | 7 | 21.2% |
| 3-Person Household | 13 | 39.4% |
| 4+ Person Household | 1 | 3.0% |
| Total Housing Units | 33 | 100.0% |
Occupancy by Ownership by Household Size in Prescott
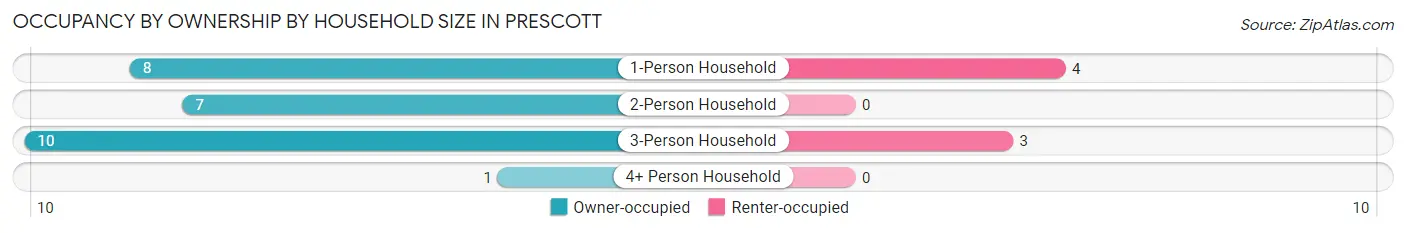
| Household Size | Owner-occupied | Renter-occupied |
| 1-Person Household | 8 (66.7%) | 4 (33.3%) |
| 2-Person Household | 7 (100.0%) | 0 (0.0%) |
| 3-Person Household | 10 (76.9%) | 3 (23.1%) |
| 4+ Person Household | 1 (100.0%) | 0 (0.0%) |
| Total Housing Units | 26 (78.8%) | 7 (21.2%) |
Occupancy by Educational Attainment in Prescott
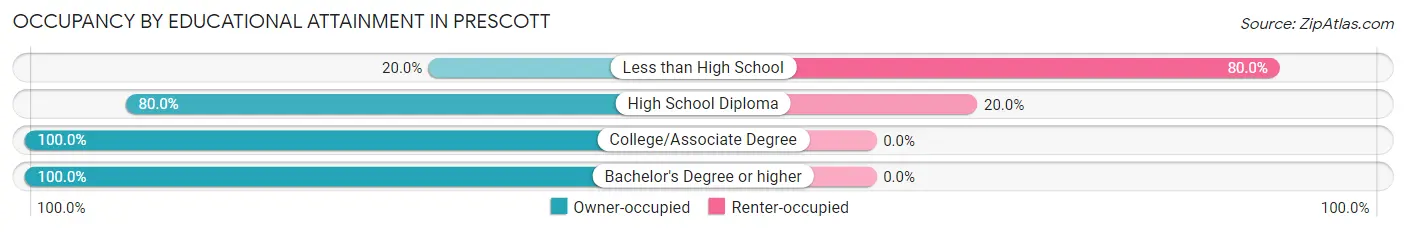
| Household Size | Owner-occupied | Renter-occupied |
| Less than High School | 1 (20.0%) | 4 (80.0%) |
| High School Diploma | 12 (80.0%) | 3 (20.0%) |
| College/Associate Degree | 6 (100.0%) | 0 (0.0%) |
| Bachelor's Degree or higher | 7 (100.0%) | 0 (0.0%) |
Occupancy by Age of Householder in Prescott
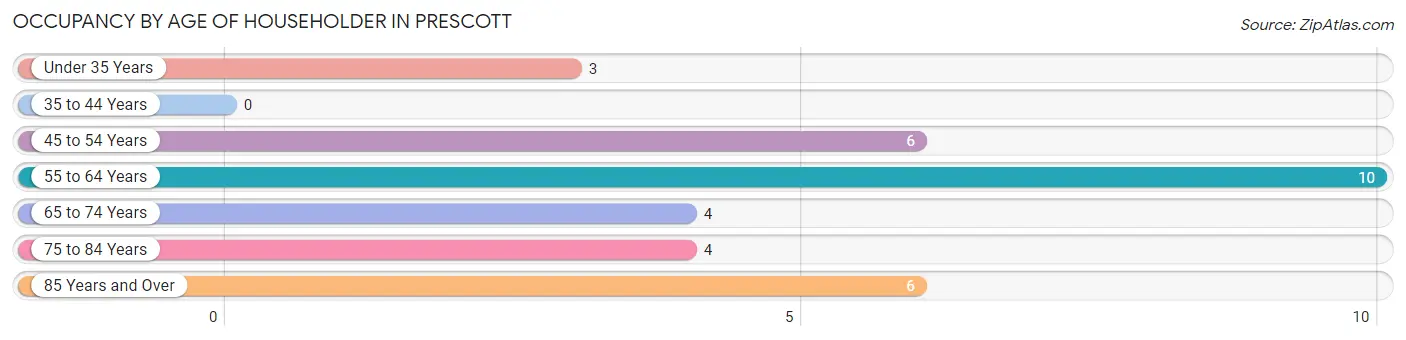
| Age Bracket | # Households | % Households |
| Under 35 Years | 3 | 9.1% |
| 35 to 44 Years | 0 | 0.0% |
| 45 to 54 Years | 6 | 18.2% |
| 55 to 64 Years | 10 | 30.3% |
| 65 to 74 Years | 4 | 12.1% |
| 75 to 84 Years | 4 | 12.1% |
| 85 Years and Over | 6 | 18.2% |
| Total | 33 | 100.0% |
Housing Finances in Prescott
Median Income by Occupancy in Prescott
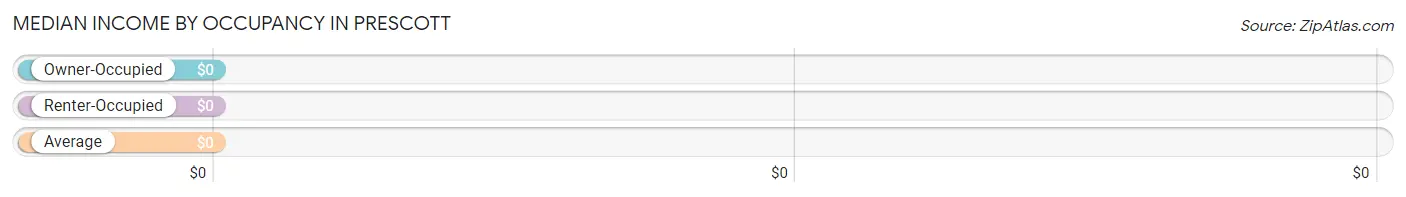
| Occupancy Type | # Households | Median Income |
| Owner-Occupied | 26 (78.8%) | $0 |
| Renter-Occupied | 7 (21.2%) | $0 |
| Average | 33 (100.0%) | $0 |
Occupancy by Householder Income Bracket in Prescott
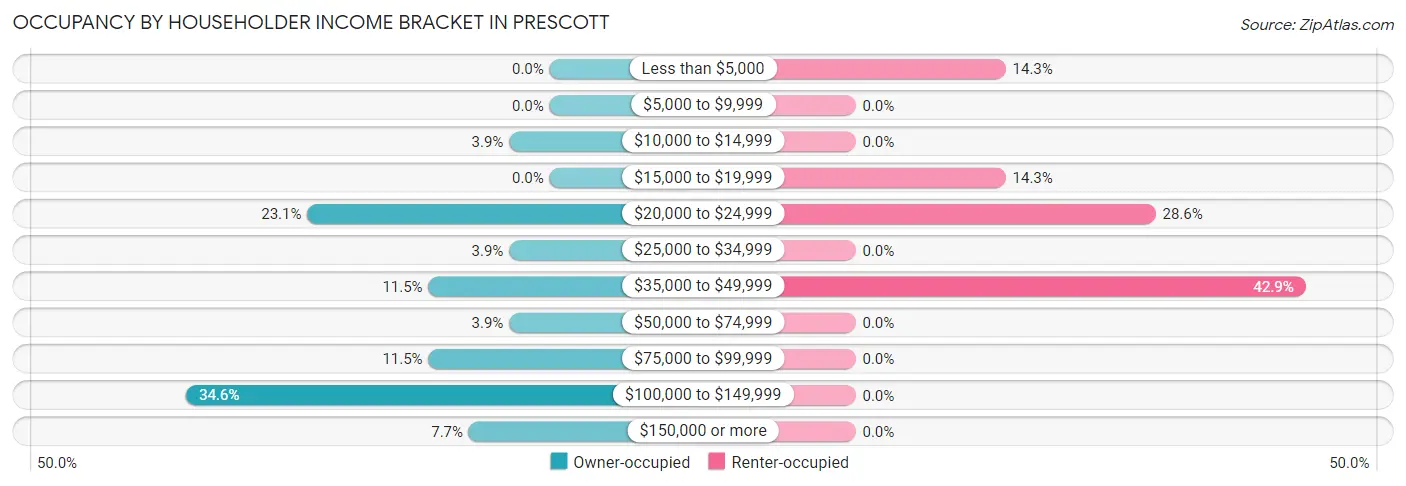
| Income Bracket | Owner-occupied | Renter-occupied |
| Less than $5,000 | 0 (0.0%) | 1 (14.3%) |
| $5,000 to $9,999 | 0 (0.0%) | 0 (0.0%) |
| $10,000 to $14,999 | 1 (3.8%) | 0 (0.0%) |
| $15,000 to $19,999 | 0 (0.0%) | 1 (14.3%) |
| $20,000 to $24,999 | 6 (23.1%) | 2 (28.6%) |
| $25,000 to $34,999 | 1 (3.8%) | 0 (0.0%) |
| $35,000 to $49,999 | 3 (11.5%) | 3 (42.9%) |
| $50,000 to $74,999 | 1 (3.8%) | 0 (0.0%) |
| $75,000 to $99,999 | 3 (11.5%) | 0 (0.0%) |
| $100,000 to $149,999 | 9 (34.6%) | 0 (0.0%) |
| $150,000 or more | 2 (7.7%) | 0 (0.0%) |
| Total | 26 (100.0%) | 7 (100.0%) |
Monthly Housing Cost Tiers in Prescott
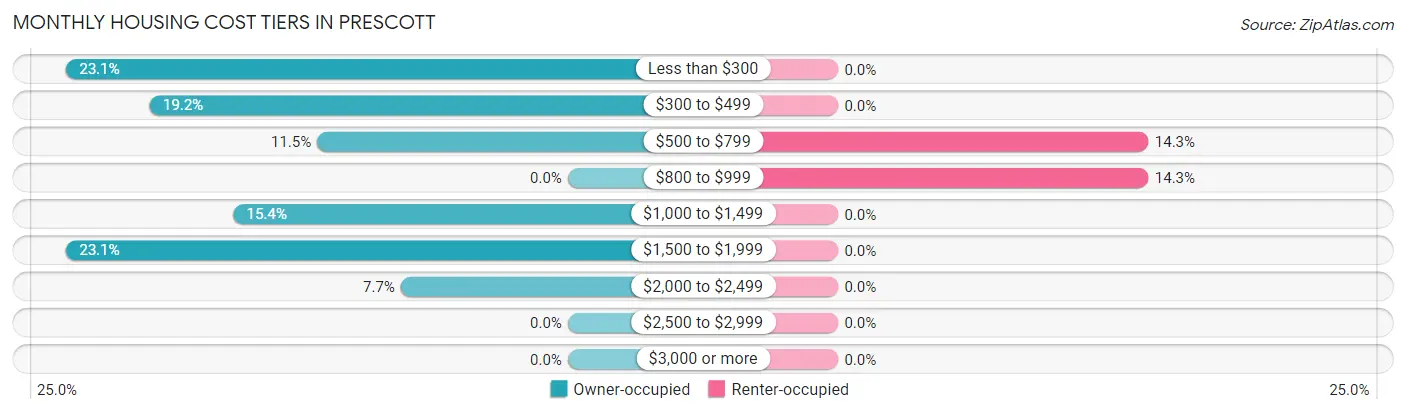
| Monthly Cost | Owner-occupied | Renter-occupied |
| Less than $300 | 6 (23.1%) | 0 (0.0%) |
| $300 to $499 | 5 (19.2%) | 0 (0.0%) |
| $500 to $799 | 3 (11.5%) | 1 (14.3%) |
| $800 to $999 | 0 (0.0%) | 1 (14.3%) |
| $1,000 to $1,499 | 4 (15.4%) | 0 (0.0%) |
| $1,500 to $1,999 | 6 (23.1%) | 0 (0.0%) |
| $2,000 to $2,499 | 2 (7.7%) | 0 (0.0%) |
| $2,500 to $2,999 | 0 (0.0%) | 0 (0.0%) |
| $3,000 or more | 0 (0.0%) | 0 (0.0%) |
| Total | 26 (100.0%) | 7 (100.0%) |
Physical Housing Characteristics in Prescott
Housing Structures in Prescott
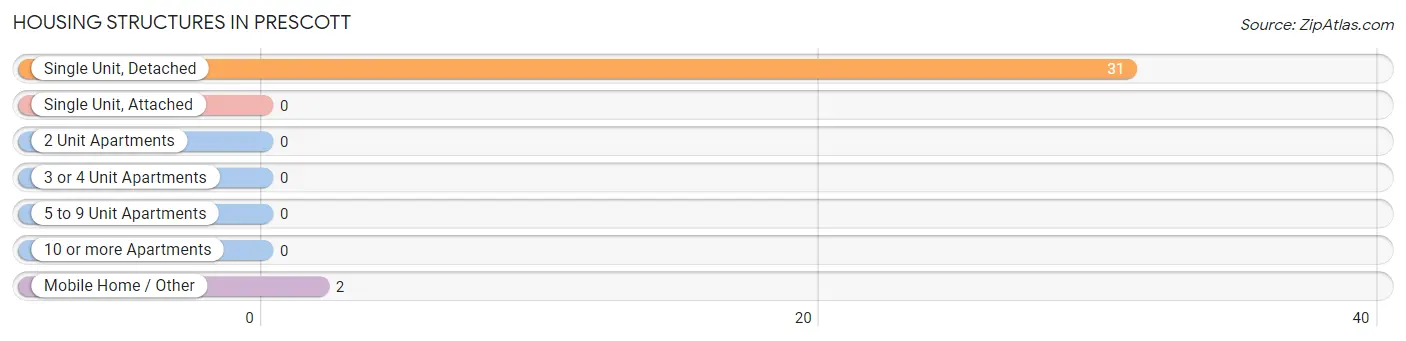
| Structure Type | # Housing Units | % Housing Units |
| Single Unit, Detached | 31 | 93.9% |
| Single Unit, Attached | 0 | 0.0% |
| 2 Unit Apartments | 0 | 0.0% |
| 3 or 4 Unit Apartments | 0 | 0.0% |
| 5 to 9 Unit Apartments | 0 | 0.0% |
| 10 or more Apartments | 0 | 0.0% |
| Mobile Home / Other | 2 | 6.1% |
| Total | 33 | 100.0% |
Housing Structures by Occupancy in Prescott
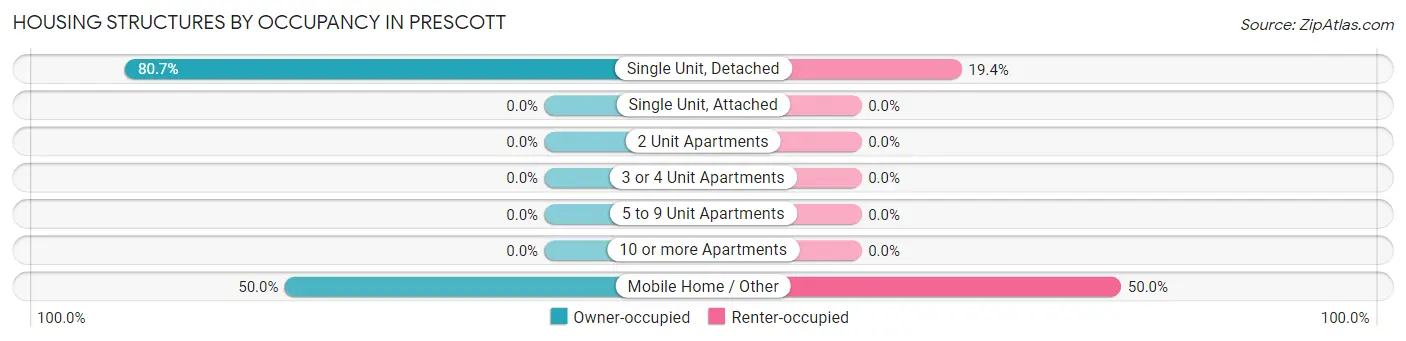
| Structure Type | Owner-occupied | Renter-occupied |
| Single Unit, Detached | 25 (80.6%) | 6 (19.4%) |
| Single Unit, Attached | 0 (0.0%) | 0 (0.0%) |
| 2 Unit Apartments | 0 (0.0%) | 0 (0.0%) |
| 3 or 4 Unit Apartments | 0 (0.0%) | 0 (0.0%) |
| 5 to 9 Unit Apartments | 0 (0.0%) | 0 (0.0%) |
| 10 or more Apartments | 0 (0.0%) | 0 (0.0%) |
| Mobile Home / Other | 1 (50.0%) | 1 (50.0%) |
| Total | 26 (78.8%) | 7 (21.2%) |
Housing Structures by Number of Rooms in Prescott
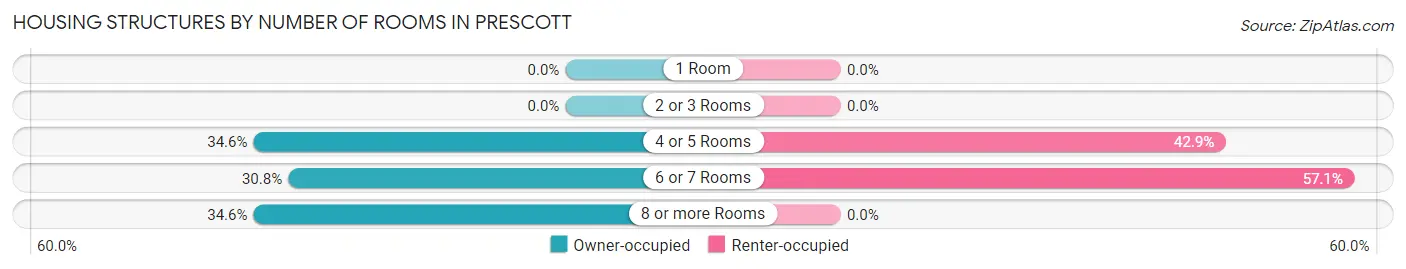
| Number of Rooms | Owner-occupied | Renter-occupied |
| 1 Room | 0 (0.0%) | 0 (0.0%) |
| 2 or 3 Rooms | 0 (0.0%) | 0 (0.0%) |
| 4 or 5 Rooms | 9 (34.6%) | 3 (42.9%) |
| 6 or 7 Rooms | 8 (30.8%) | 4 (57.1%) |
| 8 or more Rooms | 9 (34.6%) | 0 (0.0%) |
| Total | 26 (100.0%) | 7 (100.0%) |
Housing Structure by Heating Type in Prescott
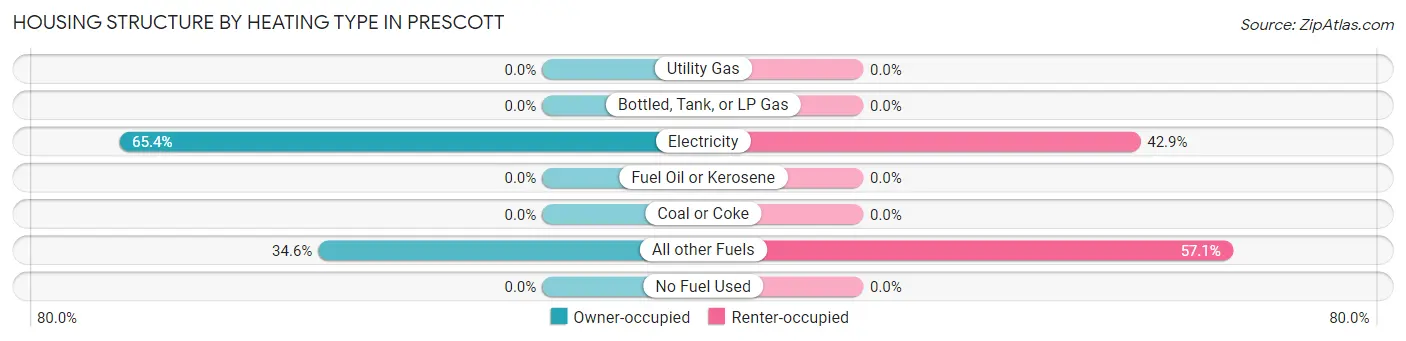
| Heating Type | Owner-occupied | Renter-occupied |
| Utility Gas | 0 (0.0%) | 0 (0.0%) |
| Bottled, Tank, or LP Gas | 0 (0.0%) | 0 (0.0%) |
| Electricity | 17 (65.4%) | 3 (42.9%) |
| Fuel Oil or Kerosene | 0 (0.0%) | 0 (0.0%) |
| Coal or Coke | 0 (0.0%) | 0 (0.0%) |
| All other Fuels | 9 (34.6%) | 4 (57.1%) |
| No Fuel Used | 0 (0.0%) | 0 (0.0%) |
| Total | 26 (100.0%) | 7 (100.0%) |
Household Vehicle Usage in Prescott
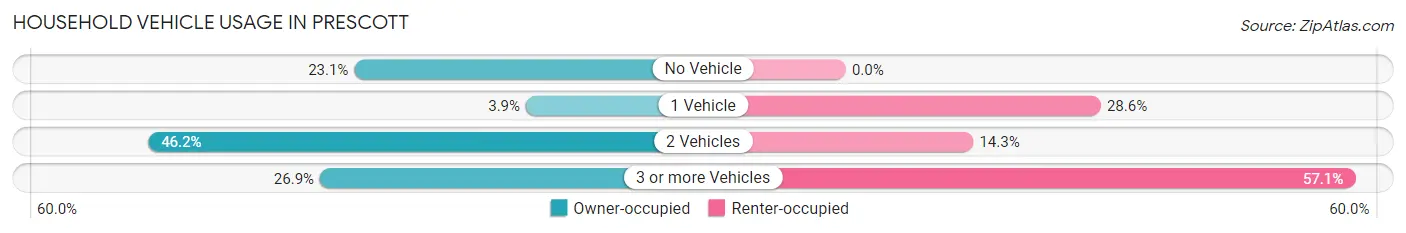
| Vehicles per Household | Owner-occupied | Renter-occupied |
| No Vehicle | 6 (23.1%) | 0 (0.0%) |
| 1 Vehicle | 1 (3.8%) | 2 (28.6%) |
| 2 Vehicles | 12 (46.2%) | 1 (14.3%) |
| 3 or more Vehicles | 7 (26.9%) | 4 (57.1%) |
| Total | 26 (100.0%) | 7 (100.0%) |
Real Estate & Mortgages in Prescott
Real Estate and Mortgage Overview in Prescott
| Characteristic | Without Mortgage | With Mortgage |
| Housing Units | 14 | 12 |
| Median Property Value | $250,000 | $250,000 |
| Median Household Income | - | - |
| Monthly Housing Costs | $375 | $0 |
| Real Estate Taxes | $2,000 | $0 |
Property Value by Mortgage Status in Prescott
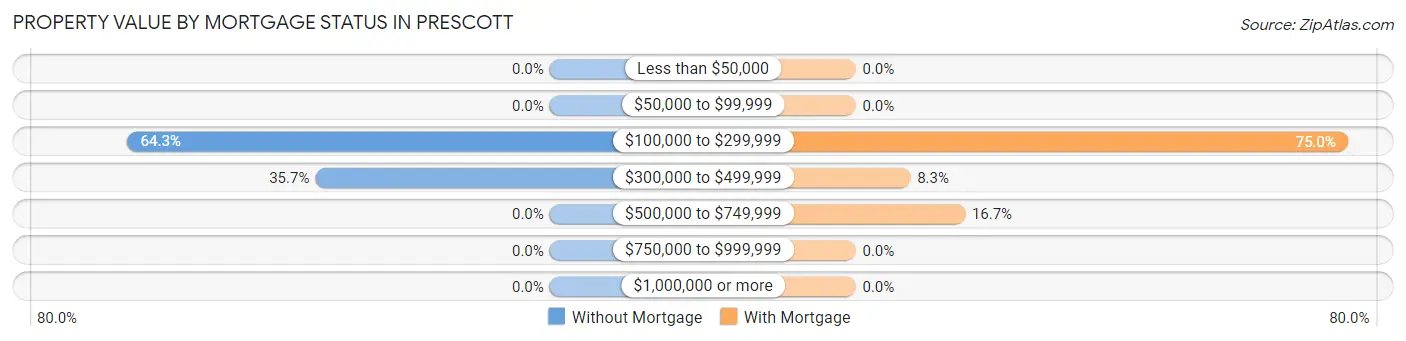
| Property Value | Without Mortgage | With Mortgage |
| Less than $50,000 | 0 (0.0%) | 0 (0.0%) |
| $50,000 to $99,999 | 0 (0.0%) | 0 (0.0%) |
| $100,000 to $299,999 | 9 (64.3%) | 9 (75.0%) |
| $300,000 to $499,999 | 5 (35.7%) | 1 (8.3%) |
| $500,000 to $749,999 | 0 (0.0%) | 2 (16.7%) |
| $750,000 to $999,999 | 0 (0.0%) | 0 (0.0%) |
| $1,000,000 or more | 0 (0.0%) | 0 (0.0%) |
| Total | 14 (100.0%) | 12 (100.0%) |
Household Income by Mortgage Status in Prescott
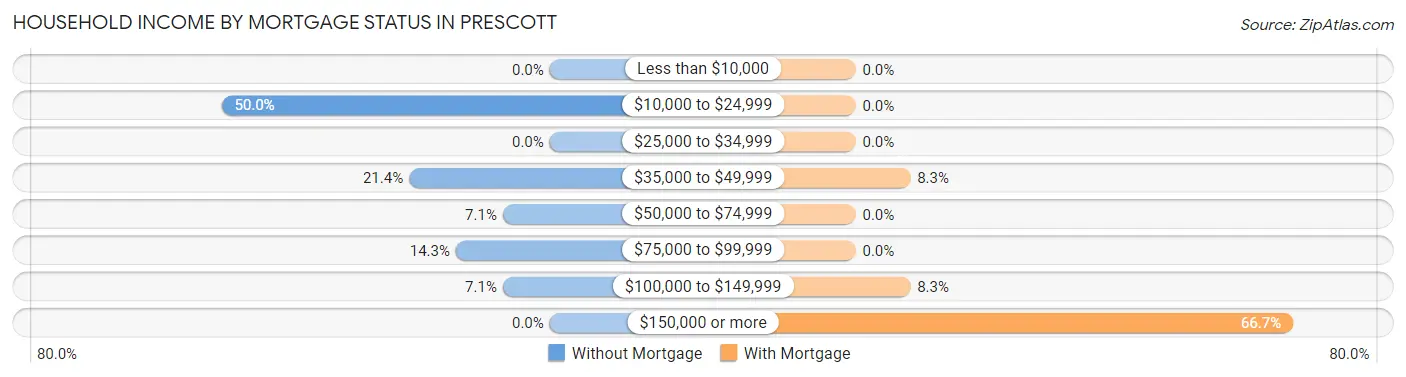
| Household Income | Without Mortgage | With Mortgage |
| Less than $10,000 | 0 (0.0%) | 0 (0.0%) |
| $10,000 to $24,999 | 7 (50.0%) | 0 (0.0%) |
| $25,000 to $34,999 | 0 (0.0%) | 0 (0.0%) |
| $35,000 to $49,999 | 3 (21.4%) | 1 (8.3%) |
| $50,000 to $74,999 | 1 (7.1%) | 0 (0.0%) |
| $75,000 to $99,999 | 2 (14.3%) | 0 (0.0%) |
| $100,000 to $149,999 | 1 (7.1%) | 1 (8.3%) |
| $150,000 or more | 0 (0.0%) | 8 (66.7%) |
| Total | 14 (100.0%) | 12 (100.0%) |
Property Value to Household Income Ratio in Prescott
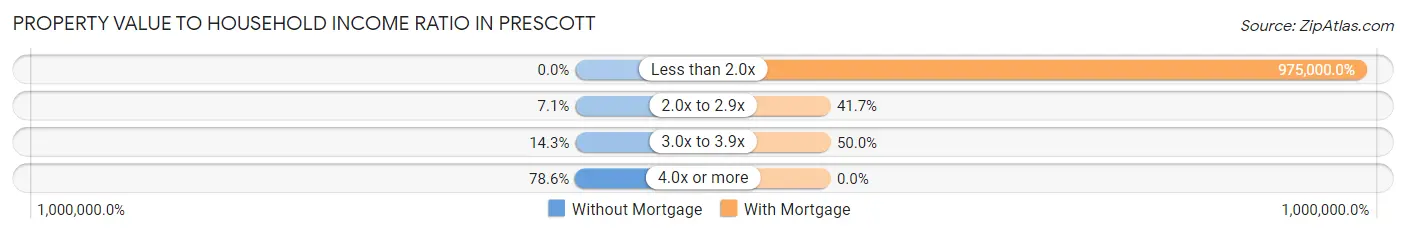
| Value-to-Income Ratio | Without Mortgage | With Mortgage |
| Less than 2.0x | 0 (0.0%) | 117,000 (975,000.0%) |
| 2.0x to 2.9x | 1 (7.1%) | 5 (41.7%) |
| 3.0x to 3.9x | 2 (14.3%) | 6 (50.0%) |
| 4.0x or more | 11 (78.6%) | 0 (0.0%) |
| Total | 14 (100.0%) | 12 (100.0%) |
Real Estate Taxes by Mortgage Status in Prescott
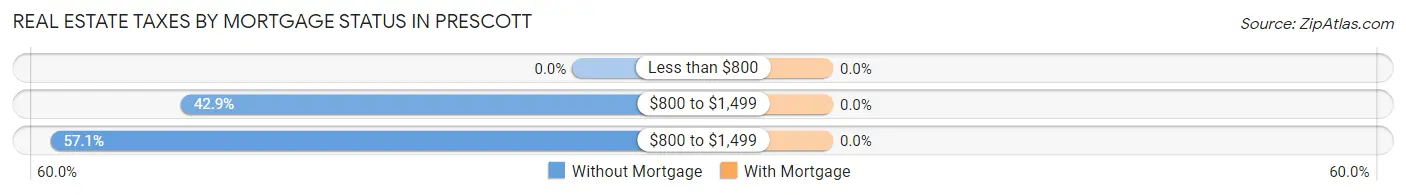
| Property Taxes | Without Mortgage | With Mortgage |
| Less than $800 | 0 (0.0%) | 0 (0.0%) |
| $800 to $1,499 | 6 (42.9%) | 0 (0.0%) |
| $800 to $1,499 | 8 (57.1%) | 0 (0.0%) |
| Total | 14 (100.0%) | 12 (100.0%) |
Health & Disability in Prescott
Health Insurance Coverage by Age in Prescott
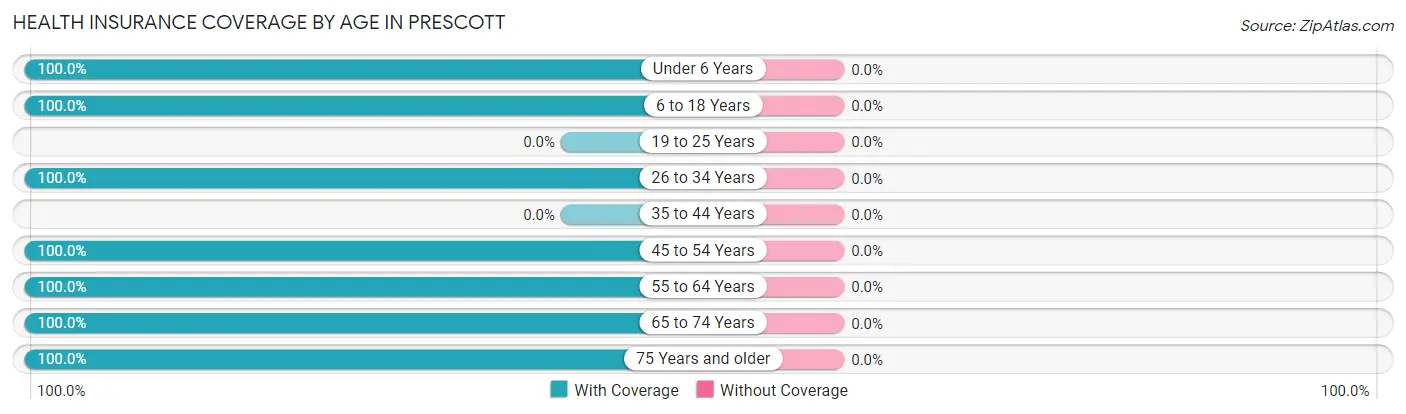
| Age Bracket | With Coverage | Without Coverage |
| Under 6 Years | 1 (100.0%) | 0 (0.0%) |
| 6 to 18 Years | 2 (100.0%) | 0 (0.0%) |
| 19 to 25 Years | 0 (0.0%) | 0 (0.0%) |
| 26 to 34 Years | 4 (100.0%) | 0 (0.0%) |
| 35 to 44 Years | 0 (0.0%) | 0 (0.0%) |
| 45 to 54 Years | 6 (100.0%) | 0 (0.0%) |
| 55 to 64 Years | 21 (100.0%) | 0 (0.0%) |
| 65 to 74 Years | 10 (100.0%) | 0 (0.0%) |
| 75 Years and older | 16 (100.0%) | 0 (0.0%) |
| Total | 60 (100.0%) | 0 (0.0%) |
Health Insurance Coverage by Citizenship Status in Prescott
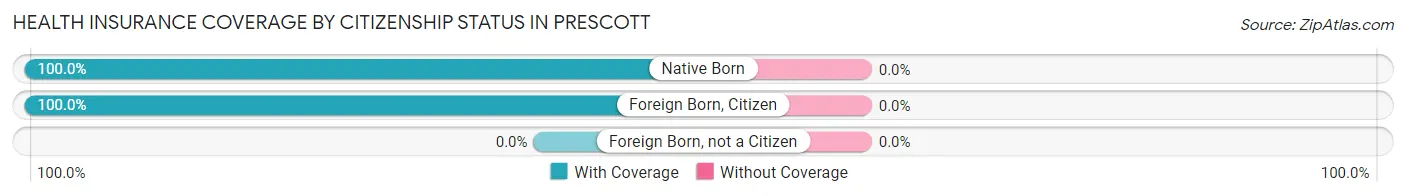
| Citizenship Status | With Coverage | Without Coverage |
| Native Born | 1 (100.0%) | 0 (0.0%) |
| Foreign Born, Citizen | 2 (100.0%) | 0 (0.0%) |
| Foreign Born, not a Citizen | 0 (0.0%) | 0 (0.0%) |
Health Insurance Coverage by Household Income in Prescott
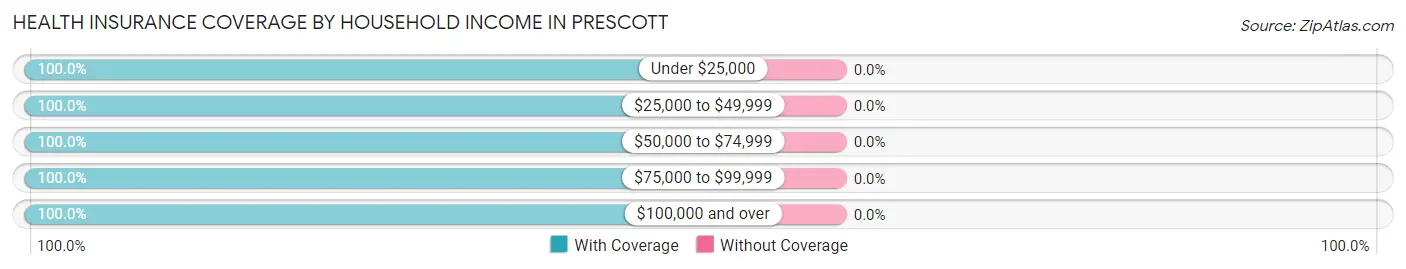
| Household Income | With Coverage | Without Coverage |
| Under $25,000 | 13 (100.0%) | 0 (0.0%) |
| $25,000 to $49,999 | 18 (100.0%) | 0 (0.0%) |
| $50,000 to $74,999 | 1 (100.0%) | 0 (0.0%) |
| $75,000 to $99,999 | 7 (100.0%) | 0 (0.0%) |
| $100,000 and over | 21 (100.0%) | 0 (0.0%) |
Public vs Private Health Insurance Coverage by Age in Prescott
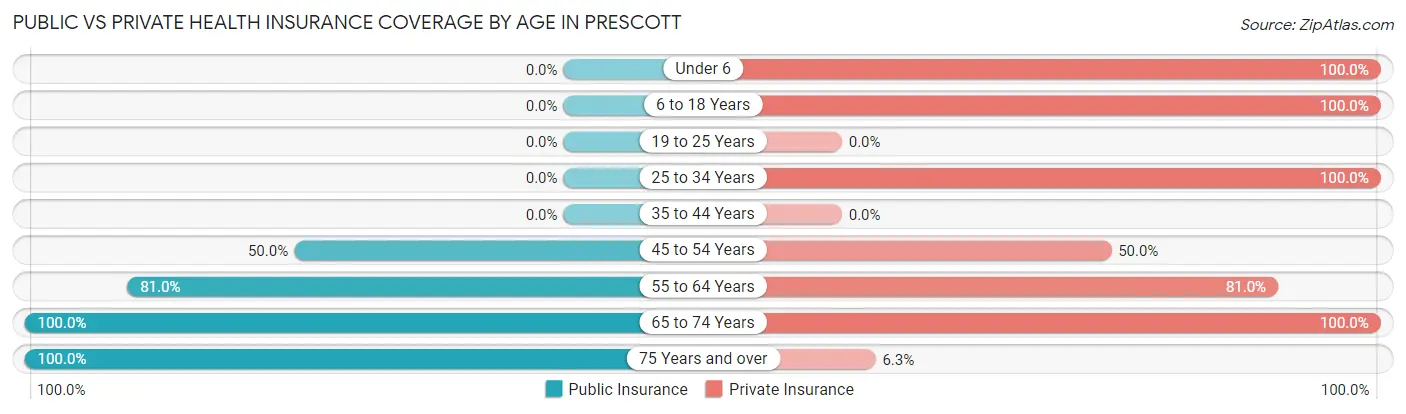
| Age Bracket | Public Insurance | Private Insurance |
| Under 6 | 0 (0.0%) | 1 (100.0%) |
| 6 to 18 Years | 0 (0.0%) | 2 (100.0%) |
| 19 to 25 Years | 0 (0.0%) | 0 (0.0%) |
| 25 to 34 Years | 0 (0.0%) | 4 (100.0%) |
| 35 to 44 Years | 0 (0.0%) | 0 (0.0%) |
| 45 to 54 Years | 3 (50.0%) | 3 (50.0%) |
| 55 to 64 Years | 17 (80.9%) | 17 (80.9%) |
| 65 to 74 Years | 10 (100.0%) | 10 (100.0%) |
| 75 Years and over | 16 (100.0%) | 1 (6.2%) |
| Total | 46 (76.7%) | 38 (63.3%) |
Disability Status by Sex by Age in Prescott
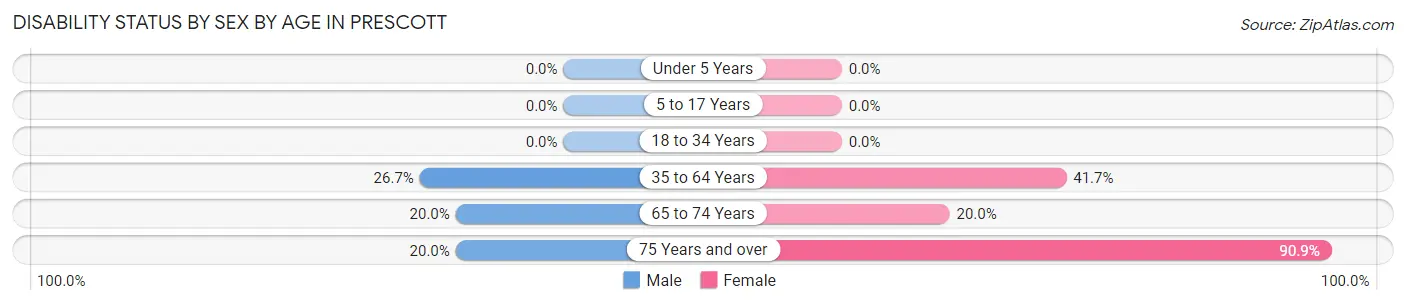
| Age Bracket | Male | Female |
| Under 5 Years | 0 (0.0%) | 0 (0.0%) |
| 5 to 17 Years | 0 (0.0%) | 0 (0.0%) |
| 18 to 34 Years | 0 (0.0%) | 0 (0.0%) |
| 35 to 64 Years | 4 (26.7%) | 5 (41.7%) |
| 65 to 74 Years | 1 (20.0%) | 1 (20.0%) |
| 75 Years and over | 1 (20.0%) | 10 (90.9%) |
Disability Class by Sex by Age in Prescott
Disability Class: Hearing Difficulty
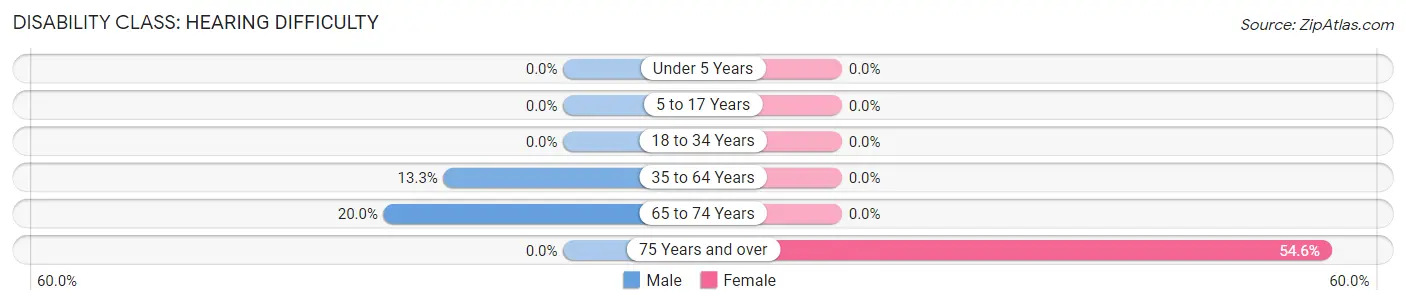
| Age Bracket | Male | Female |
| Under 5 Years | 0 (0.0%) | 0 (0.0%) |
| 5 to 17 Years | 0 (0.0%) | 0 (0.0%) |
| 18 to 34 Years | 0 (0.0%) | 0 (0.0%) |
| 35 to 64 Years | 2 (13.3%) | 0 (0.0%) |
| 65 to 74 Years | 1 (20.0%) | 0 (0.0%) |
| 75 Years and over | 0 (0.0%) | 6 (54.5%) |
Disability Class: Vision Difficulty
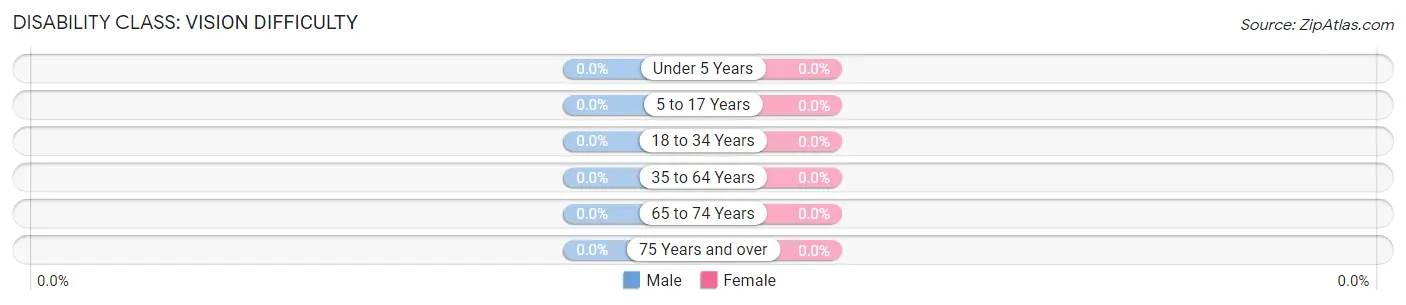
| Age Bracket | Male | Female |
| Under 5 Years | 0 (0.0%) | 0 (0.0%) |
| 5 to 17 Years | 0 (0.0%) | 0 (0.0%) |
| 18 to 34 Years | 0 (0.0%) | 0 (0.0%) |
| 35 to 64 Years | 0 (0.0%) | 0 (0.0%) |
| 65 to 74 Years | 0 (0.0%) | 0 (0.0%) |
| 75 Years and over | 0 (0.0%) | 0 (0.0%) |
Disability Class: Cognitive Difficulty
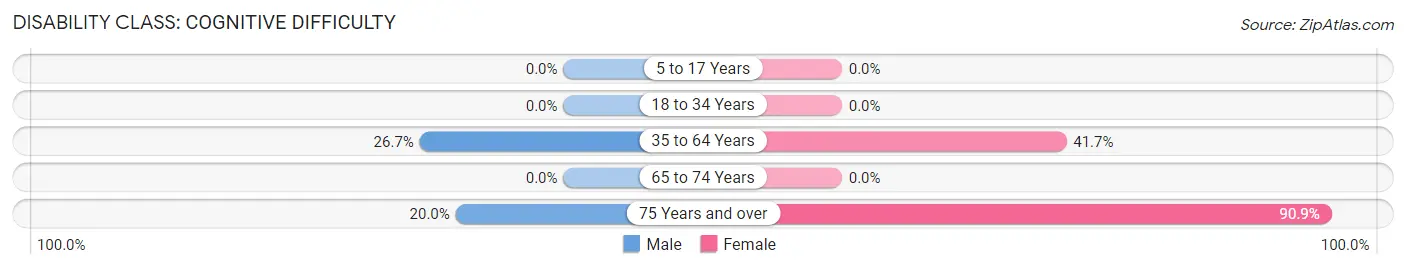
| Age Bracket | Male | Female |
| 5 to 17 Years | 0 (0.0%) | 0 (0.0%) |
| 18 to 34 Years | 0 (0.0%) | 0 (0.0%) |
| 35 to 64 Years | 4 (26.7%) | 5 (41.7%) |
| 65 to 74 Years | 0 (0.0%) | 0 (0.0%) |
| 75 Years and over | 1 (20.0%) | 10 (90.9%) |
Disability Class: Ambulatory Difficulty
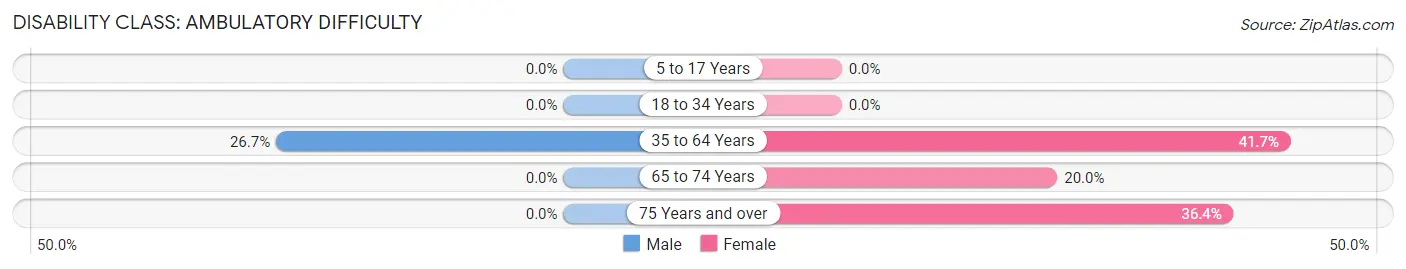
| Age Bracket | Male | Female |
| 5 to 17 Years | 0 (0.0%) | 0 (0.0%) |
| 18 to 34 Years | 0 (0.0%) | 0 (0.0%) |
| 35 to 64 Years | 4 (26.7%) | 5 (41.7%) |
| 65 to 74 Years | 0 (0.0%) | 1 (20.0%) |
| 75 Years and over | 0 (0.0%) | 4 (36.4%) |
Disability Class: Self-Care Difficulty
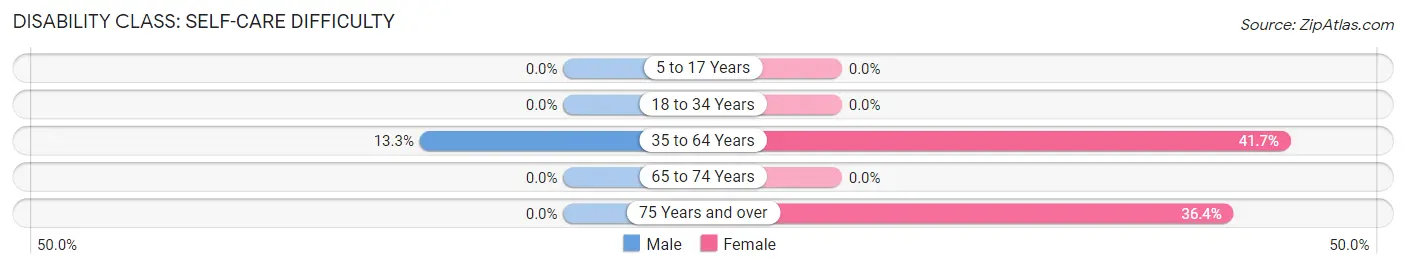
| Age Bracket | Male | Female |
| 5 to 17 Years | 0 (0.0%) | 0 (0.0%) |
| 18 to 34 Years | 0 (0.0%) | 0 (0.0%) |
| 35 to 64 Years | 2 (13.3%) | 5 (41.7%) |
| 65 to 74 Years | 0 (0.0%) | 0 (0.0%) |
| 75 Years and over | 0 (0.0%) | 4 (36.4%) |
Technology Access in Prescott
Computing Device Access in Prescott
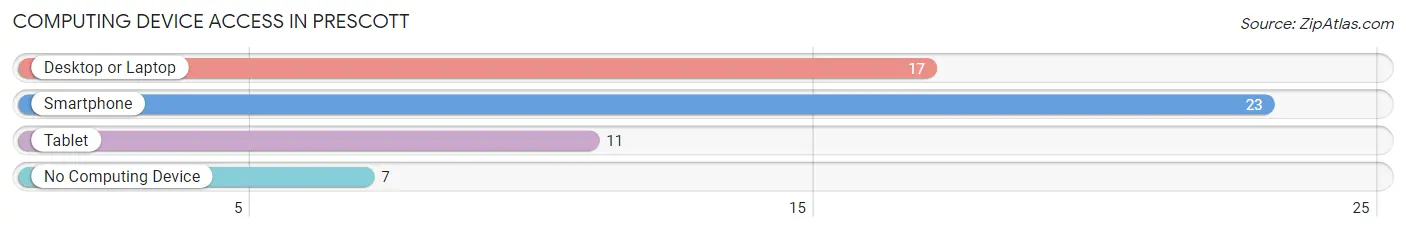
| Device Type | # Households | % Households |
| Desktop or Laptop | 17 | 51.5% |
| Smartphone | 23 | 69.7% |
| Tablet | 11 | 33.3% |
| No Computing Device | 7 | 21.2% |
| Total | 33 | 100.0% |
Internet Access in Prescott
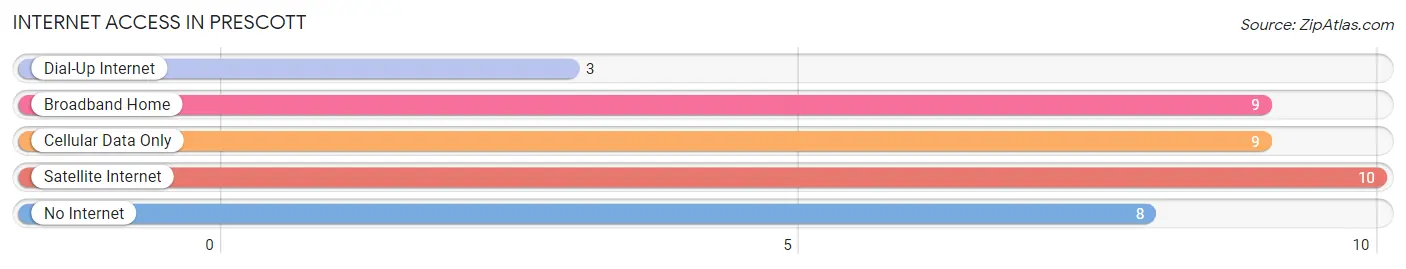
| Internet Type | # Households | % Households |
| Dial-Up Internet | 3 | 9.1% |
| Broadband Home | 9 | 27.3% |
| Cellular Data Only | 9 | 27.3% |
| Satellite Internet | 10 | 30.3% |
| No Internet | 8 | 24.2% |
| Total | 33 | 100.0% |
Prescott Summary
Prescott, Oregon is a small town located in the Umpqua Valley of Douglas County. It is situated on the banks of the Umpqua River, about 20 miles east of Roseburg. The town was founded in 1851 and has a population of about 1,000 people.
Geography
Prescott is located in the Umpqua Valley, which is a wide, flat valley surrounded by mountains. The Umpqua River runs through the valley, and the town is situated on the banks of the river. The town is surrounded by forests and is close to the Umpqua National Forest. The climate in Prescott is mild, with warm summers and cool winters.
Economy
The economy of Prescott is largely based on agriculture and timber. The town is home to several farms, and the surrounding area is known for its production of apples, pears, and other fruits and vegetables. The timber industry is also important to the local economy, and the town is home to several sawmills and lumber companies. In addition, Prescott is home to several small businesses, including restaurants, shops, and other services.
Demographics
As of the 2010 census, Prescott had a population of 1,000 people. The racial makeup of the town was 94.2% White, 0.7% African American, 0.7% Native American, 0.7% Asian, 0.3% Pacific Islander, and 2.7% from other races. The median household income was $37,500, and the median age was 44.
History
Prescott was founded in 1851 by settlers from the Oregon Trail. The town was named after William Prescott, a prominent early settler. The town quickly grew, and by the late 19th century, it was a thriving agricultural and timber center. In the early 20th century, the town was home to several sawmills and lumber companies.
In the 1950s, the town began to decline as the timber industry moved away. However, in the late 20th century, the town began to experience a resurgence. The town is now home to several small businesses, and the local economy is largely based on agriculture and timber.
Prescott is a small town with a rich history and a bright future. The town is home to a diverse population, and the local economy is largely based on agriculture and timber. The town is surrounded by forests and is close to the Umpqua National Forest. Prescott is a great place to live, work, and play.
Common Questions
What is Per Capita Income in Prescott?
Per Capita income in Prescott is $35,752.
What is the Median Family Income in Prescott?
Median Family Income in Prescott is $115,250.
What is Inequality or Gini Index in Prescott?
Inequality or Gini Index in Prescott is 0.43.
What is the Total Population of Prescott?
Total Population of Prescott is 60.
What is the Total Male Population of Prescott?
Total Male Population of Prescott is 28.
What is the Total Female Population of Prescott?
Total Female Population of Prescott is 32.
What is the Ratio of Males per 100 Females in Prescott?
There are 87.50 Males per 100 Females in Prescott.
What is the Ratio of Females per 100 Males in Prescott?
There are 114.29 Females per 100 Males in Prescott.
What is the Median Population Age in Prescott?
Median Population Age in Prescott is 63.4 Years.
What is the Average Family Size in Prescott
Average Family Size in Prescott is 2.1 People.
What is the Average Household Size in Prescott
Average Household Size in Prescott is 1.8 People.
How Large is the Labor Force in Prescott?
There are 14 People in the Labor Forcein in Prescott.
What is the Percentage of People in the Labor Force in Prescott?
23.7% of People are in the Labor Force in Prescott.