Zip Codes with the Highest Percentage of Population Employed in Computer & Mathematics in Beaverton, OR
RELATED REPORTS & OPTIONS
Computer & Mathematics
Beaverton
Compare Zip Codes
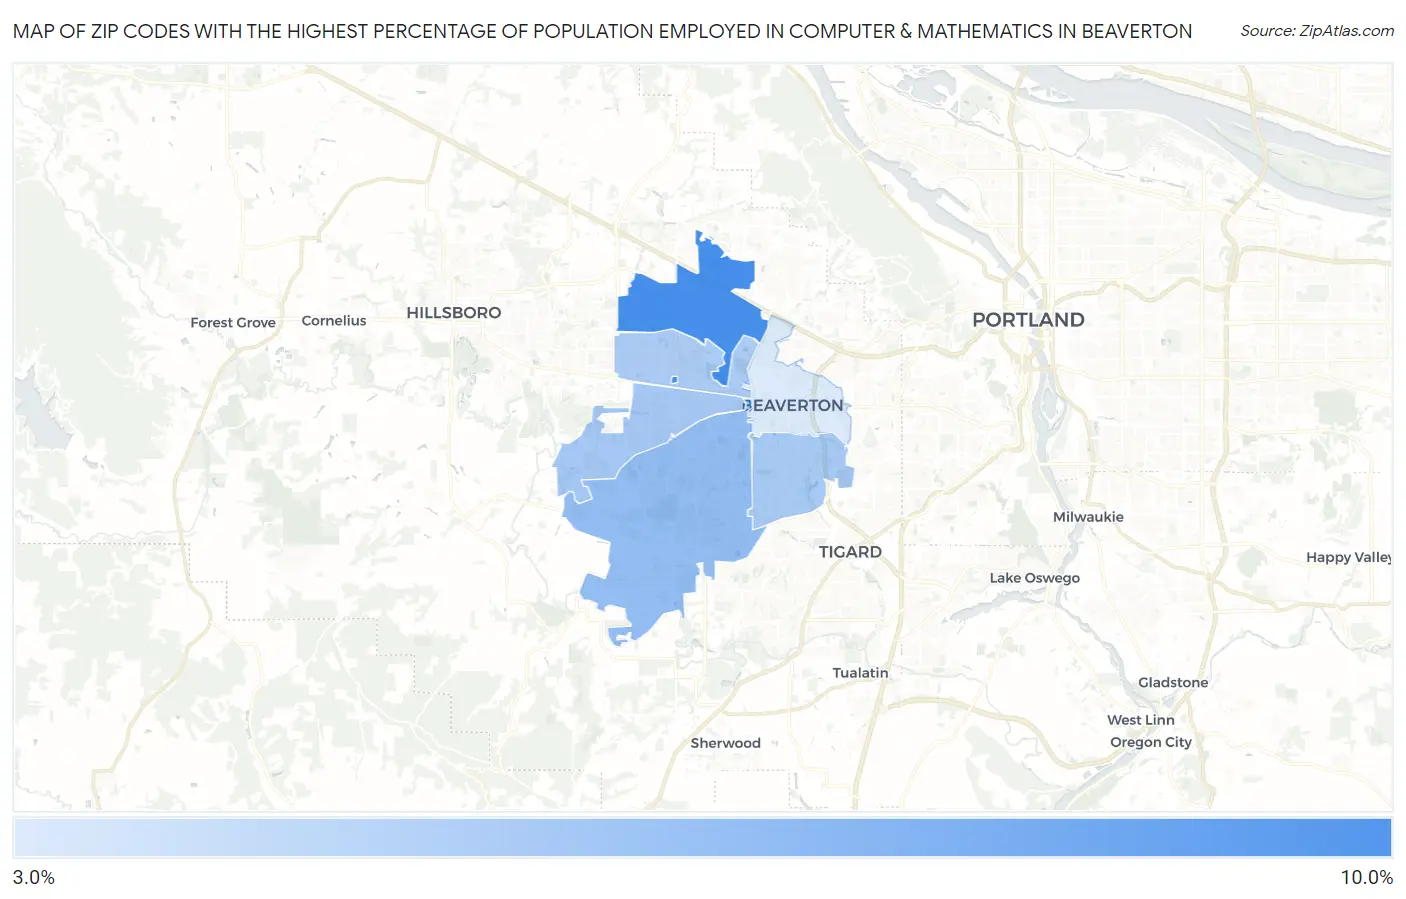
Map of Zip Codes with the Highest Percentage of Population Employed in Computer & Mathematics in Beaverton
3.7%
9.6%
Zip Codes with the Highest Percentage of Population Employed in Computer & Mathematics in Beaverton, OR
| Zip Code | % Employed | vs State | vs National | |
| 1. | 97006 | 9.6% | 3.5%(+6.11)#11 | 3.5%(+6.03)#783 |
| 2. | 97007 | 6.5% | 3.5%(+3.09)#22 | 3.5%(+3.02)#1,899 |
| 3. | 97078 | 5.8% | 3.5%(+2.38)#26 | 3.5%(+2.31)#2,474 |
| 4. | 97008 | 5.7% | 3.5%(+2.29)#28 | 3.5%(+2.22)#2,545 |
| 5. | 97003 | 5.6% | 3.5%(+2.11)#31 | 3.5%(+2.04)#2,715 |
| 6. | 97005 | 3.7% | 3.5%(+0.281)#77 | 3.5%(+0.211)#5,630 |
1
Common Questions
What are the Top 5 Zip Codes with the Highest Percentage of Population Employed in Computer & Mathematics in Beaverton, OR?
Top 5 Zip Codes with the Highest Percentage of Population Employed in Computer & Mathematics in Beaverton, OR are:
What zip code has the Highest Percentage of Population Employed in Computer & Mathematics in Beaverton, OR?
97006 has the Highest Percentage of Population Employed in Computer & Mathematics in Beaverton, OR with 9.6%.
What is the Percentage of Population Employed in Computer & Mathematics in Beaverton, OR?
Percentage of Population Employed in Computer & Mathematics in Beaverton is 6.9%.
What is the Percentage of Population Employed in Computer & Mathematics in Oregon?
Percentage of Population Employed in Computer & Mathematics in Oregon is 3.5%.
What is the Percentage of Population Employed in Computer & Mathematics in the United States?
Percentage of Population Employed in Computer & Mathematics in the United States is 3.5%.