Zip Codes with the Highest Percentage of Population Employed in Computer & Mathematics in Oregon
RELATED REPORTS & OPTIONS
Computer & Mathematics
Oregon
Compare Zip Codes
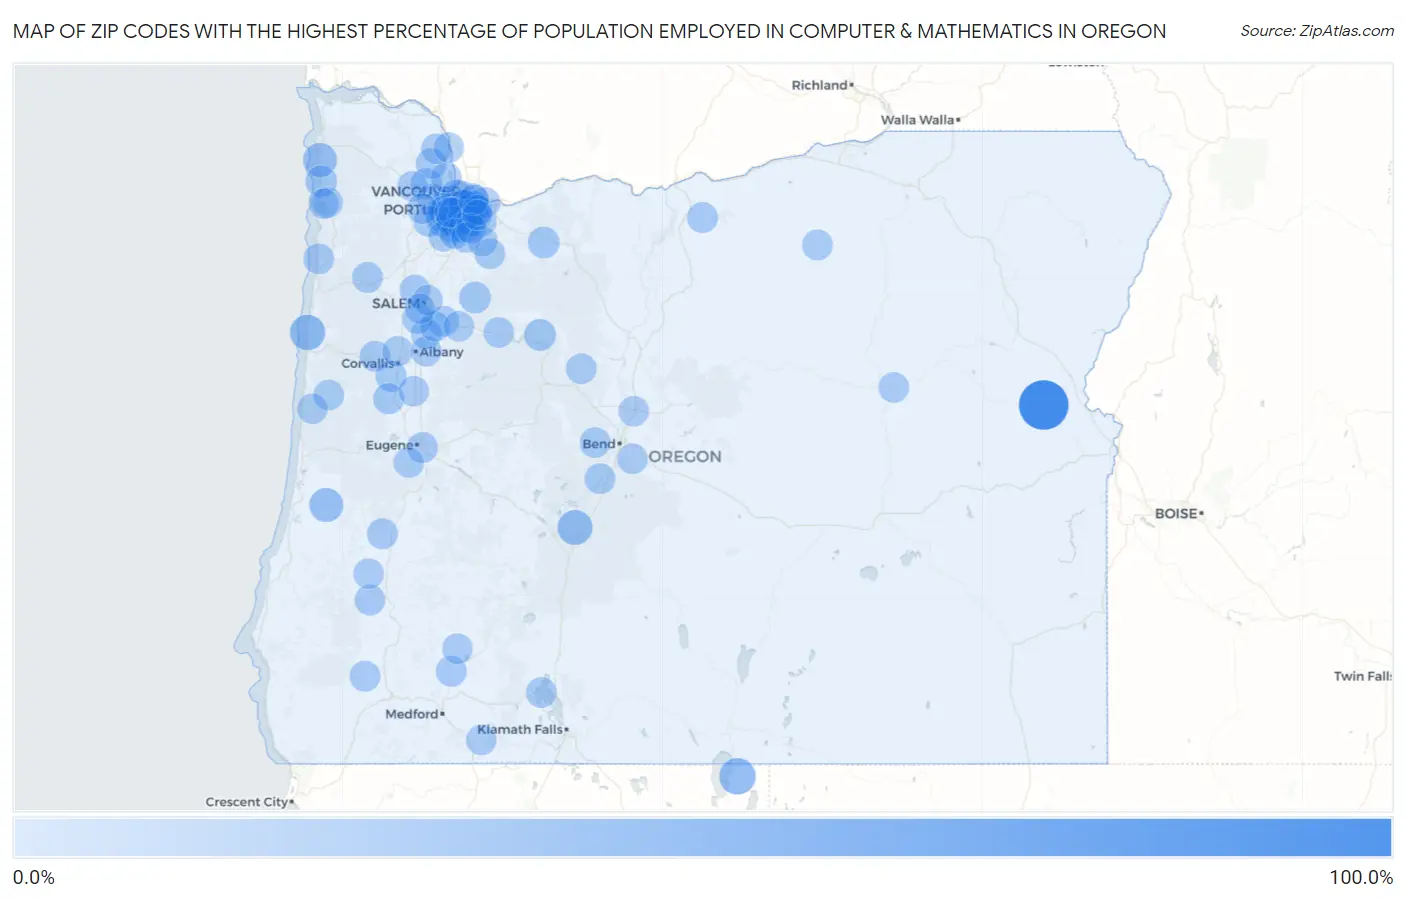
Map of Zip Codes with the Highest Percentage of Population Employed in Computer & Mathematics in Oregon
0.0%
100.0%
Zip Codes with the Highest Percentage of Population Employed in Computer & Mathematics in Oregon
| Zip Code | % Employed | vs State | vs National | |
| 1. | 97903 | 100.0% | 3.5%(+96.5)#1 | 3.5%(+96.5)#3 |
| 2. | 97635 | 33.0% | 3.5%(+29.5)#2 | 3.5%(+29.5)#38 |
| 3. | 97369 | 27.8% | 3.5%(+24.3)#3 | 3.5%(+24.3)#62 |
| 4. | 97737 | 25.7% | 3.5%(+22.2)#4 | 3.5%(+22.2)#72 |
| 5. | 97473 | 20.8% | 3.5%(+17.3)#5 | 3.5%(+17.2)#119 |
| 6. | 97102 | 20.5% | 3.5%(+17.0)#6 | 3.5%(+17.0)#124 |
| 7. | 97205 | 12.9% | 3.5%(+9.42)#7 | 3.5%(+9.34)#371 |
| 8. | 97229 | 10.0% | 3.5%(+6.57)#8 | 3.5%(+6.50)#706 |
| 9. | 97342 | 10.0% | 3.5%(+6.55)#9 | 3.5%(+6.48)#712 |
| 10. | 97067 | 9.6% | 3.5%(+6.13)#10 | 3.5%(+6.06)#779 |
| 11. | 97006 | 9.6% | 3.5%(+6.11)#11 | 3.5%(+6.03)#783 |
| 12. | 97375 | 9.5% | 3.5%(+6.09)#12 | 3.5%(+6.02)#788 |
| 13. | 97130 | 9.5% | 3.5%(+6.00)#13 | 3.5%(+5.93)#809 |
| 14. | 97035 | 8.7% | 3.5%(+5.25)#14 | 3.5%(+5.18)#986 |
| 15. | 97215 | 8.6% | 3.5%(+5.17)#15 | 3.5%(+5.10)#1,016 |
| 16. | 97209 | 8.6% | 3.5%(+5.10)#16 | 3.5%(+5.03)#1,034 |
| 17. | 97133 | 7.6% | 3.5%(+4.17)#17 | 3.5%(+4.10)#1,345 |
| 18. | 97232 | 7.3% | 3.5%(+3.87)#18 | 3.5%(+3.80)#1,451 |
| 19. | 97221 | 7.1% | 3.5%(+3.65)#19 | 3.5%(+3.58)#1,566 |
| 20. | 97333 | 6.7% | 3.5%(+3.22)#20 | 3.5%(+3.15)#1,811 |
| 21. | 97214 | 6.6% | 3.5%(+3.14)#21 | 3.5%(+3.07)#1,861 |
| 22. | 97007 | 6.5% | 3.5%(+3.09)#22 | 3.5%(+3.02)#1,899 |
| 23. | 97456 | 6.3% | 3.5%(+2.88)#23 | 3.5%(+2.81)#2,052 |
| 24. | 97224 | 6.2% | 3.5%(+2.72)#24 | 3.5%(+2.65)#2,163 |
| 25. | 97539 | 5.9% | 3.5%(+2.47)#25 | 3.5%(+2.40)#2,384 |
| 26. | 97078 | 5.8% | 3.5%(+2.38)#26 | 3.5%(+2.31)#2,474 |
| 27. | 97212 | 5.8% | 3.5%(+2.37)#27 | 3.5%(+2.30)#2,482 |
| 28. | 97008 | 5.7% | 3.5%(+2.29)#28 | 3.5%(+2.22)#2,545 |
| 29. | 97462 | 5.6% | 3.5%(+2.15)#29 | 3.5%(+2.08)#2,676 |
| 30. | 97124 | 5.6% | 3.5%(+2.13)#30 | 3.5%(+2.06)#2,694 |
| 31. | 97003 | 5.6% | 3.5%(+2.11)#31 | 3.5%(+2.04)#2,715 |
| 32. | 97123 | 5.5% | 3.5%(+2.05)#32 | 3.5%(+1.98)#2,784 |
| 33. | 97217 | 5.5% | 3.5%(+2.00)#33 | 3.5%(+1.93)#2,838 |
| 34. | 97239 | 5.5% | 3.5%(+2.00)#34 | 3.5%(+1.93)#2,842 |
| 35. | 97211 | 5.4% | 3.5%(+1.98)#35 | 3.5%(+1.91)#2,854 |
| 36. | 97370 | 5.4% | 3.5%(+1.97)#36 | 3.5%(+1.90)#2,874 |
| 37. | 97201 | 5.3% | 3.5%(+1.83)#37 | 3.5%(+1.76)#3,026 |
| 38. | 97396 | 5.2% | 3.5%(+1.75)#38 | 3.5%(+1.68)#3,120 |
| 39. | 97403 | 5.2% | 3.5%(+1.75)#39 | 3.5%(+1.68)#3,122 |
| 40. | 97056 | 5.2% | 3.5%(+1.74)#40 | 3.5%(+1.67)#3,135 |
| 41. | 97210 | 5.0% | 3.5%(+1.51)#41 | 3.5%(+1.44)#3,397 |
| 42. | 97107 | 4.9% | 3.5%(+1.49)#42 | 3.5%(+1.42)#3,432 |
| 43. | 97039 | 4.9% | 3.5%(+1.46)#43 | 3.5%(+1.39)#3,486 |
| 44. | 97203 | 4.8% | 3.5%(+1.39)#44 | 3.5%(+1.32)#3,570 |
| 45. | 97707 | 4.8% | 3.5%(+1.31)#45 | 3.5%(+1.24)#3,690 |
| 46. | 97532 | 4.8% | 3.5%(+1.31)#46 | 3.5%(+1.24)#3,694 |
| 47. | 97223 | 4.7% | 3.5%(+1.27)#47 | 3.5%(+1.20)#3,753 |
| 48. | 97836 | 4.6% | 3.5%(+1.12)#48 | 3.5%(+1.05)#3,980 |
| 49. | 97219 | 4.5% | 3.5%(+1.08)#49 | 3.5%(+1.01)#4,030 |
| 50. | 97135 | 4.5% | 3.5%(+1.04)#50 | 3.5%(+0.966)#4,092 |
| 51. | 97206 | 4.5% | 3.5%(+1.02)#51 | 3.5%(+0.945)#4,132 |
| 52. | 97213 | 4.4% | 3.5%(+0.989)#52 | 3.5%(+0.919)#4,194 |
| 53. | 97086 | 4.4% | 3.5%(+0.981)#53 | 3.5%(+0.910)#4,213 |
| 54. | 97140 | 4.4% | 3.5%(+0.945)#54 | 3.5%(+0.875)#4,270 |
| 55. | 97325 | 4.4% | 3.5%(+0.924)#55 | 3.5%(+0.854)#4,301 |
| 56. | 97352 | 4.3% | 3.5%(+0.882)#56 | 3.5%(+0.812)#4,369 |
| 57. | 97390 | 4.3% | 3.5%(+0.856)#57 | 3.5%(+0.786)#4,417 |
| 58. | 97496 | 4.3% | 3.5%(+0.852)#58 | 3.5%(+0.781)#4,422 |
| 59. | 97202 | 4.3% | 3.5%(+0.848)#59 | 3.5%(+0.777)#4,428 |
| 60. | 97304 | 4.3% | 3.5%(+0.830)#60 | 3.5%(+0.760)#4,461 |
| 61. | 97230 | 4.3% | 3.5%(+0.804)#61 | 3.5%(+0.733)#4,499 |
| 62. | 97227 | 4.2% | 3.5%(+0.794)#62 | 3.5%(+0.723)#4,522 |
| 63. | 97306 | 4.2% | 3.5%(+0.776)#63 | 3.5%(+0.706)#4,559 |
| 64. | 97225 | 4.0% | 3.5%(+0.572)#64 | 3.5%(+0.502)#4,979 |
| 65. | 97348 | 4.0% | 3.5%(+0.567)#65 | 3.5%(+0.496)#4,991 |
| 66. | 97601 | 4.0% | 3.5%(+0.558)#66 | 3.5%(+0.487)#5,012 |
| 67. | 97703 | 4.0% | 3.5%(+0.546)#67 | 3.5%(+0.475)#5,051 |
| 68. | 97034 | 4.0% | 3.5%(+0.534)#68 | 3.5%(+0.464)#5,070 |
| 69. | 97222 | 3.9% | 3.5%(+0.470)#69 | 3.5%(+0.400)#5,202 |
| 70. | 97106 | 3.9% | 3.5%(+0.465)#70 | 3.5%(+0.394)#5,214 |
| 71. | 97730 | 3.9% | 3.5%(+0.442)#71 | 3.5%(+0.372)#5,260 |
| 72. | 97330 | 3.8% | 3.5%(+0.383)#72 | 3.5%(+0.313)#5,384 |
| 73. | 97322 | 3.8% | 3.5%(+0.339)#73 | 3.5%(+0.269)#5,500 |
| 74. | 97113 | 3.8% | 3.5%(+0.319)#74 | 3.5%(+0.249)#5,554 |
| 75. | 97062 | 3.8% | 3.5%(+0.301)#75 | 3.5%(+0.231)#5,582 |
| 76. | 97231 | 3.8% | 3.5%(+0.298)#76 | 3.5%(+0.228)#5,589 |
| 77. | 97005 | 3.7% | 3.5%(+0.281)#77 | 3.5%(+0.211)#5,630 |
| 78. | 97498 | 3.7% | 3.5%(+0.278)#78 | 3.5%(+0.208)#5,637 |
| 79. | 97216 | 3.7% | 3.5%(+0.266)#79 | 3.5%(+0.195)#5,668 |
| 80. | 97346 | 3.7% | 3.5%(+0.260)#80 | 3.5%(+0.190)#5,687 |
| 81. | 97541 | 3.7% | 3.5%(+0.214)#81 | 3.5%(+0.143)#5,804 |
| 82. | 97392 | 3.7% | 3.5%(+0.198)#82 | 3.5%(+0.127)#5,832 |
| 83. | 97702 | 3.6% | 3.5%(+0.182)#83 | 3.5%(+0.111)#5,879 |
| 84. | 97301 | 3.6% | 3.5%(+0.168)#84 | 3.5%(+0.098)#5,915 |
| 85. | 97756 | 3.5% | 3.5%(+0.089)#85 | 3.5%(+0.019)#6,086 |
| 86. | 97004 | 3.5% | 3.5%(+0.076)#86 | 3.5%(+0.005)#6,133 |
| 87. | 97218 | 3.5% | 3.5%(+0.061)#87 | 3.5%(-0.010)#6,169 |
| 88. | 97068 | 3.5% | 3.5%(-0.004)#88 | 3.5%(-0.074)#6,342 |
| 89. | 97405 | 3.4% | 3.5%(-0.010)#89 | 3.5%(-0.081)#6,363 |
| 90. | 97383 | 3.4% | 3.5%(-0.050)#90 | 3.5%(-0.121)#6,474 |
| 91. | 97118 | 3.4% | 3.5%(-0.087)#91 | 3.5%(-0.158)#6,578 |
| 92. | 97267 | 3.4% | 3.5%(-0.103)#92 | 3.5%(-0.174)#6,621 |
| 93. | 97845 | 3.3% | 3.5%(-0.128)#93 | 3.5%(-0.198)#6,697 |
| 94. | 97051 | 3.3% | 3.5%(-0.139)#94 | 3.5%(-0.210)#6,730 |
| 95. | 97471 | 3.3% | 3.5%(-0.141)#95 | 3.5%(-0.211)#6,738 |
| 96. | 97520 | 3.2% | 3.5%(-0.241)#96 | 3.5%(-0.312)#7,061 |
| 97. | 97045 | 3.2% | 3.5%(-0.264)#97 | 3.5%(-0.335)#7,127 |
| 98. | 97302 | 3.2% | 3.5%(-0.265)#98 | 3.5%(-0.335)#7,128 |
| 99. | 97018 | 3.2% | 3.5%(-0.273)#99 | 3.5%(-0.344)#7,154 |
| 100. | 97266 | 3.2% | 3.5%(-0.278)#100 | 3.5%(-0.348)#7,171 |
Common Questions
What are the Top 10 Zip Codes with the Highest Percentage of Population Employed in Computer & Mathematics in Oregon?
Top 10 Zip Codes with the Highest Percentage of Population Employed in Computer & Mathematics in Oregon are:
What zip code has the Highest Percentage of Population Employed in Computer & Mathematics in Oregon?
97903 has the Highest Percentage of Population Employed in Computer & Mathematics in Oregon with 100.0%.
What is the Percentage of Population Employed in Computer & Mathematics in the State of Oregon?
Percentage of Population Employed in Computer & Mathematics in Oregon is 3.5%.
What is the Percentage of Population Employed in Computer & Mathematics in the United States?
Percentage of Population Employed in Computer & Mathematics in the United States is 3.5%.