Zip Codes with the Highest Percentage of Population Employed in Computer & Mathematics in Grants Pass, OR
RELATED REPORTS & OPTIONS
Computer & Mathematics
Grants Pass
Compare Zip Codes
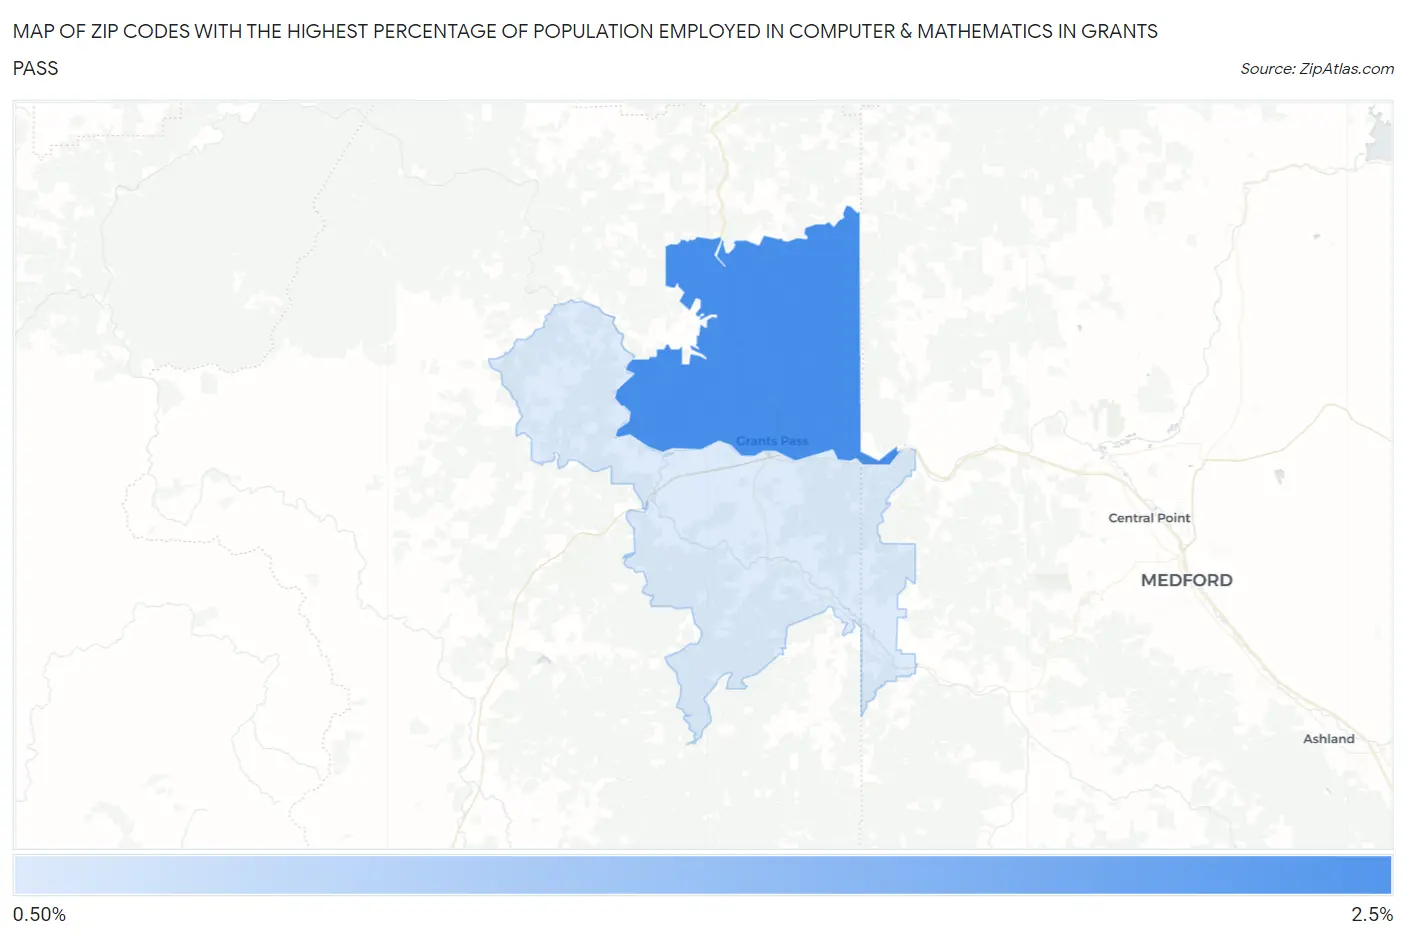
Map of Zip Codes with the Highest Percentage of Population Employed in Computer & Mathematics in Grants Pass
0.79%
2.2%
Zip Codes with the Highest Percentage of Population Employed in Computer & Mathematics in Grants Pass, OR
| Zip Code | % Employed | vs State | vs National | |
| 1. | 97526 | 2.2% | 3.5%(-1.25)#146 | 3.5%(-1.32)#10,862 |
| 2. | 97527 | 0.79% | 3.5%(-2.67)#231 | 3.5%(-2.74)#18,694 |
1
Common Questions
What are the Top Zip Codes with the Highest Percentage of Population Employed in Computer & Mathematics in Grants Pass, OR?
Top Zip Codes with the Highest Percentage of Population Employed in Computer & Mathematics in Grants Pass, OR are:
What zip code has the Highest Percentage of Population Employed in Computer & Mathematics in Grants Pass, OR?
97526 has the Highest Percentage of Population Employed in Computer & Mathematics in Grants Pass, OR with 2.2%.
What is the Percentage of Population Employed in Computer & Mathematics in Grants Pass, OR?
Percentage of Population Employed in Computer & Mathematics in Grants Pass is 1.5%.
What is the Percentage of Population Employed in Computer & Mathematics in Oregon?
Percentage of Population Employed in Computer & Mathematics in Oregon is 3.5%.
What is the Percentage of Population Employed in Computer & Mathematics in the United States?
Percentage of Population Employed in Computer & Mathematics in the United States is 3.5%.