Zip Codes with the Highest Percentage of Population Employed in Architecture & Engineering in Oregon
RELATED REPORTS & OPTIONS
Architecture & Engineering
Oregon
Compare Zip Codes
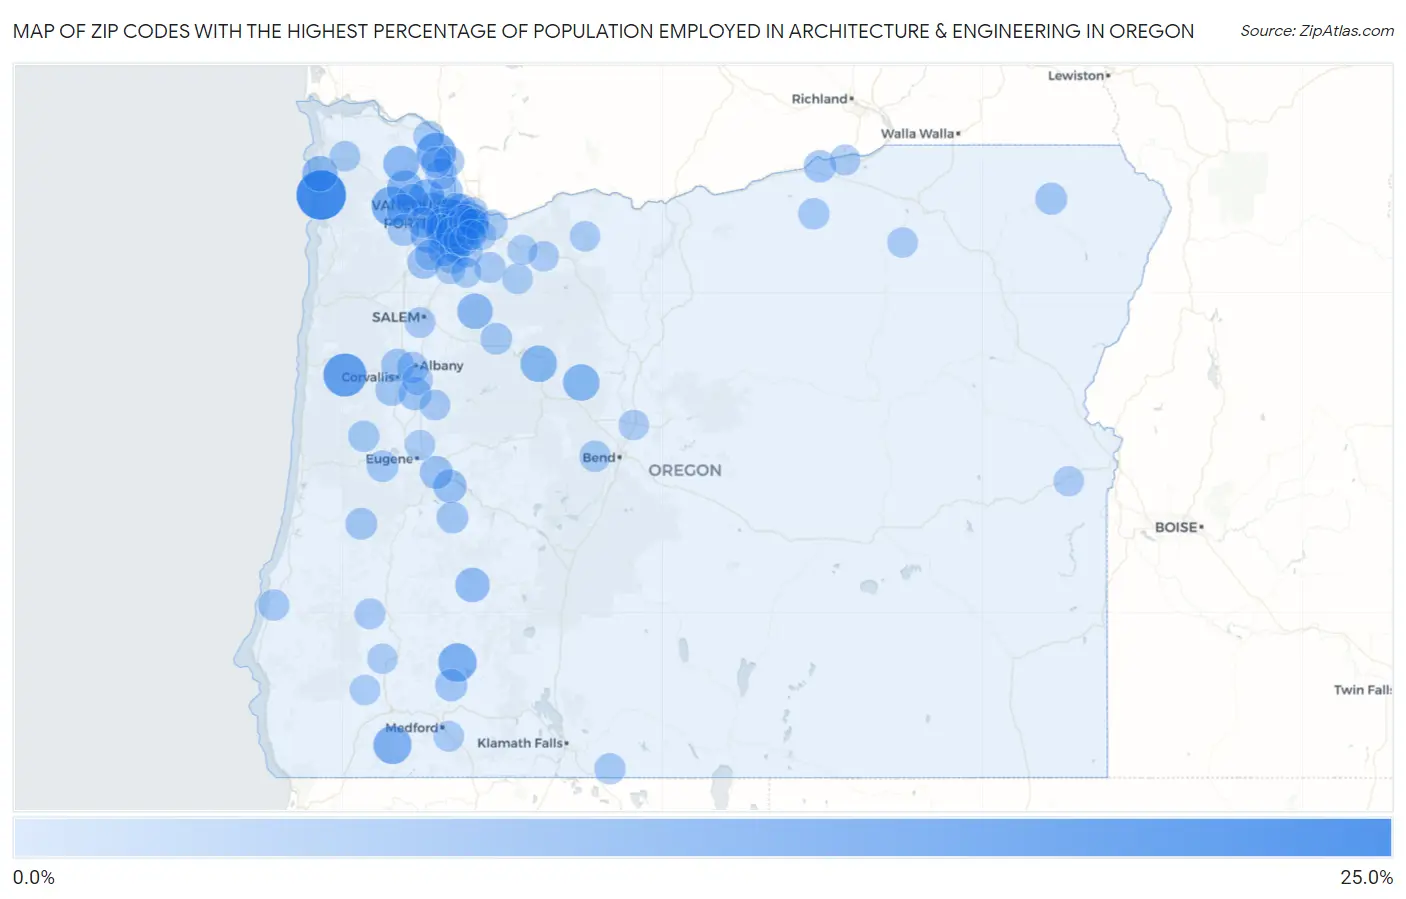
Map of Zip Codes with the Highest Percentage of Population Employed in Architecture & Engineering in Oregon
0.0%
25.0%
Zip Codes with the Highest Percentage of Population Employed in Architecture & Engineering in Oregon
| Zip Code | % Employed | vs State | vs National | |
| 1. | 97130 | 23.9% | 2.8%(+21.1)#1 | 2.1%(+21.7)#71 |
| 2. | 97343 | 16.6% | 2.8%(+13.8)#2 | 2.1%(+14.4)#129 |
| 3. | 97124 | 12.7% | 2.8%(+9.92)#3 | 2.1%(+10.6)#210 |
| 4. | 97054 | 12.6% | 2.8%(+9.76)#4 | 2.1%(+10.4)#216 |
| 5. | 97117 | 12.2% | 2.8%(+9.40)#5 | 2.1%(+10.1)#228 |
| 6. | 97541 | 11.2% | 2.8%(+8.38)#6 | 2.1%(+9.05)#279 |
| 7. | 97544 | 11.0% | 2.8%(+8.15)#7 | 2.1%(+8.82)#288 |
| 8. | 97229 | 10.7% | 2.8%(+7.84)#8 | 2.1%(+8.51)#301 |
| 9. | 97109 | 9.1% | 2.8%(+6.31)#9 | 2.1%(+6.97)#401 |
| 10. | 97730 | 9.1% | 2.8%(+6.28)#10 | 2.1%(+6.94)#405 |
| 11. | 97350 | 9.1% | 2.8%(+6.28)#11 | 2.1%(+6.94)#409 |
| 12. | 97133 | 8.7% | 2.8%(+5.92)#12 | 2.1%(+6.59)#454 |
| 13. | 97064 | 8.4% | 2.8%(+5.58)#13 | 2.1%(+6.24)#503 |
| 14. | 97123 | 8.2% | 2.8%(+5.40)#14 | 2.1%(+6.06)#536 |
| 15. | 97102 | 8.1% | 2.8%(+5.28)#15 | 2.1%(+5.95)#554 |
| 16. | 97375 | 8.0% | 2.8%(+5.19)#16 | 2.1%(+5.86)#572 |
| 17. | 97006 | 7.5% | 2.8%(+4.73)#17 | 2.1%(+5.40)#648 |
| 18. | 97003 | 7.1% | 2.8%(+4.31)#18 | 2.1%(+4.97)#723 |
| 19. | 97447 | 6.9% | 2.8%(+4.12)#19 | 2.1%(+4.79)#766 |
| 20. | 97201 | 6.4% | 2.8%(+3.55)#20 | 2.1%(+4.21)#936 |
| 21. | 97210 | 6.3% | 2.8%(+3.52)#21 | 2.1%(+4.19)#947 |
| 22. | 97212 | 6.1% | 2.8%(+3.29)#22 | 2.1%(+3.96)#1,039 |
| 23. | 97431 | 5.6% | 2.8%(+2.82)#23 | 2.1%(+3.48)#1,259 |
| 24. | 97455 | 5.5% | 2.8%(+2.65)#24 | 2.1%(+3.32)#1,348 |
| 25. | 97231 | 5.4% | 2.8%(+2.58)#25 | 2.1%(+3.24)#1,391 |
| 26. | 97224 | 5.4% | 2.8%(+2.57)#26 | 2.1%(+3.24)#1,396 |
| 27. | 97007 | 5.4% | 2.8%(+2.57)#27 | 2.1%(+3.23)#1,402 |
| 28. | 97377 | 5.3% | 2.8%(+2.45)#28 | 2.1%(+3.11)#1,473 |
| 29. | 97070 | 5.1% | 2.8%(+2.27)#29 | 2.1%(+2.94)#1,605 |
| 30. | 97068 | 4.9% | 2.8%(+2.05)#30 | 2.1%(+2.71)#1,774 |
| 31. | 97115 | 4.8% | 2.8%(+1.99)#31 | 2.1%(+2.66)#1,826 |
| 32. | 97225 | 4.8% | 2.8%(+1.98)#32 | 2.1%(+2.64)#1,841 |
| 33. | 97330 | 4.7% | 2.8%(+1.94)#33 | 2.1%(+2.60)#1,881 |
| 34. | 97223 | 4.7% | 2.8%(+1.90)#34 | 2.1%(+2.56)#1,921 |
| 35. | 97106 | 4.6% | 2.8%(+1.82)#35 | 2.1%(+2.49)#1,991 |
| 36. | 97539 | 4.6% | 2.8%(+1.75)#36 | 2.1%(+2.41)#2,056 |
| 37. | 97844 | 4.5% | 2.8%(+1.69)#37 | 2.1%(+2.36)#2,113 |
| 38. | 97219 | 4.5% | 2.8%(+1.66)#38 | 2.1%(+2.33)#2,159 |
| 39. | 97005 | 4.5% | 2.8%(+1.64)#39 | 2.1%(+2.31)#2,186 |
| 40. | 97217 | 4.4% | 2.8%(+1.62)#40 | 2.1%(+2.29)#2,212 |
| 41. | 97116 | 4.4% | 2.8%(+1.57)#41 | 2.1%(+2.24)#2,278 |
| 42. | 97140 | 4.4% | 2.8%(+1.55)#42 | 2.1%(+2.21)#2,305 |
| 43. | 97221 | 4.2% | 2.8%(+1.39)#43 | 2.1%(+2.06)#2,481 |
| 44. | 97119 | 4.2% | 2.8%(+1.34)#44 | 2.1%(+2.01)#2,542 |
| 45. | 97885 | 4.1% | 2.8%(+1.25)#45 | 2.1%(+1.91)#2,682 |
| 46. | 97203 | 4.1% | 2.8%(+1.24)#46 | 2.1%(+1.91)#2,684 |
| 47. | 97436 | 4.0% | 2.8%(+1.14)#47 | 2.1%(+1.80)#2,843 |
| 48. | 97078 | 3.9% | 2.8%(+1.05)#48 | 2.1%(+1.72)#2,988 |
| 49. | 97333 | 3.9% | 2.8%(+1.04)#49 | 2.1%(+1.71)#2,997 |
| 50. | 97434 | 3.8% | 2.8%(+1.03)#50 | 2.1%(+1.70)#3,012 |
| 51. | 97239 | 3.8% | 2.8%(+0.941)#51 | 2.1%(+1.61)#3,185 |
| 52. | 97062 | 3.8% | 2.8%(+0.941)#52 | 2.1%(+1.61)#3,186 |
| 53. | 97053 | 3.7% | 2.8%(+0.895)#53 | 2.1%(+1.56)#3,268 |
| 54. | 97487 | 3.7% | 2.8%(+0.883)#54 | 2.1%(+1.55)#3,295 |
| 55. | 97358 | 3.7% | 2.8%(+0.880)#55 | 2.1%(+1.55)#3,304 |
| 56. | 97321 | 3.7% | 2.8%(+0.867)#56 | 2.1%(+1.53)#3,339 |
| 57. | 97213 | 3.5% | 2.8%(+0.672)#57 | 2.1%(+1.34)#3,764 |
| 58. | 97206 | 3.5% | 2.8%(+0.650)#58 | 2.1%(+1.31)#3,822 |
| 59. | 97202 | 3.5% | 2.8%(+0.638)#59 | 2.1%(+1.30)#3,847 |
| 60. | 97839 | 3.4% | 2.8%(+0.564)#60 | 2.1%(+1.23)#4,001 |
| 61. | 97411 | 3.4% | 2.8%(+0.557)#61 | 2.1%(+1.22)#4,020 |
| 62. | 97214 | 3.4% | 2.8%(+0.544)#62 | 2.1%(+1.21)#4,050 |
| 63. | 97412 | 3.4% | 2.8%(+0.541)#63 | 2.1%(+1.21)#4,054 |
| 64. | 97703 | 3.3% | 2.8%(+0.532)#64 | 2.1%(+1.20)#4,077 |
| 65. | 97008 | 3.3% | 2.8%(+0.501)#65 | 2.1%(+1.17)#4,163 |
| 66. | 97035 | 3.3% | 2.8%(+0.469)#66 | 2.1%(+1.13)#4,244 |
| 67. | 97632 | 3.2% | 2.8%(+0.350)#67 | 2.1%(+1.02)#4,561 |
| 68. | 97018 | 3.1% | 2.8%(+0.239)#68 | 2.1%(+0.904)#4,875 |
| 69. | 97048 | 3.0% | 2.8%(+0.202)#69 | 2.1%(+0.868)#4,998 |
| 70. | 97211 | 2.9% | 2.8%(+0.078)#70 | 2.1%(+0.743)#5,445 |
| 71. | 97496 | 2.9% | 2.8%(+0.056)#71 | 2.1%(+0.721)#5,524 |
| 72. | 97389 | 2.9% | 2.8%(+0.053)#72 | 2.1%(+0.718)#5,535 |
| 73. | 97004 | 2.9% | 2.8%(+0.038)#73 | 2.1%(+0.704)#5,574 |
| 74. | 97232 | 2.8% | 2.8%(+0.018)#74 | 2.1%(+0.683)#5,652 |
| 75. | 97327 | 2.8% | 2.8%(+0.016)#75 | 2.1%(+0.681)#5,660 |
| 76. | 97882 | 2.8% | 2.8%(+0.013)#76 | 2.1%(+0.678)#5,679 |
| 77. | 97051 | 2.7% | 2.8%(-0.099)#77 | 2.1%(+0.566)#6,097 |
| 78. | 97113 | 2.7% | 2.8%(-0.110)#78 | 2.1%(+0.556)#6,137 |
| 79. | 97302 | 2.7% | 2.8%(-0.120)#79 | 2.1%(+0.545)#6,189 |
| 80. | 97535 | 2.7% | 2.8%(-0.125)#80 | 2.1%(+0.541)#6,204 |
| 81. | 97209 | 2.7% | 2.8%(-0.162)#81 | 2.1%(+0.503)#6,357 |
| 82. | 97132 | 2.6% | 2.8%(-0.188)#82 | 2.1%(+0.477)#6,461 |
| 83. | 97034 | 2.6% | 2.8%(-0.220)#83 | 2.1%(+0.445)#6,595 |
| 84. | 97023 | 2.6% | 2.8%(-0.230)#84 | 2.1%(+0.436)#6,646 |
| 85. | 97138 | 2.6% | 2.8%(-0.257)#85 | 2.1%(+0.408)#6,755 |
| 86. | 97030 | 2.5% | 2.8%(-0.266)#86 | 2.1%(+0.400)#6,791 |
| 87. | 97868 | 2.5% | 2.8%(-0.274)#87 | 2.1%(+0.391)#6,836 |
| 88. | 97086 | 2.5% | 2.8%(-0.309)#88 | 2.1%(+0.356)#6,967 |
| 89. | 97067 | 2.5% | 2.8%(-0.324)#89 | 2.1%(+0.341)#7,036 |
| 90. | 97041 | 2.5% | 2.8%(-0.343)#90 | 2.1%(+0.322)#7,129 |
| 91. | 97002 | 2.5% | 2.8%(-0.358)#91 | 2.1%(+0.307)#7,199 |
| 92. | 97532 | 2.4% | 2.8%(-0.390)#92 | 2.1%(+0.275)#7,356 |
| 93. | 97055 | 2.4% | 2.8%(-0.405)#93 | 2.1%(+0.260)#7,444 |
| 94. | 97013 | 2.4% | 2.8%(-0.407)#94 | 2.1%(+0.258)#7,450 |
| 95. | 97215 | 2.4% | 2.8%(-0.409)#95 | 2.1%(+0.256)#7,460 |
| 96. | 97918 | 2.4% | 2.8%(-0.420)#96 | 2.1%(+0.246)#7,497 |
| 97. | 97442 | 2.4% | 2.8%(-0.426)#97 | 2.1%(+0.239)#7,528 |
| 98. | 97222 | 2.4% | 2.8%(-0.462)#98 | 2.1%(+0.203)#7,707 |
| 99. | 97756 | 2.3% | 2.8%(-0.468)#99 | 2.1%(+0.197)#7,734 |
| 100. | 97408 | 2.3% | 2.8%(-0.491)#100 | 2.1%(+0.174)#7,835 |
Common Questions
What are the Top 10 Zip Codes with the Highest Percentage of Population Employed in Architecture & Engineering in Oregon?
Top 10 Zip Codes with the Highest Percentage of Population Employed in Architecture & Engineering in Oregon are:
What zip code has the Highest Percentage of Population Employed in Architecture & Engineering in Oregon?
97130 has the Highest Percentage of Population Employed in Architecture & Engineering in Oregon with 23.9%.
What is the Percentage of Population Employed in Architecture & Engineering in the State of Oregon?
Percentage of Population Employed in Architecture & Engineering in Oregon is 2.8%.
What is the Percentage of Population Employed in Architecture & Engineering in the United States?
Percentage of Population Employed in Architecture & Engineering in the United States is 2.1%.