Zip Codes with the Highest Percentage of Population Employed in Architecture & Engineering in Portland, OR
RELATED REPORTS & OPTIONS
Architecture & Engineering
Portland
Compare Zip Codes
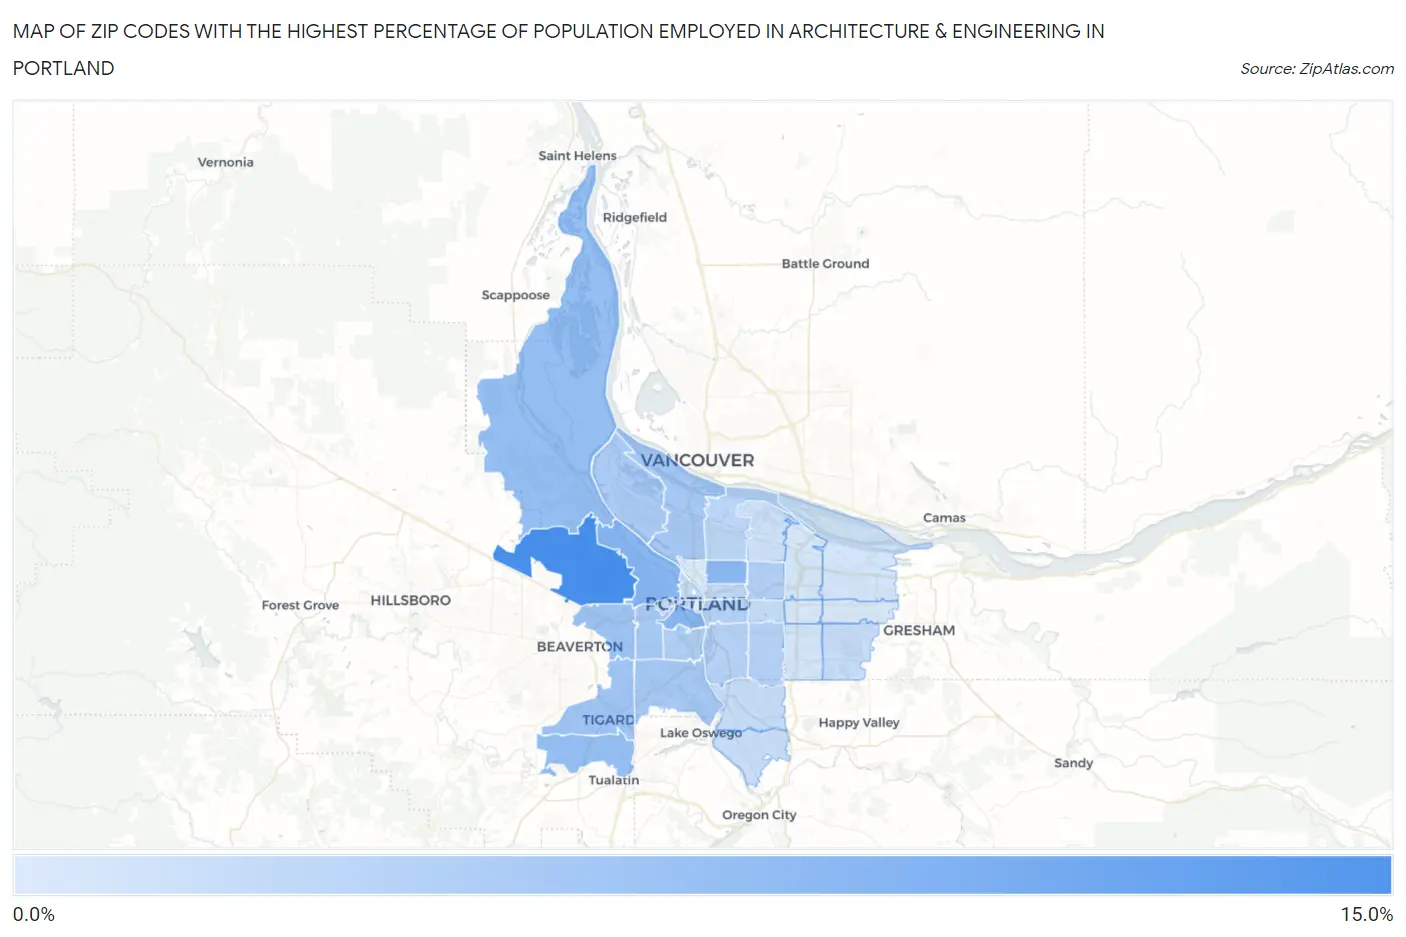
Map of Zip Codes with the Highest Percentage of Population Employed in Architecture & Engineering in Portland
0.93%
10.7%
Zip Codes with the Highest Percentage of Population Employed in Architecture & Engineering in Portland, OR
| Zip Code | % Employed | vs State | vs National | |
| 1. | 97229 | 10.7% | 2.8%(+7.84)#8 | 2.1%(+8.51)#301 |
| 2. | 97201 | 6.4% | 2.8%(+3.55)#20 | 2.1%(+4.21)#936 |
| 3. | 97210 | 6.3% | 2.8%(+3.52)#21 | 2.1%(+4.19)#947 |
| 4. | 97212 | 6.1% | 2.8%(+3.29)#22 | 2.1%(+3.96)#1,039 |
| 5. | 97231 | 5.4% | 2.8%(+2.58)#25 | 2.1%(+3.24)#1,391 |
| 6. | 97224 | 5.4% | 2.8%(+2.57)#26 | 2.1%(+3.24)#1,396 |
| 7. | 97225 | 4.8% | 2.8%(+1.98)#32 | 2.1%(+2.64)#1,841 |
| 8. | 97223 | 4.7% | 2.8%(+1.90)#34 | 2.1%(+2.56)#1,921 |
| 9. | 97219 | 4.5% | 2.8%(+1.66)#38 | 2.1%(+2.33)#2,159 |
| 10. | 97217 | 4.4% | 2.8%(+1.62)#40 | 2.1%(+2.29)#2,212 |
| 11. | 97221 | 4.2% | 2.8%(+1.39)#43 | 2.1%(+2.06)#2,481 |
| 12. | 97203 | 4.1% | 2.8%(+1.24)#46 | 2.1%(+1.91)#2,684 |
| 13. | 97239 | 3.8% | 2.8%(+0.941)#51 | 2.1%(+1.61)#3,185 |
| 14. | 97213 | 3.5% | 2.8%(+0.672)#57 | 2.1%(+1.34)#3,764 |
| 15. | 97206 | 3.5% | 2.8%(+0.650)#58 | 2.1%(+1.31)#3,822 |
| 16. | 97202 | 3.5% | 2.8%(+0.638)#59 | 2.1%(+1.30)#3,847 |
| 17. | 97214 | 3.4% | 2.8%(+0.544)#62 | 2.1%(+1.21)#4,050 |
| 18. | 97211 | 2.9% | 2.8%(+0.078)#70 | 2.1%(+0.743)#5,445 |
| 19. | 97232 | 2.8% | 2.8%(+0.018)#74 | 2.1%(+0.683)#5,652 |
| 20. | 97209 | 2.7% | 2.8%(-0.162)#81 | 2.1%(+0.503)#6,357 |
| 21. | 97215 | 2.4% | 2.8%(-0.409)#95 | 2.1%(+0.256)#7,460 |
| 22. | 97222 | 2.4% | 2.8%(-0.462)#98 | 2.1%(+0.203)#7,707 |
| 23. | 97236 | 2.2% | 2.8%(-0.583)#108 | 2.1%(+0.082)#8,304 |
| 24. | 97267 | 2.2% | 2.8%(-0.600)#110 | 2.1%(+0.065)#8,410 |
| 25. | 97205 | 2.2% | 2.8%(-0.650)#114 | 2.1%(+0.015)#8,682 |
| 26. | 97218 | 1.8% | 2.8%(-1.06)#136 | 2.1%(-0.397)#11,140 |
| 27. | 97230 | 1.6% | 2.8%(-1.24)#158 | 2.1%(-0.575)#12,350 |
| 28. | 97266 | 1.6% | 2.8%(-1.26)#161 | 2.1%(-0.598)#12,494 |
| 29. | 97220 | 1.4% | 2.8%(-1.41)#177 | 2.1%(-0.745)#13,554 |
| 30. | 97216 | 1.2% | 2.8%(-1.60)#189 | 2.1%(-0.937)#14,985 |
| 31. | 97233 | 1.2% | 2.8%(-1.64)#191 | 2.1%(-0.975)#15,292 |
| 32. | 97227 | 0.93% | 2.8%(-1.88)#205 | 2.1%(-1.21)#17,086 |
1
Common Questions
What are the Top 10 Zip Codes with the Highest Percentage of Population Employed in Architecture & Engineering in Portland, OR?
Top 10 Zip Codes with the Highest Percentage of Population Employed in Architecture & Engineering in Portland, OR are:
What zip code has the Highest Percentage of Population Employed in Architecture & Engineering in Portland, OR?
97229 has the Highest Percentage of Population Employed in Architecture & Engineering in Portland, OR with 10.7%.
What is the Percentage of Population Employed in Architecture & Engineering in Portland, OR?
Percentage of Population Employed in Architecture & Engineering in Portland is 3.3%.
What is the Percentage of Population Employed in Architecture & Engineering in Oregon?
Percentage of Population Employed in Architecture & Engineering in Oregon is 2.8%.
What is the Percentage of Population Employed in Architecture & Engineering in the United States?
Percentage of Population Employed in Architecture & Engineering in the United States is 2.1%.