Zip Codes with the Highest Percentage of Population Employed in Architecture & Engineering in Medford, OR
RELATED REPORTS & OPTIONS
Architecture & Engineering
Medford
Compare Zip Codes
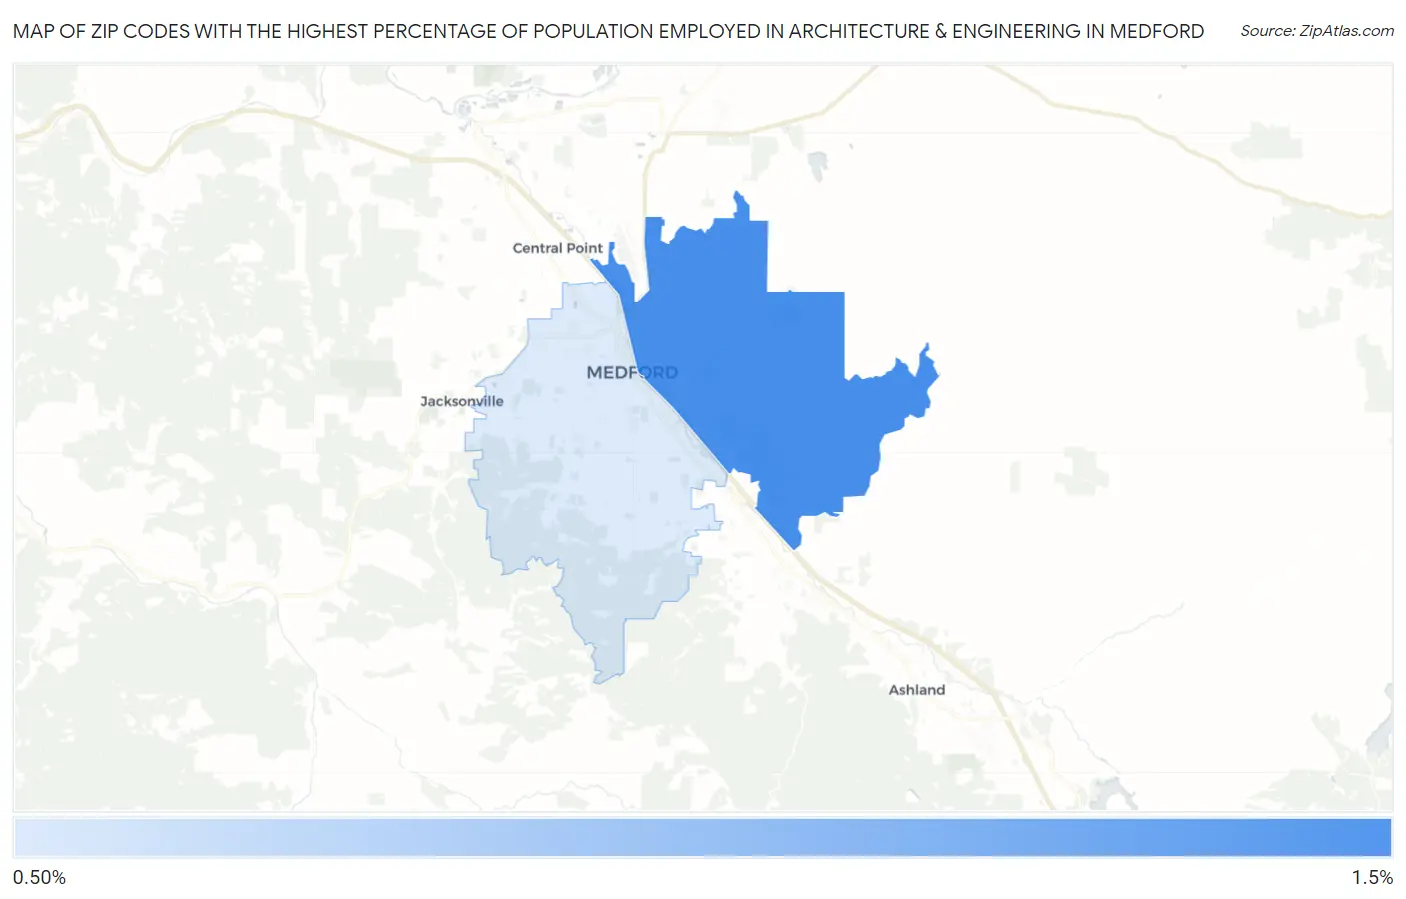
Map of Zip Codes with the Highest Percentage of Population Employed in Architecture & Engineering in Medford
0.99%
1.5%
Zip Codes with the Highest Percentage of Population Employed in Architecture & Engineering in Medford, OR
| Zip Code | % Employed | vs State | vs National | |
| 1. | 97504 | 1.5% | 2.8%(-1.35)#168 | 2.1%(-0.680)#13,100 |
| 2. | 97501 | 0.99% | 2.8%(-1.83)#199 | 2.1%(-1.16)#16,703 |
1
Common Questions
What are the Top Zip Codes with the Highest Percentage of Population Employed in Architecture & Engineering in Medford, OR?
Top Zip Codes with the Highest Percentage of Population Employed in Architecture & Engineering in Medford, OR are:
What zip code has the Highest Percentage of Population Employed in Architecture & Engineering in Medford, OR?
97504 has the Highest Percentage of Population Employed in Architecture & Engineering in Medford, OR with 1.5%.
What is the Percentage of Population Employed in Architecture & Engineering in Medford, OR?
Percentage of Population Employed in Architecture & Engineering in Medford is 1.2%.
What is the Percentage of Population Employed in Architecture & Engineering in Oregon?
Percentage of Population Employed in Architecture & Engineering in Oregon is 2.8%.
What is the Percentage of Population Employed in Architecture & Engineering in the United States?
Percentage of Population Employed in Architecture & Engineering in the United States is 2.1%.