Cedar Hill Lakes, MO Map & Demographics
Cedar Hill Lakes Map
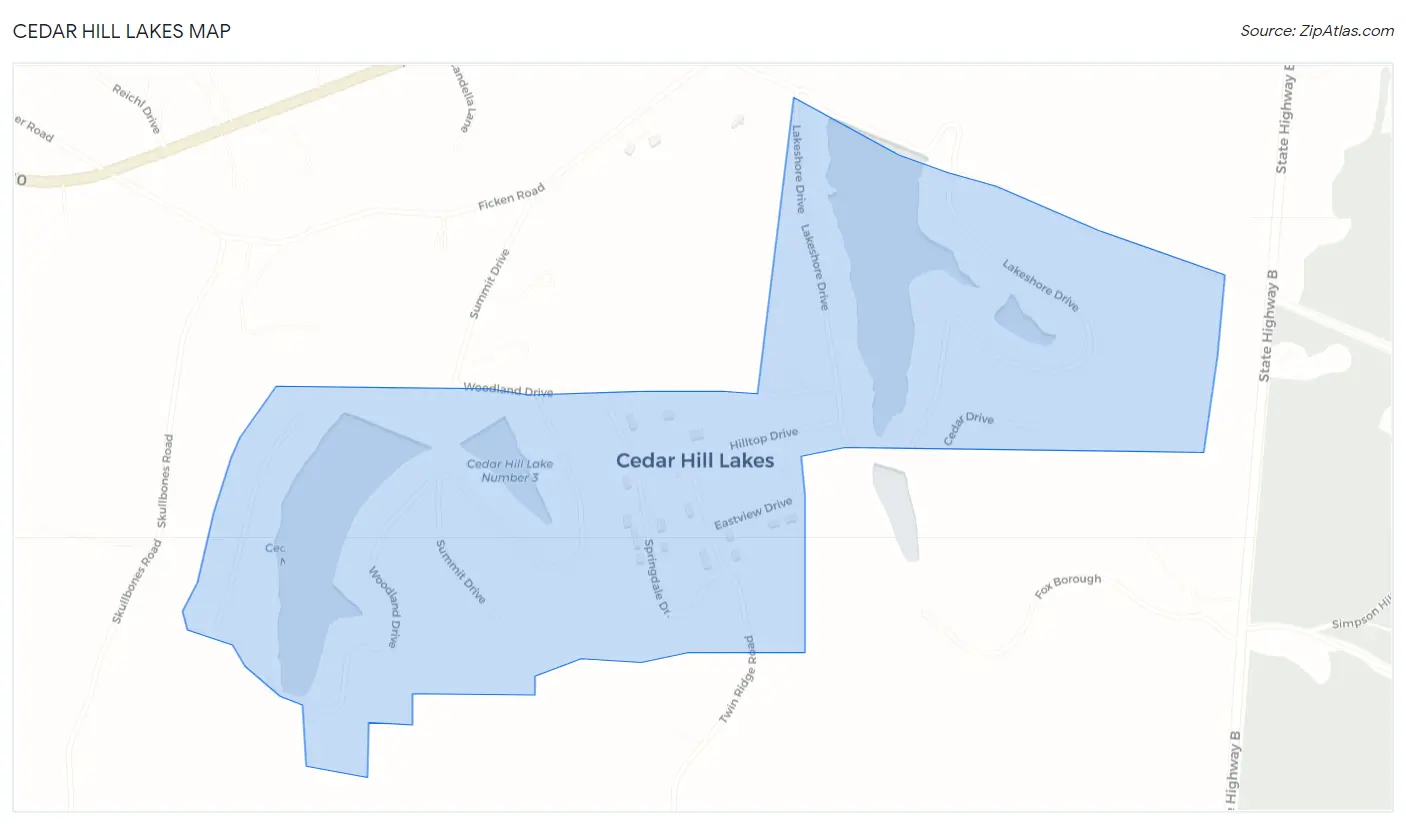
Cedar Hill Lakes Overview
$26,813
PER CAPITA INCOME
$90,625
AVG FAMILY INCOME
$69,063
AVG HOUSEHOLD INCOME
10.3%
WAGE / INCOME GAP [ % ]
89.7¢/ $1
WAGE / INCOME GAP [ $ ]
0.33
INEQUALITY / GINI INDEX
282
TOTAL POPULATION
153
MALE POPULATION
129
FEMALE POPULATION
118.60
MALES / 100 FEMALES
84.31
FEMALES / 100 MALES
40.3
MEDIAN AGE
3.4
AVG FAMILY SIZE
2.8
AVG HOUSEHOLD SIZE
155
LABOR FORCE [ PEOPLE ]
60.1%
PERCENT IN LABOR FORCE
3.9%
UNEMPLOYMENT RATE
Cedar Hill Lakes Area Codes
Income in Cedar Hill Lakes
Income Overview in Cedar Hill Lakes
Per Capita Income in Cedar Hill Lakes is $26,813, while median incomes of families and households are $90,625 and $69,063 respectively.
| Characteristic | Number | Measure |
| Per Capita Income | 282 | $26,813 |
| Median Family Income | 57 | $90,625 |
| Mean Family Income | 57 | $86,940 |
| Median Household Income | 101 | $69,063 |
| Mean Household Income | 101 | $75,176 |
| Income Deficit | 57 | $0 |
| Wage / Income Gap (%) | 282 | 10.31% |
| Wage / Income Gap ($) | 282 | 89.69¢ per $1 |
| Gini / Inequality Index | 282 | 0.33 |
Earnings by Sex in Cedar Hill Lakes
Average Earnings in Cedar Hill Lakes are $32,214, $32,917 for men and $29,524 for women, a difference of 10.3%.
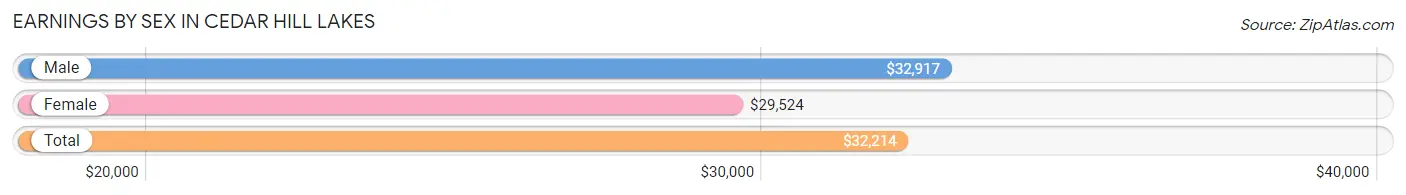
| Sex | Number | Average Earnings |
| Male | 102 (64.6%) | $32,917 |
| Female | 56 (35.4%) | $29,524 |
| Total | 158 (100.0%) | $32,214 |
Earnings by Sex by Income Bracket in Cedar Hill Lakes
The most common earnings brackets in Cedar Hill Lakes are $30,000 to $34,999 for men (40 | 39.2%) and $25,000 to $29,999 for women (25 | 44.6%).
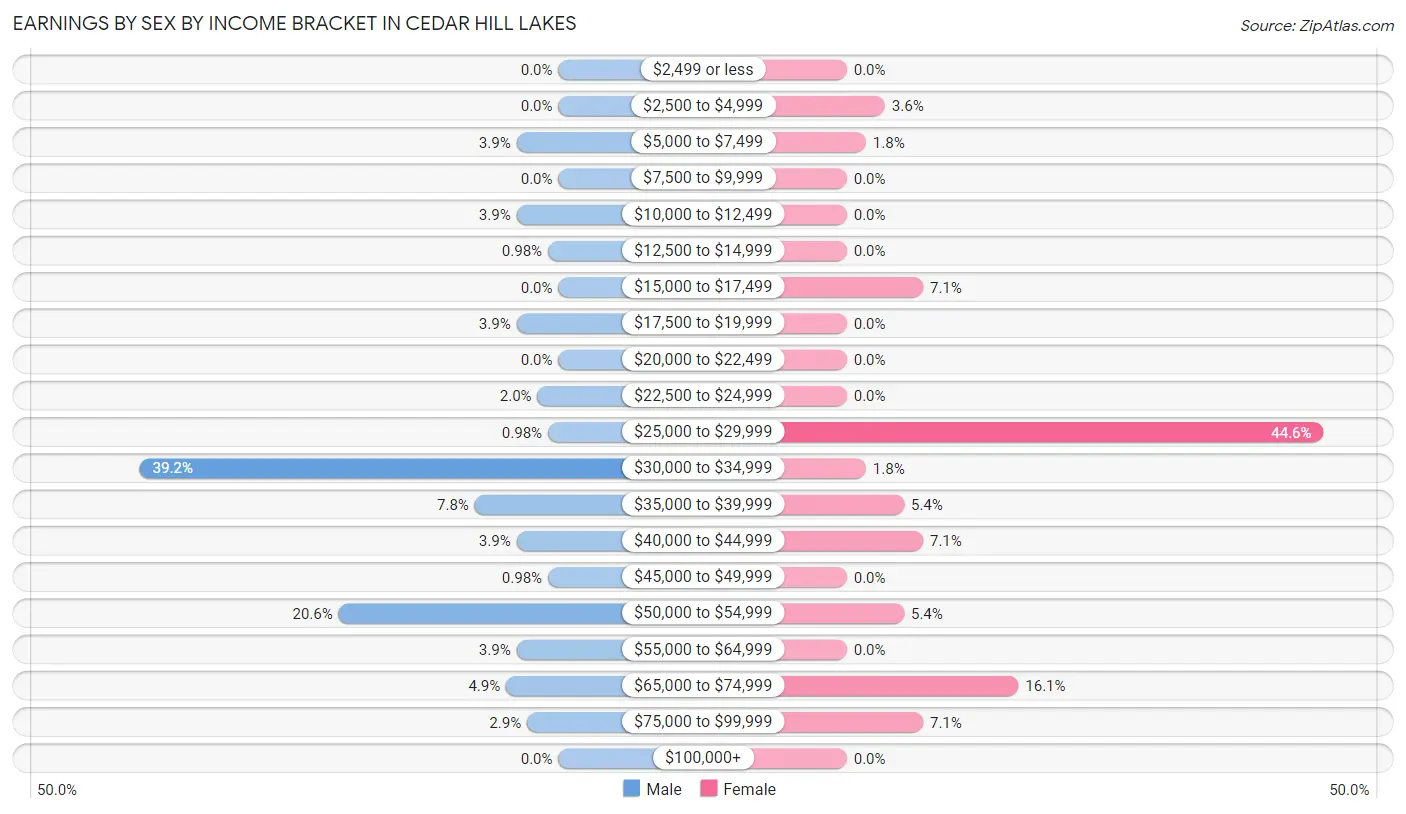
| Income | Male | Female |
| $2,499 or less | 0 (0.0%) | 0 (0.0%) |
| $2,500 to $4,999 | 0 (0.0%) | 2 (3.6%) |
| $5,000 to $7,499 | 4 (3.9%) | 1 (1.8%) |
| $7,500 to $9,999 | 0 (0.0%) | 0 (0.0%) |
| $10,000 to $12,499 | 4 (3.9%) | 0 (0.0%) |
| $12,500 to $14,999 | 1 (1.0%) | 0 (0.0%) |
| $15,000 to $17,499 | 0 (0.0%) | 4 (7.1%) |
| $17,500 to $19,999 | 4 (3.9%) | 0 (0.0%) |
| $20,000 to $22,499 | 0 (0.0%) | 0 (0.0%) |
| $22,500 to $24,999 | 2 (2.0%) | 0 (0.0%) |
| $25,000 to $29,999 | 1 (1.0%) | 25 (44.6%) |
| $30,000 to $34,999 | 40 (39.2%) | 1 (1.8%) |
| $35,000 to $39,999 | 8 (7.8%) | 3 (5.4%) |
| $40,000 to $44,999 | 4 (3.9%) | 4 (7.1%) |
| $45,000 to $49,999 | 1 (1.0%) | 0 (0.0%) |
| $50,000 to $54,999 | 21 (20.6%) | 3 (5.4%) |
| $55,000 to $64,999 | 4 (3.9%) | 0 (0.0%) |
| $65,000 to $74,999 | 5 (4.9%) | 9 (16.1%) |
| $75,000 to $99,999 | 3 (2.9%) | 4 (7.1%) |
| $100,000+ | 0 (0.0%) | 0 (0.0%) |
| Total | 102 (100.0%) | 56 (100.0%) |
Earnings by Sex by Educational Attainment in Cedar Hill Lakes
Average earnings in Cedar Hill Lakes are $38,542 for men and $44,063 for women, a difference of 12.5%. Men with an educational attainment of high school diploma enjoy the highest average annual earnings of $52,847, while those with college or associate's degree education earn the least with $32,313. Women with an educational attainment of college or associate's degree earn the most with the average annual earnings of $86,250, while those with bachelor's degree education have the smallest earnings of $39,167.
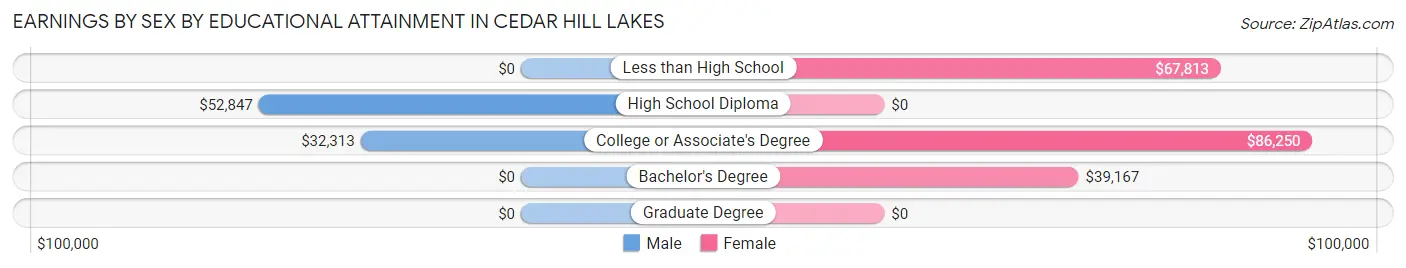
| Educational Attainment | Male Income | Female Income |
| Less than High School | - | - |
| High School Diploma | $52,847 | $0 |
| College or Associate's Degree | $32,313 | $86,250 |
| Bachelor's Degree | - | - |
| Graduate Degree | - | - |
| Total | $38,542 | $44,063 |
Family Income in Cedar Hill Lakes
Family Income Brackets in Cedar Hill Lakes
According to the Cedar Hill Lakes family income data, there are 24 families falling into the $100,000 to $149,999 income range, which is the most common income bracket and makes up 42.1% of all families.
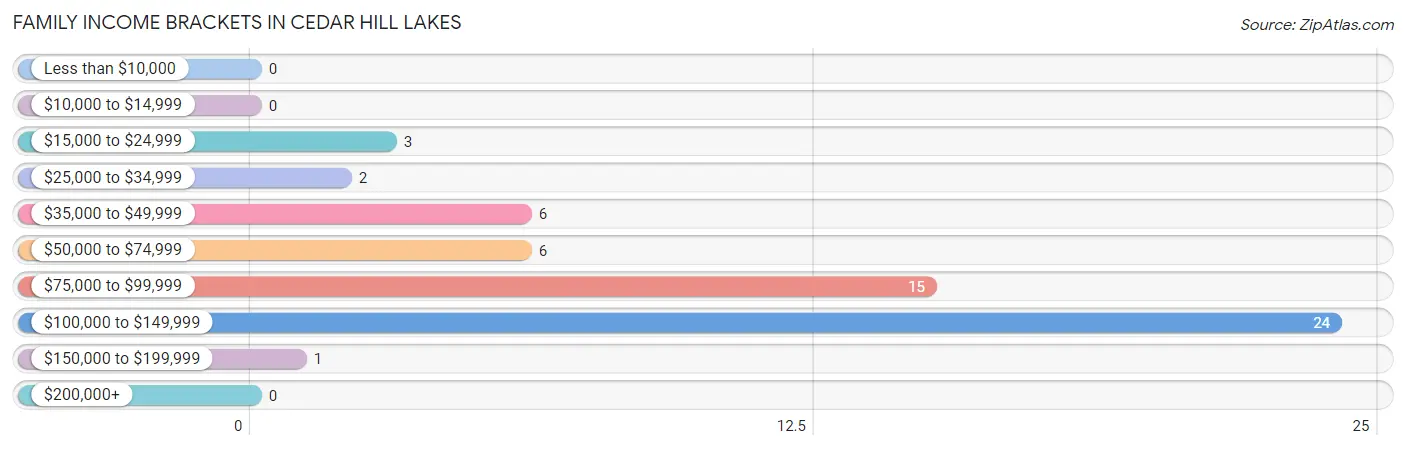
| Income Bracket | # Families | % Families |
| Less than $10,000 | 0 | 0.0% |
| $10,000 to $14,999 | 0 | 0.0% |
| $15,000 to $24,999 | 3 | 5.3% |
| $25,000 to $34,999 | 2 | 3.5% |
| $35,000 to $49,999 | 6 | 10.5% |
| $50,000 to $74,999 | 6 | 10.5% |
| $75,000 to $99,999 | 15 | 26.3% |
| $100,000 to $149,999 | 24 | 42.1% |
| $150,000 to $199,999 | 1 | 1.8% |
| $200,000+ | 0 | 0.0% |
Family Income by Famaliy Size in Cedar Hill Lakes
4-person families (25 | 43.9%) account for the highest median family income in Cedar Hill Lakes with $118,264 per family, while 2-person families (20 | 35.1%) have the highest median income of $40,000 per family member.
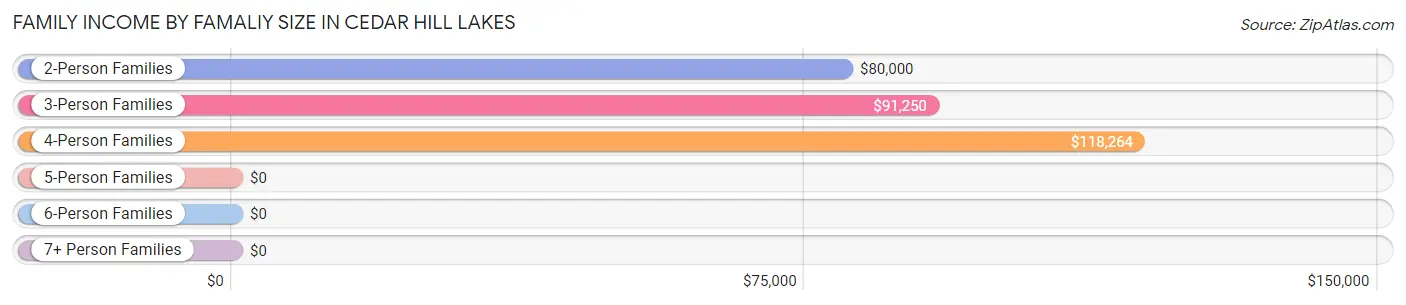
| Income Bracket | # Families | Median Income |
| 2-Person Families | 20 (35.1%) | $80,000 |
| 3-Person Families | 10 (17.5%) | $91,250 |
| 4-Person Families | 25 (43.9%) | $118,264 |
| 5-Person Families | 0 (0.0%) | $0 |
| 6-Person Families | 0 (0.0%) | $0 |
| 7+ Person Families | 2 (3.5%) | $0 |
| Total | 57 (100.0%) | $90,625 |
Family Income by Number of Earners in Cedar Hill Lakes
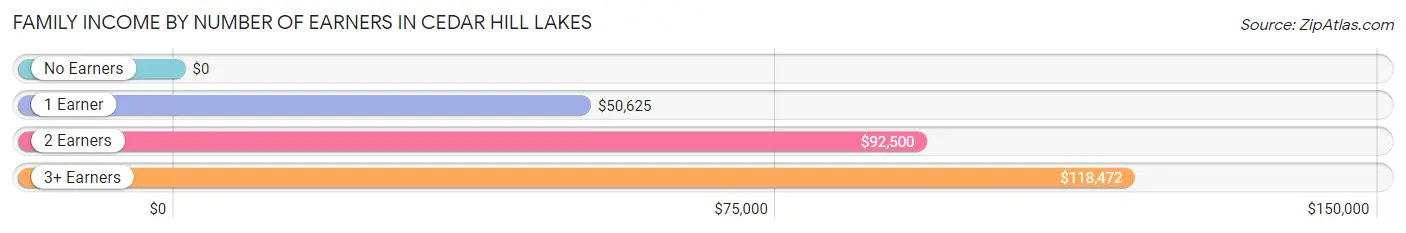
| Number of Earners | # Families | Median Income |
| No Earners | 6 (10.5%) | $0 |
| 1 Earner | 15 (26.3%) | $50,625 |
| 2 Earners | 12 (21.0%) | $92,500 |
| 3+ Earners | 24 (42.1%) | $118,472 |
| Total | 57 (100.0%) | $90,625 |
Household Income in Cedar Hill Lakes
Household Income Brackets in Cedar Hill Lakes
With 25 households falling in the category, the $100,000 to $149,999 income range is the most frequent in Cedar Hill Lakes, accounting for 24.7% of all households.
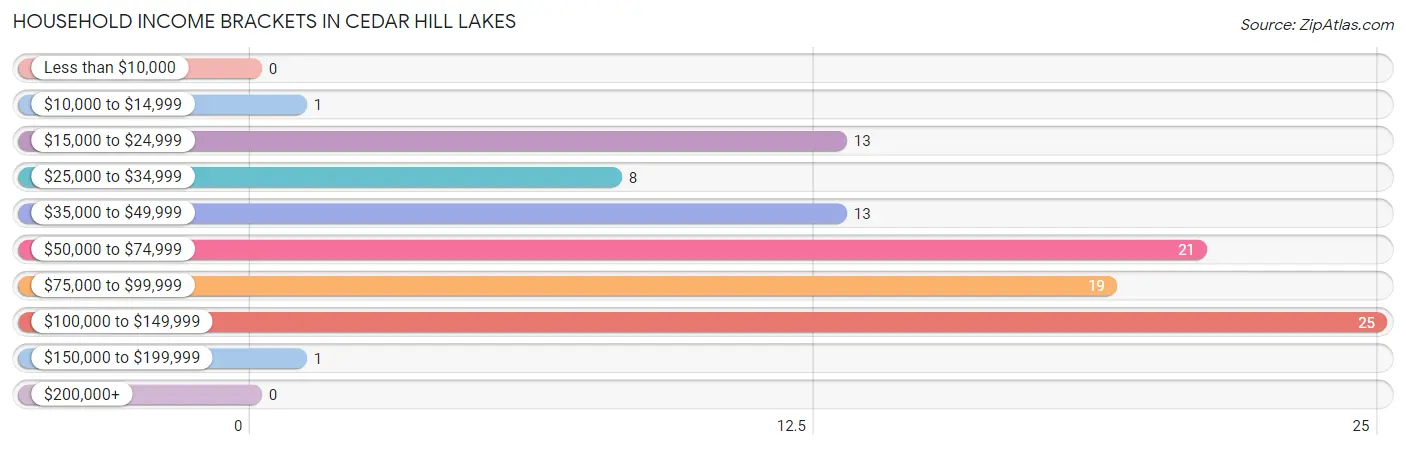
| Income Bracket | # Households | % Households |
| Less than $10,000 | 0 | 0.0% |
| $10,000 to $14,999 | 1 | 1.0% |
| $15,000 to $24,999 | 13 | 12.9% |
| $25,000 to $34,999 | 8 | 7.9% |
| $35,000 to $49,999 | 13 | 12.9% |
| $50,000 to $74,999 | 21 | 20.8% |
| $75,000 to $99,999 | 19 | 18.8% |
| $100,000 to $149,999 | 25 | 24.8% |
| $150,000 to $199,999 | 1 | 1.0% |
| $200,000+ | 0 | 0.0% |
Household Income by Householder Age in Cedar Hill Lakes
The median household income in Cedar Hill Lakes is $69,063, with the highest median household income of $85,000 found in the 45 to 64 years age bracket for the primary householder. A total of 56 households (55.4%) fall into this category.
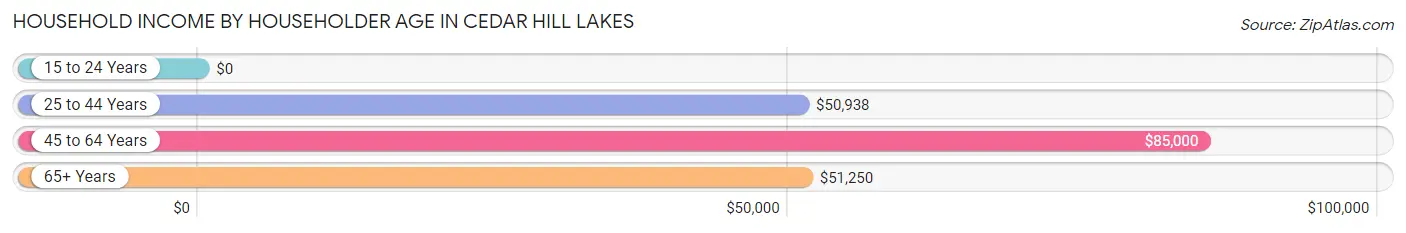
| Income Bracket | # Households | Median Income |
| 15 to 24 Years | 0 (0.0%) | $0 |
| 25 to 44 Years | 19 (18.8%) | $50,938 |
| 45 to 64 Years | 56 (55.4%) | $85,000 |
| 65+ Years | 26 (25.7%) | $51,250 |
| Total | 101 (100.0%) | $69,063 |
Poverty in Cedar Hill Lakes
Income Below Poverty by Sex and Age in Cedar Hill Lakes
With 10.5% poverty level for males and 9.3% for females among the residents of Cedar Hill Lakes, 35 to 44 year old males and 12 to 14 year old females are the most vulnerable to poverty, with 15 males (51.7%) and 4 females (57.1%) in their respective age groups living below the poverty level.
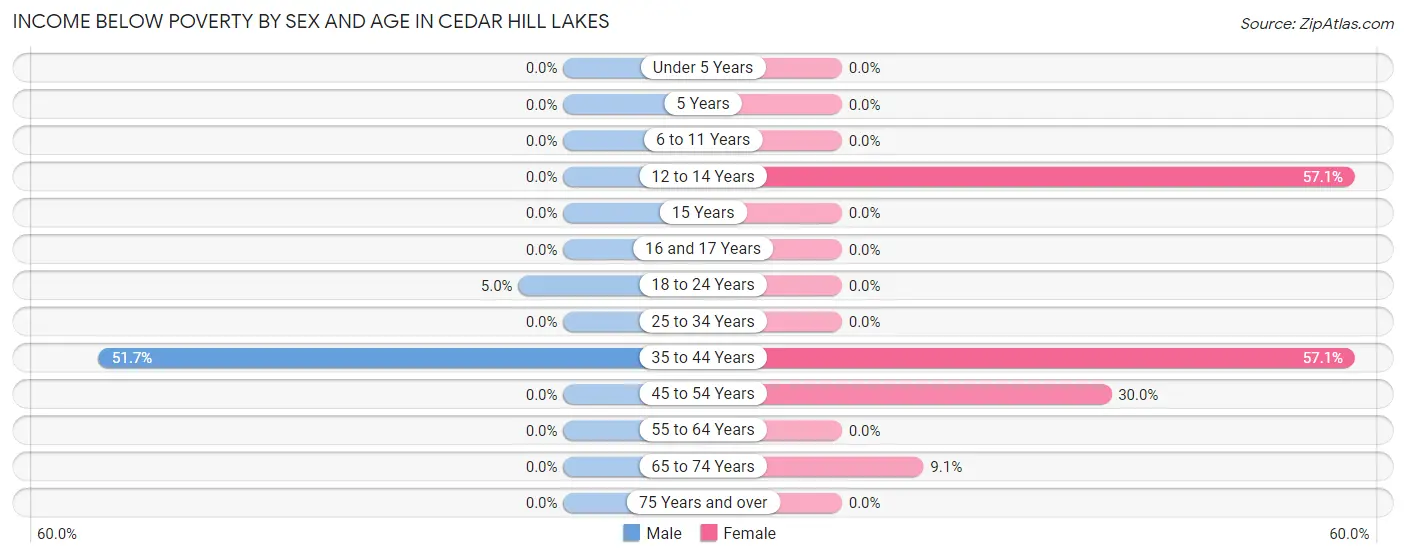
| Age Bracket | Male | Female |
| Under 5 Years | 0 (0.0%) | 0 (0.0%) |
| 5 Years | 0 (0.0%) | 0 (0.0%) |
| 6 to 11 Years | 0 (0.0%) | 0 (0.0%) |
| 12 to 14 Years | 0 (0.0%) | 4 (57.1%) |
| 15 Years | 0 (0.0%) | 0 (0.0%) |
| 16 and 17 Years | 0 (0.0%) | 0 (0.0%) |
| 18 to 24 Years | 1 (5.0%) | 0 (0.0%) |
| 25 to 34 Years | 0 (0.0%) | 0 (0.0%) |
| 35 to 44 Years | 15 (51.7%) | 4 (57.1%) |
| 45 to 54 Years | 0 (0.0%) | 3 (30.0%) |
| 55 to 64 Years | 0 (0.0%) | 0 (0.0%) |
| 65 to 74 Years | 0 (0.0%) | 1 (9.1%) |
| 75 Years and over | 0 (0.0%) | 0 (0.0%) |
| Total | 16 (10.5%) | 12 (9.3%) |
Income Above Poverty by Sex and Age in Cedar Hill Lakes
According to the poverty statistics in Cedar Hill Lakes, males aged under 5 years and females aged under 5 years are the age groups that are most secure financially, with 100.0% of males and 100.0% of females in these age groups living above the poverty line.
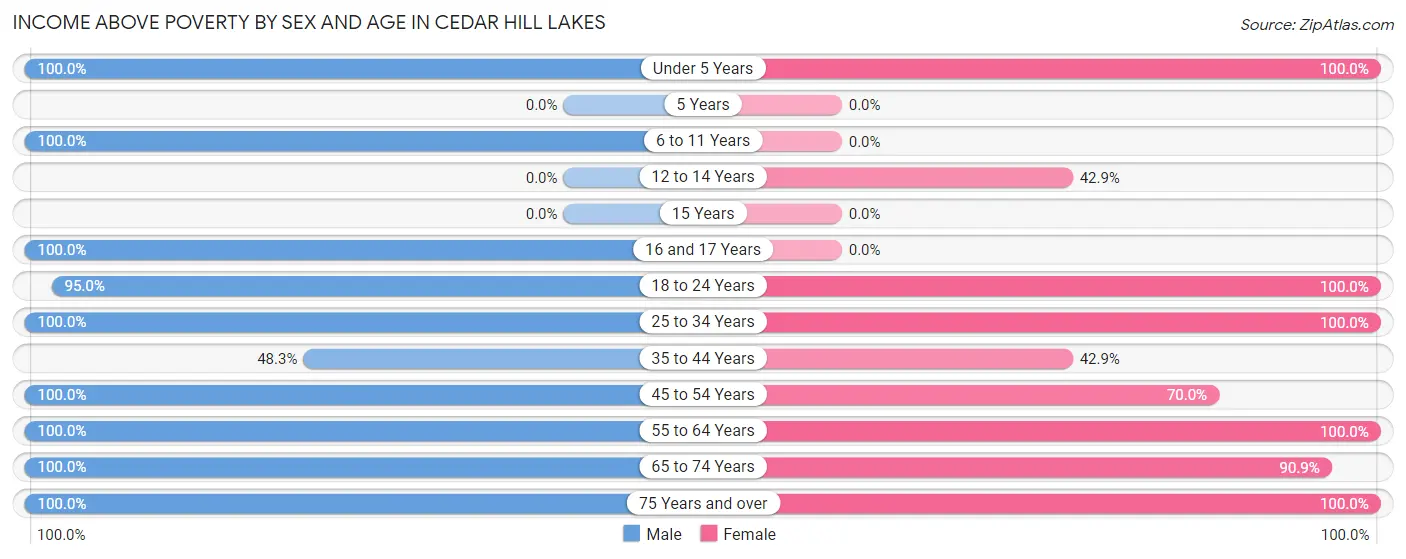
| Age Bracket | Male | Female |
| Under 5 Years | 7 (100.0%) | 6 (100.0%) |
| 5 Years | 0 (0.0%) | 0 (0.0%) |
| 6 to 11 Years | 4 (100.0%) | 0 (0.0%) |
| 12 to 14 Years | 0 (0.0%) | 3 (42.9%) |
| 15 Years | 0 (0.0%) | 0 (0.0%) |
| 16 and 17 Years | 1 (100.0%) | 0 (0.0%) |
| 18 to 24 Years | 19 (95.0%) | 49 (100.0%) |
| 25 to 34 Years | 25 (100.0%) | 14 (100.0%) |
| 35 to 44 Years | 14 (48.3%) | 3 (42.9%) |
| 45 to 54 Years | 33 (100.0%) | 7 (70.0%) |
| 55 to 64 Years | 13 (100.0%) | 21 (100.0%) |
| 65 to 74 Years | 18 (100.0%) | 10 (90.9%) |
| 75 Years and over | 3 (100.0%) | 4 (100.0%) |
| Total | 137 (89.5%) | 117 (90.7%) |
Income Below Poverty Among Married-Couple Families in Cedar Hill Lakes
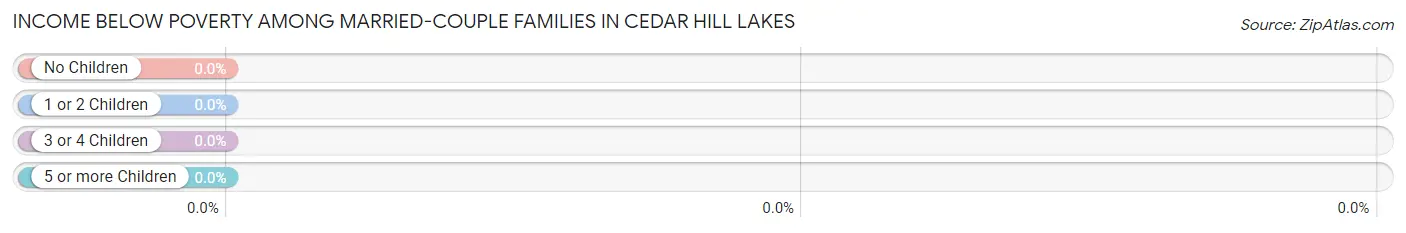
| Children | Above Poverty | Below Poverty |
| No Children | 14 (100.0%) | 0 (0.0%) |
| 1 or 2 Children | 14 (100.0%) | 0 (0.0%) |
| 3 or 4 Children | 0 (0.0%) | 0 (0.0%) |
| 5 or more Children | 0 (0.0%) | 0 (0.0%) |
| Total | 28 (100.0%) | 0 (0.0%) |
Income Below Poverty Among Single-Parent Households in Cedar Hill Lakes
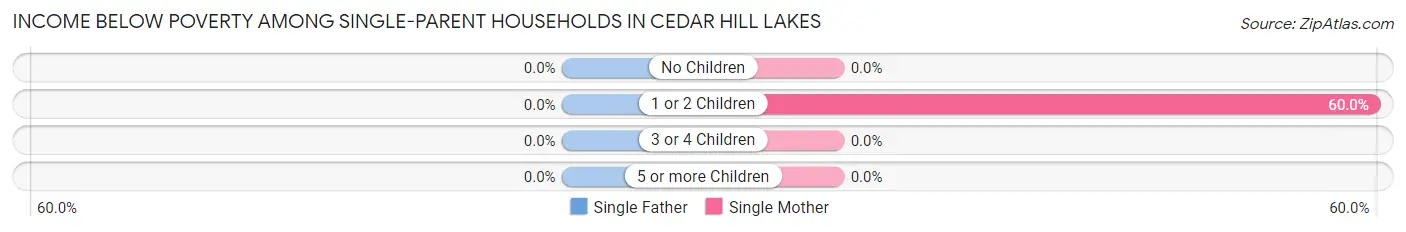
| Children | Single Father | Single Mother |
| No Children | 0 (0.0%) | 0 (0.0%) |
| 1 or 2 Children | 0 (0.0%) | 3 (60.0%) |
| 3 or 4 Children | 0 (0.0%) | 0 (0.0%) |
| 5 or more Children | 0 (0.0%) | 0 (0.0%) |
| Total | 0 (0.0%) | 3 (50.0%) |
Income Below Poverty Among Married-Couple vs Single-Parent Households in Cedar Hill Lakes
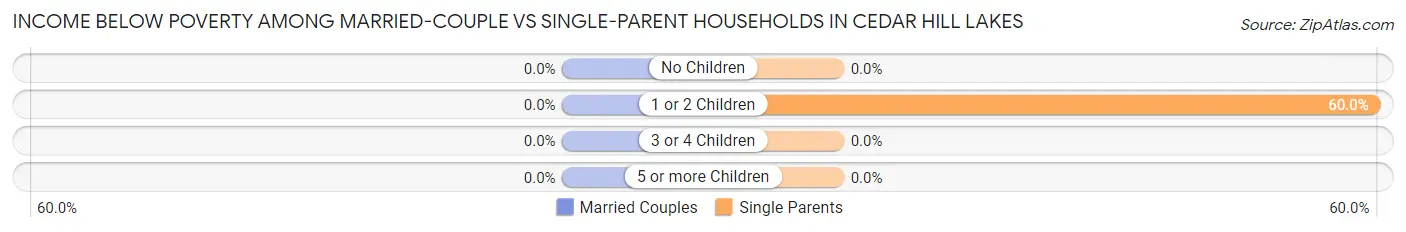
| Children | Married-Couple Families | Single-Parent Households |
| No Children | 0 (0.0%) | 0 (0.0%) |
| 1 or 2 Children | 0 (0.0%) | 3 (60.0%) |
| 3 or 4 Children | 0 (0.0%) | 0 (0.0%) |
| 5 or more Children | 0 (0.0%) | 0 (0.0%) |
| Total | 0 (0.0%) | 3 (10.3%) |
Race in Cedar Hill Lakes
The most populous races in Cedar Hill Lakes are White / Caucasian (274 | 97.2%), Asian (5 | 1.8%), and Two or more Races (3 | 1.1%).
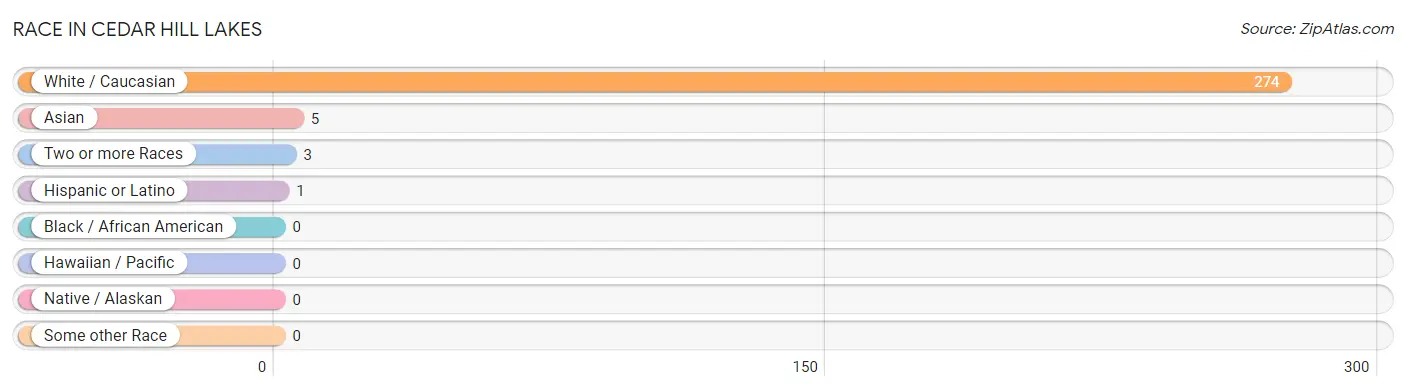
| Race | # Population | % Population |
| Asian | 5 | 1.8% |
| Black / African American | 0 | 0.0% |
| Hawaiian / Pacific | 0 | 0.0% |
| Hispanic or Latino | 1 | 0.4% |
| Native / Alaskan | 0 | 0.0% |
| White / Caucasian | 274 | 97.2% |
| Two or more Races | 3 | 1.1% |
| Some other Race | 0 | 0.0% |
| Total | 282 | 100.0% |
Ancestry in Cedar Hill Lakes
The most populous ancestries reported in Cedar Hill Lakes are German (145 | 51.4%), Irish (48 | 17.0%), Scottish (21 | 7.4%), English (18 | 6.4%), and Italian (17 | 6.0%), together accounting for 88.3% of all Cedar Hill Lakes residents.
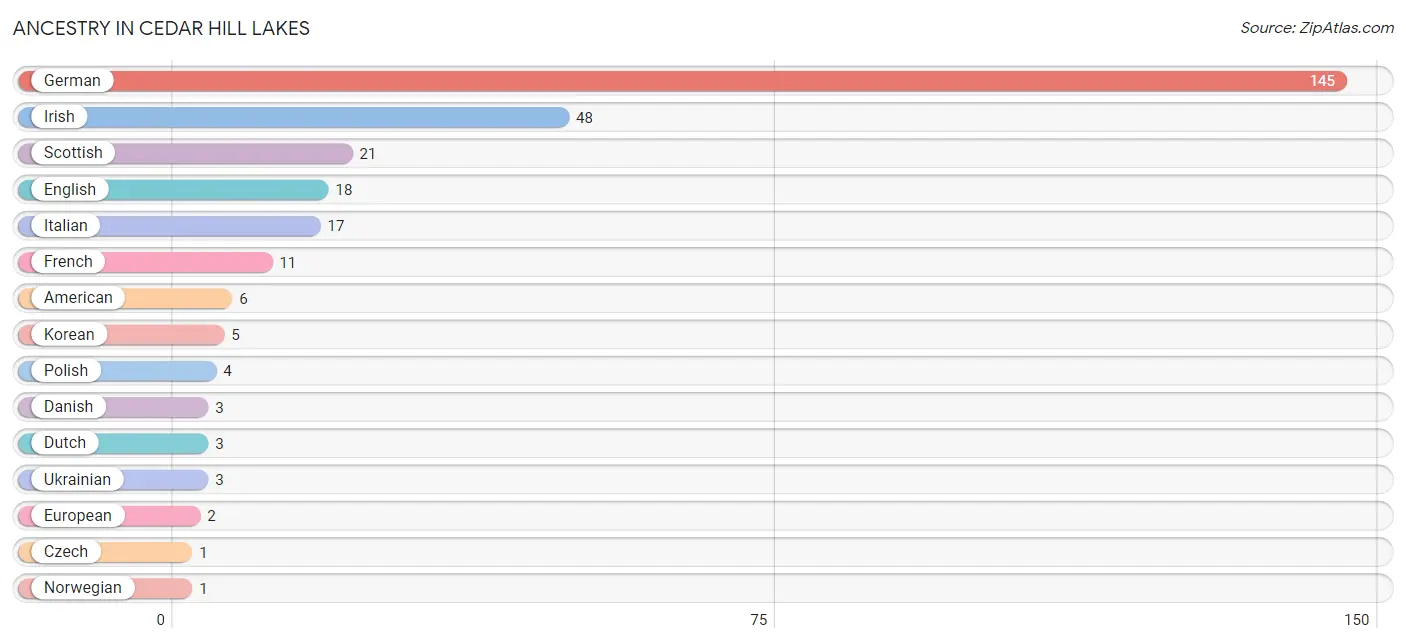
| Ancestry | # Population | % Population |
| American | 6 | 2.1% |
| Czech | 1 | 0.4% |
| Danish | 3 | 1.1% |
| Dutch | 3 | 1.1% |
| English | 18 | 6.4% |
| European | 2 | 0.7% |
| French | 11 | 3.9% |
| German | 145 | 51.4% |
| Irish | 48 | 17.0% |
| Italian | 17 | 6.0% |
| Korean | 5 | 1.8% |
| Norwegian | 1 | 0.4% |
| Polish | 4 | 1.4% |
| Puerto Rican | 1 | 0.4% |
| Scottish | 21 | 7.4% |
| Ukrainian | 3 | 1.1% | View All 16 Rows |
Immigrants in Cedar Hill Lakes
The most numerous immigrant groups reported in Cedar Hill Lakes came from Asia (3 | 1.1%), Philippines (3 | 1.1%), and South Eastern Asia (3 | 1.1%), together accounting for 3.2% of all Cedar Hill Lakes residents.
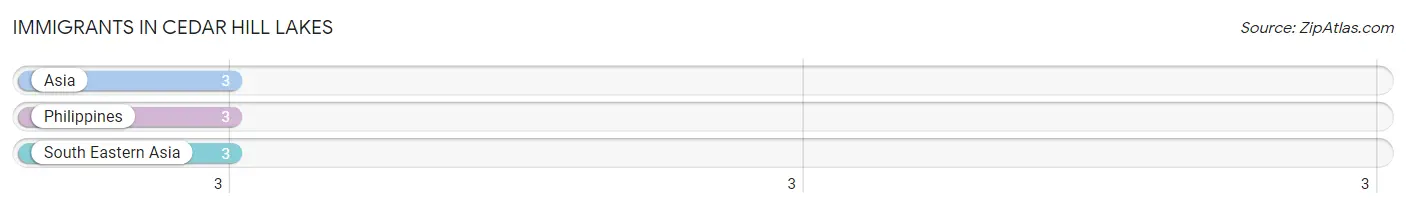
| Immigration Origin | # Population | % Population |
| Asia | 3 | 1.1% |
| Philippines | 3 | 1.1% |
| South Eastern Asia | 3 | 1.1% | View All 3 Rows |
Sex and Age in Cedar Hill Lakes
Sex and Age in Cedar Hill Lakes
The most populous age groups in Cedar Hill Lakes are 40 to 44 Years (24 | 15.7%) for men and 15 to 19 Years (28 | 21.7%) for women.
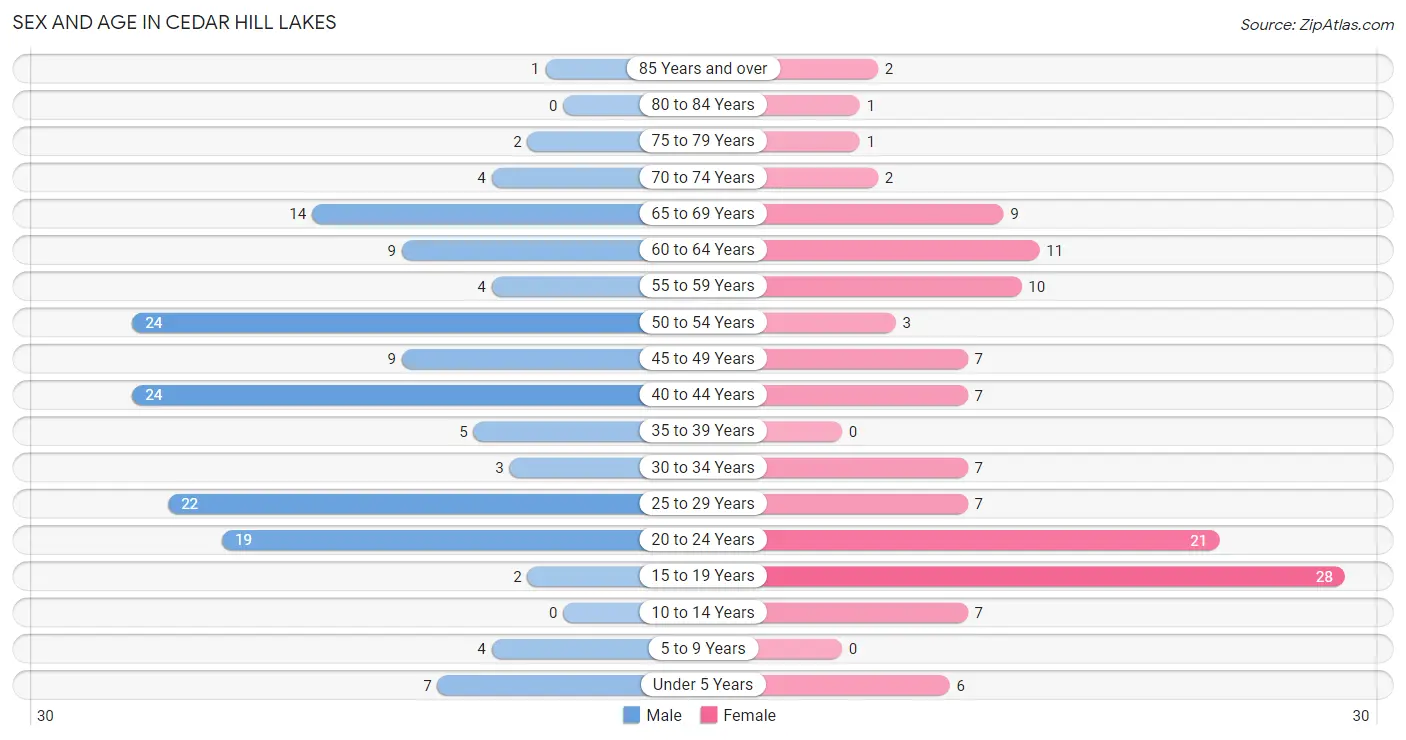
| Age Bracket | Male | Female |
| Under 5 Years | 7 (4.6%) | 6 (4.6%) |
| 5 to 9 Years | 4 (2.6%) | 0 (0.0%) |
| 10 to 14 Years | 0 (0.0%) | 7 (5.4%) |
| 15 to 19 Years | 2 (1.3%) | 28 (21.7%) |
| 20 to 24 Years | 19 (12.4%) | 21 (16.3%) |
| 25 to 29 Years | 22 (14.4%) | 7 (5.4%) |
| 30 to 34 Years | 3 (2.0%) | 7 (5.4%) |
| 35 to 39 Years | 5 (3.3%) | 0 (0.0%) |
| 40 to 44 Years | 24 (15.7%) | 7 (5.4%) |
| 45 to 49 Years | 9 (5.9%) | 7 (5.4%) |
| 50 to 54 Years | 24 (15.7%) | 3 (2.3%) |
| 55 to 59 Years | 4 (2.6%) | 10 (7.7%) |
| 60 to 64 Years | 9 (5.9%) | 11 (8.5%) |
| 65 to 69 Years | 14 (9.1%) | 9 (7.0%) |
| 70 to 74 Years | 4 (2.6%) | 2 (1.5%) |
| 75 to 79 Years | 2 (1.3%) | 1 (0.8%) |
| 80 to 84 Years | 0 (0.0%) | 1 (0.8%) |
| 85 Years and over | 1 (0.6%) | 2 (1.5%) |
| Total | 153 (100.0%) | 129 (100.0%) |
Families and Households in Cedar Hill Lakes
Median Family Size in Cedar Hill Lakes
The median family size in Cedar Hill Lakes is 3.35 persons per family, with single male/father families (23 | 40.4%) accounting for the largest median family size of 3.96 persons per family. On the other hand, single female/mother families (6 | 10.5%) represent the smallest median family size with 2.50 persons per family.
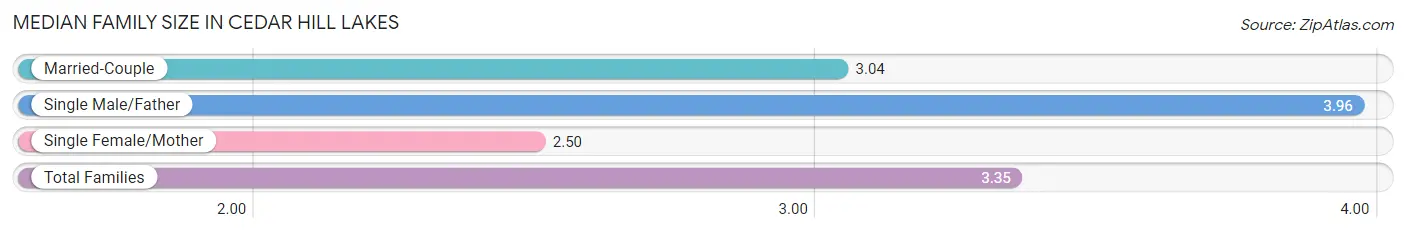
| Family Type | # Families | Family Size |
| Married-Couple | 28 (49.1%) | 3.04 |
| Single Male/Father | 23 (40.4%) | 3.96 |
| Single Female/Mother | 6 (10.5%) | 2.50 |
| Total Families | 57 (100.0%) | 3.35 |
Median Household Size in Cedar Hill Lakes
The median household size in Cedar Hill Lakes is 2.79 persons per household, with single male/father households (23 | 22.8%) accounting for the largest median household size of 4.83 persons per household. non-family households (44 | 43.6%) represent the smallest median household size with 1.52 persons per household.
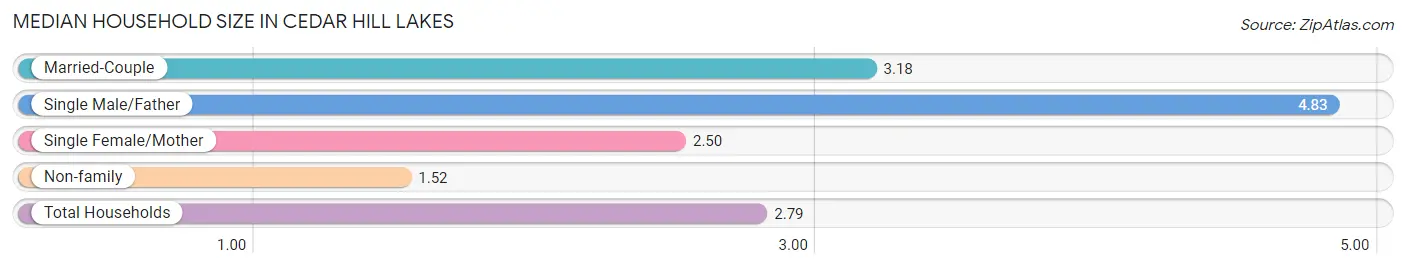
| Household Type | # Households | Household Size |
| Married-Couple | 28 (27.7%) | 3.18 |
| Single Male/Father | 23 (22.8%) | 4.83 |
| Single Female/Mother | 6 (5.9%) | 2.50 |
| Non-family | 44 (43.6%) | 1.52 |
| Total Households | 101 (100.0%) | 2.79 |
Household Size by Marriage Status in Cedar Hill Lakes
Out of a total of 101 households in Cedar Hill Lakes, 57 (56.4%) are family households, while 44 (43.6%) are nonfamily households. The most numerous type of family households are 5-person households, comprising 21, and the most common type of nonfamily households are 1-person households, comprising 32.
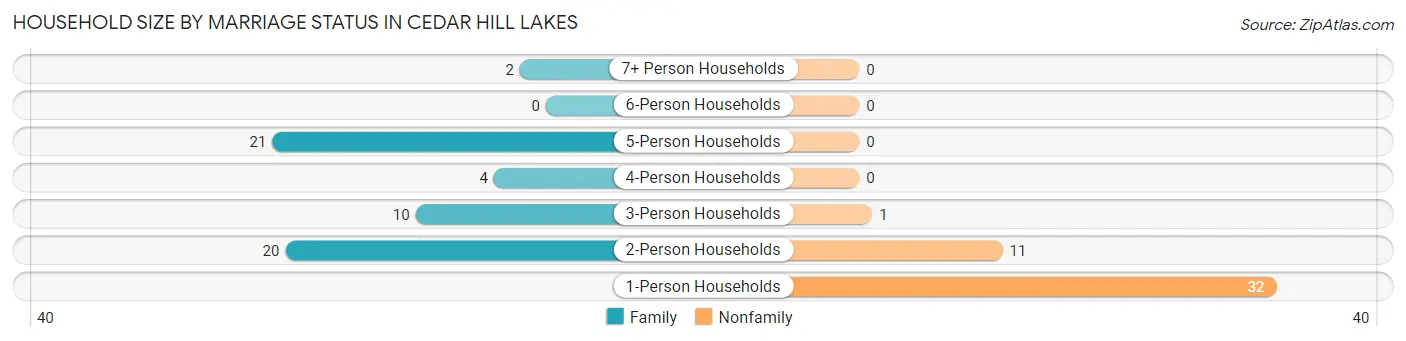
| Household Size | Family Households | Nonfamily Households |
| 1-Person Households | - | 32 (31.7%) |
| 2-Person Households | 20 (19.8%) | 11 (10.9%) |
| 3-Person Households | 10 (9.9%) | 1 (1.0%) |
| 4-Person Households | 4 (4.0%) | 0 (0.0%) |
| 5-Person Households | 21 (20.8%) | 0 (0.0%) |
| 6-Person Households | 0 (0.0%) | 0 (0.0%) |
| 7+ Person Households | 2 (2.0%) | 0 (0.0%) |
| Total | 57 (56.4%) | 44 (43.6%) |
Female Fertility in Cedar Hill Lakes
Fertility by Age in Cedar Hill Lakes
Average fertility rate in Cedar Hill Lakes is 130.0 births per 1,000 women. Women in the age bracket of 35 to 50 years have the highest fertility rate with 286.0 births per 1,000 women. Women in the age bracket of 20 to 34 years acount for 60.0% of all women with births.
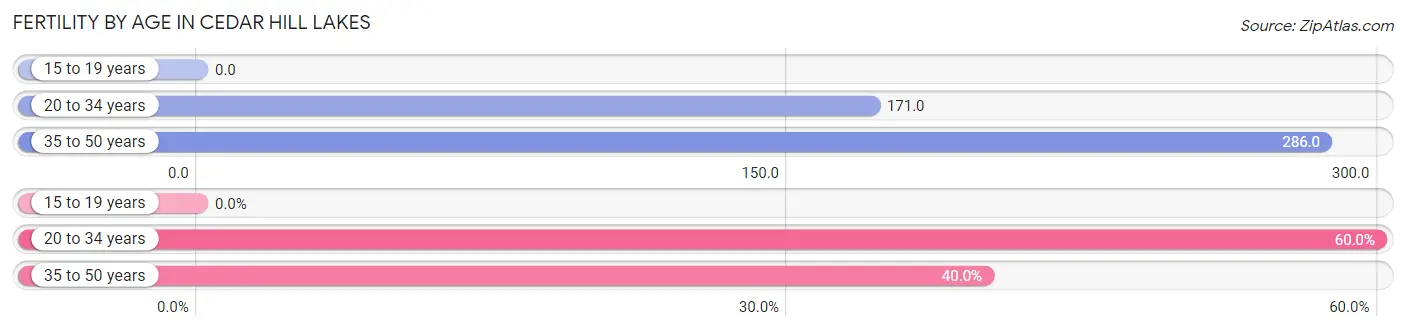
| Age Bracket | Women with Births | Births / 1,000 Women |
| 15 to 19 years | 0 (0.0%) | 0.0 |
| 20 to 34 years | 6 (60.0%) | 171.0 |
| 35 to 50 years | 4 (40.0%) | 286.0 |
| Total | 10 (100.0%) | 130.0 |
Fertility by Age by Marriage Status in Cedar Hill Lakes
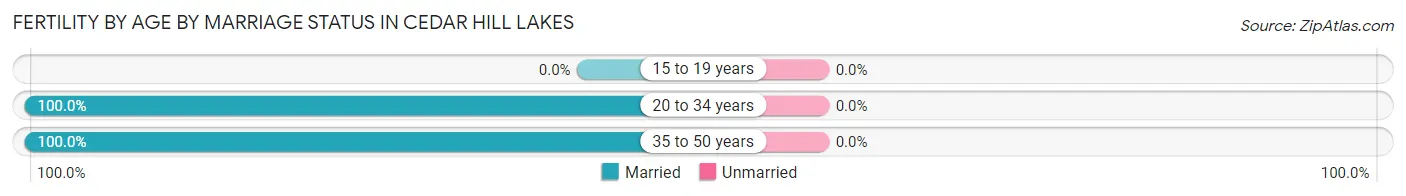
| Age Bracket | Married | Unmarried |
| 15 to 19 years | 0 (0.0%) | 0 (0.0%) |
| 20 to 34 years | 6 (100.0%) | 0 (0.0%) |
| 35 to 50 years | 4 (100.0%) | 0 (0.0%) |
| Total | 10 (100.0%) | 0 (0.0%) |
Fertility by Education in Cedar Hill Lakes
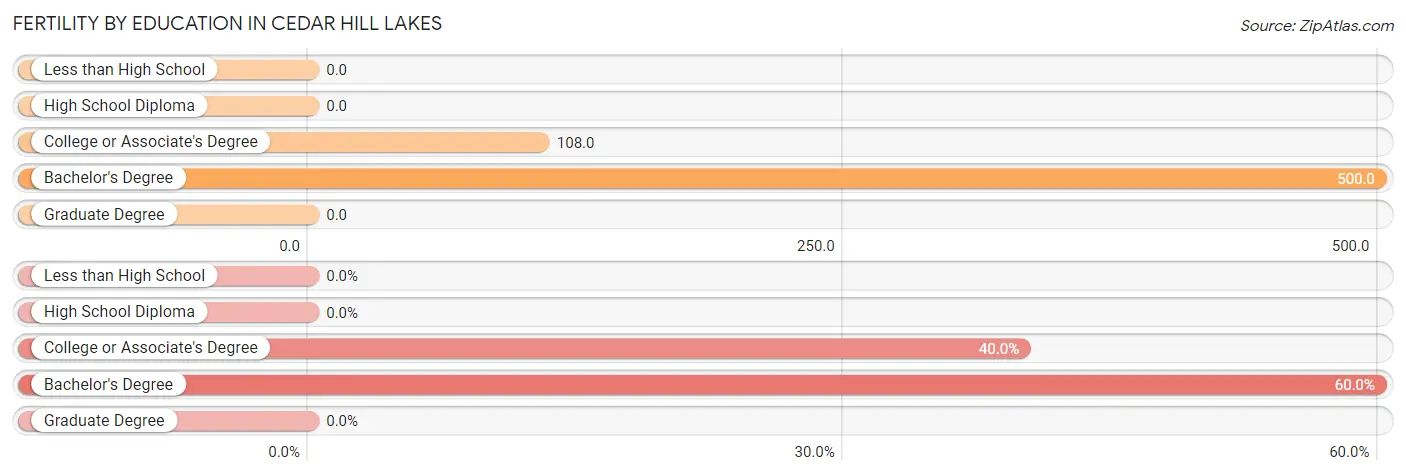
| Educational Attainment | Women with Births | Births / 1,000 Women |
| Less than High School | 0 (0.0%) | 0.0 |
| High School Diploma | 0 (0.0%) | 0.0 |
| College or Associate's Degree | 4 (40.0%) | 108.0 |
| Bachelor's Degree | 6 (60.0%) | 500.0 |
| Graduate Degree | 0 (0.0%) | 0.0 |
| Total | 10 (100.0%) | 130.0 |
Fertility by Education by Marriage Status in Cedar Hill Lakes
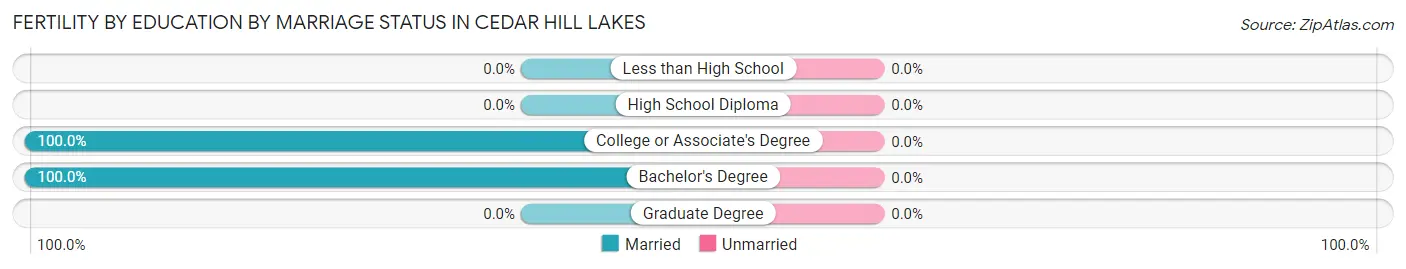
| Educational Attainment | Married | Unmarried |
| Less than High School | 0 (0.0%) | 0 (0.0%) |
| High School Diploma | 0 (0.0%) | 0 (0.0%) |
| College or Associate's Degree | 4 (100.0%) | 0 (0.0%) |
| Bachelor's Degree | 6 (100.0%) | 0 (0.0%) |
| Graduate Degree | 0 (0.0%) | 0 (0.0%) |
| Total | 10 (100.0%) | 0 (0.0%) |
Employment Characteristics in Cedar Hill Lakes
Employment by Class of Employer in Cedar Hill Lakes
Among the 145 employed individuals in Cedar Hill Lakes, private company employees (133 | 91.7%), not-for-profit organizations (4 | 2.8%), and federal government employees (4 | 2.8%) make up the most common classes of employment.
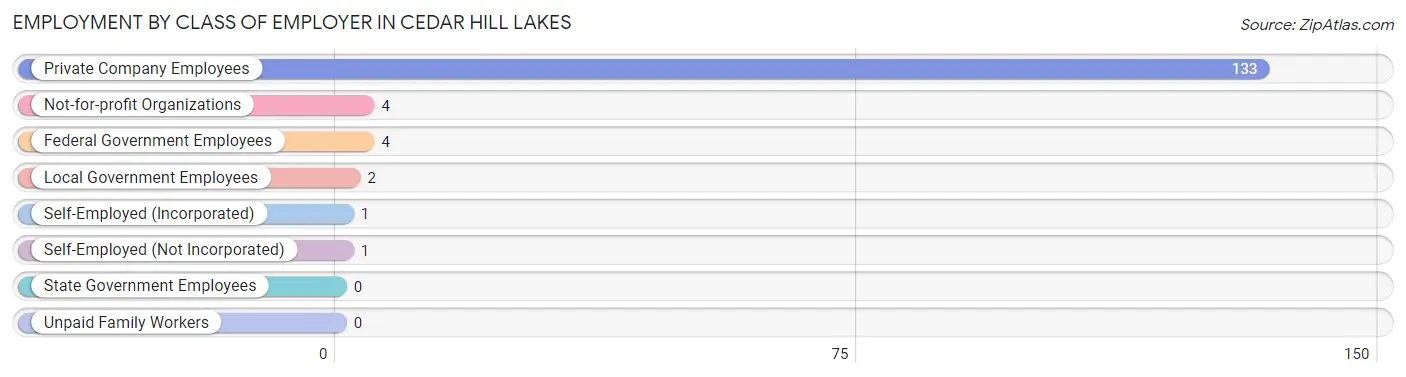
| Employer Class | # Employees | % Employees |
| Private Company Employees | 133 | 91.7% |
| Self-Employed (Incorporated) | 1 | 0.7% |
| Self-Employed (Not Incorporated) | 1 | 0.7% |
| Not-for-profit Organizations | 4 | 2.8% |
| Local Government Employees | 2 | 1.4% |
| State Government Employees | 0 | 0.0% |
| Federal Government Employees | 4 | 2.8% |
| Unpaid Family Workers | 0 | 0.0% |
| Total | 145 | 100.0% |
Employment Status by Age in Cedar Hill Lakes
According to the labor force statistics for Cedar Hill Lakes, out of the total population over 16 years of age (258), 60.1% or 155 individuals are in the labor force, with 3.9% or 6 of them unemployed. The age group with the highest labor force participation rate is 25 to 29 years, with 100.0% or 29 individuals in the labor force. Within the labor force, the 35 to 44 years age range has the highest percentage of unemployed individuals, with 25.0% or 4 of them being unemployed.
| Age Bracket | In Labor Force | Unemployed |
| 16 to 19 Years | 1 (3.3%) | 0 (0.0%) |
| 20 to 24 Years | 39 (97.5%) | 0 (0.0%) |
| 25 to 29 Years | 29 (100.0%) | 0 (0.0%) |
| 30 to 34 Years | 9 (90.0%) | 0 (0.0%) |
| 35 to 44 Years | 16 (44.4%) | 4 (25.0%) |
| 45 to 54 Years | 33 (76.7%) | 2 (6.1%) |
| 55 to 59 Years | 8 (57.1%) | 0 (0.0%) |
| 60 to 64 Years | 12 (60.0%) | 0 (0.0%) |
| 65 to 74 Years | 8 (27.6%) | 0 (0.0%) |
| 75 Years and over | 0 (0.0%) | 0 (0.0%) |
| Total | 155 (60.1%) | 6 (3.9%) |
Employment Status by Educational Attainment in Cedar Hill Lakes
According to labor force statistics for Cedar Hill Lakes, 70.4% of individuals (107) out of the total population between 25 and 64 years of age (152) are in the labor force, with 5.6% or 6 of them being unemployed. The group with the highest labor force participation rate are those with the educational attainment of bachelor's degree or higher, with 93.3% or 14 individuals in the labor force. Within the labor force, individuals with high school diploma education have the highest percentage of unemployment, with 14.0% or 6 of them being unemployed.
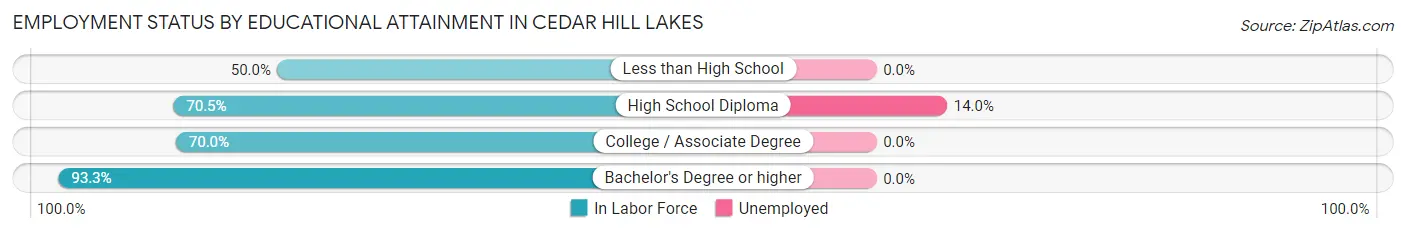
| Educational Attainment | In Labor Force | Unemployed |
| Less than High School | 8 (50.0%) | 0 (0.0%) |
| High School Diploma | 43 (70.5%) | 9 (14.0%) |
| College / Associate Degree | 42 (70.0%) | 0 (0.0%) |
| Bachelor's Degree or higher | 14 (93.3%) | 0 (0.0%) |
| Total | 107 (70.4%) | 9 (5.6%) |
Employment Occupations by Sex in Cedar Hill Lakes
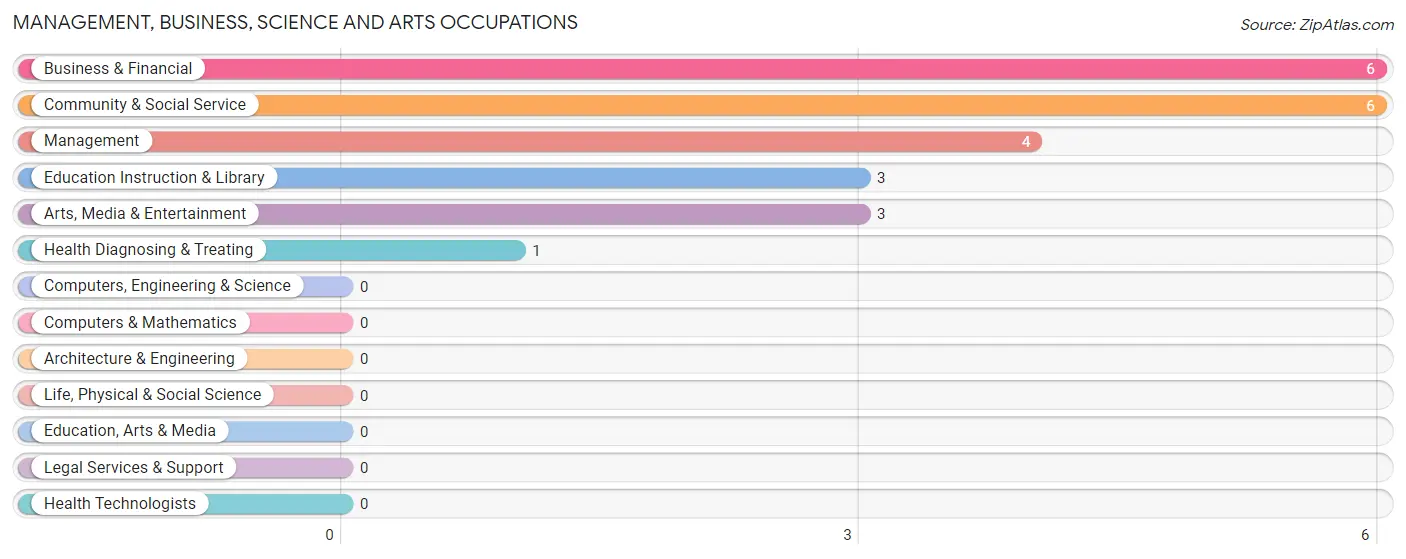
Management, Business, Science and Arts Occupations
The most common Management, Business, Science and Arts occupations in Cedar Hill Lakes are Business & Financial (6 | 4.0%), Community & Social Service (6 | 4.0%), Management (4 | 2.7%), Education Instruction & Library (3 | 2.0%), and Arts, Media & Entertainment (3 | 2.0%).
Management, Business, Science and Arts Occupations by Sex
Within the Management, Business, Science and Arts occupations in Cedar Hill Lakes, the most male-oriented occupations are Arts, Media & Entertainment (100.0%), Health Diagnosing & Treating (100.0%), and Management (50.0%), while the most female-oriented occupations are Education Instruction & Library (100.0%), Management (50.0%), and Business & Financial (50.0%).
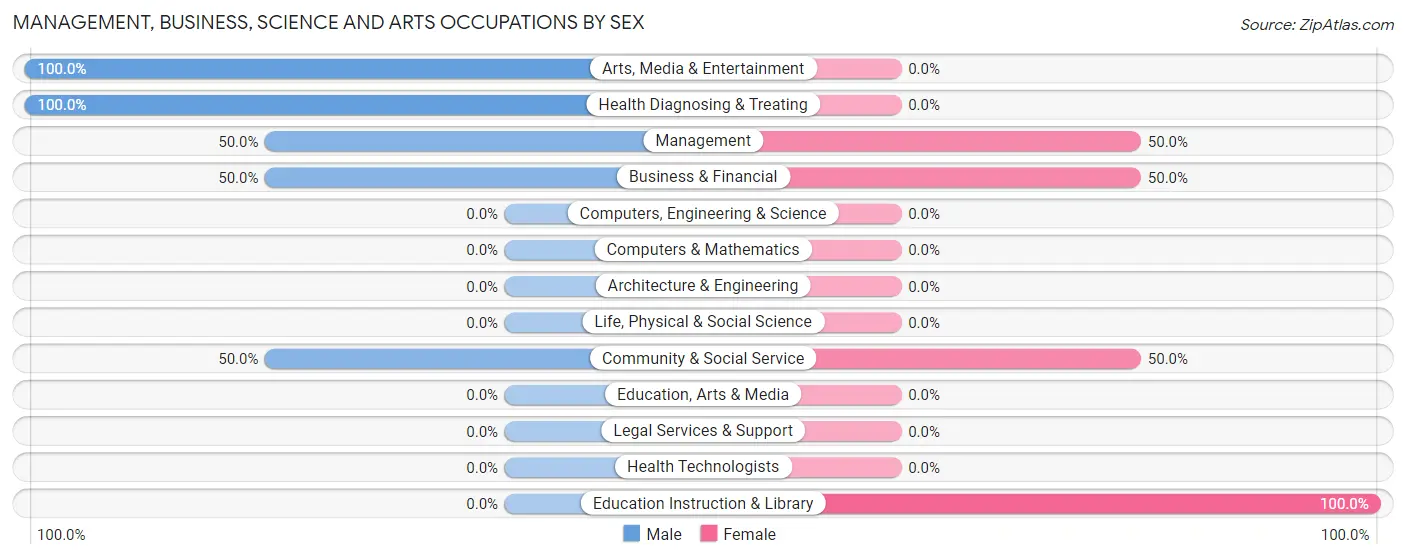
| Occupation | Male | Female |
| Management | 2 (50.0%) | 2 (50.0%) |
| Business & Financial | 3 (50.0%) | 3 (50.0%) |
| Computers, Engineering & Science | 0 (0.0%) | 0 (0.0%) |
| Computers & Mathematics | 0 (0.0%) | 0 (0.0%) |
| Architecture & Engineering | 0 (0.0%) | 0 (0.0%) |
| Life, Physical & Social Science | 0 (0.0%) | 0 (0.0%) |
| Community & Social Service | 3 (50.0%) | 3 (50.0%) |
| Education, Arts & Media | 0 (0.0%) | 0 (0.0%) |
| Legal Services & Support | 0 (0.0%) | 0 (0.0%) |
| Education Instruction & Library | 0 (0.0%) | 3 (100.0%) |
| Arts, Media & Entertainment | 3 (100.0%) | 0 (0.0%) |
| Health Diagnosing & Treating | 1 (100.0%) | 0 (0.0%) |
| Health Technologists | 0 (0.0%) | 0 (0.0%) |
| Total (Category) | 9 (52.9%) | 8 (47.1%) |
| Total (Overall) | 93 (62.4%) | 56 (37.6%) |
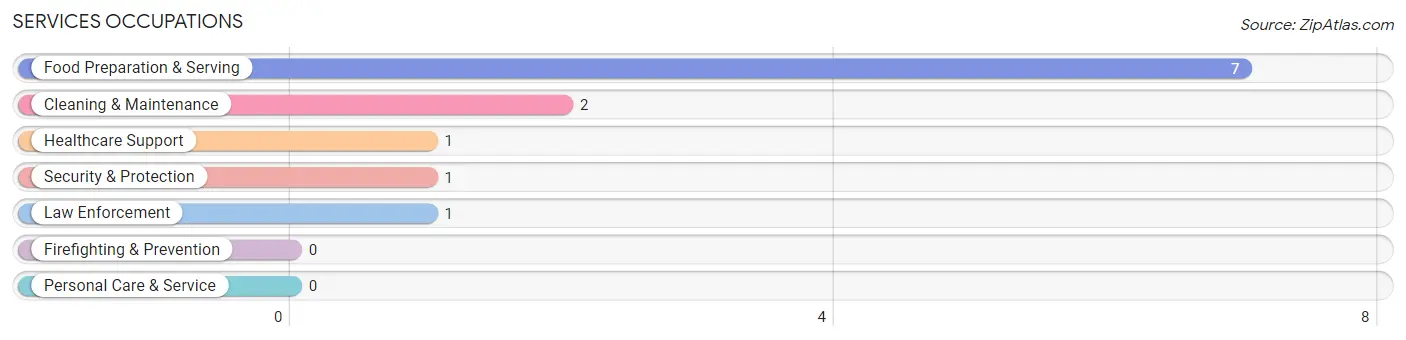
Services Occupations
The most common Services occupations in Cedar Hill Lakes are Food Preparation & Serving (7 | 4.7%), Cleaning & Maintenance (2 | 1.3%), Healthcare Support (1 | 0.7%), Security & Protection (1 | 0.7%), and Law Enforcement (1 | 0.7%).
Services Occupations by Sex
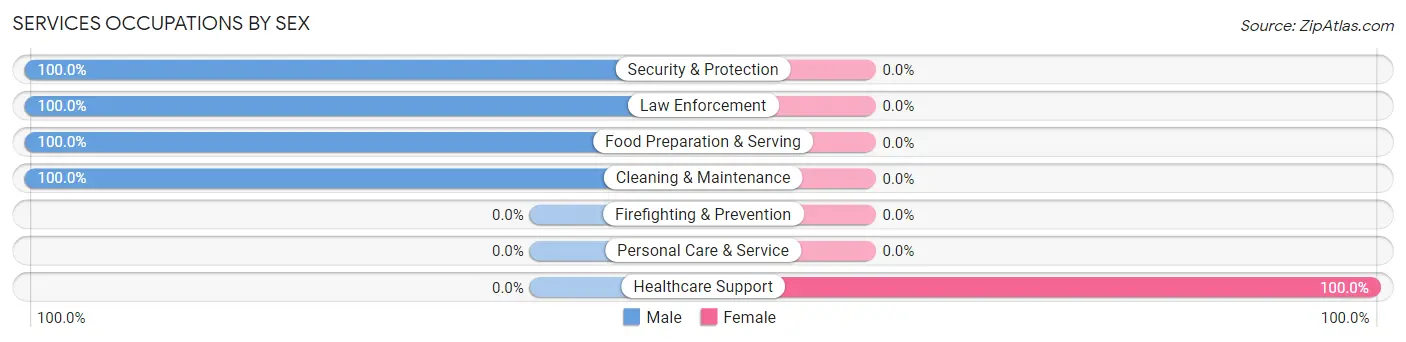
| Occupation | Male | Female |
| Healthcare Support | 0 (0.0%) | 1 (100.0%) |
| Security & Protection | 1 (100.0%) | 0 (0.0%) |
| Firefighting & Prevention | 0 (0.0%) | 0 (0.0%) |
| Law Enforcement | 1 (100.0%) | 0 (0.0%) |
| Food Preparation & Serving | 7 (100.0%) | 0 (0.0%) |
| Cleaning & Maintenance | 2 (100.0%) | 0 (0.0%) |
| Personal Care & Service | 0 (0.0%) | 0 (0.0%) |
| Total (Category) | 10 (90.9%) | 1 (9.1%) |
| Total (Overall) | 93 (62.4%) | 56 (37.6%) |
Sales and Office Occupations
The most common Sales and Office occupations in Cedar Hill Lakes are Sales & Related (19 | 12.8%), and Office & Administration (8 | 5.4%).

Sales and Office Occupations by Sex
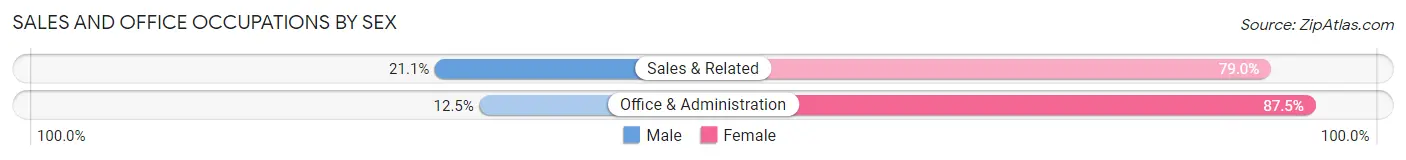
| Occupation | Male | Female |
| Sales & Related | 4 (21.0%) | 15 (78.9%) |
| Office & Administration | 1 (12.5%) | 7 (87.5%) |
| Total (Category) | 5 (18.5%) | 22 (81.5%) |
| Total (Overall) | 93 (62.4%) | 56 (37.6%) |
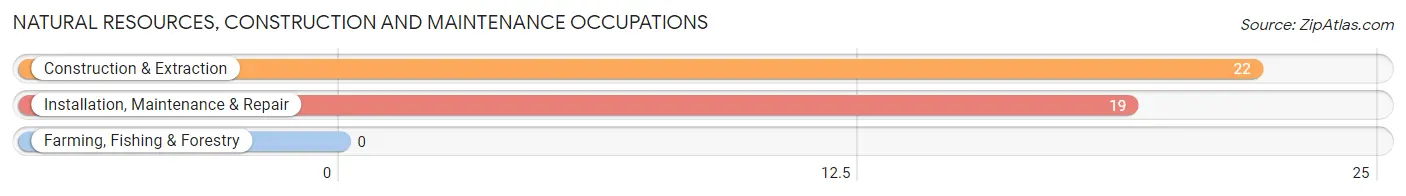
Natural Resources, Construction and Maintenance Occupations
The most common Natural Resources, Construction and Maintenance occupations in Cedar Hill Lakes are Construction & Extraction (22 | 14.8%), and Installation, Maintenance & Repair (19 | 12.8%).
Natural Resources, Construction and Maintenance Occupations by Sex
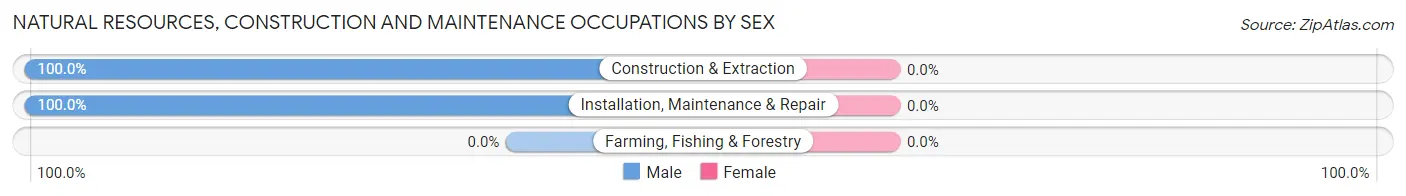
| Occupation | Male | Female |
| Farming, Fishing & Forestry | 0 (0.0%) | 0 (0.0%) |
| Construction & Extraction | 22 (100.0%) | 0 (0.0%) |
| Installation, Maintenance & Repair | 19 (100.0%) | 0 (0.0%) |
| Total (Category) | 41 (100.0%) | 0 (0.0%) |
| Total (Overall) | 93 (62.4%) | 56 (37.6%) |
Production, Transportation and Moving Occupations
The most common Production, Transportation and Moving occupations in Cedar Hill Lakes are Production (25 | 16.8%), Material Moving (25 | 16.8%), and Transportation (3 | 2.0%).
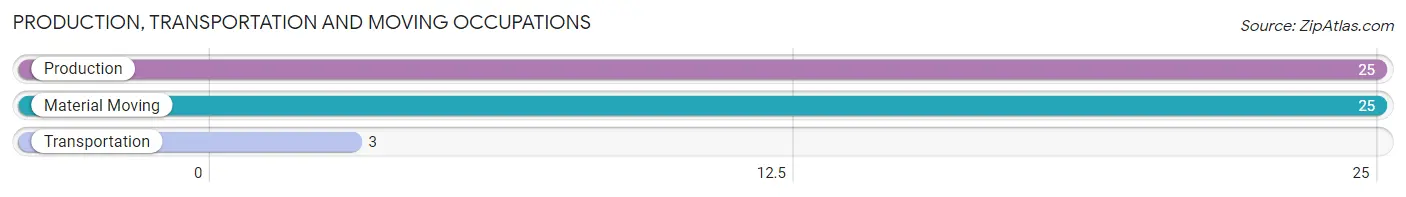
Production, Transportation and Moving Occupations by Sex
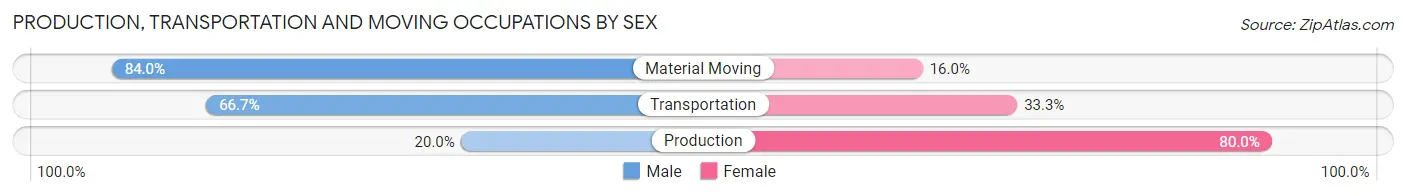
| Occupation | Male | Female |
| Production | 5 (20.0%) | 20 (80.0%) |
| Transportation | 2 (66.7%) | 1 (33.3%) |
| Material Moving | 21 (84.0%) | 4 (16.0%) |
| Total (Category) | 28 (52.8%) | 25 (47.2%) |
| Total (Overall) | 93 (62.4%) | 56 (37.6%) |
Employment Industries by Sex in Cedar Hill Lakes
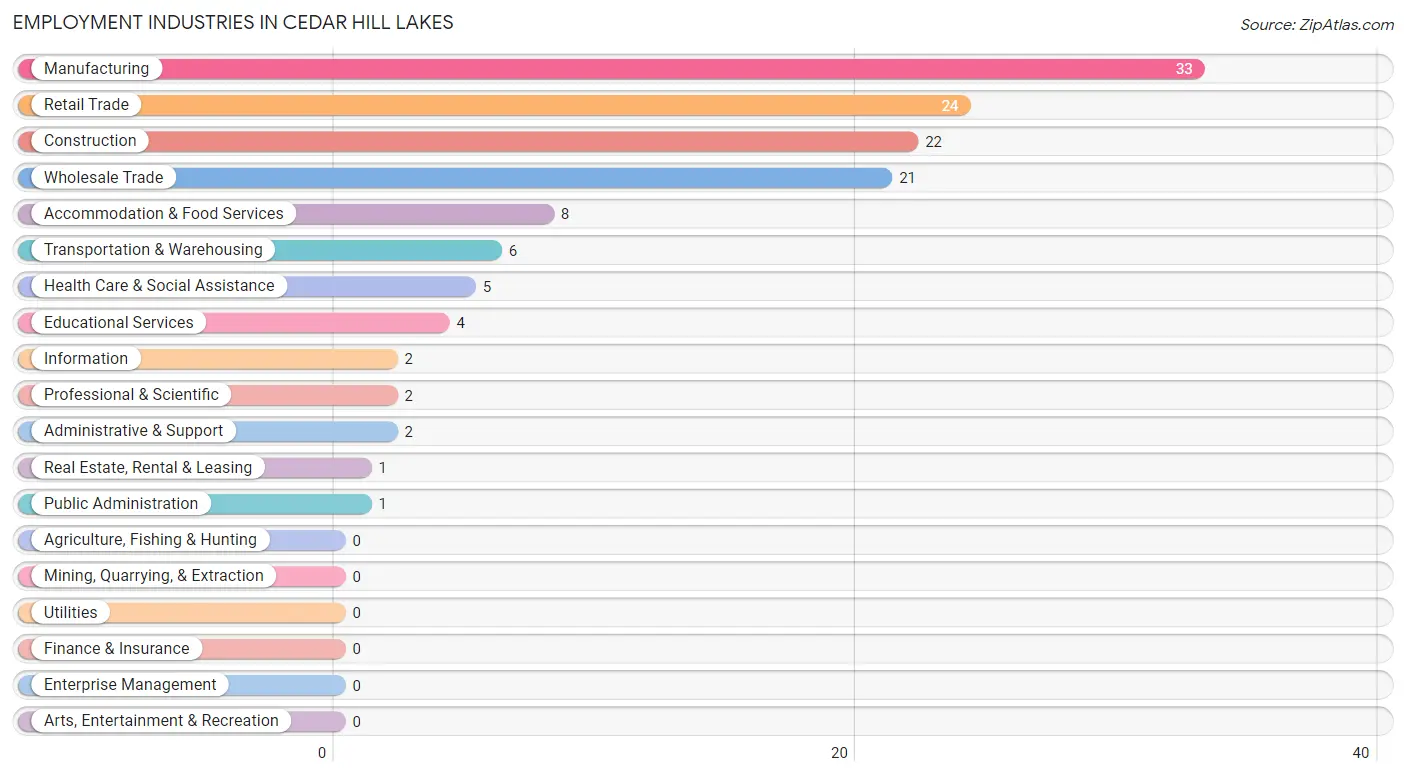
Employment Industries in Cedar Hill Lakes
The major employment industries in Cedar Hill Lakes include Manufacturing (33 | 22.2%), Retail Trade (24 | 16.1%), Construction (22 | 14.8%), Wholesale Trade (21 | 14.1%), and Accommodation & Food Services (8 | 5.4%).
Employment Industries by Sex in Cedar Hill Lakes
The Cedar Hill Lakes industries that see more men than women are Construction (100.0%), Wholesale Trade (100.0%), and Professional & Scientific (100.0%), whereas the industries that tend to have a higher number of women are Information (100.0%), Real Estate, Rental & Leasing (100.0%), and Educational Services (100.0%).
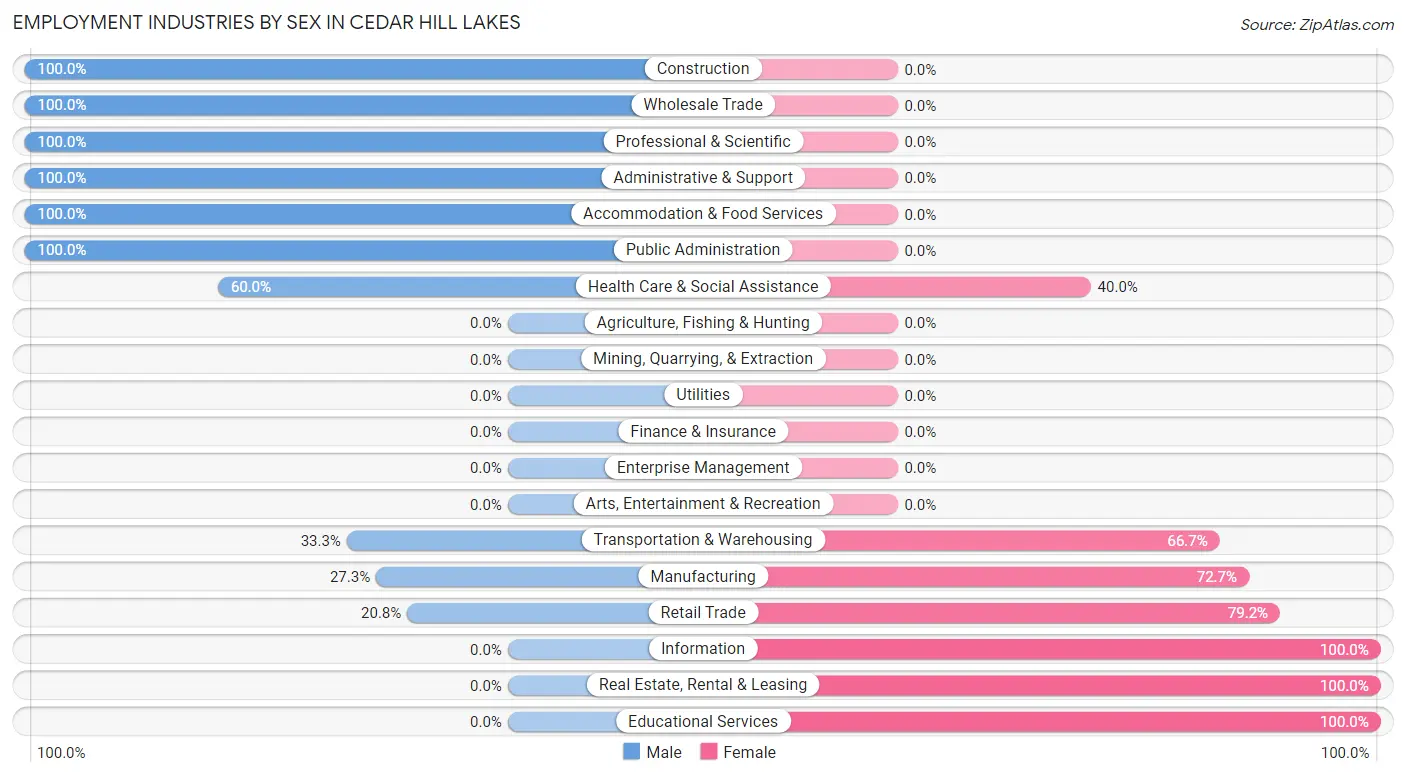
| Industry | Male | Female |
| Agriculture, Fishing & Hunting | 0 (0.0%) | 0 (0.0%) |
| Mining, Quarrying, & Extraction | 0 (0.0%) | 0 (0.0%) |
| Construction | 22 (100.0%) | 0 (0.0%) |
| Manufacturing | 9 (27.3%) | 24 (72.7%) |
| Wholesale Trade | 21 (100.0%) | 0 (0.0%) |
| Retail Trade | 5 (20.8%) | 19 (79.2%) |
| Transportation & Warehousing | 2 (33.3%) | 4 (66.7%) |
| Utilities | 0 (0.0%) | 0 (0.0%) |
| Information | 0 (0.0%) | 2 (100.0%) |
| Finance & Insurance | 0 (0.0%) | 0 (0.0%) |
| Real Estate, Rental & Leasing | 0 (0.0%) | 1 (100.0%) |
| Professional & Scientific | 2 (100.0%) | 0 (0.0%) |
| Enterprise Management | 0 (0.0%) | 0 (0.0%) |
| Administrative & Support | 2 (100.0%) | 0 (0.0%) |
| Educational Services | 0 (0.0%) | 4 (100.0%) |
| Health Care & Social Assistance | 3 (60.0%) | 2 (40.0%) |
| Arts, Entertainment & Recreation | 0 (0.0%) | 0 (0.0%) |
| Accommodation & Food Services | 8 (100.0%) | 0 (0.0%) |
| Public Administration | 1 (100.0%) | 0 (0.0%) |
| Total | 93 (62.4%) | 56 (37.6%) |
Education in Cedar Hill Lakes
School Enrollment in Cedar Hill Lakes
The most common levels of schooling among the 44 students in Cedar Hill Lakes are college / undergraduate (31 | 70.5%), elementary school (4 | 9.1%), and middle school (4 | 9.1%).
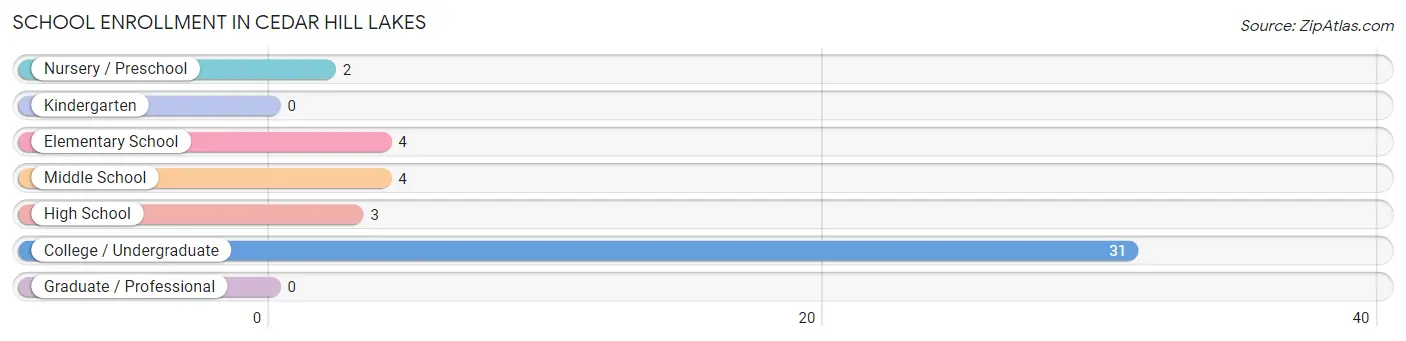
| School Level | # Students | % Students |
| Nursery / Preschool | 2 | 4.5% |
| Kindergarten | 0 | 0.0% |
| Elementary School | 4 | 9.1% |
| Middle School | 4 | 9.1% |
| High School | 3 | 6.8% |
| College / Undergraduate | 31 | 70.5% |
| Graduate / Professional | 0 | 0.0% |
| Total | 44 | 100.0% |
School Enrollment by Age by Funding Source in Cedar Hill Lakes
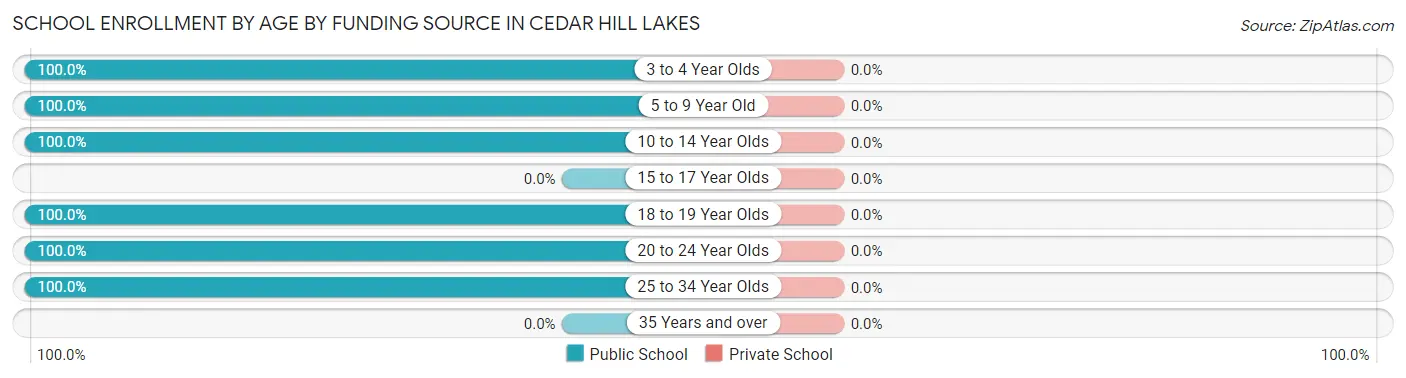
| Age Bracket | Public School | Private School |
| 3 to 4 Year Olds | 2 (100.0%) | 0 (0.0%) |
| 5 to 9 Year Old | 4 (100.0%) | 0 (0.0%) |
| 10 to 14 Year Olds | 7 (100.0%) | 0 (0.0%) |
| 15 to 17 Year Olds | 0 (0.0%) | 0 (0.0%) |
| 18 to 19 Year Olds | 28 (100.0%) | 0 (0.0%) |
| 20 to 24 Year Olds | 1 (100.0%) | 0 (0.0%) |
| 25 to 34 Year Olds | 2 (100.0%) | 0 (0.0%) |
| 35 Years and over | 0 (0.0%) | 0 (0.0%) |
| Total | 44 (100.0%) | 0 (0.0%) |
Educational Attainment by Field of Study in Cedar Hill Lakes
Business (11 | 36.7%), education (8 | 26.7%), science & technology (4 | 13.3%), computers & mathematics (2 | 6.7%), and bio, nature & agricultural (2 | 6.7%) are the most common fields of study among 30 individuals in Cedar Hill Lakes who have obtained a bachelor's degree or higher.
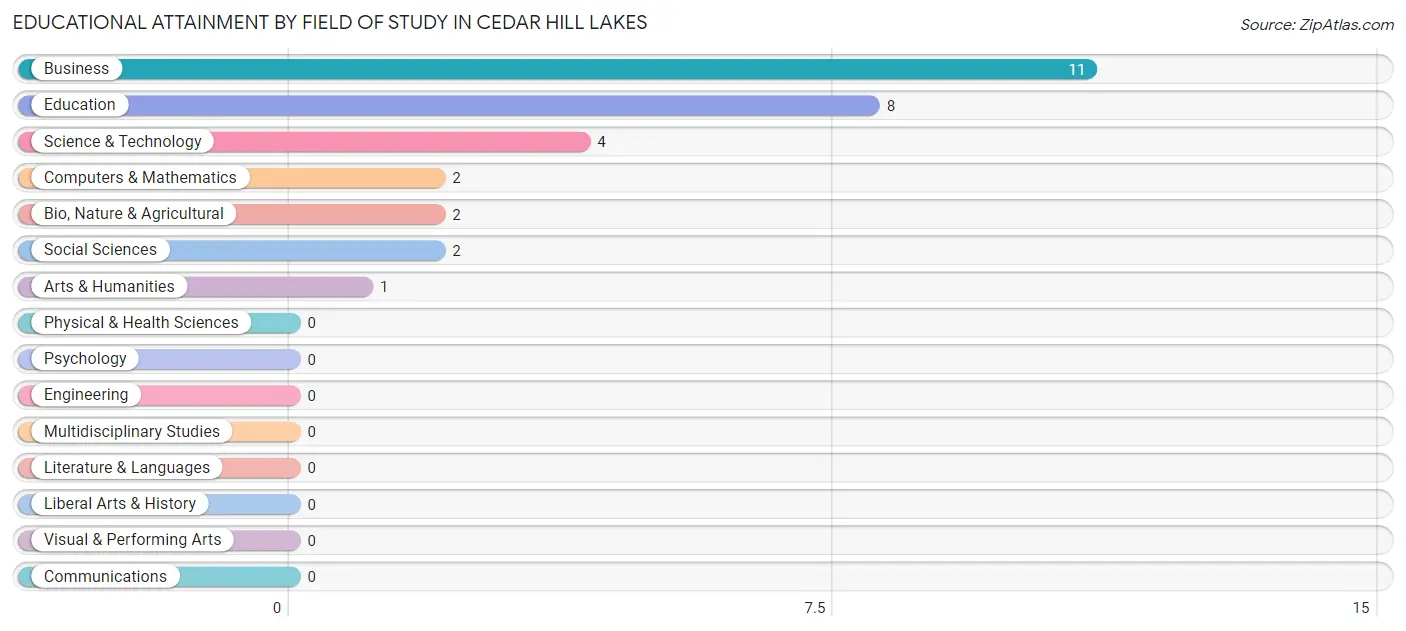
| Field of Study | # Graduates | % Graduates |
| Computers & Mathematics | 2 | 6.7% |
| Bio, Nature & Agricultural | 2 | 6.7% |
| Physical & Health Sciences | 0 | 0.0% |
| Psychology | 0 | 0.0% |
| Social Sciences | 2 | 6.7% |
| Engineering | 0 | 0.0% |
| Multidisciplinary Studies | 0 | 0.0% |
| Science & Technology | 4 | 13.3% |
| Business | 11 | 36.7% |
| Education | 8 | 26.7% |
| Literature & Languages | 0 | 0.0% |
| Liberal Arts & History | 0 | 0.0% |
| Visual & Performing Arts | 0 | 0.0% |
| Communications | 0 | 0.0% |
| Arts & Humanities | 1 | 3.3% |
| Total | 30 | 100.0% |
Transportation & Commute in Cedar Hill Lakes
Vehicle Availability by Sex in Cedar Hill Lakes
The most prevalent vehicle ownership categories in Cedar Hill Lakes are males with 5 or more vehicles (51, accounting for 55.4%) and females with 5 or more vehicles (20, making up 96.2%).
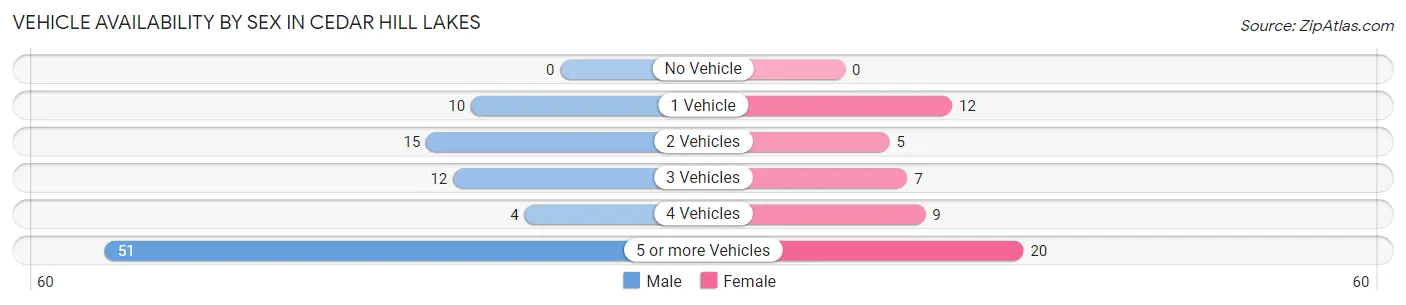
| Vehicles Available | Male | Female |
| No Vehicle | 0 (0.0%) | 0 (0.0%) |
| 1 Vehicle | 10 (10.9%) | 12 (22.6%) |
| 2 Vehicles | 15 (16.3%) | 5 (9.4%) |
| 3 Vehicles | 12 (13.0%) | 7 (13.2%) |
| 4 Vehicles | 4 (4.3%) | 9 (17.0%) |
| 5 or more Vehicles | 51 (55.4%) | 20 (37.7%) |
| Total | 92 (100.0%) | 53 (100.0%) |
Commute Time in Cedar Hill Lakes
The most frequently occuring commute durations in Cedar Hill Lakes are 45 to 59 minutes (32 commuters, 23.5%), 40 to 44 minutes (24 commuters, 17.6%), and 20 to 24 minutes (22 commuters, 16.2%).
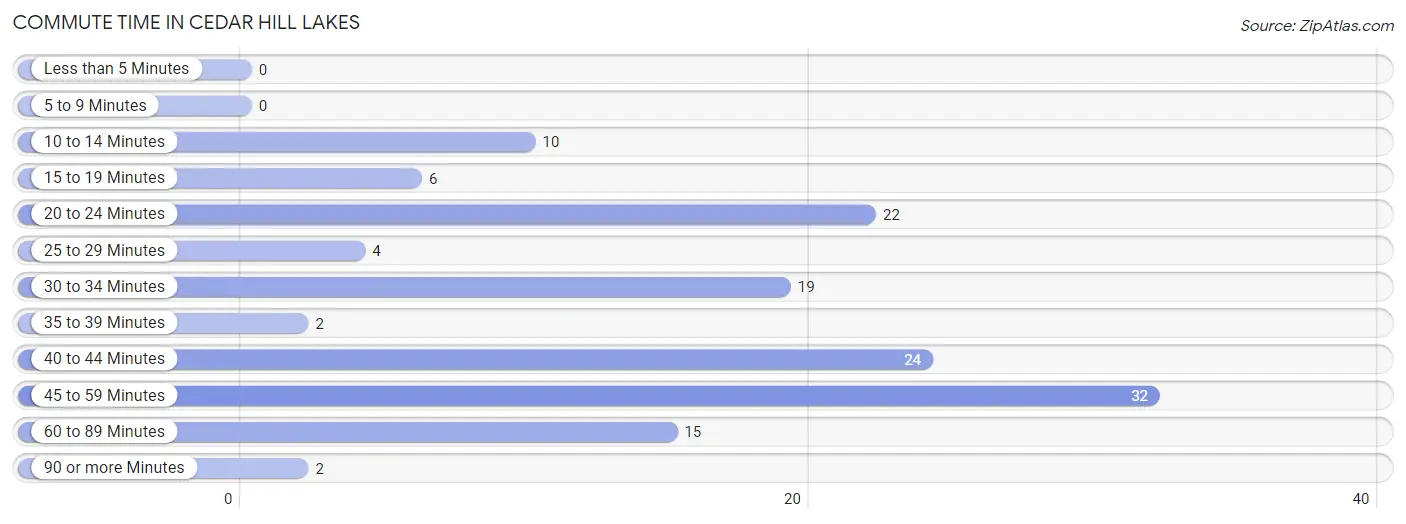
| Commute Time | # Commuters | % Commuters |
| Less than 5 Minutes | 0 | 0.0% |
| 5 to 9 Minutes | 0 | 0.0% |
| 10 to 14 Minutes | 10 | 7.3% |
| 15 to 19 Minutes | 6 | 4.4% |
| 20 to 24 Minutes | 22 | 16.2% |
| 25 to 29 Minutes | 4 | 2.9% |
| 30 to 34 Minutes | 19 | 14.0% |
| 35 to 39 Minutes | 2 | 1.5% |
| 40 to 44 Minutes | 24 | 17.6% |
| 45 to 59 Minutes | 32 | 23.5% |
| 60 to 89 Minutes | 15 | 11.0% |
| 90 or more Minutes | 2 | 1.5% |
Commute Time by Sex in Cedar Hill Lakes
The most common commute times in Cedar Hill Lakes are 20 to 24 minutes (22 commuters, 24.7%) for males and 40 to 44 minutes (23 commuters, 48.9%) for females.
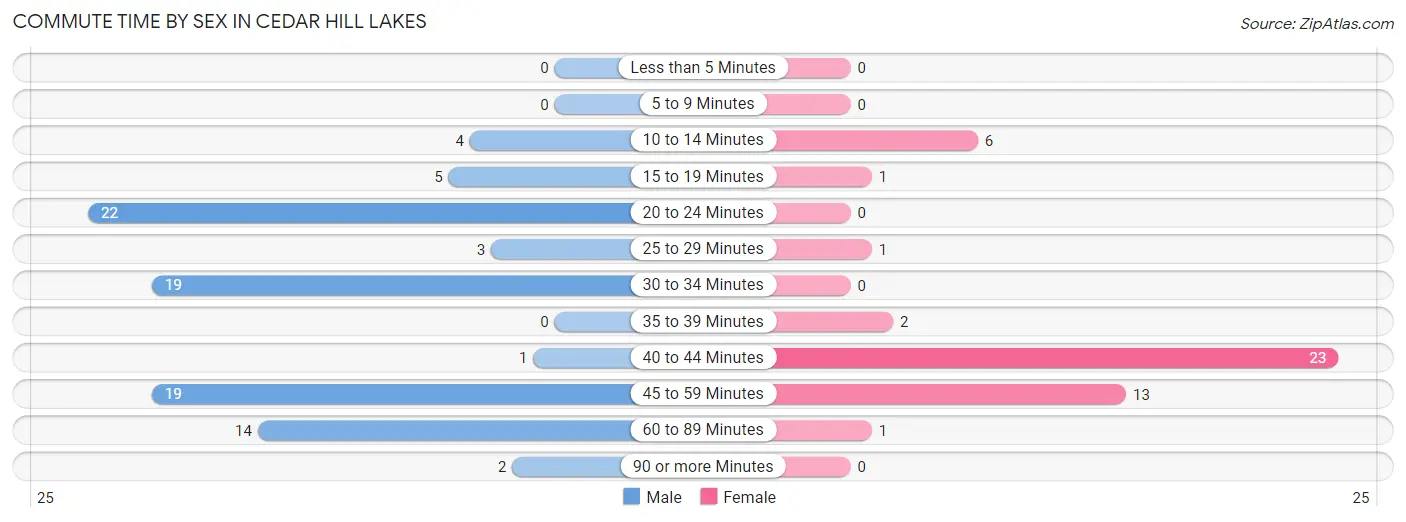
| Commute Time | Male | Female |
| Less than 5 Minutes | 0 (0.0%) | 0 (0.0%) |
| 5 to 9 Minutes | 0 (0.0%) | 0 (0.0%) |
| 10 to 14 Minutes | 4 (4.5%) | 6 (12.8%) |
| 15 to 19 Minutes | 5 (5.6%) | 1 (2.1%) |
| 20 to 24 Minutes | 22 (24.7%) | 0 (0.0%) |
| 25 to 29 Minutes | 3 (3.4%) | 1 (2.1%) |
| 30 to 34 Minutes | 19 (21.3%) | 0 (0.0%) |
| 35 to 39 Minutes | 0 (0.0%) | 2 (4.3%) |
| 40 to 44 Minutes | 1 (1.1%) | 23 (48.9%) |
| 45 to 59 Minutes | 19 (21.3%) | 13 (27.7%) |
| 60 to 89 Minutes | 14 (15.7%) | 1 (2.1%) |
| 90 or more Minutes | 2 (2.2%) | 0 (0.0%) |
Time of Departure to Work by Sex in Cedar Hill Lakes
The most frequent times of departure to work in Cedar Hill Lakes are 7:00 AM to 7:29 AM (25, 28.1%) for males and 8:00 AM to 8:29 AM (26, 55.3%) for females.
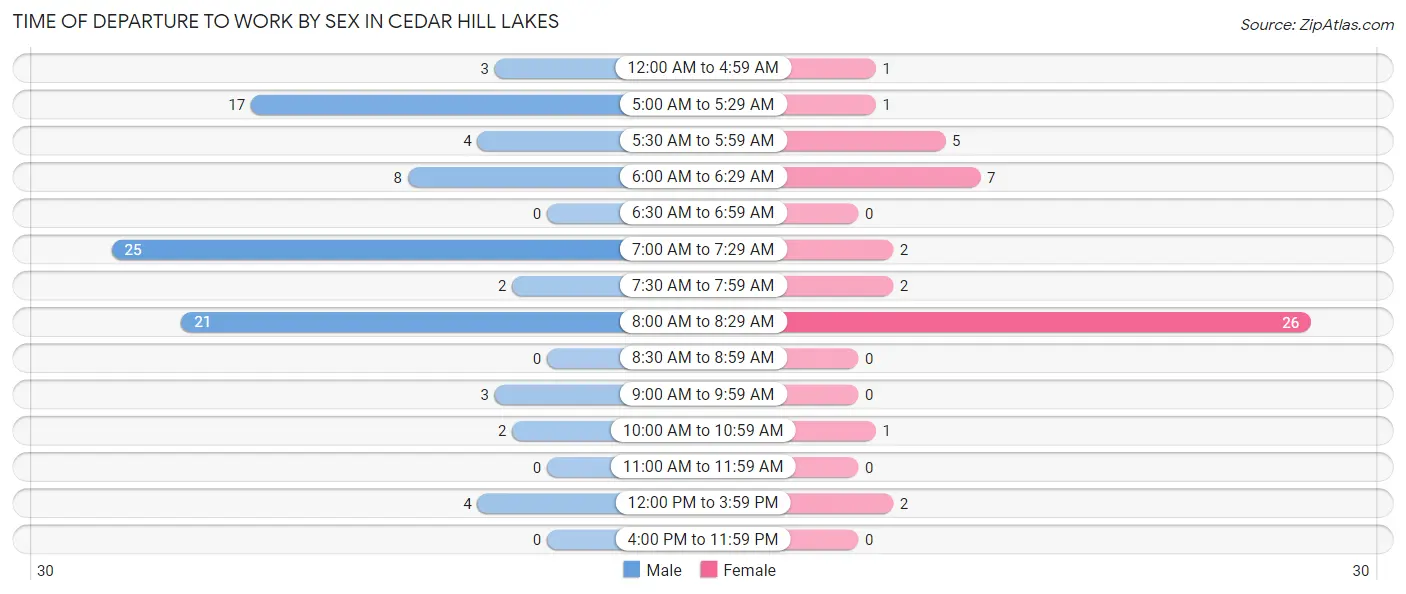
| Time of Departure | Male | Female |
| 12:00 AM to 4:59 AM | 3 (3.4%) | 1 (2.1%) |
| 5:00 AM to 5:29 AM | 17 (19.1%) | 1 (2.1%) |
| 5:30 AM to 5:59 AM | 4 (4.5%) | 5 (10.6%) |
| 6:00 AM to 6:29 AM | 8 (9.0%) | 7 (14.9%) |
| 6:30 AM to 6:59 AM | 0 (0.0%) | 0 (0.0%) |
| 7:00 AM to 7:29 AM | 25 (28.1%) | 2 (4.3%) |
| 7:30 AM to 7:59 AM | 2 (2.2%) | 2 (4.3%) |
| 8:00 AM to 8:29 AM | 21 (23.6%) | 26 (55.3%) |
| 8:30 AM to 8:59 AM | 0 (0.0%) | 0 (0.0%) |
| 9:00 AM to 9:59 AM | 3 (3.4%) | 0 (0.0%) |
| 10:00 AM to 10:59 AM | 2 (2.2%) | 1 (2.1%) |
| 11:00 AM to 11:59 AM | 0 (0.0%) | 0 (0.0%) |
| 12:00 PM to 3:59 PM | 4 (4.5%) | 2 (4.3%) |
| 4:00 PM to 11:59 PM | 0 (0.0%) | 0 (0.0%) |
| Total | 89 (100.0%) | 47 (100.0%) |
Housing Occupancy in Cedar Hill Lakes
Occupancy by Ownership in Cedar Hill Lakes
Of the total 101 dwellings in Cedar Hill Lakes, owner-occupied units account for 88 (87.1%), while renter-occupied units make up 13 (12.9%).
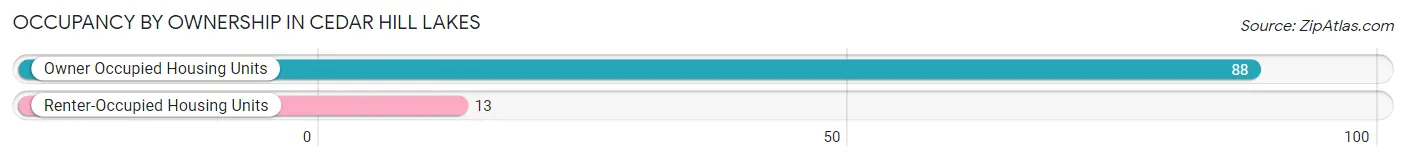
| Occupancy | # Housing Units | % Housing Units |
| Owner Occupied Housing Units | 88 | 87.1% |
| Renter-Occupied Housing Units | 13 | 12.9% |
| Total Occupied Housing Units | 101 | 100.0% |
Occupancy by Household Size in Cedar Hill Lakes
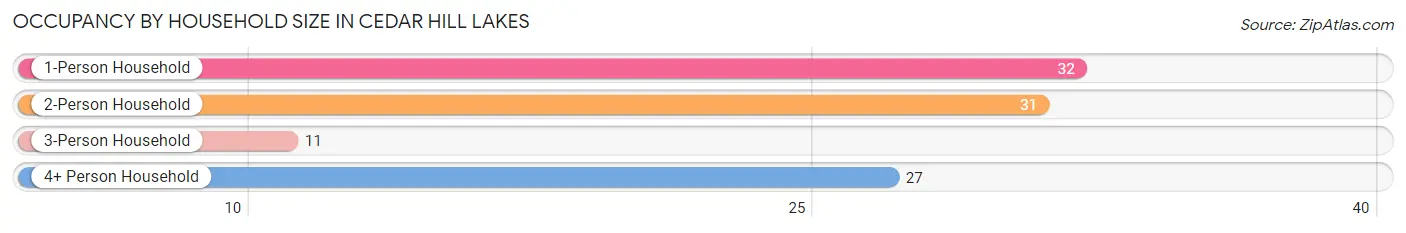
| Household Size | # Housing Units | % Housing Units |
| 1-Person Household | 32 | 31.7% |
| 2-Person Household | 31 | 30.7% |
| 3-Person Household | 11 | 10.9% |
| 4+ Person Household | 27 | 26.7% |
| Total Housing Units | 101 | 100.0% |
Occupancy by Ownership by Household Size in Cedar Hill Lakes
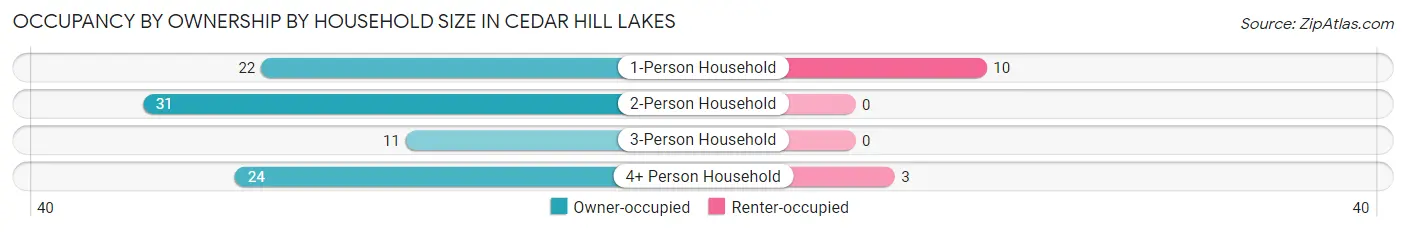
| Household Size | Owner-occupied | Renter-occupied |
| 1-Person Household | 22 (68.8%) | 10 (31.2%) |
| 2-Person Household | 31 (100.0%) | 0 (0.0%) |
| 3-Person Household | 11 (100.0%) | 0 (0.0%) |
| 4+ Person Household | 24 (88.9%) | 3 (11.1%) |
| Total Housing Units | 88 (87.1%) | 13 (12.9%) |
Occupancy by Educational Attainment in Cedar Hill Lakes
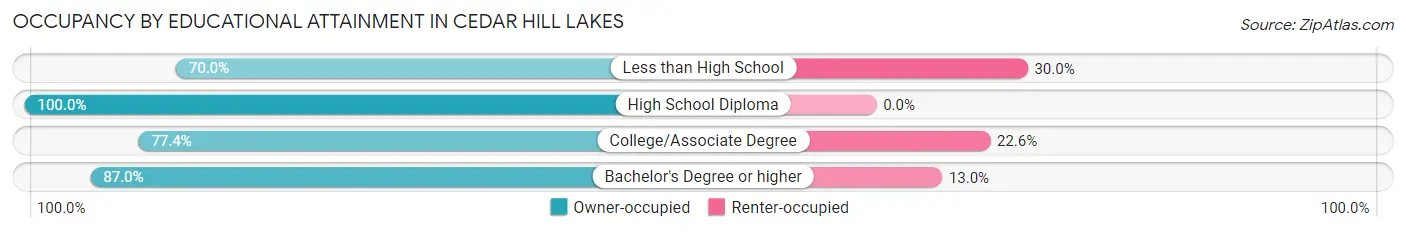
| Household Size | Owner-occupied | Renter-occupied |
| Less than High School | 7 (70.0%) | 3 (30.0%) |
| High School Diploma | 37 (100.0%) | 0 (0.0%) |
| College/Associate Degree | 24 (77.4%) | 7 (22.6%) |
| Bachelor's Degree or higher | 20 (87.0%) | 3 (13.0%) |
Occupancy by Age of Householder in Cedar Hill Lakes
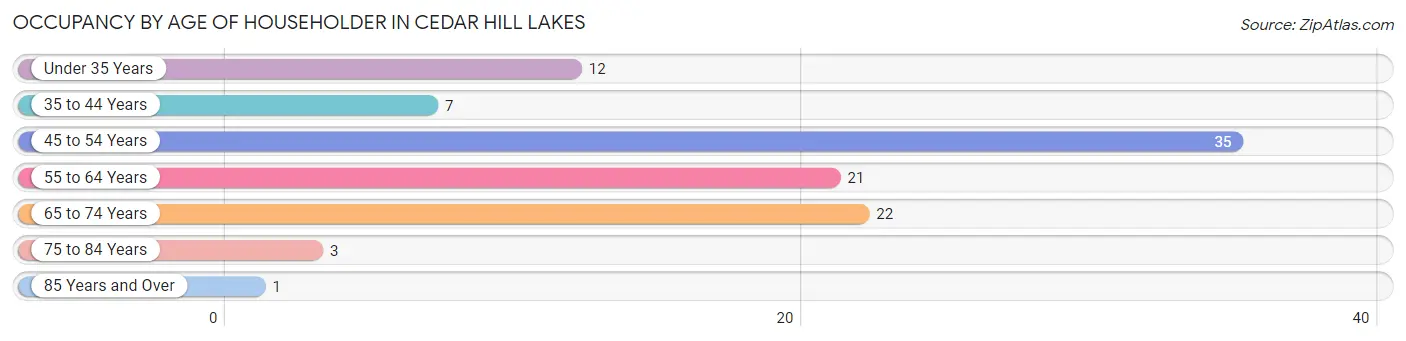
| Age Bracket | # Households | % Households |
| Under 35 Years | 12 | 11.9% |
| 35 to 44 Years | 7 | 6.9% |
| 45 to 54 Years | 35 | 34.6% |
| 55 to 64 Years | 21 | 20.8% |
| 65 to 74 Years | 22 | 21.8% |
| 75 to 84 Years | 3 | 3.0% |
| 85 Years and Over | 1 | 1.0% |
| Total | 101 | 100.0% |
Housing Finances in Cedar Hill Lakes
Median Income by Occupancy in Cedar Hill Lakes
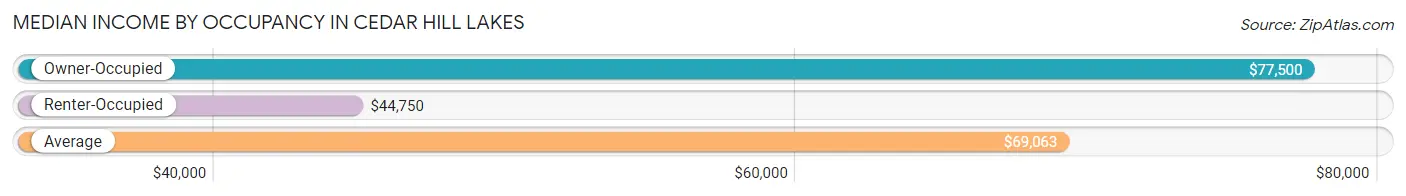
| Occupancy Type | # Households | Median Income |
| Owner-Occupied | 88 (87.1%) | $77,500 |
| Renter-Occupied | 13 (12.9%) | $44,750 |
| Average | 101 (100.0%) | $69,063 |
Occupancy by Householder Income Bracket in Cedar Hill Lakes
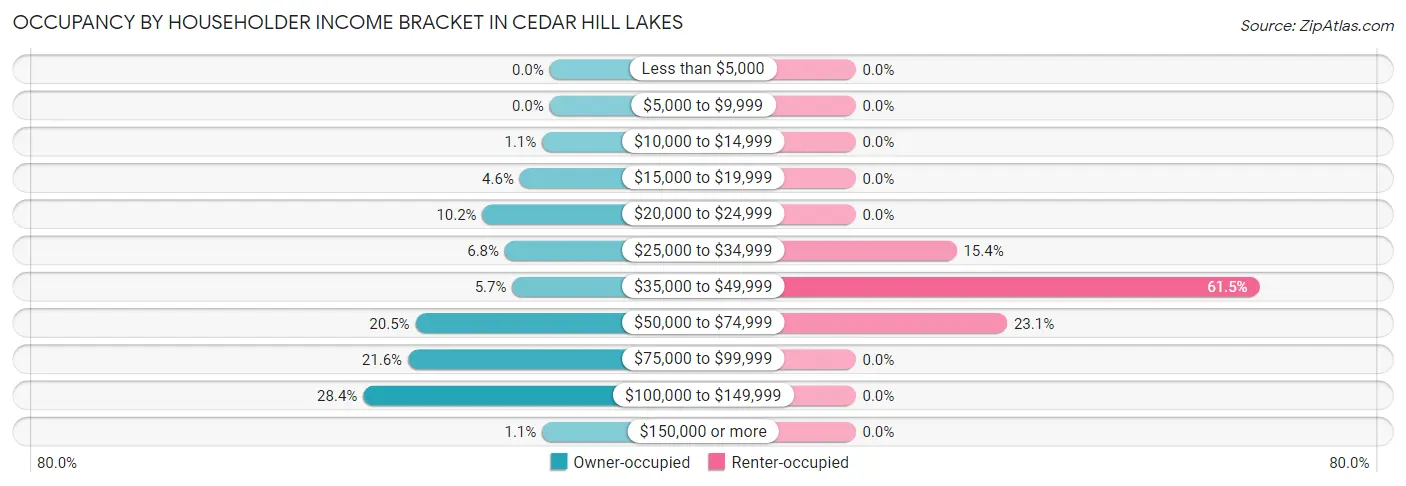
| Income Bracket | Owner-occupied | Renter-occupied |
| Less than $5,000 | 0 (0.0%) | 0 (0.0%) |
| $5,000 to $9,999 | 0 (0.0%) | 0 (0.0%) |
| $10,000 to $14,999 | 1 (1.1%) | 0 (0.0%) |
| $15,000 to $19,999 | 4 (4.5%) | 0 (0.0%) |
| $20,000 to $24,999 | 9 (10.2%) | 0 (0.0%) |
| $25,000 to $34,999 | 6 (6.8%) | 2 (15.4%) |
| $35,000 to $49,999 | 5 (5.7%) | 8 (61.5%) |
| $50,000 to $74,999 | 18 (20.4%) | 3 (23.1%) |
| $75,000 to $99,999 | 19 (21.6%) | 0 (0.0%) |
| $100,000 to $149,999 | 25 (28.4%) | 0 (0.0%) |
| $150,000 or more | 1 (1.1%) | 0 (0.0%) |
| Total | 88 (100.0%) | 13 (100.0%) |
Monthly Housing Cost Tiers in Cedar Hill Lakes
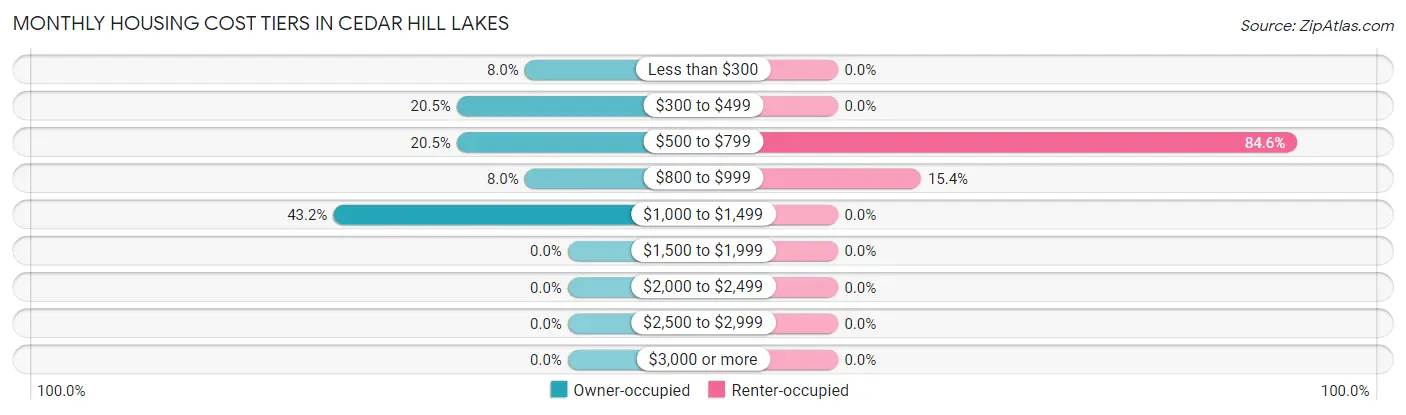
| Monthly Cost | Owner-occupied | Renter-occupied |
| Less than $300 | 7 (8.0%) | 0 (0.0%) |
| $300 to $499 | 18 (20.4%) | 0 (0.0%) |
| $500 to $799 | 18 (20.4%) | 11 (84.6%) |
| $800 to $999 | 7 (8.0%) | 2 (15.4%) |
| $1,000 to $1,499 | 38 (43.2%) | 0 (0.0%) |
| $1,500 to $1,999 | 0 (0.0%) | 0 (0.0%) |
| $2,000 to $2,499 | 0 (0.0%) | 0 (0.0%) |
| $2,500 to $2,999 | 0 (0.0%) | 0 (0.0%) |
| $3,000 or more | 0 (0.0%) | 0 (0.0%) |
| Total | 88 (100.0%) | 13 (100.0%) |
Physical Housing Characteristics in Cedar Hill Lakes
Housing Structures in Cedar Hill Lakes
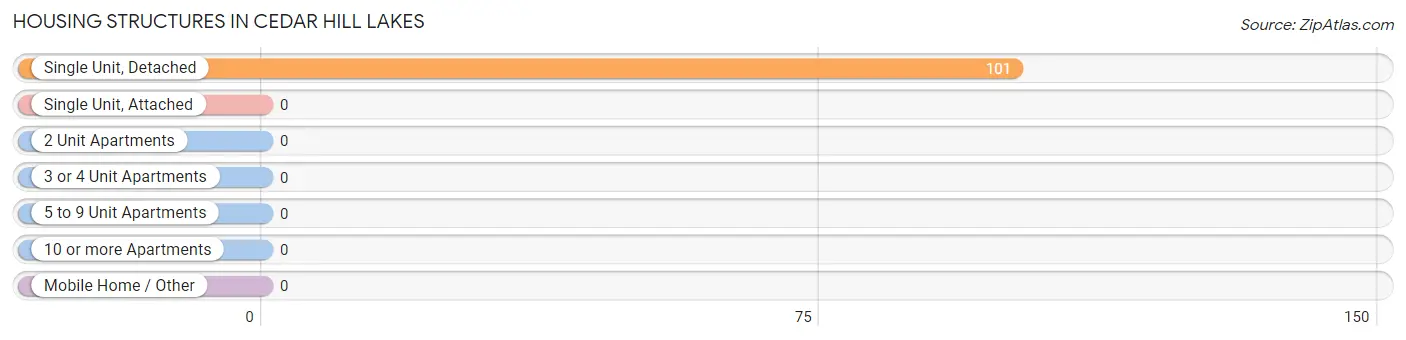
| Structure Type | # Housing Units | % Housing Units |
| Single Unit, Detached | 101 | 100.0% |
| Single Unit, Attached | 0 | 0.0% |
| 2 Unit Apartments | 0 | 0.0% |
| 3 or 4 Unit Apartments | 0 | 0.0% |
| 5 to 9 Unit Apartments | 0 | 0.0% |
| 10 or more Apartments | 0 | 0.0% |
| Mobile Home / Other | 0 | 0.0% |
| Total | 101 | 100.0% |
Housing Structures by Occupancy in Cedar Hill Lakes
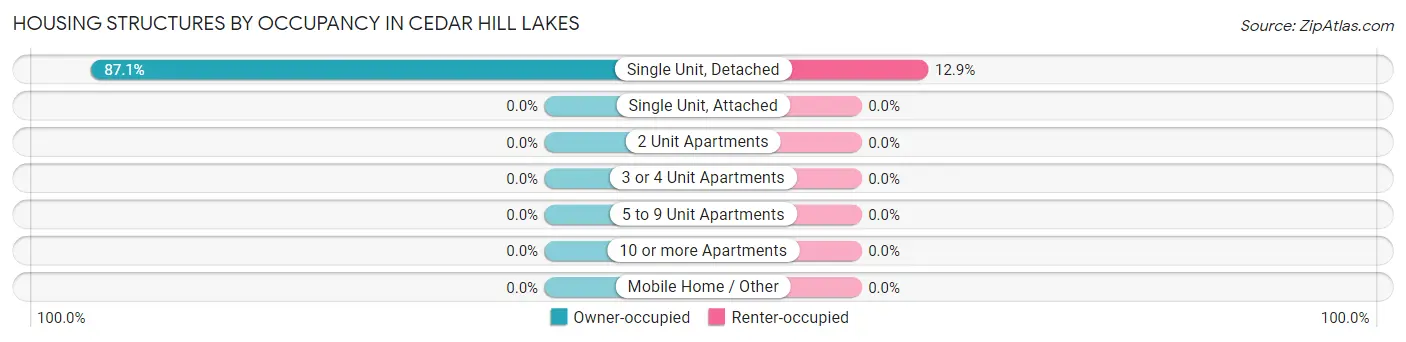
| Structure Type | Owner-occupied | Renter-occupied |
| Single Unit, Detached | 88 (87.1%) | 13 (12.9%) |
| Single Unit, Attached | 0 (0.0%) | 0 (0.0%) |
| 2 Unit Apartments | 0 (0.0%) | 0 (0.0%) |
| 3 or 4 Unit Apartments | 0 (0.0%) | 0 (0.0%) |
| 5 to 9 Unit Apartments | 0 (0.0%) | 0 (0.0%) |
| 10 or more Apartments | 0 (0.0%) | 0 (0.0%) |
| Mobile Home / Other | 0 (0.0%) | 0 (0.0%) |
| Total | 88 (87.1%) | 13 (12.9%) |
Housing Structures by Number of Rooms in Cedar Hill Lakes
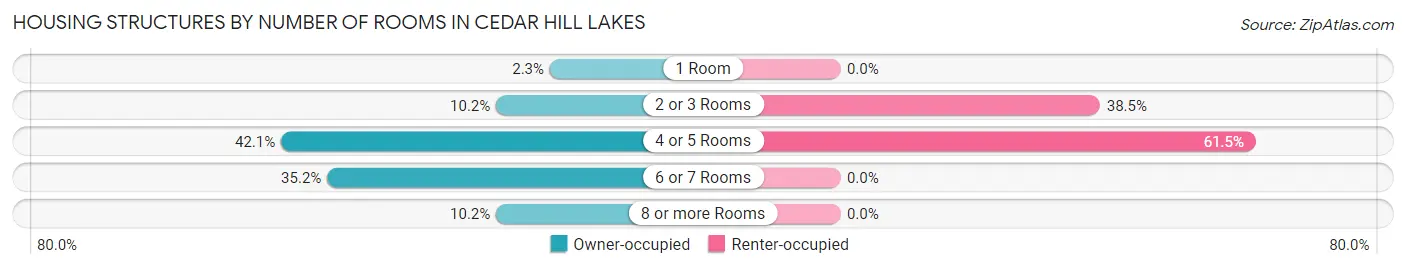
| Number of Rooms | Owner-occupied | Renter-occupied |
| 1 Room | 2 (2.3%) | 0 (0.0%) |
| 2 or 3 Rooms | 9 (10.2%) | 5 (38.5%) |
| 4 or 5 Rooms | 37 (42.0%) | 8 (61.5%) |
| 6 or 7 Rooms | 31 (35.2%) | 0 (0.0%) |
| 8 or more Rooms | 9 (10.2%) | 0 (0.0%) |
| Total | 88 (100.0%) | 13 (100.0%) |
Housing Structure by Heating Type in Cedar Hill Lakes
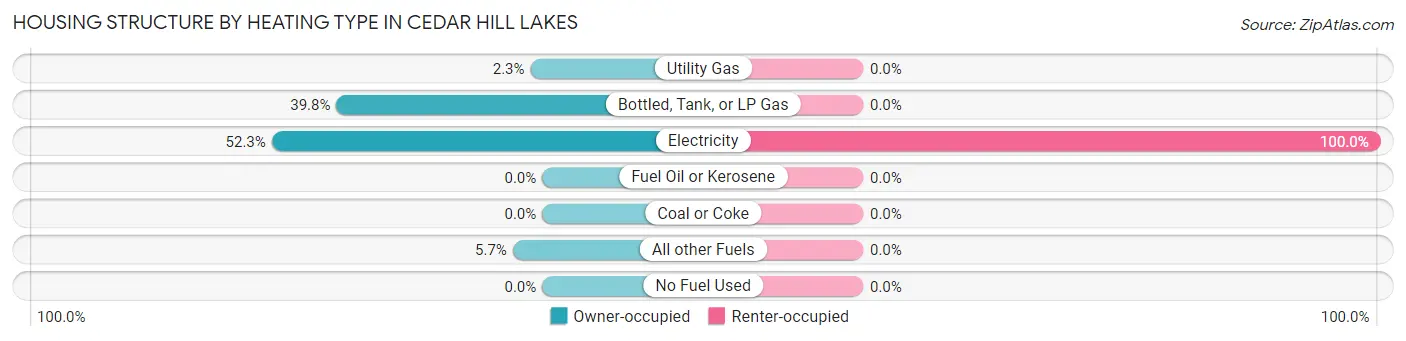
| Heating Type | Owner-occupied | Renter-occupied |
| Utility Gas | 2 (2.3%) | 0 (0.0%) |
| Bottled, Tank, or LP Gas | 35 (39.8%) | 0 (0.0%) |
| Electricity | 46 (52.3%) | 13 (100.0%) |
| Fuel Oil or Kerosene | 0 (0.0%) | 0 (0.0%) |
| Coal or Coke | 0 (0.0%) | 0 (0.0%) |
| All other Fuels | 5 (5.7%) | 0 (0.0%) |
| No Fuel Used | 0 (0.0%) | 0 (0.0%) |
| Total | 88 (100.0%) | 13 (100.0%) |
Household Vehicle Usage in Cedar Hill Lakes
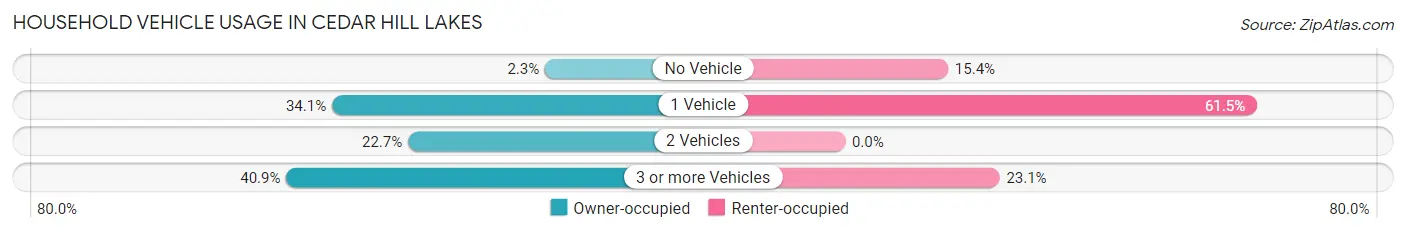
| Vehicles per Household | Owner-occupied | Renter-occupied |
| No Vehicle | 2 (2.3%) | 2 (15.4%) |
| 1 Vehicle | 30 (34.1%) | 8 (61.5%) |
| 2 Vehicles | 20 (22.7%) | 0 (0.0%) |
| 3 or more Vehicles | 36 (40.9%) | 3 (23.1%) |
| Total | 88 (100.0%) | 13 (100.0%) |
Real Estate & Mortgages in Cedar Hill Lakes
Real Estate and Mortgage Overview in Cedar Hill Lakes
| Characteristic | Without Mortgage | With Mortgage |
| Housing Units | 29 | 59 |
| Median Property Value | $112,500 | $129,300 |
| Median Household Income | $43,125 | $1 |
| Monthly Housing Costs | $415 | $0 |
| Real Estate Taxes | $1,075 | $0 |
Property Value by Mortgage Status in Cedar Hill Lakes
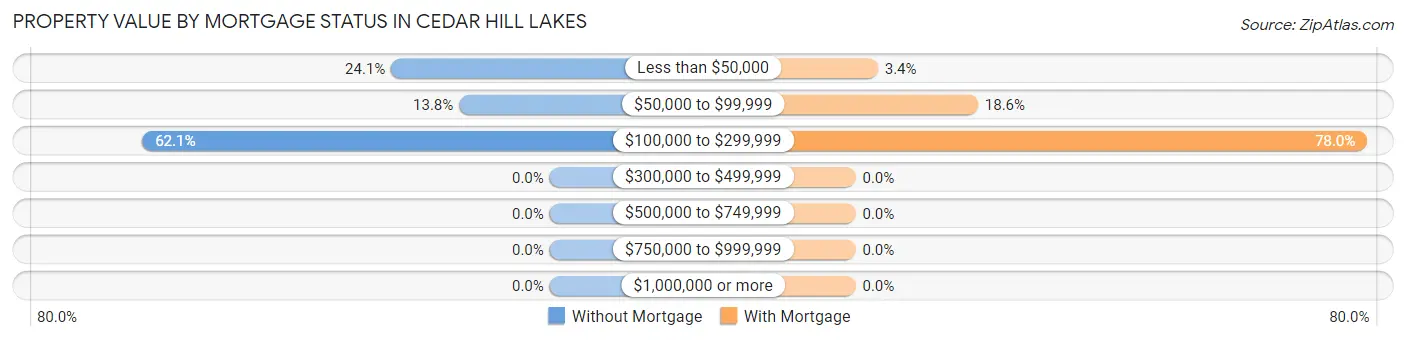
| Property Value | Without Mortgage | With Mortgage |
| Less than $50,000 | 7 (24.1%) | 2 (3.4%) |
| $50,000 to $99,999 | 4 (13.8%) | 11 (18.6%) |
| $100,000 to $299,999 | 18 (62.1%) | 46 (78.0%) |
| $300,000 to $499,999 | 0 (0.0%) | 0 (0.0%) |
| $500,000 to $749,999 | 0 (0.0%) | 0 (0.0%) |
| $750,000 to $999,999 | 0 (0.0%) | 0 (0.0%) |
| $1,000,000 or more | 0 (0.0%) | 0 (0.0%) |
| Total | 29 (100.0%) | 59 (100.0%) |
Household Income by Mortgage Status in Cedar Hill Lakes
| Household Income | Without Mortgage | With Mortgage |
| Less than $10,000 | 0 (0.0%) | 3 (5.1%) |
| $10,000 to $24,999 | 10 (34.5%) | 0 (0.0%) |
| $25,000 to $34,999 | 3 (10.3%) | 4 (6.8%) |
| $35,000 to $49,999 | 3 (10.3%) | 3 (5.1%) |
| $50,000 to $74,999 | 6 (20.7%) | 2 (3.4%) |
| $75,000 to $99,999 | 6 (20.7%) | 12 (20.3%) |
| $100,000 to $149,999 | 1 (3.5%) | 13 (22.0%) |
| $150,000 or more | 0 (0.0%) | 24 (40.7%) |
| Total | 29 (100.0%) | 59 (100.0%) |
Property Value to Household Income Ratio in Cedar Hill Lakes
| Value-to-Income Ratio | Without Mortgage | With Mortgage |
| Less than 2.0x | 13 (44.8%) | 87,083 (147,598.3%) |
| 2.0x to 2.9x | 9 (31.0%) | 44 (74.6%) |
| 3.0x to 3.9x | 2 (6.9%) | 8 (13.6%) |
| 4.0x or more | 5 (17.2%) | 1 (1.7%) |
| Total | 29 (100.0%) | 59 (100.0%) |
Real Estate Taxes by Mortgage Status in Cedar Hill Lakes
| Property Taxes | Without Mortgage | With Mortgage |
| Less than $800 | 12 (41.4%) | 0 (0.0%) |
| $800 to $1,499 | 11 (37.9%) | 3 (5.1%) |
| $800 to $1,499 | 6 (20.7%) | 27 (45.8%) |
| Total | 29 (100.0%) | 59 (100.0%) |
Health & Disability in Cedar Hill Lakes
Health Insurance Coverage by Age in Cedar Hill Lakes
| Age Bracket | With Coverage | Without Coverage |
| Under 6 Years | 13 (100.0%) | 0 (0.0%) |
| 6 to 18 Years | 40 (97.6%) | 1 (2.4%) |
| 19 to 25 Years | 58 (96.7%) | 2 (3.3%) |
| 26 to 34 Years | 17 (89.5%) | 2 (10.5%) |
| 35 to 44 Years | 20 (55.6%) | 16 (44.4%) |
| 45 to 54 Years | 37 (86.1%) | 6 (14.0%) |
| 55 to 64 Years | 30 (88.2%) | 4 (11.8%) |
| 65 to 74 Years | 29 (100.0%) | 0 (0.0%) |
| 75 Years and older | 7 (100.0%) | 0 (0.0%) |
| Total | 251 (89.0%) | 31 (11.0%) |
Health Insurance Coverage by Citizenship Status in Cedar Hill Lakes
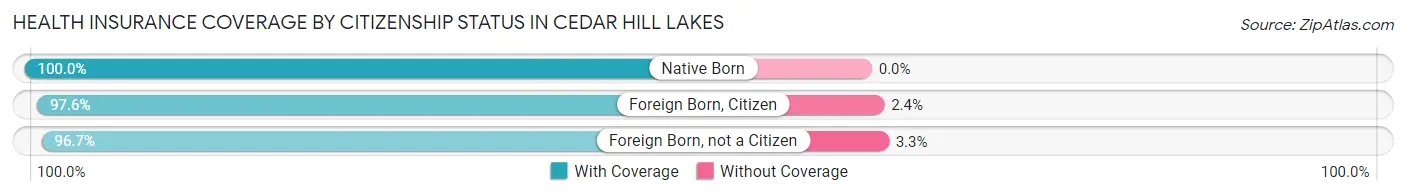
| Citizenship Status | With Coverage | Without Coverage |
| Native Born | 13 (100.0%) | 0 (0.0%) |
| Foreign Born, Citizen | 40 (97.6%) | 1 (2.4%) |
| Foreign Born, not a Citizen | 58 (96.7%) | 2 (3.3%) |
Health Insurance Coverage by Household Income in Cedar Hill Lakes
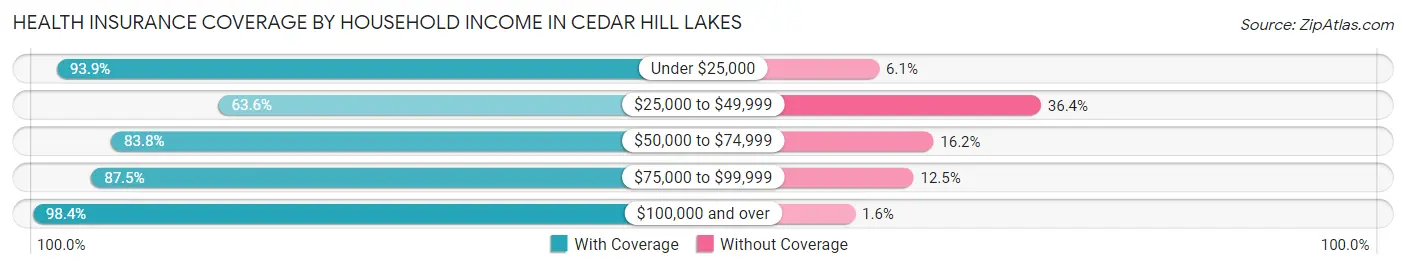
| Household Income | With Coverage | Without Coverage |
| Under $25,000 | 31 (93.9%) | 2 (6.1%) |
| $25,000 to $49,999 | 28 (63.6%) | 16 (36.4%) |
| $50,000 to $74,999 | 31 (83.8%) | 6 (16.2%) |
| $75,000 to $99,999 | 35 (87.5%) | 5 (12.5%) |
| $100,000 and over | 126 (98.4%) | 2 (1.6%) |
Public vs Private Health Insurance Coverage by Age in Cedar Hill Lakes
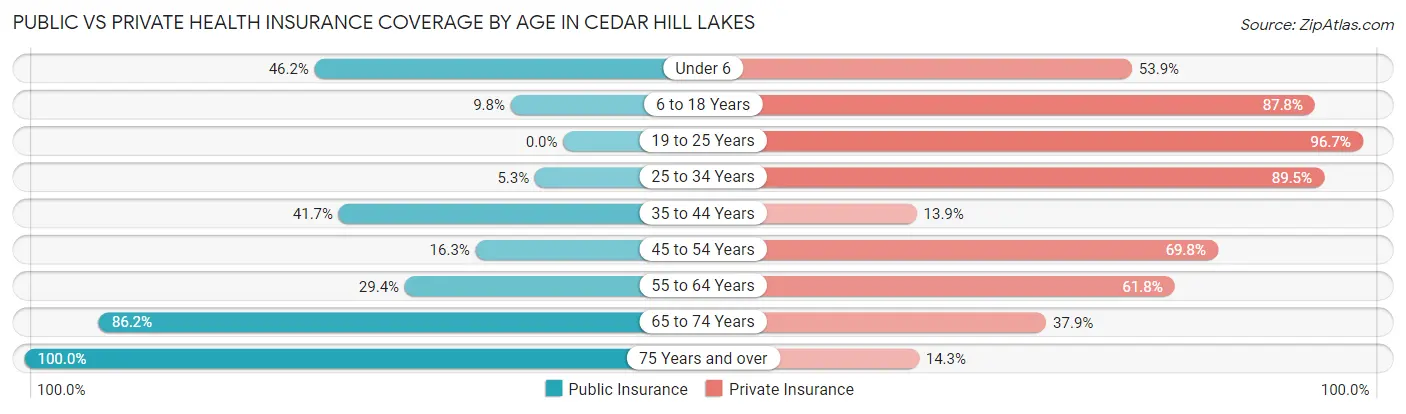
| Age Bracket | Public Insurance | Private Insurance |
| Under 6 | 6 (46.2%) | 7 (53.8%) |
| 6 to 18 Years | 4 (9.8%) | 36 (87.8%) |
| 19 to 25 Years | 0 (0.0%) | 58 (96.7%) |
| 25 to 34 Years | 1 (5.3%) | 17 (89.5%) |
| 35 to 44 Years | 15 (41.7%) | 5 (13.9%) |
| 45 to 54 Years | 7 (16.3%) | 30 (69.8%) |
| 55 to 64 Years | 10 (29.4%) | 21 (61.8%) |
| 65 to 74 Years | 25 (86.2%) | 11 (37.9%) |
| 75 Years and over | 7 (100.0%) | 1 (14.3%) |
| Total | 75 (26.6%) | 186 (66.0%) |
Disability Status by Sex by Age in Cedar Hill Lakes
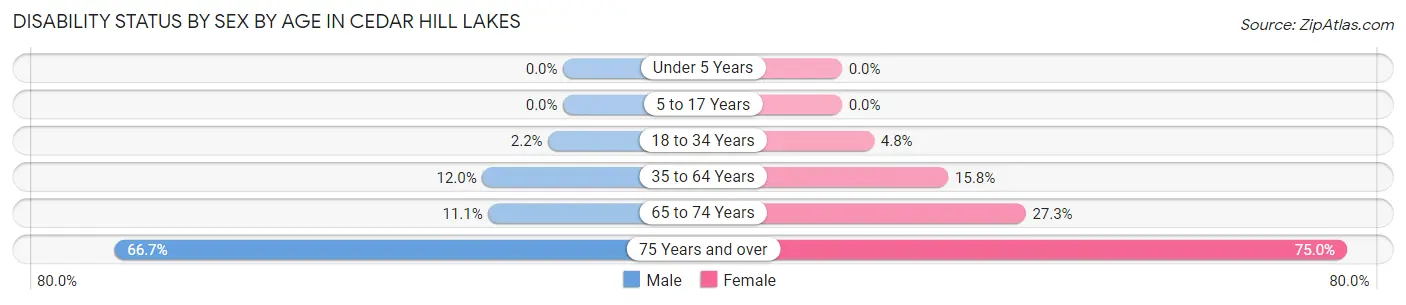
| Age Bracket | Male | Female |
| Under 5 Years | 0 (0.0%) | 0 (0.0%) |
| 5 to 17 Years | 0 (0.0%) | 0 (0.0%) |
| 18 to 34 Years | 1 (2.2%) | 3 (4.8%) |
| 35 to 64 Years | 9 (12.0%) | 6 (15.8%) |
| 65 to 74 Years | 2 (11.1%) | 3 (27.3%) |
| 75 Years and over | 2 (66.7%) | 3 (75.0%) |
Disability Class by Sex by Age in Cedar Hill Lakes
Disability Class: Hearing Difficulty
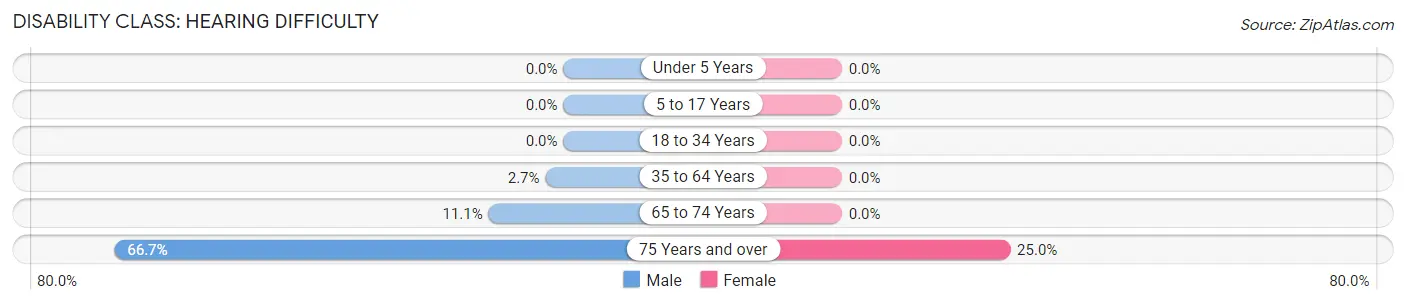
| Age Bracket | Male | Female |
| Under 5 Years | 0 (0.0%) | 0 (0.0%) |
| 5 to 17 Years | 0 (0.0%) | 0 (0.0%) |
| 18 to 34 Years | 0 (0.0%) | 0 (0.0%) |
| 35 to 64 Years | 2 (2.7%) | 0 (0.0%) |
| 65 to 74 Years | 2 (11.1%) | 0 (0.0%) |
| 75 Years and over | 2 (66.7%) | 1 (25.0%) |
Disability Class: Vision Difficulty
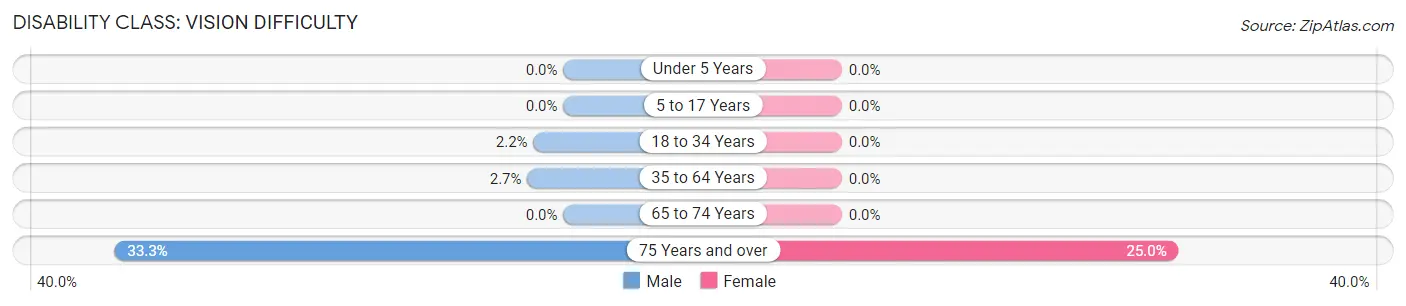
| Age Bracket | Male | Female |
| Under 5 Years | 0 (0.0%) | 0 (0.0%) |
| 5 to 17 Years | 0 (0.0%) | 0 (0.0%) |
| 18 to 34 Years | 1 (2.2%) | 0 (0.0%) |
| 35 to 64 Years | 2 (2.7%) | 0 (0.0%) |
| 65 to 74 Years | 0 (0.0%) | 0 (0.0%) |
| 75 Years and over | 1 (33.3%) | 1 (25.0%) |
Disability Class: Cognitive Difficulty
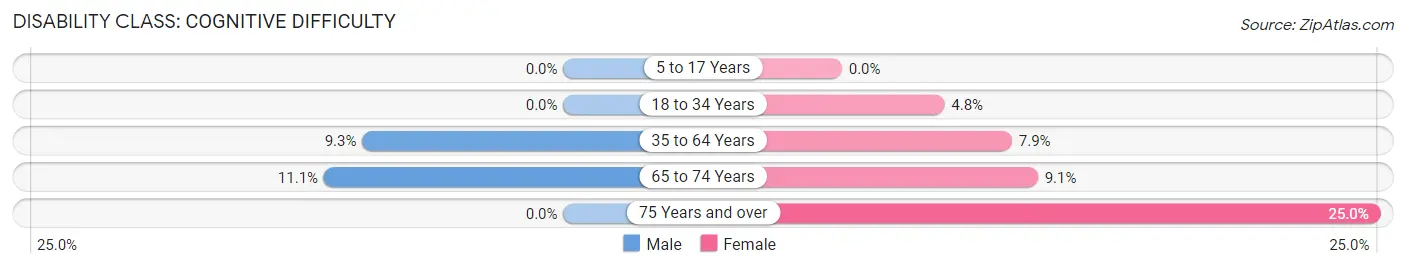
| Age Bracket | Male | Female |
| 5 to 17 Years | 0 (0.0%) | 0 (0.0%) |
| 18 to 34 Years | 0 (0.0%) | 3 (4.8%) |
| 35 to 64 Years | 7 (9.3%) | 3 (7.9%) |
| 65 to 74 Years | 2 (11.1%) | 1 (9.1%) |
| 75 Years and over | 0 (0.0%) | 1 (25.0%) |
Disability Class: Ambulatory Difficulty
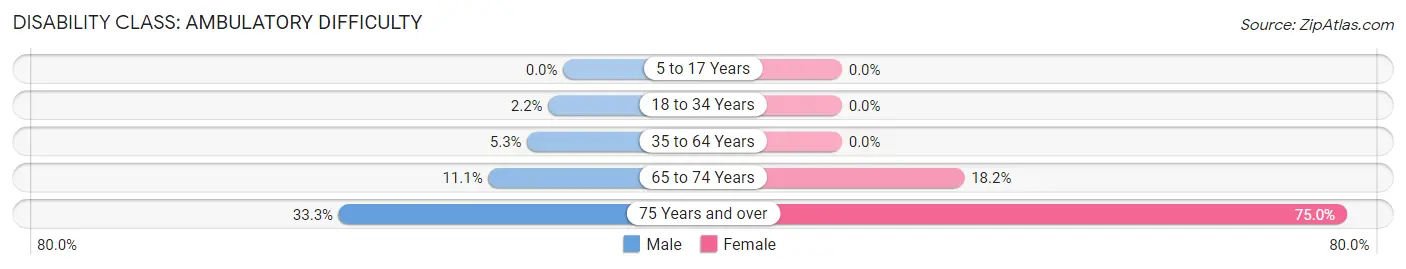
| Age Bracket | Male | Female |
| 5 to 17 Years | 0 (0.0%) | 0 (0.0%) |
| 18 to 34 Years | 1 (2.2%) | 0 (0.0%) |
| 35 to 64 Years | 4 (5.3%) | 0 (0.0%) |
| 65 to 74 Years | 2 (11.1%) | 2 (18.2%) |
| 75 Years and over | 1 (33.3%) | 3 (75.0%) |
Disability Class: Self-Care Difficulty
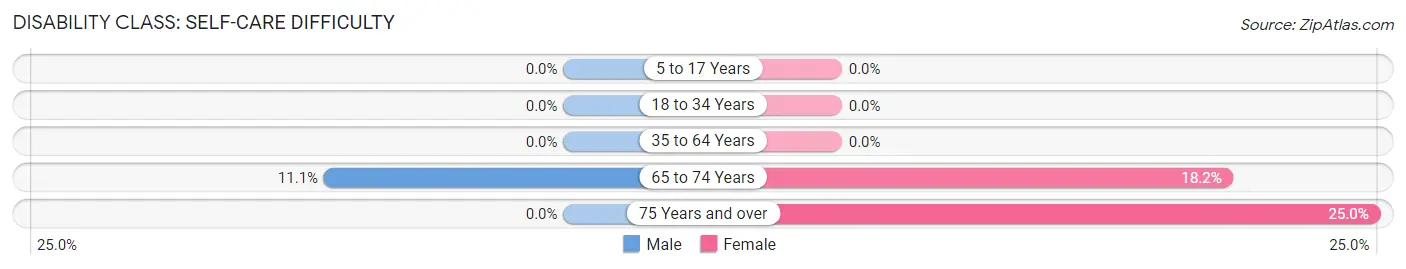
| Age Bracket | Male | Female |
| 5 to 17 Years | 0 (0.0%) | 0 (0.0%) |
| 18 to 34 Years | 0 (0.0%) | 0 (0.0%) |
| 35 to 64 Years | 0 (0.0%) | 0 (0.0%) |
| 65 to 74 Years | 2 (11.1%) | 2 (18.2%) |
| 75 Years and over | 0 (0.0%) | 1 (25.0%) |
Technology Access in Cedar Hill Lakes
Computing Device Access in Cedar Hill Lakes
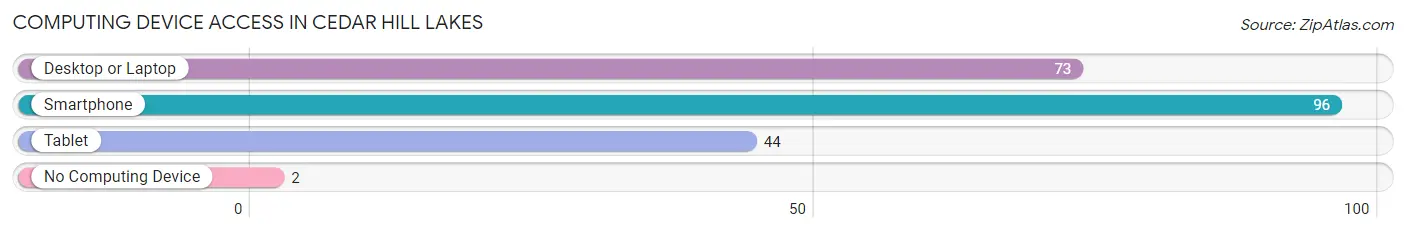
| Device Type | # Households | % Households |
| Desktop or Laptop | 73 | 72.3% |
| Smartphone | 96 | 95.1% |
| Tablet | 44 | 43.6% |
| No Computing Device | 2 | 2.0% |
| Total | 101 | 100.0% |
Internet Access in Cedar Hill Lakes
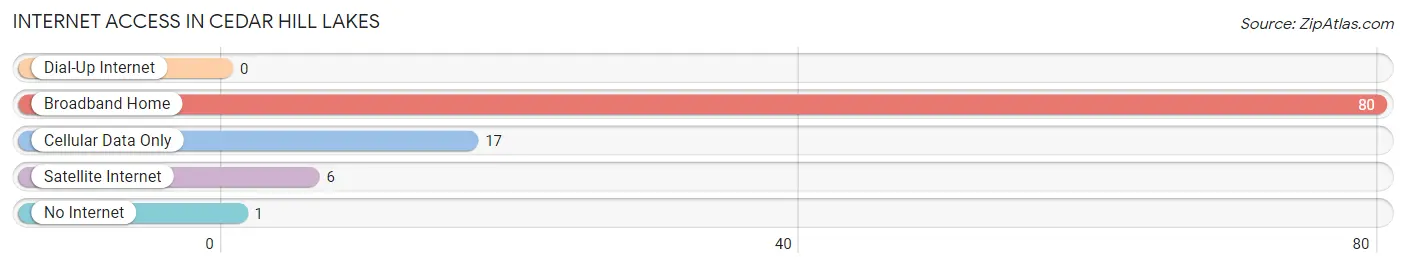
| Internet Type | # Households | % Households |
| Dial-Up Internet | 0 | 0.0% |
| Broadband Home | 80 | 79.2% |
| Cellular Data Only | 17 | 16.8% |
| Satellite Internet | 6 | 5.9% |
| No Internet | 1 | 1.0% |
| Total | 101 | 100.0% |
Cedar Hill Lakes Summary
Cedar Hill Lakes, Missouri is a small unincorporated community located in St. Louis County, Missouri. It is situated on the banks of the Meramec River, approximately 20 miles southwest of downtown St. Louis. The community is part of the Greater St. Louis metropolitan area and is home to a population of approximately 1,000 people.
History
Cedar Hill Lakes was first settled in the early 1800s by a group of German immigrants. The area was originally known as “Cedar Hill” and was home to a small farming community. In the late 1800s, the area was developed into a resort community and was renamed “Cedar Hill Lakes”. The resort was popular among St. Louisans who wanted to escape the city and enjoy the natural beauty of the area.
In the early 1900s, the area was developed further and a number of businesses were established. These included a general store, a post office, a blacksmith shop, and a hotel. The area also became a popular destination for fishing and boating.
In the 1950s, the area began to decline as the popularity of the resort began to wane. The area was eventually annexed by St. Louis County in the 1970s and has since become a quiet residential community.
Geography
Cedar Hill Lakes is located in St. Louis County, Missouri. It is situated on the banks of the Meramec River, approximately 20 miles southwest of downtown St. Louis. The community is part of the Greater St. Louis metropolitan area and is home to a population of approximately 1,000 people.
The area is characterized by rolling hills and wooded areas. The Meramec River runs through the area and provides a number of recreational opportunities, including fishing, boating, and swimming. The area is also home to a number of parks and trails, including the Cedar Hill Lakes Nature Trail.
Economy
Cedar Hill Lakes is primarily a residential community and does not have a large commercial or industrial base. The area is home to a number of small businesses, including restaurants, convenience stores, and gas stations. The area is also home to a number of small farms and ranches.
Demographics
As of the 2010 census, the population of Cedar Hill Lakes was 1,000. The racial makeup of the area was 97.2% White, 0.7% African American, 0.3% Native American, 0.2% Asian, 0.1% Pacific Islander, 0.2% from other races, and 1.3% from two or more races. Hispanic or Latino of any race were 1.3% of the population.
The median household income in Cedar Hill Lakes was $50,000, and the median family income was $54,000. The per capita income for the area was $21,000. The poverty rate was 8.3%.
Conclusion
Cedar Hill Lakes, Missouri is a small unincorporated community located in St. Louis County, Missouri. It is situated on the banks of the Meramec River, approximately 20 miles southwest of downtown St. Louis. The community is part of the Greater St. Louis metropolitan area and is home to a population of approximately 1,000 people. The area is characterized by rolling hills and wooded areas and is home to a number of small businesses, farms, and ranches. The population of Cedar Hill Lakes is primarily White, with a median household income of $50,000 and a poverty rate of 8.3%.
Common Questions
What is Per Capita Income in Cedar Hill Lakes?
Per Capita income in Cedar Hill Lakes is $26,813.
What is the Median Family Income in Cedar Hill Lakes?
Median Family Income in Cedar Hill Lakes is $90,625.
What is the Median Household income in Cedar Hill Lakes?
Median Household Income in Cedar Hill Lakes is $69,063.
What is Income or Wage Gap in Cedar Hill Lakes?
Income or Wage Gap in Cedar Hill Lakes is 10.3%.
Women in Cedar Hill Lakes earn 89.7 cents for every dollar earned by a man.
What is Inequality or Gini Index in Cedar Hill Lakes?
Inequality or Gini Index in Cedar Hill Lakes is 0.33.
What is the Total Population of Cedar Hill Lakes?
Total Population of Cedar Hill Lakes is 282.
What is the Total Male Population of Cedar Hill Lakes?
Total Male Population of Cedar Hill Lakes is 153.
What is the Total Female Population of Cedar Hill Lakes?
Total Female Population of Cedar Hill Lakes is 129.
What is the Ratio of Males per 100 Females in Cedar Hill Lakes?
There are 118.60 Males per 100 Females in Cedar Hill Lakes.
What is the Ratio of Females per 100 Males in Cedar Hill Lakes?
There are 84.31 Females per 100 Males in Cedar Hill Lakes.
What is the Median Population Age in Cedar Hill Lakes?
Median Population Age in Cedar Hill Lakes is 40.3 Years.
What is the Average Family Size in Cedar Hill Lakes
Average Family Size in Cedar Hill Lakes is 3.4 People.
What is the Average Household Size in Cedar Hill Lakes
Average Household Size in Cedar Hill Lakes is 2.8 People.
How Large is the Labor Force in Cedar Hill Lakes?
There are 155 People in the Labor Forcein in Cedar Hill Lakes.
What is the Percentage of People in the Labor Force in Cedar Hill Lakes?
60.1% of People are in the Labor Force in Cedar Hill Lakes.
What is the Unemployment Rate in Cedar Hill Lakes?
Unemployment Rate in Cedar Hill Lakes is 3.9%.