Claxton, GA Map & Demographics
Claxton Map
Claxton Overview
$19,708
PER CAPITA INCOME
$56,649
AVG FAMILY INCOME
$40,870
AVG HOUSEHOLD INCOME
39.9%
WAGE / INCOME GAP [ % ]
60.1¢/ $1
WAGE / INCOME GAP [ $ ]
0.42
INEQUALITY / GINI INDEX
2,573
TOTAL POPULATION
1,266
MALE POPULATION
1,307
FEMALE POPULATION
96.86
MALES / 100 FEMALES
103.24
FEMALES / 100 MALES
36.9
MEDIAN AGE
3.4
AVG FAMILY SIZE
2.6
AVG HOUSEHOLD SIZE
1,110
LABOR FORCE [ PEOPLE ]
54.9%
PERCENT IN LABOR FORCE
3.2%
UNEMPLOYMENT RATE
Claxton Zip Codes
Claxton Area Codes
Income in Claxton
Income Overview in Claxton
Per Capita Income in Claxton is $19,708, while median incomes of families and households are $56,649 and $40,870 respectively.
| Characteristic | Number | Measure |
| Per Capita Income | 2,573 | $19,708 |
| Median Family Income | 546 | $56,649 |
| Mean Family Income | 546 | $62,313 |
| Median Household Income | 968 | $40,870 |
| Mean Household Income | 968 | $51,477 |
| Income Deficit | 546 | $0 |
| Wage / Income Gap (%) | 2,573 | 39.90% |
| Wage / Income Gap ($) | 2,573 | 60.10¢ per $1 |
| Gini / Inequality Index | 2,573 | 0.42 |
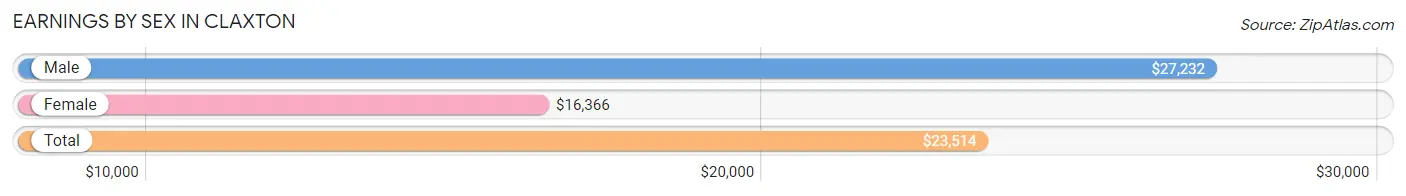
Earnings by Sex in Claxton
Average Earnings in Claxton are $23,514, $27,232 for men and $16,366 for women, a difference of 39.9%.
| Sex | Number | Average Earnings |
| Male | 681 (59.1%) | $27,232 |
| Female | 471 (40.9%) | $16,366 |
| Total | 1,152 (100.0%) | $23,514 |
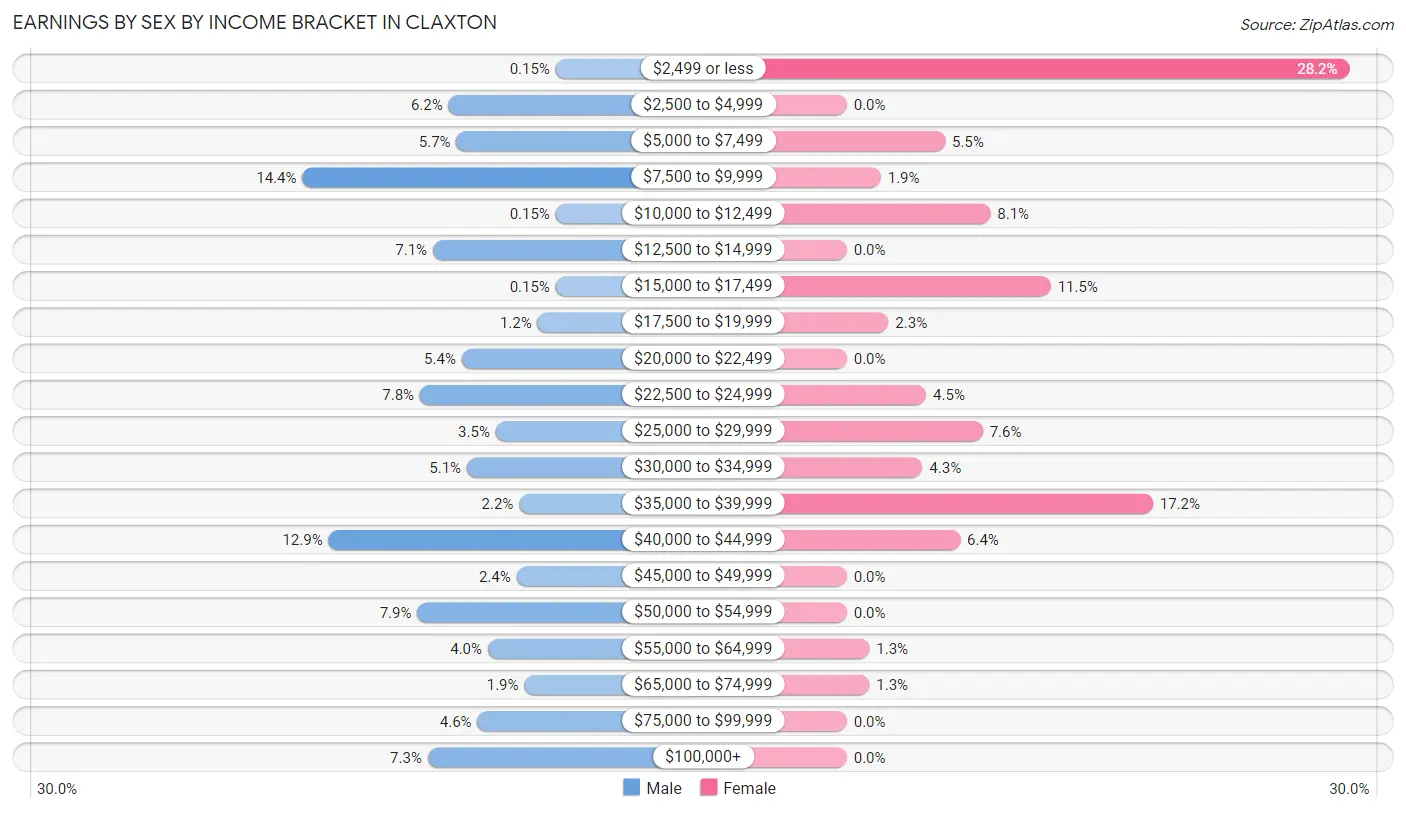
Earnings by Sex by Income Bracket in Claxton
The most common earnings brackets in Claxton are $7,500 to $9,999 for men (98 | 14.4%) and $2,499 or less for women (133 | 28.2%).
| Income | Male | Female |
| $2,499 or less | 1 (0.2%) | 133 (28.2%) |
| $2,500 to $4,999 | 42 (6.2%) | 0 (0.0%) |
| $5,000 to $7,499 | 39 (5.7%) | 26 (5.5%) |
| $7,500 to $9,999 | 98 (14.4%) | 9 (1.9%) |
| $10,000 to $12,499 | 1 (0.2%) | 38 (8.1%) |
| $12,500 to $14,999 | 48 (7.0%) | 0 (0.0%) |
| $15,000 to $17,499 | 1 (0.2%) | 54 (11.5%) |
| $17,500 to $19,999 | 8 (1.2%) | 11 (2.3%) |
| $20,000 to $22,499 | 37 (5.4%) | 0 (0.0%) |
| $22,500 to $24,999 | 53 (7.8%) | 21 (4.5%) |
| $25,000 to $29,999 | 24 (3.5%) | 36 (7.6%) |
| $30,000 to $34,999 | 35 (5.1%) | 20 (4.3%) |
| $35,000 to $39,999 | 15 (2.2%) | 81 (17.2%) |
| $40,000 to $44,999 | 88 (12.9%) | 30 (6.4%) |
| $45,000 to $49,999 | 16 (2.4%) | 0 (0.0%) |
| $50,000 to $54,999 | 54 (7.9%) | 0 (0.0%) |
| $55,000 to $64,999 | 27 (4.0%) | 6 (1.3%) |
| $65,000 to $74,999 | 13 (1.9%) | 6 (1.3%) |
| $75,000 to $99,999 | 31 (4.5%) | 0 (0.0%) |
| $100,000+ | 50 (7.3%) | 0 (0.0%) |
| Total | 681 (100.0%) | 471 (100.0%) |
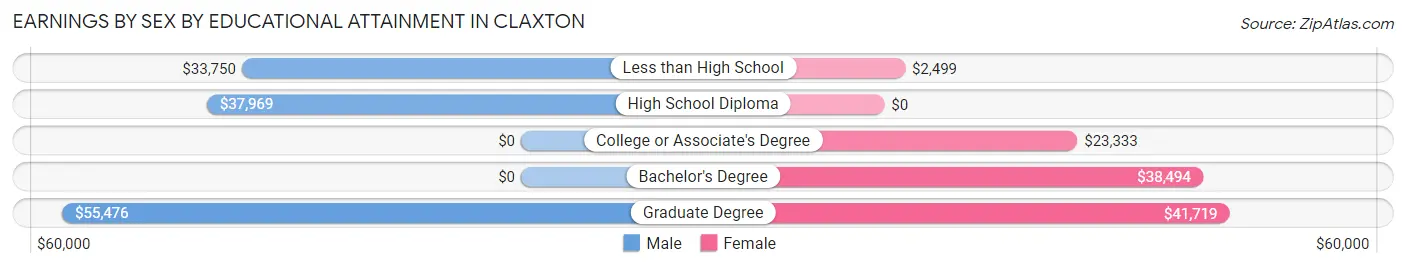
Earnings by Sex by Educational Attainment in Claxton
Average earnings in Claxton are $40,226 for men and $24,286 for women, a difference of 39.6%. Men with an educational attainment of graduate degree enjoy the highest average annual earnings of $55,476, while those with less than high school education earn the least with $33,750. Women with an educational attainment of graduate degree earn the most with the average annual earnings of $41,719, while those with less than high school education have the smallest earnings of $2,499.
| Educational Attainment | Male Income | Female Income |
| Less than High School | $33,750 | $2,499 |
| High School Diploma | $37,969 | $0 |
| College or Associate's Degree | - | - |
| Bachelor's Degree | - | - |
| Graduate Degree | $55,476 | $41,719 |
| Total | $40,226 | $24,286 |
Family Income in Claxton
Family Income Brackets in Claxton
According to the Claxton family income data, there are 120 families falling into the $50,000 to $74,999 income range, which is the most common income bracket and makes up 22.0% of all families. Conversely, the $35,000 to $49,999 income bracket is the least frequent group with only 2 families (0.4%) belonging to this category.
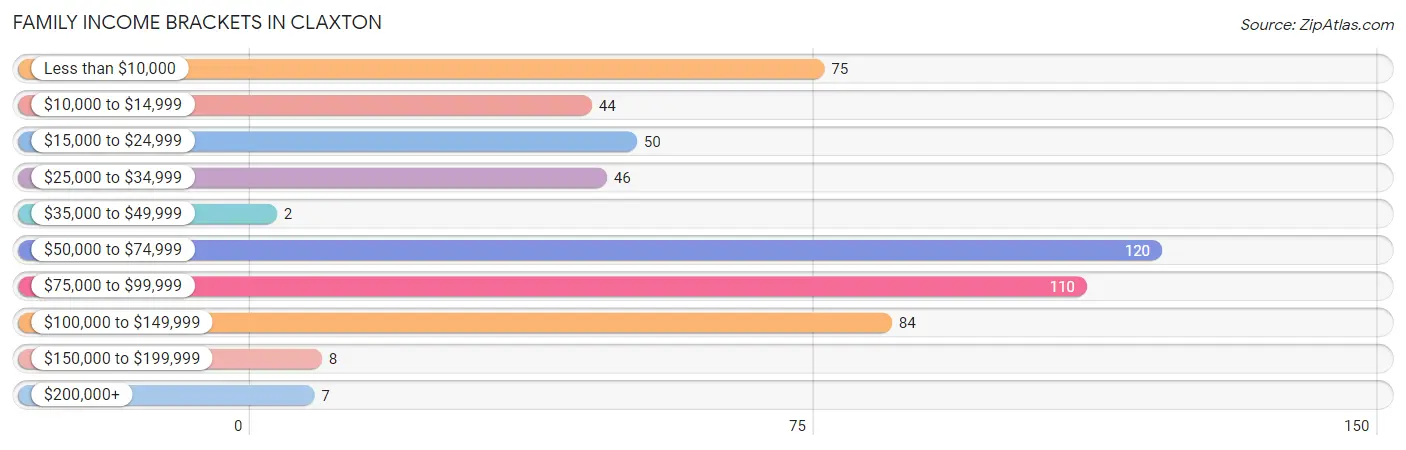
| Income Bracket | # Families | % Families |
| Less than $10,000 | 75 | 13.7% |
| $10,000 to $14,999 | 44 | 8.1% |
| $15,000 to $24,999 | 50 | 9.2% |
| $25,000 to $34,999 | 46 | 8.4% |
| $35,000 to $49,999 | 2 | 0.4% |
| $50,000 to $74,999 | 120 | 22.0% |
| $75,000 to $99,999 | 110 | 20.1% |
| $100,000 to $149,999 | 84 | 15.4% |
| $150,000 to $199,999 | 8 | 1.5% |
| $200,000+ | 7 | 1.3% |
Family Income by Famaliy Size in Claxton
5-person families (81 | 14.8%) account for the highest median family income in Claxton with $97,750 per family, while 2-person families (246 | 45.1%) have the highest median income of $28,165 per family member.
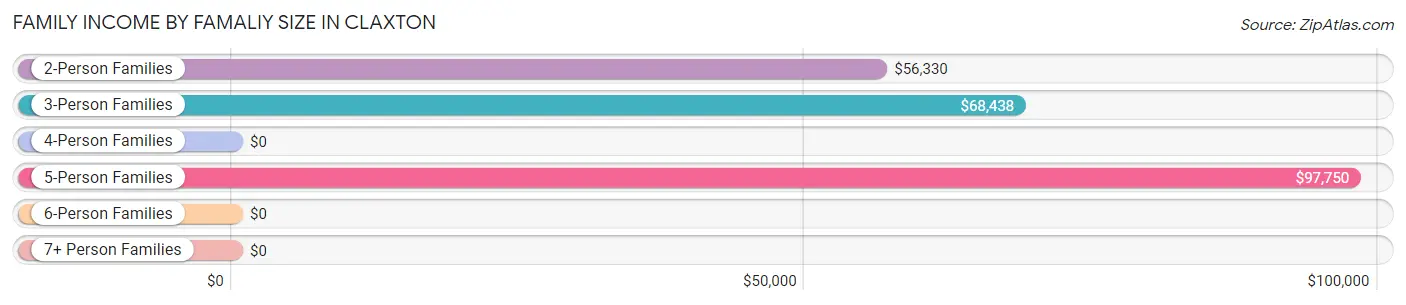
| Income Bracket | # Families | Median Income |
| 2-Person Families | 246 (45.1%) | $56,330 |
| 3-Person Families | 113 (20.7%) | $68,438 |
| 4-Person Families | 106 (19.4%) | $0 |
| 5-Person Families | 81 (14.8%) | $97,750 |
| 6-Person Families | 0 (0.0%) | $0 |
| 7+ Person Families | 0 (0.0%) | $0 |
| Total | 546 (100.0%) | $56,649 |
Family Income by Number of Earners in Claxton
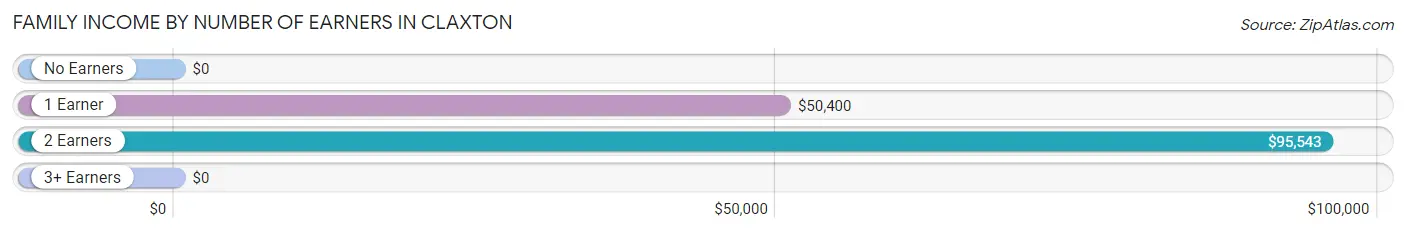
| Number of Earners | # Families | Median Income |
| No Earners | 131 (24.0%) | $0 |
| 1 Earner | 178 (32.6%) | $50,400 |
| 2 Earners | 220 (40.3%) | $95,543 |
| 3+ Earners | 17 (3.1%) | $0 |
| Total | 546 (100.0%) | $56,649 |
Household Income in Claxton
Household Income Brackets in Claxton
With 234 households falling in the category, the $50,000 to $74,999 income range is the most frequent in Claxton, accounting for 24.2% of all households. In contrast, only 7 households (0.7%) fall into the $200,000+ income bracket, making it the least populous group.
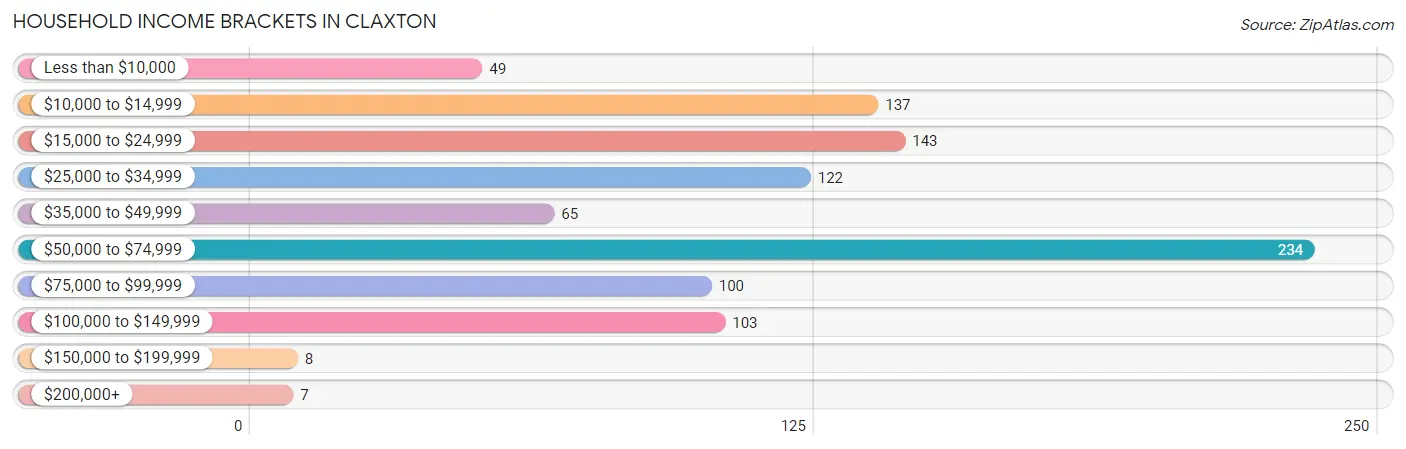
| Income Bracket | # Households | % Households |
| Less than $10,000 | 49 | 5.1% |
| $10,000 to $14,999 | 137 | 14.2% |
| $15,000 to $24,999 | 143 | 14.8% |
| $25,000 to $34,999 | 122 | 12.6% |
| $35,000 to $49,999 | 65 | 6.7% |
| $50,000 to $74,999 | 234 | 24.2% |
| $75,000 to $99,999 | 100 | 10.3% |
| $100,000 to $149,999 | 103 | 10.6% |
| $150,000 to $199,999 | 8 | 0.8% |
| $200,000+ | 7 | 0.7% |
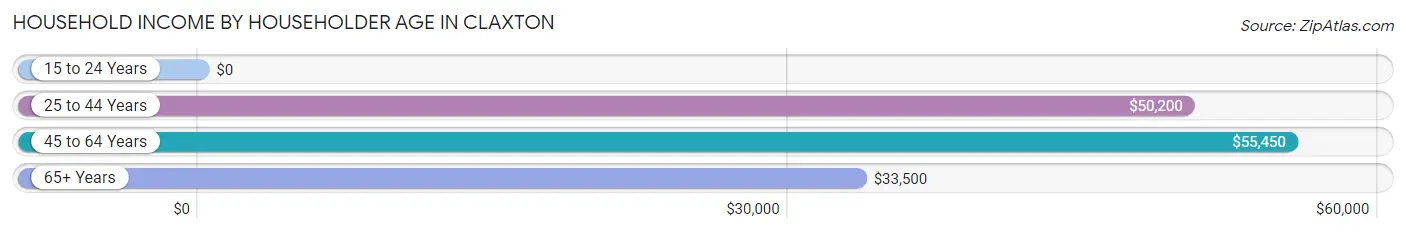
Household Income by Householder Age in Claxton
The median household income in Claxton is $40,870, with the highest median household income of $55,450 found in the 45 to 64 years age bracket for the primary householder. A total of 279 households (28.8%) fall into this category. Meanwhile, the 15 to 24 years age bracket for the primary householder has the lowest median household income of $0, with 7 households (0.7%) in this group.
| Income Bracket | # Households | Median Income |
| 15 to 24 Years | 7 (0.7%) | $0 |
| 25 to 44 Years | 350 (36.2%) | $50,200 |
| 45 to 64 Years | 279 (28.8%) | $55,450 |
| 65+ Years | 332 (34.3%) | $33,500 |
| Total | 968 (100.0%) | $40,870 |
Poverty in Claxton
Income Below Poverty by Sex and Age in Claxton
With 23.5% poverty level for males and 33.4% for females among the residents of Claxton, 5 year old males and 18 to 24 year old females are the most vulnerable to poverty, with 6 males (100.0%) and 81 females (72.3%) in their respective age groups living below the poverty level.
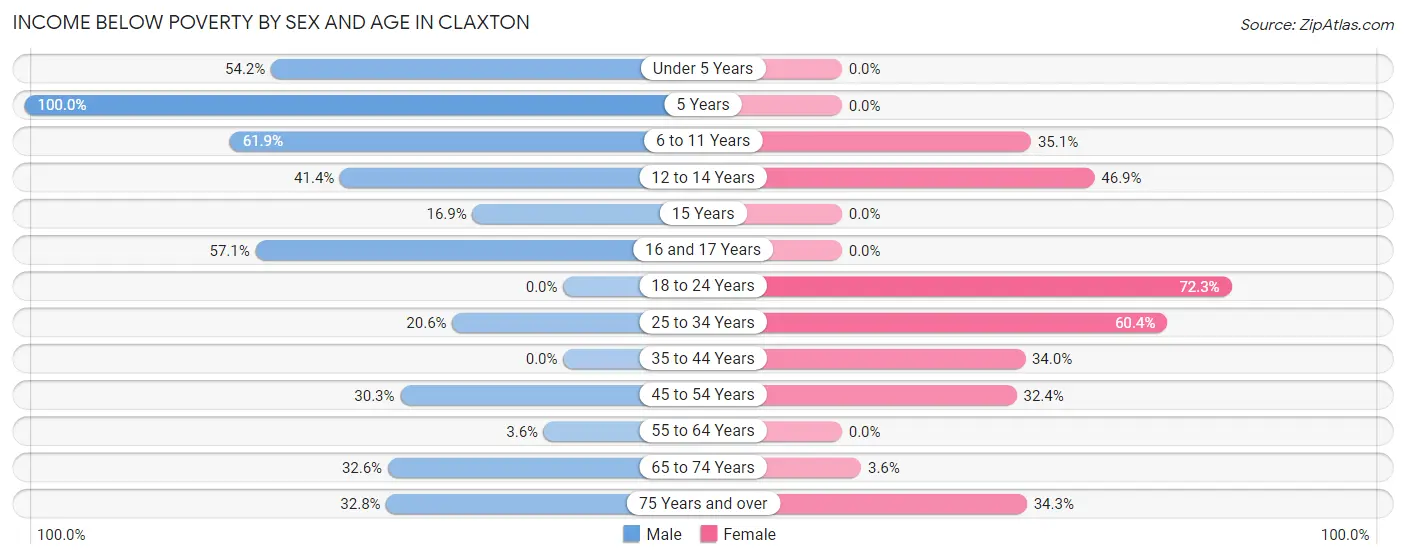
| Age Bracket | Male | Female |
| Under 5 Years | 32 (54.2%) | 0 (0.0%) |
| 5 Years | 6 (100.0%) | 0 (0.0%) |
| 6 to 11 Years | 39 (61.9%) | 72 (35.1%) |
| 12 to 14 Years | 29 (41.4%) | 15 (46.9%) |
| 15 Years | 15 (16.9%) | 0 (0.0%) |
| 16 and 17 Years | 8 (57.1%) | 0 (0.0%) |
| 18 to 24 Years | 0 (0.0%) | 81 (72.3%) |
| 25 to 34 Years | 35 (20.6%) | 90 (60.4%) |
| 35 to 44 Years | 0 (0.0%) | 51 (34.0%) |
| 45 to 54 Years | 49 (30.2%) | 48 (32.4%) |
| 55 to 64 Years | 3 (3.6%) | 0 (0.0%) |
| 65 to 74 Years | 56 (32.6%) | 5 (3.6%) |
| 75 Years and over | 22 (32.8%) | 69 (34.3%) |
| Total | 294 (23.5%) | 431 (33.4%) |
Income Above Poverty by Sex and Age in Claxton
According to the poverty statistics in Claxton, males aged 18 to 24 years and females aged under 5 years are the age groups that are most secure financially, with 100.0% of males and 100.0% of females in these age groups living above the poverty line.
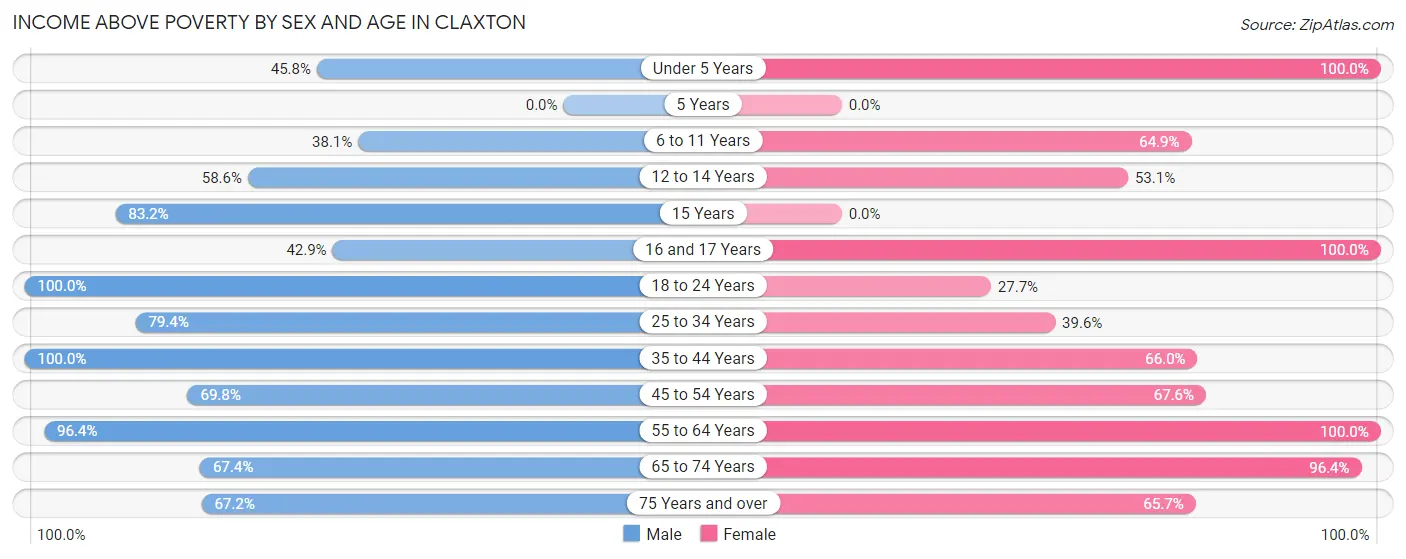
| Age Bracket | Male | Female |
| Under 5 Years | 27 (45.8%) | 23 (100.0%) |
| 5 Years | 0 (0.0%) | 0 (0.0%) |
| 6 to 11 Years | 24 (38.1%) | 133 (64.9%) |
| 12 to 14 Years | 41 (58.6%) | 17 (53.1%) |
| 15 Years | 74 (83.2%) | 0 (0.0%) |
| 16 and 17 Years | 6 (42.9%) | 9 (100.0%) |
| 18 to 24 Years | 206 (100.0%) | 31 (27.7%) |
| 25 to 34 Years | 135 (79.4%) | 59 (39.6%) |
| 35 to 44 Years | 89 (100.0%) | 99 (66.0%) |
| 45 to 54 Years | 113 (69.8%) | 100 (67.6%) |
| 55 to 64 Years | 80 (96.4%) | 120 (100.0%) |
| 65 to 74 Years | 116 (67.4%) | 135 (96.4%) |
| 75 Years and over | 45 (67.2%) | 132 (65.7%) |
| Total | 956 (76.5%) | 858 (66.6%) |
Income Below Poverty Among Married-Couple Families in Claxton
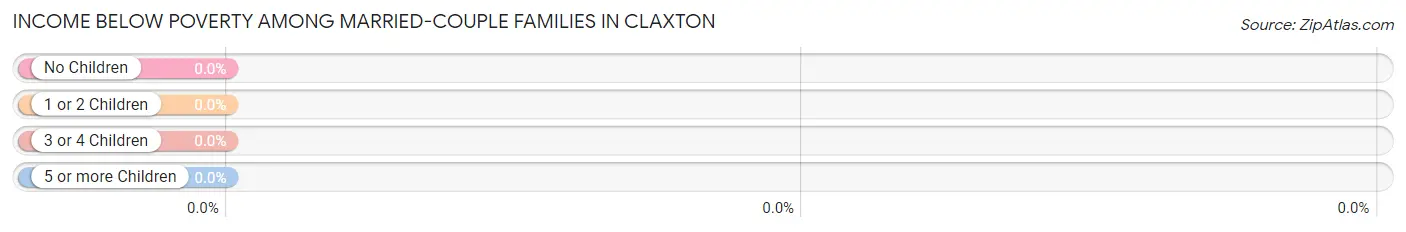
| Children | Above Poverty | Below Poverty |
| No Children | 195 (100.0%) | 0 (0.0%) |
| 1 or 2 Children | 112 (100.0%) | 0 (0.0%) |
| 3 or 4 Children | 7 (100.0%) | 0 (0.0%) |
| 5 or more Children | 0 (0.0%) | 0 (0.0%) |
| Total | 314 (100.0%) | 0 (0.0%) |
Income Below Poverty Among Single-Parent Households in Claxton
According to the poverty data in Claxton, 37.5% or 15 single-father households and 67.7% or 130 single-mother households are living below the poverty line. Among single-father households, those with 1 or 2 children have the highest poverty rate, with 15 households (37.5%) experiencing poverty. Likewise, among single-mother households, those with 3 or 4 children have the highest poverty rate, with 70 households (100.0%) falling below the poverty line.
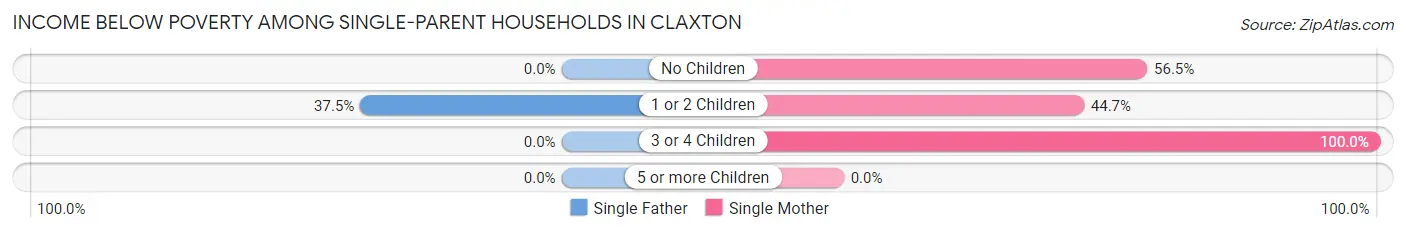
| Children | Single Father | Single Mother |
| No Children | 0 (0.0%) | 26 (56.5%) |
| 1 or 2 Children | 15 (37.5%) | 34 (44.7%) |
| 3 or 4 Children | 0 (0.0%) | 70 (100.0%) |
| 5 or more Children | 0 (0.0%) | 0 (0.0%) |
| Total | 15 (37.5%) | 130 (67.7%) |
Income Below Poverty Among Married-Couple vs Single-Parent Households in Claxton
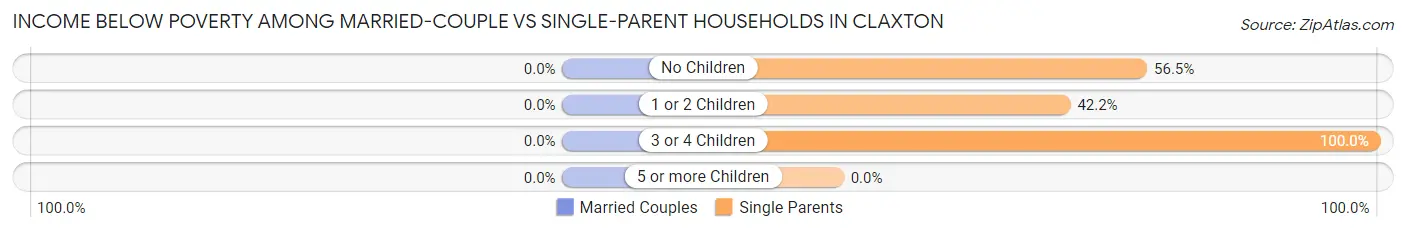
| Children | Married-Couple Families | Single-Parent Households |
| No Children | 0 (0.0%) | 26 (56.5%) |
| 1 or 2 Children | 0 (0.0%) | 49 (42.2%) |
| 3 or 4 Children | 0 (0.0%) | 70 (100.0%) |
| 5 or more Children | 0 (0.0%) | 0 (0.0%) |
| Total | 0 (0.0%) | 145 (62.5%) |
Race in Claxton
The most populous races in Claxton are White / Caucasian (1,116 | 43.4%), Black / African American (958 | 37.2%), and Hispanic or Latino (416 | 16.2%).
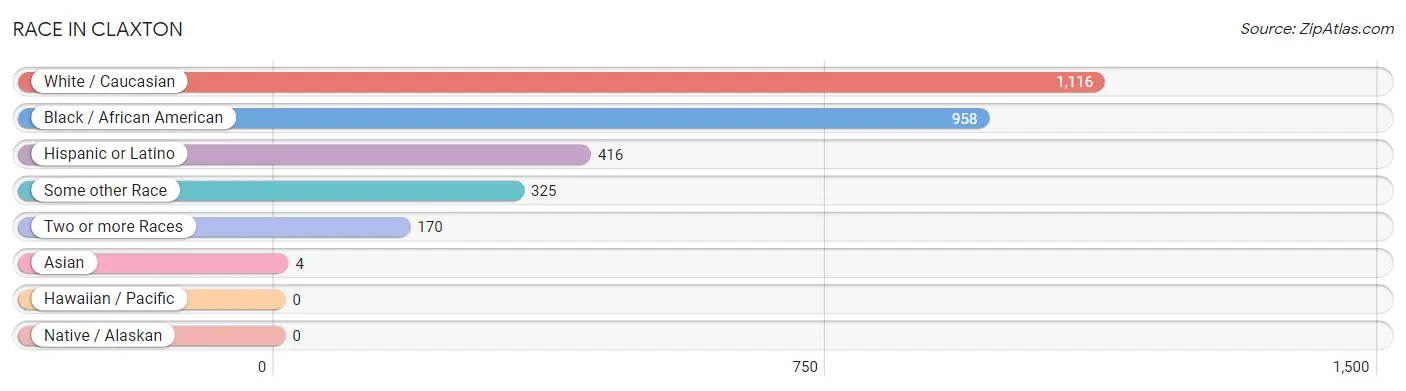
| Race | # Population | % Population |
| Asian | 4 | 0.2% |
| Black / African American | 958 | 37.2% |
| Hawaiian / Pacific | 0 | 0.0% |
| Hispanic or Latino | 416 | 16.2% |
| Native / Alaskan | 0 | 0.0% |
| White / Caucasian | 1,116 | 43.4% |
| Two or more Races | 170 | 6.6% |
| Some other Race | 325 | 12.6% |
| Total | 2,573 | 100.0% |
Ancestry in Claxton
The most populous ancestries reported in Claxton are English (273 | 10.6%), Mexican (252 | 9.8%), Irish (223 | 8.7%), Central American (88 | 3.4%), and Guatemalan (88 | 3.4%), together accounting for 35.9% of all Claxton residents.
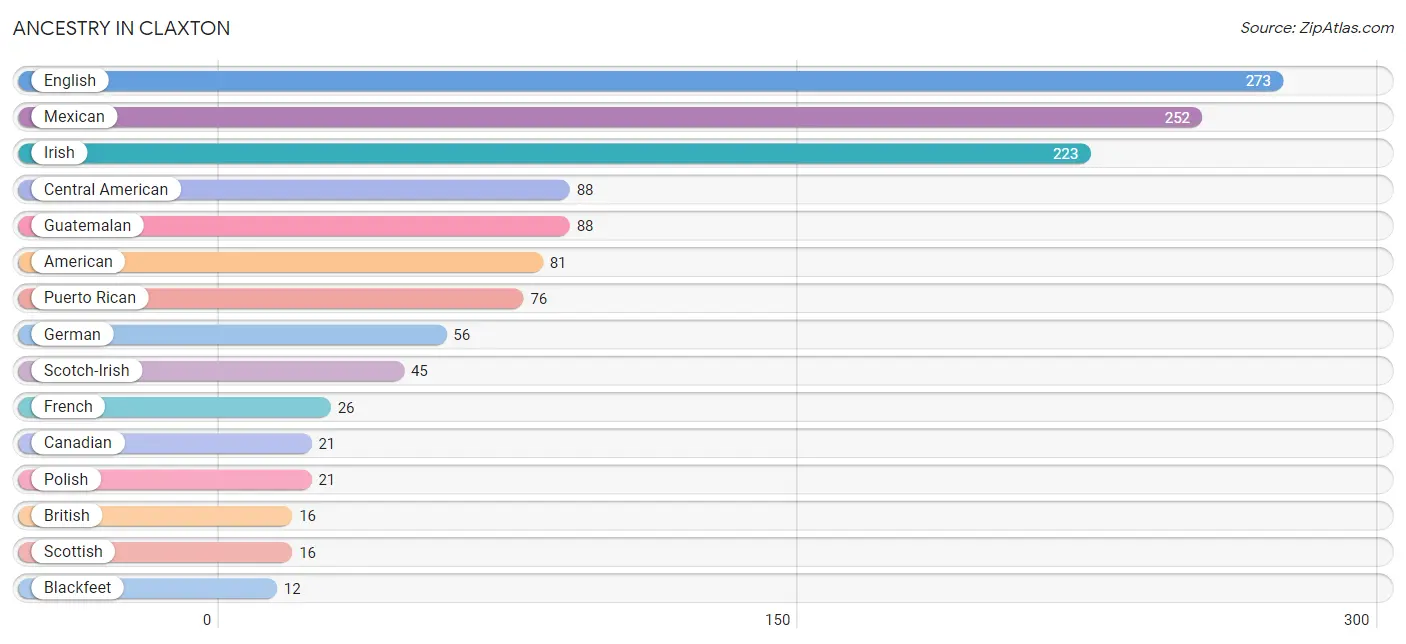
| Ancestry | # Population | % Population |
| American | 81 | 3.2% |
| Blackfeet | 12 | 0.5% |
| British | 16 | 0.6% |
| Canadian | 21 | 0.8% |
| Central American | 88 | 3.4% |
| Cherokee | 5 | 0.2% |
| English | 273 | 10.6% |
| French | 26 | 1.0% |
| German | 56 | 2.2% |
| Guatemalan | 88 | 3.4% |
| Indian (Asian) | 1 | 0.0% |
| Irish | 223 | 8.7% |
| Italian | 1 | 0.0% |
| Mexican | 252 | 9.8% |
| Polish | 21 | 0.8% |
| Puerto Rican | 76 | 2.9% |
| Russian | 2 | 0.1% |
| Scotch-Irish | 45 | 1.8% |
| Scottish | 16 | 0.6% |
| Sri Lankan | 3 | 0.1% | View All 20 Rows |
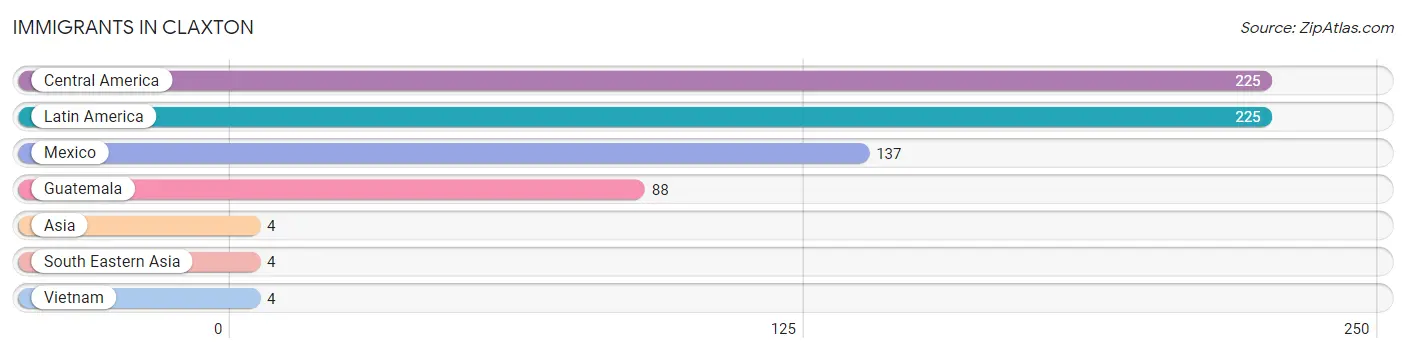
Immigrants in Claxton
The most numerous immigrant groups reported in Claxton came from Central America (225 | 8.7%), Latin America (225 | 8.7%), Mexico (137 | 5.3%), Guatemala (88 | 3.4%), and Asia (4 | 0.2%), together accounting for 26.4% of all Claxton residents.
| Immigration Origin | # Population | % Population |
| Asia | 4 | 0.2% |
| Central America | 225 | 8.7% |
| Guatemala | 88 | 3.4% |
| Latin America | 225 | 8.7% |
| Mexico | 137 | 5.3% |
| South Eastern Asia | 4 | 0.2% |
| Vietnam | 4 | 0.2% | View All 7 Rows |
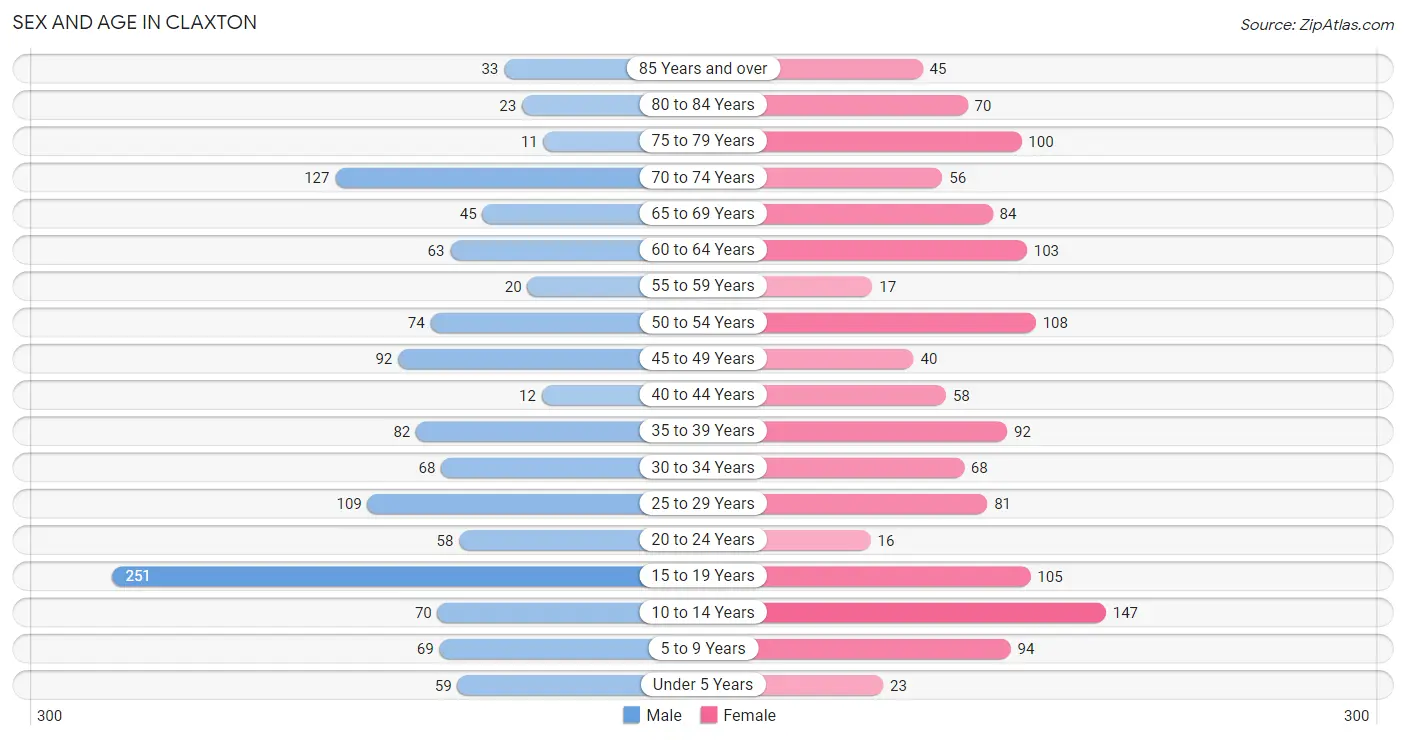
Sex and Age in Claxton
Sex and Age in Claxton
The most populous age groups in Claxton are 15 to 19 Years (251 | 19.8%) for men and 10 to 14 Years (147 | 11.3%) for women.
| Age Bracket | Male | Female |
| Under 5 Years | 59 (4.7%) | 23 (1.8%) |
| 5 to 9 Years | 69 (5.4%) | 94 (7.2%) |
| 10 to 14 Years | 70 (5.5%) | 147 (11.3%) |
| 15 to 19 Years | 251 (19.8%) | 105 (8.0%) |
| 20 to 24 Years | 58 (4.6%) | 16 (1.2%) |
| 25 to 29 Years | 109 (8.6%) | 81 (6.2%) |
| 30 to 34 Years | 68 (5.4%) | 68 (5.2%) |
| 35 to 39 Years | 82 (6.5%) | 92 (7.0%) |
| 40 to 44 Years | 12 (0.9%) | 58 (4.4%) |
| 45 to 49 Years | 92 (7.3%) | 40 (3.1%) |
| 50 to 54 Years | 74 (5.9%) | 108 (8.3%) |
| 55 to 59 Years | 20 (1.6%) | 17 (1.3%) |
| 60 to 64 Years | 63 (5.0%) | 103 (7.9%) |
| 65 to 69 Years | 45 (3.5%) | 84 (6.4%) |
| 70 to 74 Years | 127 (10.0%) | 56 (4.3%) |
| 75 to 79 Years | 11 (0.9%) | 100 (7.6%) |
| 80 to 84 Years | 23 (1.8%) | 70 (5.4%) |
| 85 Years and over | 33 (2.6%) | 45 (3.4%) |
| Total | 1,266 (100.0%) | 1,307 (100.0%) |
Families and Households in Claxton
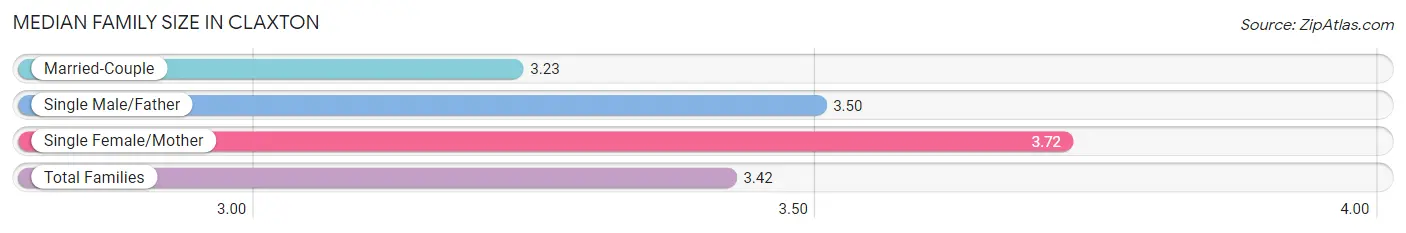
Median Family Size in Claxton
The median family size in Claxton is 3.42 persons per family, with single female/mother families (192 | 35.2%) accounting for the largest median family size of 3.72 persons per family. On the other hand, married-couple families (314 | 57.5%) represent the smallest median family size with 3.23 persons per family.
| Family Type | # Families | Family Size |
| Married-Couple | 314 (57.5%) | 3.23 |
| Single Male/Father | 40 (7.3%) | 3.50 |
| Single Female/Mother | 192 (35.2%) | 3.72 |
| Total Families | 546 (100.0%) | 3.42 |
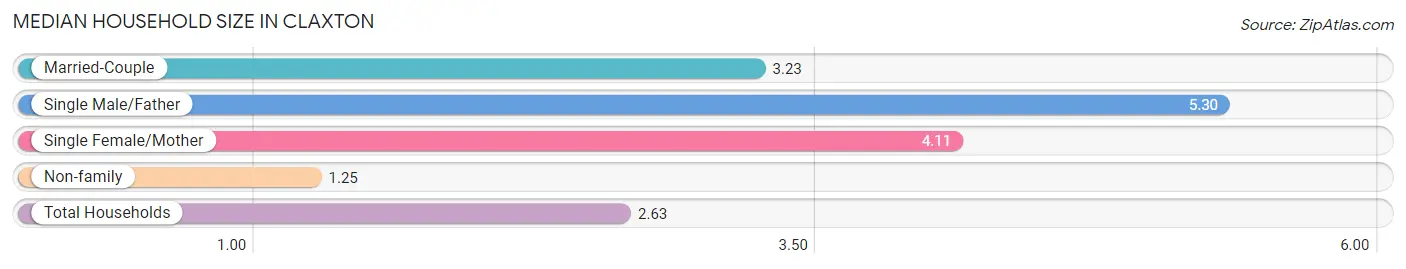
Median Household Size in Claxton
The median household size in Claxton is 2.63 persons per household, with single male/father households (40 | 4.1%) accounting for the largest median household size of 5.3 persons per household. non-family households (422 | 43.6%) represent the smallest median household size with 1.25 persons per household.
| Household Type | # Households | Household Size |
| Married-Couple | 314 (32.4%) | 3.23 |
| Single Male/Father | 40 (4.1%) | 5.30 |
| Single Female/Mother | 192 (19.8%) | 4.11 |
| Non-family | 422 (43.6%) | 1.25 |
| Total Households | 968 (100.0%) | 2.63 |
Household Size by Marriage Status in Claxton
Out of a total of 968 households in Claxton, 546 (56.4%) are family households, while 422 (43.6%) are nonfamily households. The most numerous type of family households are 2-person households, comprising 204, and the most common type of nonfamily households are 1-person households, comprising 365.
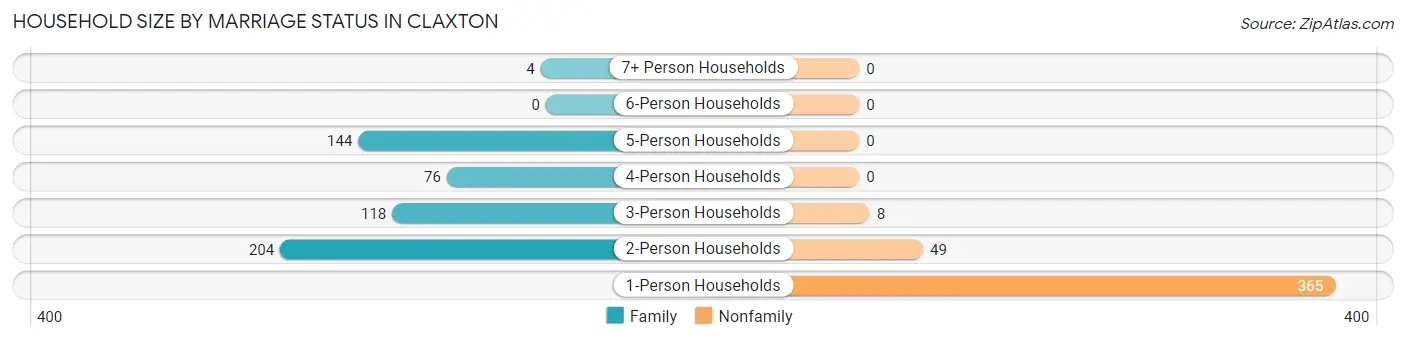
| Household Size | Family Households | Nonfamily Households |
| 1-Person Households | - | 365 (37.7%) |
| 2-Person Households | 204 (21.1%) | 49 (5.1%) |
| 3-Person Households | 118 (12.2%) | 8 (0.8%) |
| 4-Person Households | 76 (7.9%) | 0 (0.0%) |
| 5-Person Households | 144 (14.9%) | 0 (0.0%) |
| 6-Person Households | 0 (0.0%) | 0 (0.0%) |
| 7+ Person Households | 4 (0.4%) | 0 (0.0%) |
| Total | 546 (56.4%) | 422 (43.6%) |
Female Fertility in Claxton
Fertility by Age in Claxton
Average fertility rate in Claxton is 61.0 births per 1,000 women. Women in the age bracket of 20 to 34 years have the highest fertility rate with 194.0 births per 1,000 women. Women in the age bracket of 20 to 34 years acount for 100.0% of all women with births.
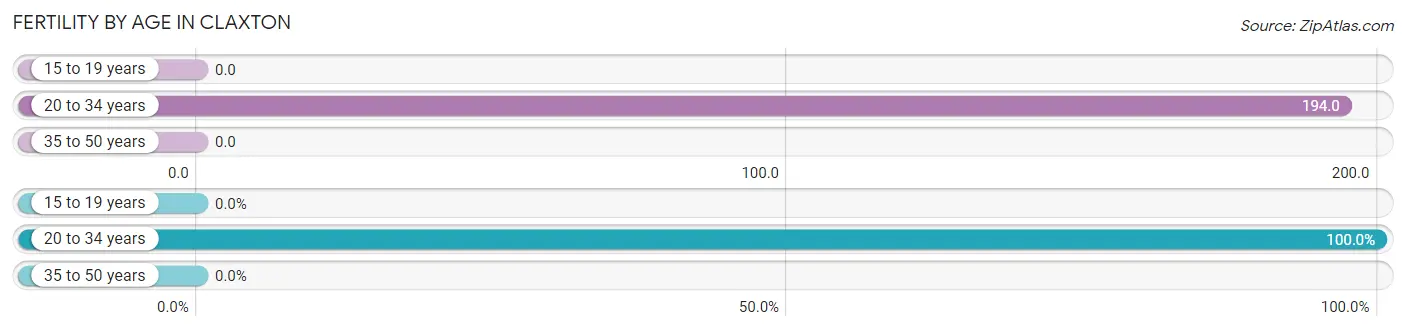
| Age Bracket | Women with Births | Births / 1,000 Women |
| 15 to 19 years | 0 (0.0%) | 0.0 |
| 20 to 34 years | 32 (100.0%) | 194.0 |
| 35 to 50 years | 0 (0.0%) | 0.0 |
| Total | 32 (100.0%) | 61.0 |
Fertility by Age by Marriage Status in Claxton
50.0% of women with births (32) in Claxton are married. The highest percentage of unmarried women with births falls into 20 to 34 years age bracket with 50.0% of them unmarried at the time of birth, while the lowest percentage of unmarried women with births belong to 20 to 34 years age bracket with 50.0% of them unmarried.
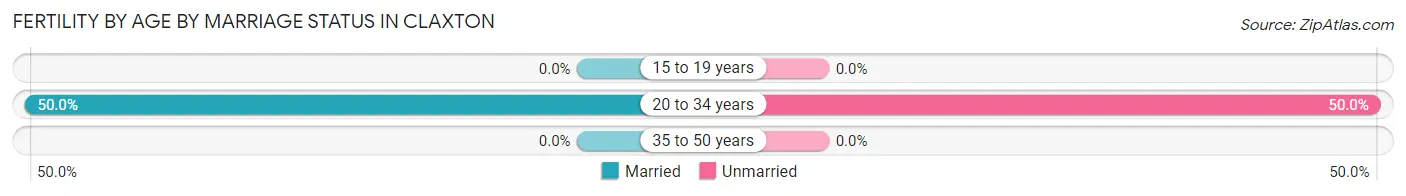
| Age Bracket | Married | Unmarried |
| 15 to 19 years | 0 (0.0%) | 0 (0.0%) |
| 20 to 34 years | 16 (50.0%) | 16 (50.0%) |
| 35 to 50 years | 0 (0.0%) | 0 (0.0%) |
| Total | 16 (50.0%) | 16 (50.0%) |
Fertility by Education in Claxton
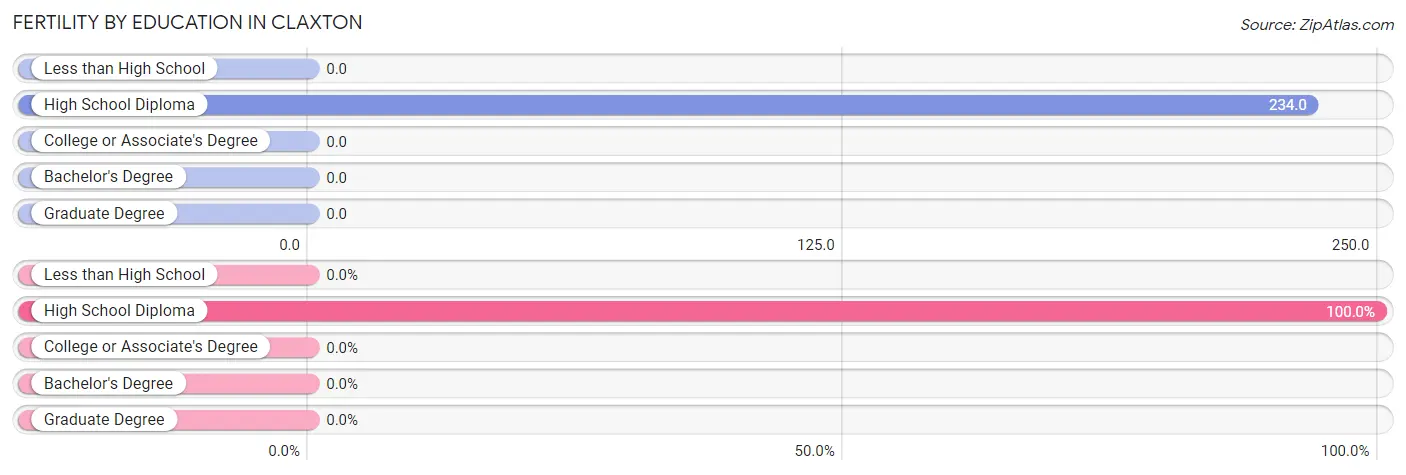
| Educational Attainment | Women with Births | Births / 1,000 Women |
| Less than High School | 0 (0.0%) | 0.0 |
| High School Diploma | 32 (100.0%) | 234.0 |
| College or Associate's Degree | 0 (0.0%) | 0.0 |
| Bachelor's Degree | 0 (0.0%) | 0.0 |
| Graduate Degree | 0 (0.0%) | 0.0 |
| Total | 32 (100.0%) | 61.0 |
Fertility by Education by Marriage Status in Claxton
50.0% of women with births in Claxton are unmarried. Women with the educational attainment of high school diploma are most likely to be married with 50.0% of them married at childbirth, while women with the educational attainment of high school diploma are least likely to be married with 50.0% of them unmarried at childbirth.
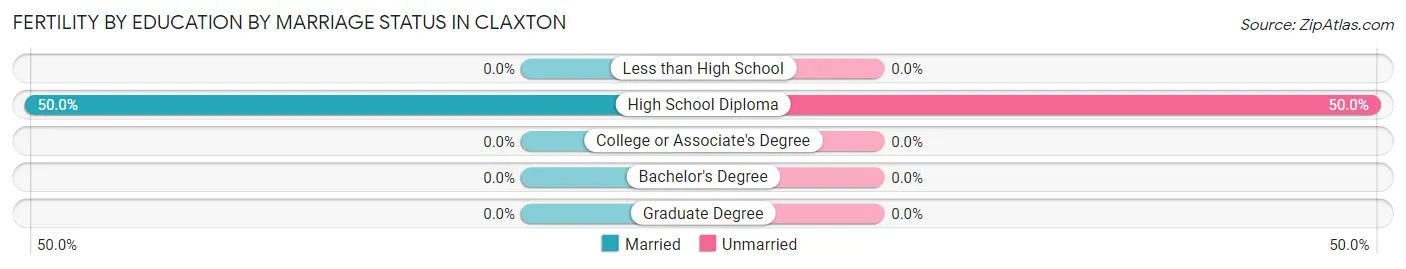
| Educational Attainment | Married | Unmarried |
| Less than High School | 0 (0.0%) | 0 (0.0%) |
| High School Diploma | 16 (50.0%) | 16 (50.0%) |
| College or Associate's Degree | 0 (0.0%) | 0 (0.0%) |
| Bachelor's Degree | 0 (0.0%) | 0 (0.0%) |
| Graduate Degree | 0 (0.0%) | 0 (0.0%) |
| Total | 16 (50.0%) | 16 (50.0%) |
Employment Characteristics in Claxton
Employment by Class of Employer in Claxton
Among the 1,005 employed individuals in Claxton, private company employees (718 | 71.4%), not-for-profit organizations (82 | 8.2%), and state government employees (75 | 7.5%) make up the most common classes of employment.
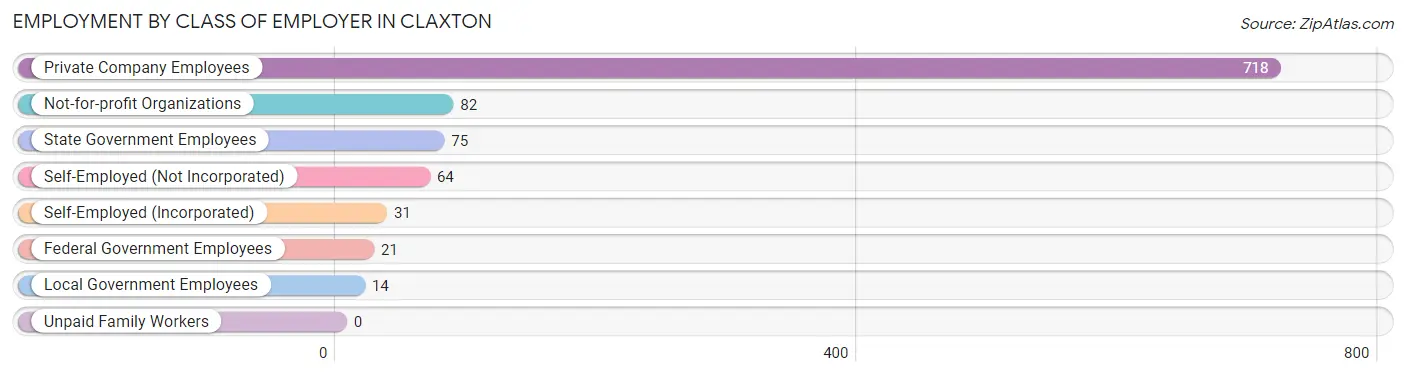
| Employer Class | # Employees | % Employees |
| Private Company Employees | 718 | 71.4% |
| Self-Employed (Incorporated) | 31 | 3.1% |
| Self-Employed (Not Incorporated) | 64 | 6.4% |
| Not-for-profit Organizations | 82 | 8.2% |
| Local Government Employees | 14 | 1.4% |
| State Government Employees | 75 | 7.5% |
| Federal Government Employees | 21 | 2.1% |
| Unpaid Family Workers | 0 | 0.0% |
| Total | 1,005 | 100.0% |
Employment Status by Age in Claxton
According to the labor force statistics for Claxton, out of the total population over 16 years of age (2,022), 54.9% or 1,110 individuals are in the labor force, with 3.2% or 36 of them unemployed. The age group with the highest labor force participation rate is 20 to 24 years, with 100.0% or 74 individuals in the labor force. Within the labor force, the 60 to 64 years age range has the highest percentage of unemployed individuals, with 37.0% or 27 of them being unemployed.
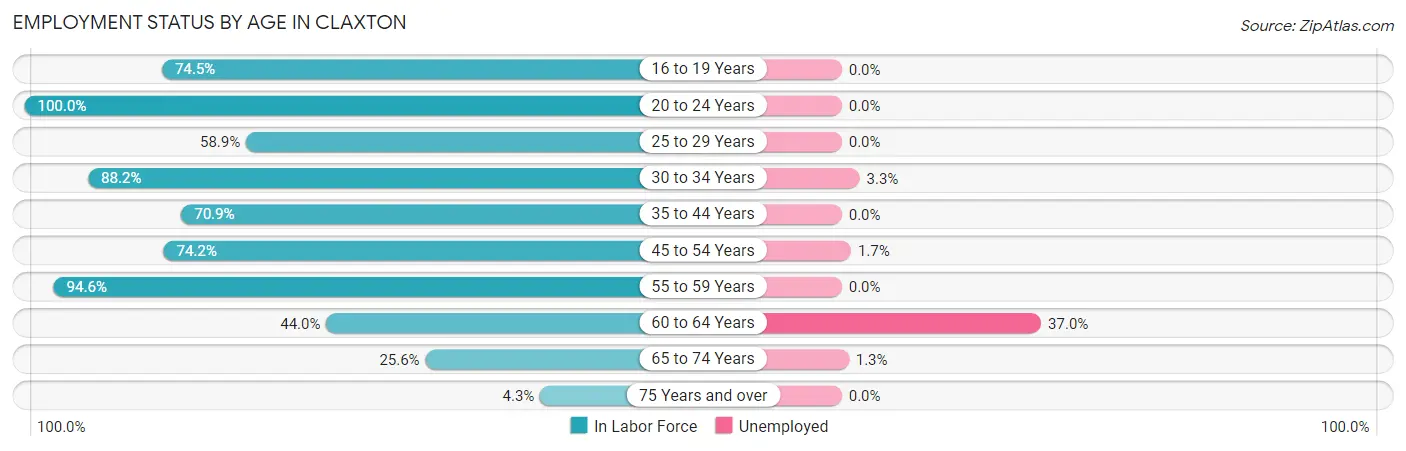
| Age Bracket | In Labor Force | Unemployed |
| 16 to 19 Years | 199 (74.5%) | 0 (0.0%) |
| 20 to 24 Years | 74 (100.0%) | 0 (0.0%) |
| 25 to 29 Years | 112 (58.9%) | 0 (0.0%) |
| 30 to 34 Years | 120 (88.2%) | 4 (3.3%) |
| 35 to 44 Years | 173 (70.9%) | 0 (0.0%) |
| 45 to 54 Years | 233 (74.2%) | 4 (1.7%) |
| 55 to 59 Years | 35 (94.6%) | 0 (0.0%) |
| 60 to 64 Years | 73 (44.0%) | 27 (37.0%) |
| 65 to 74 Years | 80 (25.6%) | 1 (1.3%) |
| 75 Years and over | 12 (4.3%) | 0 (0.0%) |
| Total | 1,110 (54.9%) | 36 (3.2%) |
Employment Status by Educational Attainment in Claxton
According to labor force statistics for Claxton, 68.6% of individuals (746) out of the total population between 25 and 64 years of age (1,087) are in the labor force, with 4.7% or 35 of them being unemployed. The group with the highest labor force participation rate are those with the educational attainment of college / associate degree, with 77.1% or 226 individuals in the labor force. Within the labor force, individuals with college / associate degree education have the highest percentage of unemployment, with 13.7% or 31 of them being unemployed.
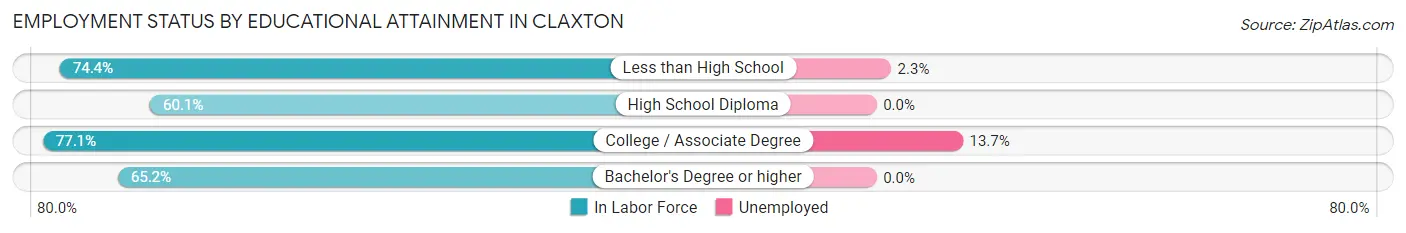
| Educational Attainment | In Labor Force | Unemployed |
| Less than High School | 174 (74.4%) | 5 (2.3%) |
| High School Diploma | 226 (60.1%) | 0 (0.0%) |
| College / Associate Degree | 226 (77.1%) | 40 (13.7%) |
| Bachelor's Degree or higher | 120 (65.2%) | 0 (0.0%) |
| Total | 746 (68.6%) | 51 (4.7%) |
Employment Occupations by Sex in Claxton
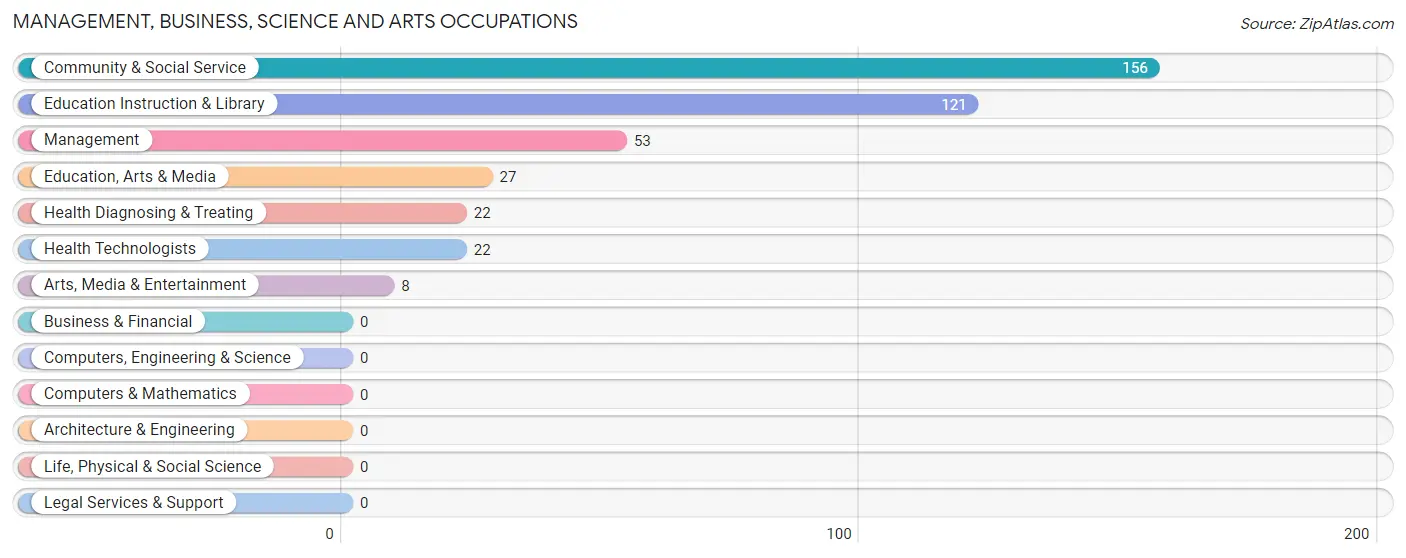
Management, Business, Science and Arts Occupations
The most common Management, Business, Science and Arts occupations in Claxton are Community & Social Service (156 | 14.5%), Education Instruction & Library (121 | 11.3%), Management (53 | 4.9%), Education, Arts & Media (27 | 2.5%), and Health Diagnosing & Treating (22 | 2.1%).
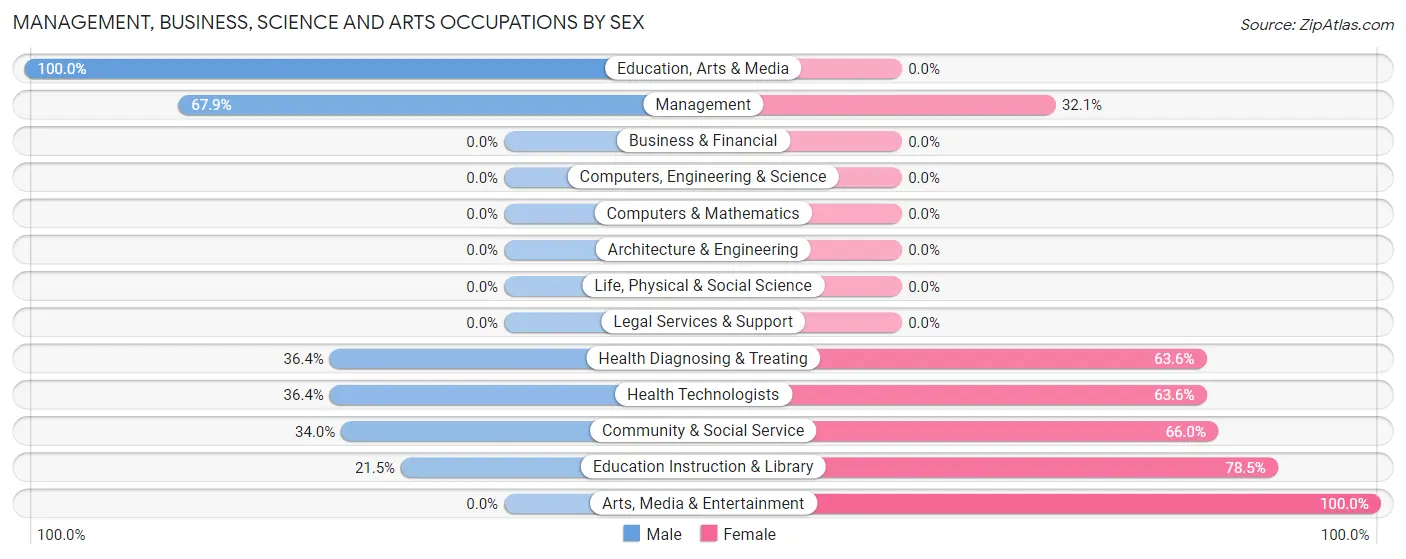
Management, Business, Science and Arts Occupations by Sex
Within the Management, Business, Science and Arts occupations in Claxton, the most male-oriented occupations are Education, Arts & Media (100.0%), Management (67.9%), and Health Diagnosing & Treating (36.4%), while the most female-oriented occupations are Arts, Media & Entertainment (100.0%), Education Instruction & Library (78.5%), and Community & Social Service (66.0%).
| Occupation | Male | Female |
| Management | 36 (67.9%) | 17 (32.1%) |
| Business & Financial | 0 (0.0%) | 0 (0.0%) |
| Computers, Engineering & Science | 0 (0.0%) | 0 (0.0%) |
| Computers & Mathematics | 0 (0.0%) | 0 (0.0%) |
| Architecture & Engineering | 0 (0.0%) | 0 (0.0%) |
| Life, Physical & Social Science | 0 (0.0%) | 0 (0.0%) |
| Community & Social Service | 53 (34.0%) | 103 (66.0%) |
| Education, Arts & Media | 27 (100.0%) | 0 (0.0%) |
| Legal Services & Support | 0 (0.0%) | 0 (0.0%) |
| Education Instruction & Library | 26 (21.5%) | 95 (78.5%) |
| Arts, Media & Entertainment | 0 (0.0%) | 8 (100.0%) |
| Health Diagnosing & Treating | 8 (36.4%) | 14 (63.6%) |
| Health Technologists | 8 (36.4%) | 14 (63.6%) |
| Total (Category) | 97 (42.0%) | 134 (58.0%) |
| Total (Overall) | 647 (60.2%) | 428 (39.8%) |
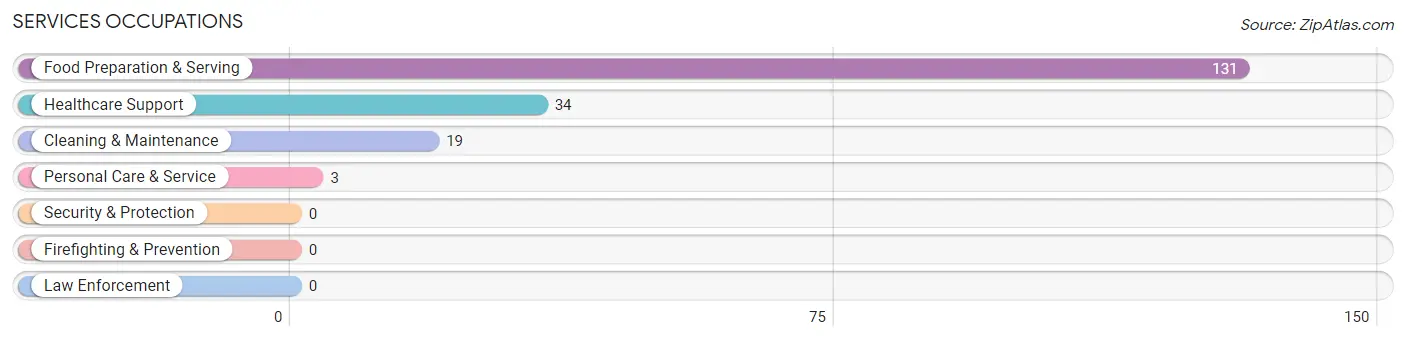
Services Occupations
The most common Services occupations in Claxton are Food Preparation & Serving (131 | 12.2%), Healthcare Support (34 | 3.2%), Cleaning & Maintenance (19 | 1.8%), and Personal Care & Service (3 | 0.3%).
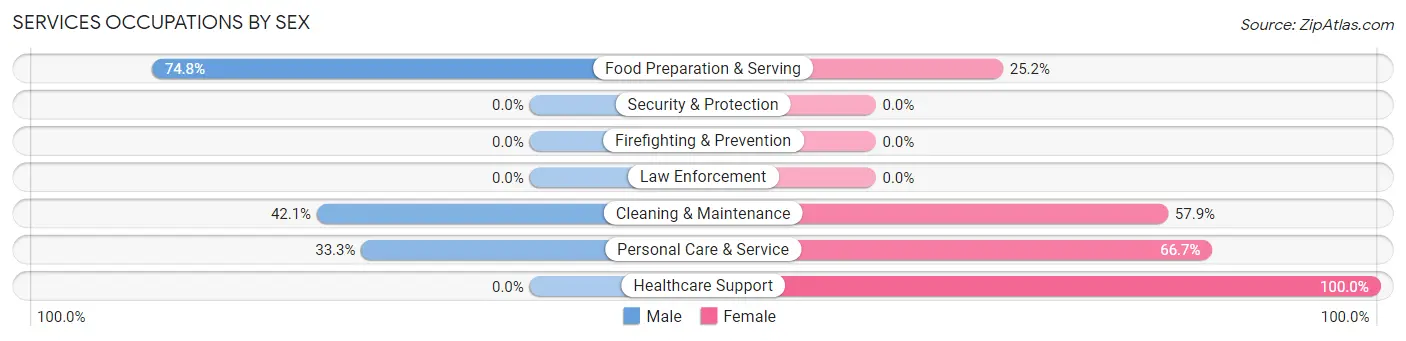
Services Occupations by Sex
Within the Services occupations in Claxton, the most male-oriented occupations are Food Preparation & Serving (74.8%), Cleaning & Maintenance (42.1%), and Personal Care & Service (33.3%), while the most female-oriented occupations are Healthcare Support (100.0%), Personal Care & Service (66.7%), and Cleaning & Maintenance (57.9%).
| Occupation | Male | Female |
| Healthcare Support | 0 (0.0%) | 34 (100.0%) |
| Security & Protection | 0 (0.0%) | 0 (0.0%) |
| Firefighting & Prevention | 0 (0.0%) | 0 (0.0%) |
| Law Enforcement | 0 (0.0%) | 0 (0.0%) |
| Food Preparation & Serving | 98 (74.8%) | 33 (25.2%) |
| Cleaning & Maintenance | 8 (42.1%) | 11 (57.9%) |
| Personal Care & Service | 1 (33.3%) | 2 (66.7%) |
| Total (Category) | 107 (57.2%) | 80 (42.8%) |
| Total (Overall) | 647 (60.2%) | 428 (39.8%) |
Sales and Office Occupations
The most common Sales and Office occupations in Claxton are Sales & Related (141 | 13.1%), and Office & Administration (35 | 3.3%).
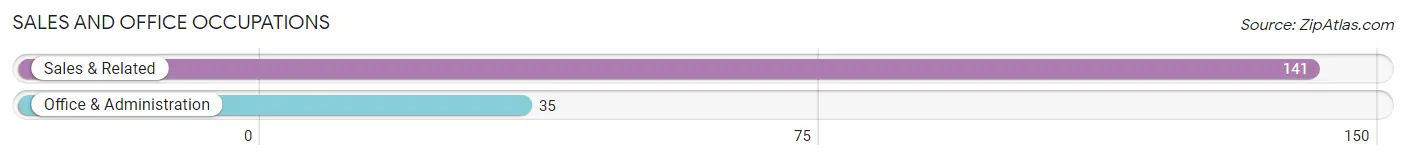
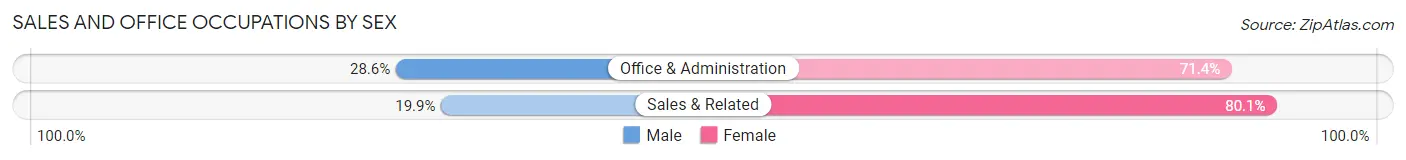
Sales and Office Occupations by Sex
| Occupation | Male | Female |
| Sales & Related | 28 (19.9%) | 113 (80.1%) |
| Office & Administration | 10 (28.6%) | 25 (71.4%) |
| Total (Category) | 38 (21.6%) | 138 (78.4%) |
| Total (Overall) | 647 (60.2%) | 428 (39.8%) |
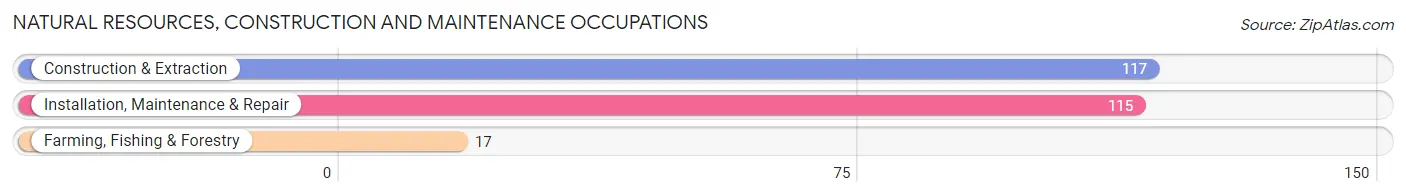
Natural Resources, Construction and Maintenance Occupations
The most common Natural Resources, Construction and Maintenance occupations in Claxton are Construction & Extraction (117 | 10.9%), Installation, Maintenance & Repair (115 | 10.7%), and Farming, Fishing & Forestry (17 | 1.6%).
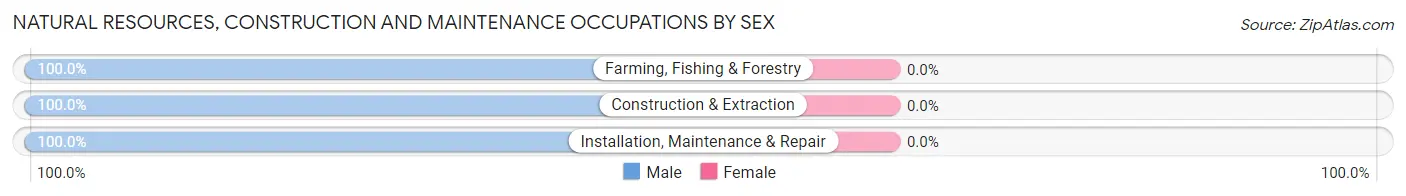
Natural Resources, Construction and Maintenance Occupations by Sex
| Occupation | Male | Female |
| Farming, Fishing & Forestry | 17 (100.0%) | 0 (0.0%) |
| Construction & Extraction | 117 (100.0%) | 0 (0.0%) |
| Installation, Maintenance & Repair | 115 (100.0%) | 0 (0.0%) |
| Total (Category) | 249 (100.0%) | 0 (0.0%) |
| Total (Overall) | 647 (60.2%) | 428 (39.8%) |
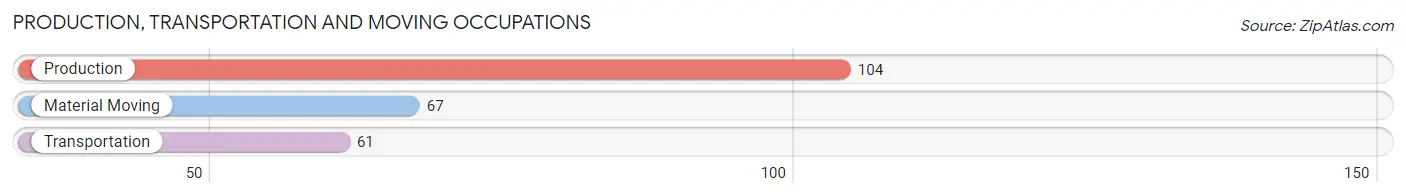
Production, Transportation and Moving Occupations
The most common Production, Transportation and Moving occupations in Claxton are Production (104 | 9.7%), Material Moving (67 | 6.2%), and Transportation (61 | 5.7%).
Production, Transportation and Moving Occupations by Sex
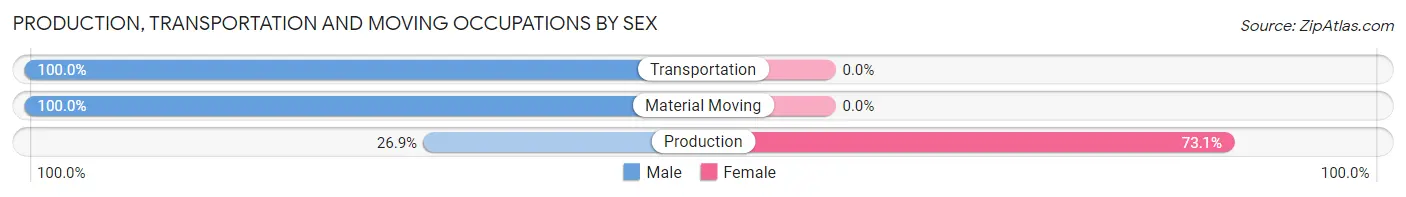
| Occupation | Male | Female |
| Production | 28 (26.9%) | 76 (73.1%) |
| Transportation | 61 (100.0%) | 0 (0.0%) |
| Material Moving | 67 (100.0%) | 0 (0.0%) |
| Total (Category) | 156 (67.2%) | 76 (32.8%) |
| Total (Overall) | 647 (60.2%) | 428 (39.8%) |
Employment Industries by Sex in Claxton
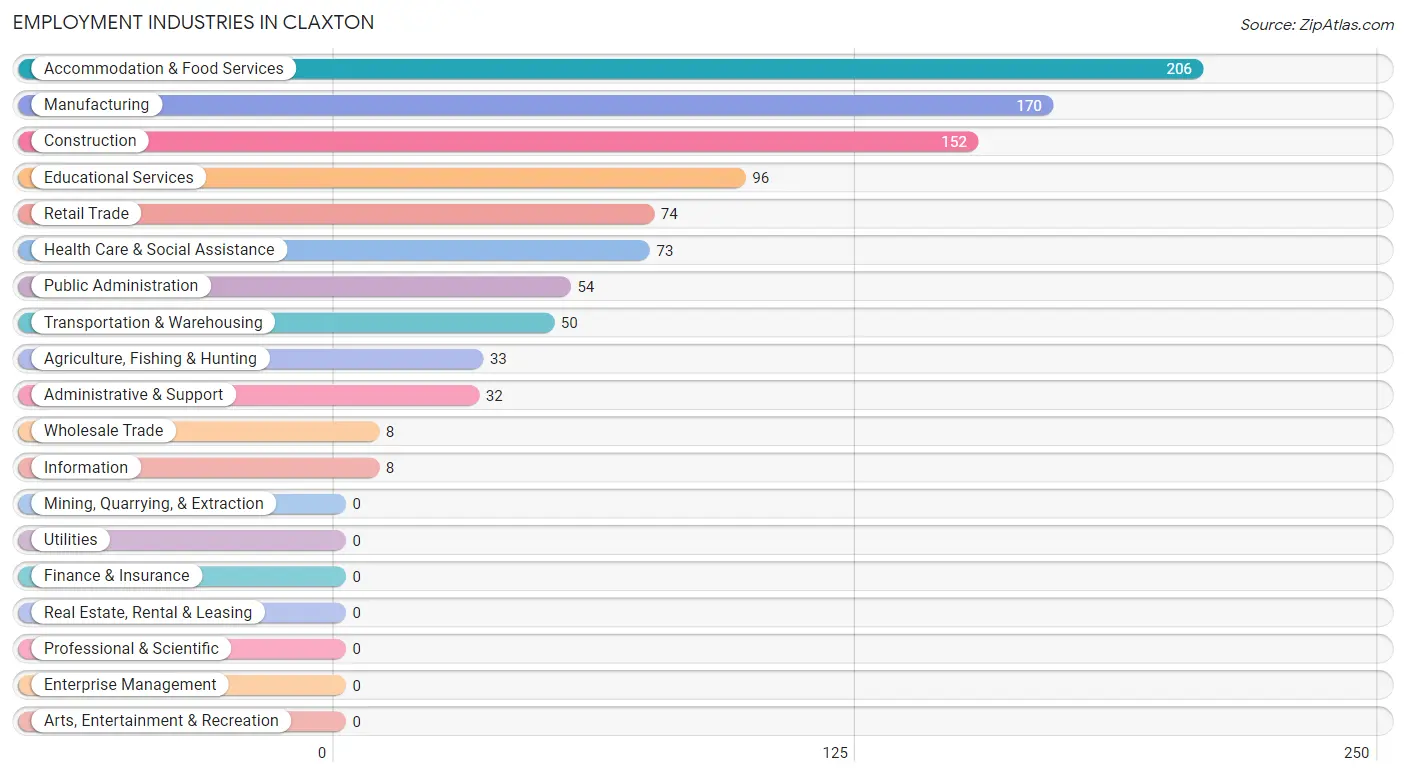
Employment Industries in Claxton
The major employment industries in Claxton include Accommodation & Food Services (206 | 19.2%), Manufacturing (170 | 15.8%), Construction (152 | 14.1%), Educational Services (96 | 8.9%), and Retail Trade (74 | 6.9%).
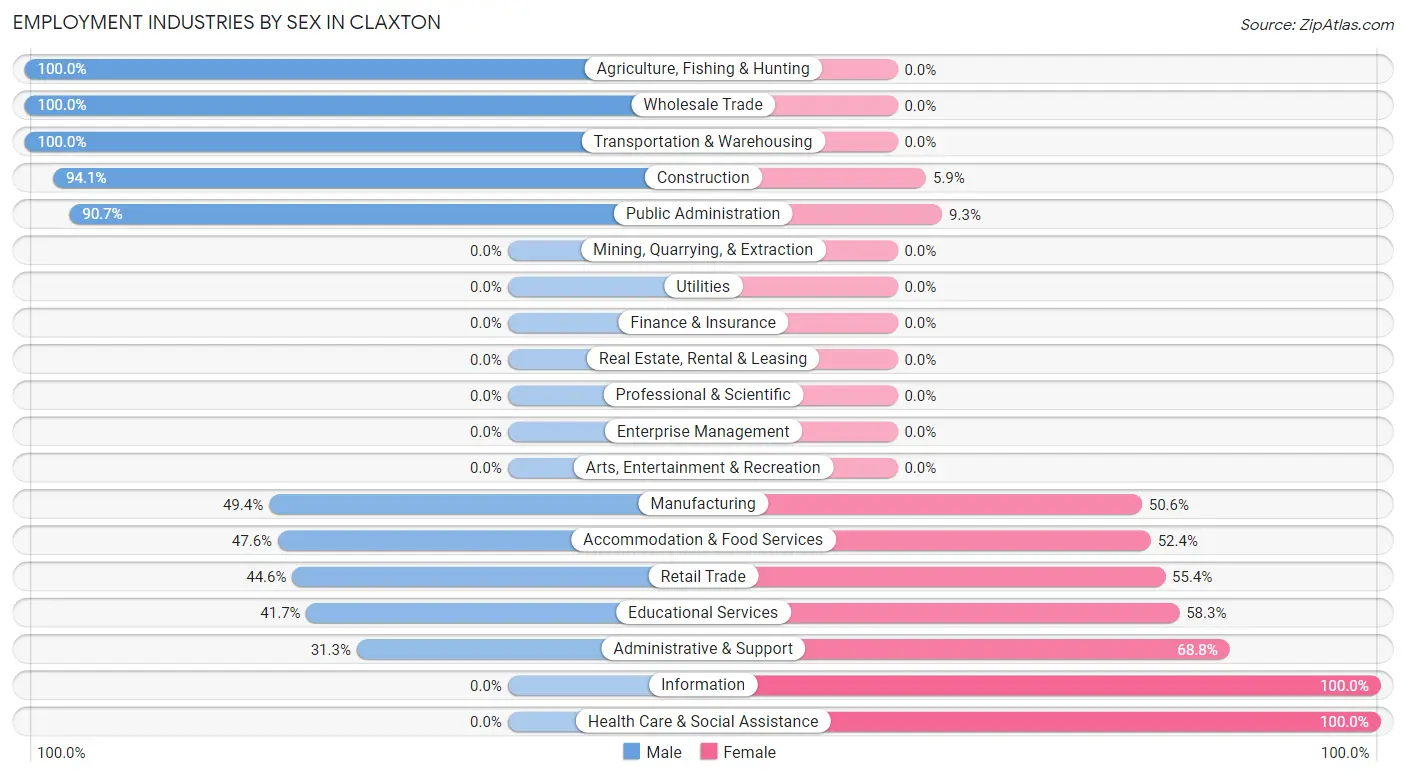
Employment Industries by Sex in Claxton
The Claxton industries that see more men than women are Agriculture, Fishing & Hunting (100.0%), Wholesale Trade (100.0%), and Transportation & Warehousing (100.0%), whereas the industries that tend to have a higher number of women are Information (100.0%), Health Care & Social Assistance (100.0%), and Administrative & Support (68.8%).
| Industry | Male | Female |
| Agriculture, Fishing & Hunting | 33 (100.0%) | 0 (0.0%) |
| Mining, Quarrying, & Extraction | 0 (0.0%) | 0 (0.0%) |
| Construction | 143 (94.1%) | 9 (5.9%) |
| Manufacturing | 84 (49.4%) | 86 (50.6%) |
| Wholesale Trade | 8 (100.0%) | 0 (0.0%) |
| Retail Trade | 33 (44.6%) | 41 (55.4%) |
| Transportation & Warehousing | 50 (100.0%) | 0 (0.0%) |
| Utilities | 0 (0.0%) | 0 (0.0%) |
| Information | 0 (0.0%) | 8 (100.0%) |
| Finance & Insurance | 0 (0.0%) | 0 (0.0%) |
| Real Estate, Rental & Leasing | 0 (0.0%) | 0 (0.0%) |
| Professional & Scientific | 0 (0.0%) | 0 (0.0%) |
| Enterprise Management | 0 (0.0%) | 0 (0.0%) |
| Administrative & Support | 10 (31.2%) | 22 (68.8%) |
| Educational Services | 40 (41.7%) | 56 (58.3%) |
| Health Care & Social Assistance | 0 (0.0%) | 73 (100.0%) |
| Arts, Entertainment & Recreation | 0 (0.0%) | 0 (0.0%) |
| Accommodation & Food Services | 98 (47.6%) | 108 (52.4%) |
| Public Administration | 49 (90.7%) | 5 (9.3%) |
| Total | 647 (60.2%) | 428 (39.8%) |
Education in Claxton
School Enrollment in Claxton
The most common levels of schooling among the 717 students in Claxton are high school (287 | 40.0%), elementary school (220 | 30.7%), and middle school (112 | 15.6%).
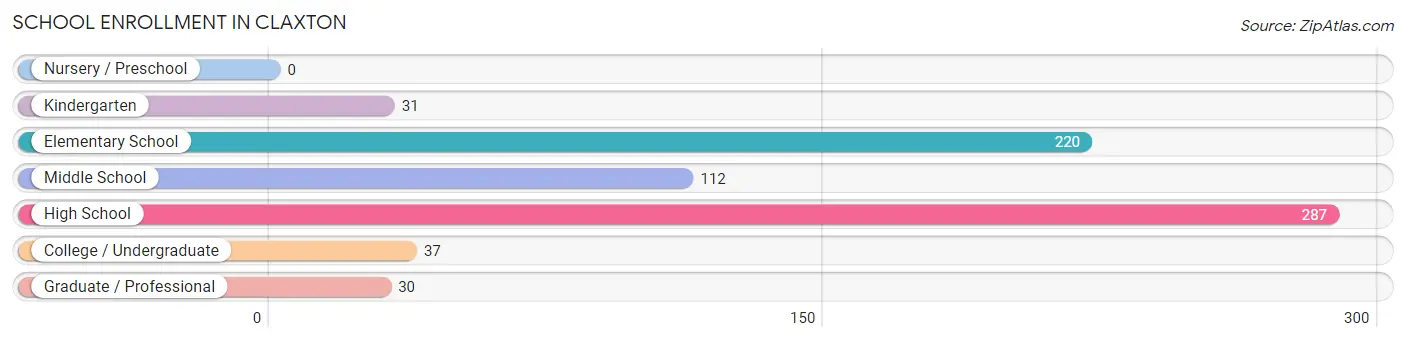
| School Level | # Students | % Students |
| Nursery / Preschool | 0 | 0.0% |
| Kindergarten | 31 | 4.3% |
| Elementary School | 220 | 30.7% |
| Middle School | 112 | 15.6% |
| High School | 287 | 40.0% |
| College / Undergraduate | 37 | 5.2% |
| Graduate / Professional | 30 | 4.2% |
| Total | 717 | 100.0% |
School Enrollment by Age by Funding Source in Claxton
Out of a total of 717 students who are enrolled in schools in Claxton, 8 (1.1%) attend a private institution, while the remaining 709 (98.9%) are enrolled in public schools. The age group of 10 to 14 year olds has the highest likelihood of being enrolled in private schools, with 8 (3.7% in the age bracket) enrolled. Conversely, the age group of 5 to 9 year old has the lowest likelihood of being enrolled in a private school, with 163 (100.0% in the age bracket) attending a public institution.
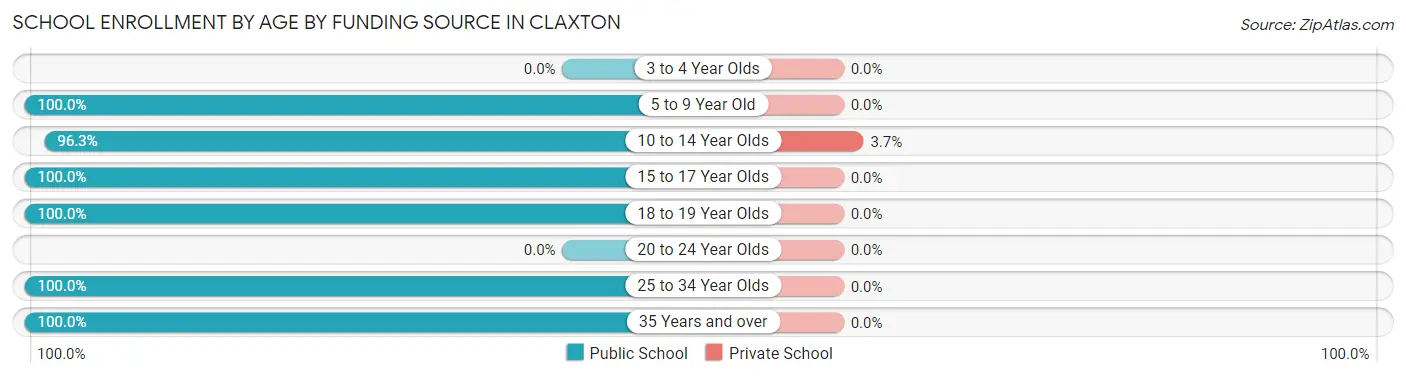
| Age Bracket | Public School | Private School |
| 3 to 4 Year Olds | 0 (0.0%) | 0 (0.0%) |
| 5 to 9 Year Old | 163 (100.0%) | 0 (0.0%) |
| 10 to 14 Year Olds | 209 (96.3%) | 8 (3.7%) |
| 15 to 17 Year Olds | 74 (100.0%) | 0 (0.0%) |
| 18 to 19 Year Olds | 196 (100.0%) | 0 (0.0%) |
| 20 to 24 Year Olds | 0 (0.0%) | 0 (0.0%) |
| 25 to 34 Year Olds | 44 (100.0%) | 0 (0.0%) |
| 35 Years and over | 23 (100.0%) | 0 (0.0%) |
| Total | 709 (98.9%) | 8 (1.1%) |
Educational Attainment by Field of Study in Claxton
Education (126 | 56.5%), bio, nature & agricultural (37 | 16.6%), science & technology (32 | 14.3%), psychology (13 | 5.8%), and arts & humanities (8 | 3.6%) are the most common fields of study among 223 individuals in Claxton who have obtained a bachelor's degree or higher.
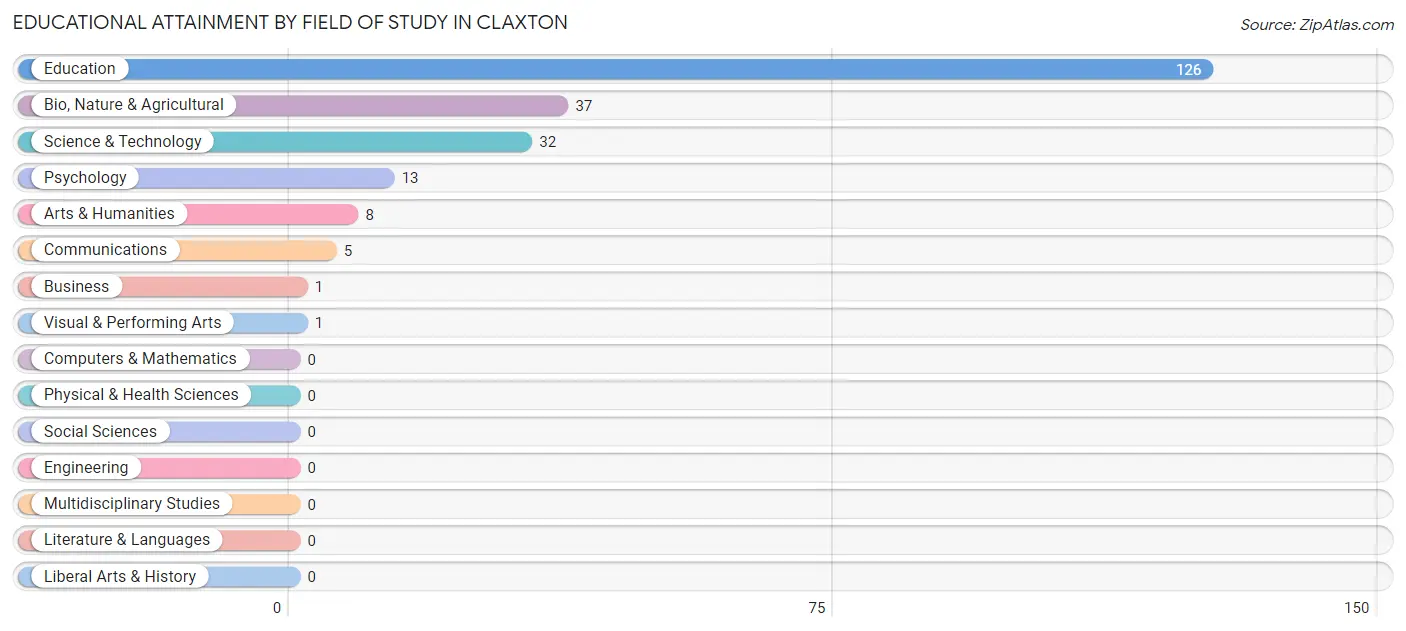
| Field of Study | # Graduates | % Graduates |
| Computers & Mathematics | 0 | 0.0% |
| Bio, Nature & Agricultural | 37 | 16.6% |
| Physical & Health Sciences | 0 | 0.0% |
| Psychology | 13 | 5.8% |
| Social Sciences | 0 | 0.0% |
| Engineering | 0 | 0.0% |
| Multidisciplinary Studies | 0 | 0.0% |
| Science & Technology | 32 | 14.3% |
| Business | 1 | 0.4% |
| Education | 126 | 56.5% |
| Literature & Languages | 0 | 0.0% |
| Liberal Arts & History | 0 | 0.0% |
| Visual & Performing Arts | 1 | 0.4% |
| Communications | 5 | 2.2% |
| Arts & Humanities | 8 | 3.6% |
| Total | 223 | 100.0% |
Transportation & Commute in Claxton
Vehicle Availability by Sex in Claxton
The most prevalent vehicle ownership categories in Claxton are males with 2 vehicles (200, accounting for 33.0%) and females with 2 vehicles (136, making up 50.2%).
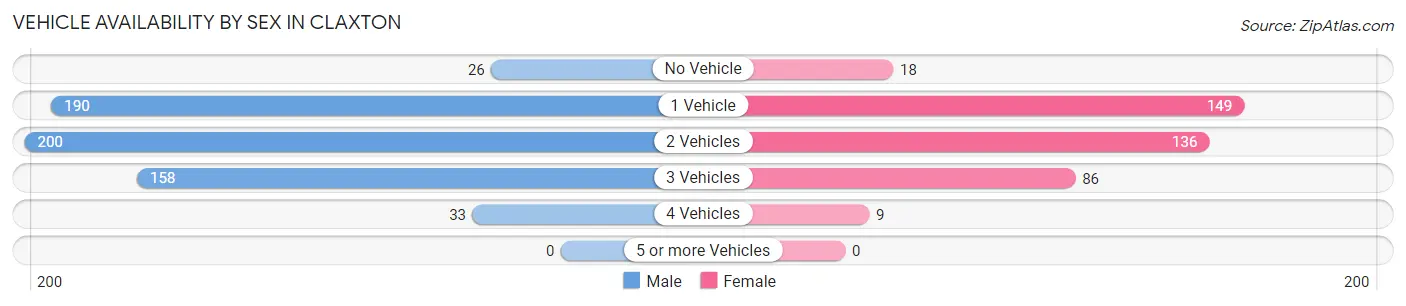
| Vehicles Available | Male | Female |
| No Vehicle | 26 (4.3%) | 18 (4.5%) |
| 1 Vehicle | 190 (31.3%) | 149 (37.4%) |
| 2 Vehicles | 200 (33.0%) | 136 (34.2%) |
| 3 Vehicles | 158 (26.0%) | 86 (21.6%) |
| 4 Vehicles | 33 (5.4%) | 9 (2.3%) |
| 5 or more Vehicles | 0 (0.0%) | 0 (0.0%) |
| Total | 607 (100.0%) | 398 (100.0%) |
Commute Time in Claxton
The most frequently occuring commute durations in Claxton are 5 to 9 minutes (240 commuters, 25.6%), 10 to 14 minutes (199 commuters, 21.2%), and less than 5 minutes (174 commuters, 18.5%).
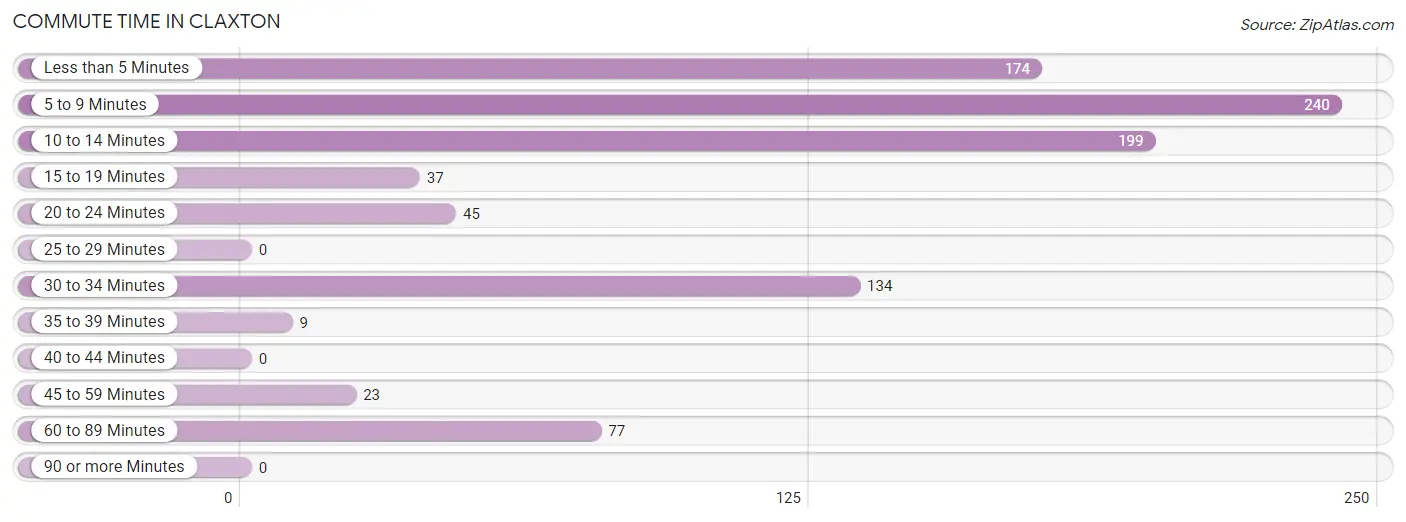
| Commute Time | # Commuters | % Commuters |
| Less than 5 Minutes | 174 | 18.5% |
| 5 to 9 Minutes | 240 | 25.6% |
| 10 to 14 Minutes | 199 | 21.2% |
| 15 to 19 Minutes | 37 | 3.9% |
| 20 to 24 Minutes | 45 | 4.8% |
| 25 to 29 Minutes | 0 | 0.0% |
| 30 to 34 Minutes | 134 | 14.3% |
| 35 to 39 Minutes | 9 | 1.0% |
| 40 to 44 Minutes | 0 | 0.0% |
| 45 to 59 Minutes | 23 | 2.5% |
| 60 to 89 Minutes | 77 | 8.2% |
| 90 or more Minutes | 0 | 0.0% |
Commute Time by Sex in Claxton
The most common commute times in Claxton are 10 to 14 minutes (184 commuters, 31.6%) for males and 5 to 9 minutes (195 commuters, 54.8%) for females.
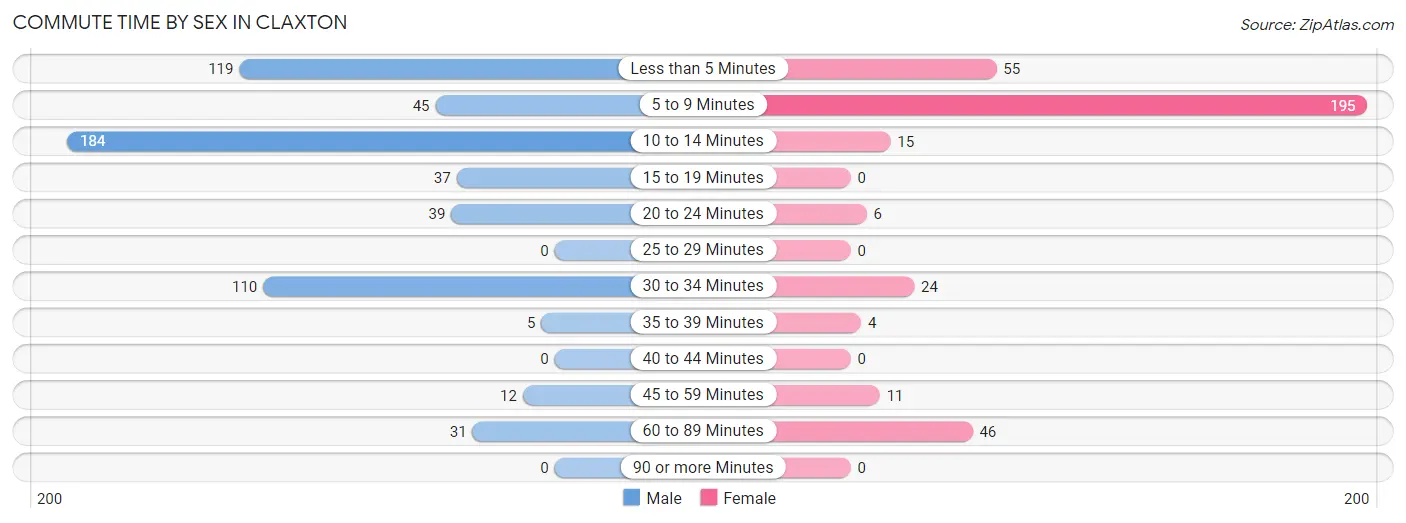
| Commute Time | Male | Female |
| Less than 5 Minutes | 119 (20.4%) | 55 (15.4%) |
| 5 to 9 Minutes | 45 (7.7%) | 195 (54.8%) |
| 10 to 14 Minutes | 184 (31.6%) | 15 (4.2%) |
| 15 to 19 Minutes | 37 (6.4%) | 0 (0.0%) |
| 20 to 24 Minutes | 39 (6.7%) | 6 (1.7%) |
| 25 to 29 Minutes | 0 (0.0%) | 0 (0.0%) |
| 30 to 34 Minutes | 110 (18.9%) | 24 (6.7%) |
| 35 to 39 Minutes | 5 (0.9%) | 4 (1.1%) |
| 40 to 44 Minutes | 0 (0.0%) | 0 (0.0%) |
| 45 to 59 Minutes | 12 (2.1%) | 11 (3.1%) |
| 60 to 89 Minutes | 31 (5.3%) | 46 (12.9%) |
| 90 or more Minutes | 0 (0.0%) | 0 (0.0%) |
Time of Departure to Work by Sex in Claxton
The most frequent times of departure to work in Claxton are 12:00 PM to 3:59 PM (98, 16.8%) for males and 10:00 AM to 10:59 AM (90, 25.3%) for females.
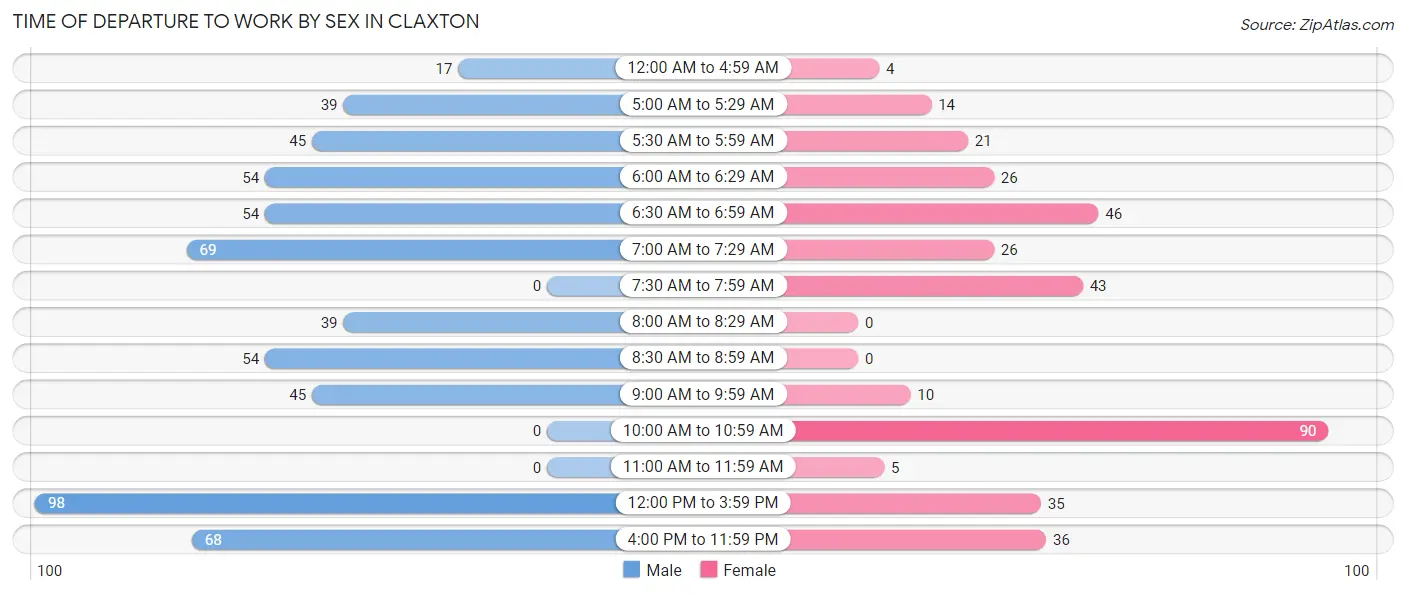
| Time of Departure | Male | Female |
| 12:00 AM to 4:59 AM | 17 (2.9%) | 4 (1.1%) |
| 5:00 AM to 5:29 AM | 39 (6.7%) | 14 (3.9%) |
| 5:30 AM to 5:59 AM | 45 (7.7%) | 21 (5.9%) |
| 6:00 AM to 6:29 AM | 54 (9.3%) | 26 (7.3%) |
| 6:30 AM to 6:59 AM | 54 (9.3%) | 46 (12.9%) |
| 7:00 AM to 7:29 AM | 69 (11.9%) | 26 (7.3%) |
| 7:30 AM to 7:59 AM | 0 (0.0%) | 43 (12.1%) |
| 8:00 AM to 8:29 AM | 39 (6.7%) | 0 (0.0%) |
| 8:30 AM to 8:59 AM | 54 (9.3%) | 0 (0.0%) |
| 9:00 AM to 9:59 AM | 45 (7.7%) | 10 (2.8%) |
| 10:00 AM to 10:59 AM | 0 (0.0%) | 90 (25.3%) |
| 11:00 AM to 11:59 AM | 0 (0.0%) | 5 (1.4%) |
| 12:00 PM to 3:59 PM | 98 (16.8%) | 35 (9.8%) |
| 4:00 PM to 11:59 PM | 68 (11.7%) | 36 (10.1%) |
| Total | 582 (100.0%) | 356 (100.0%) |
Housing Occupancy in Claxton
Occupancy by Ownership in Claxton
Of the total 968 dwellings in Claxton, owner-occupied units account for 454 (46.9%), while renter-occupied units make up 514 (53.1%).
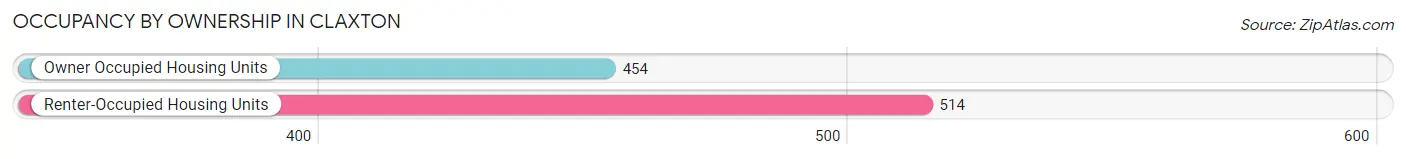
| Occupancy | # Housing Units | % Housing Units |
| Owner Occupied Housing Units | 454 | 46.9% |
| Renter-Occupied Housing Units | 514 | 53.1% |
| Total Occupied Housing Units | 968 | 100.0% |
Occupancy by Household Size in Claxton
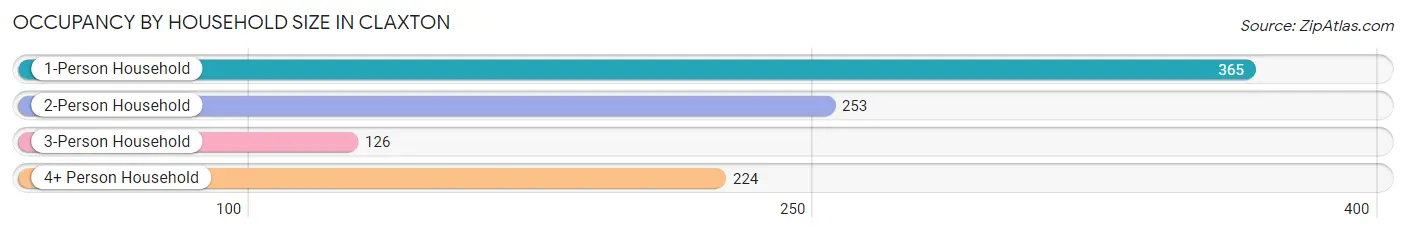
| Household Size | # Housing Units | % Housing Units |
| 1-Person Household | 365 | 37.7% |
| 2-Person Household | 253 | 26.1% |
| 3-Person Household | 126 | 13.0% |
| 4+ Person Household | 224 | 23.1% |
| Total Housing Units | 968 | 100.0% |
Occupancy by Ownership by Household Size in Claxton
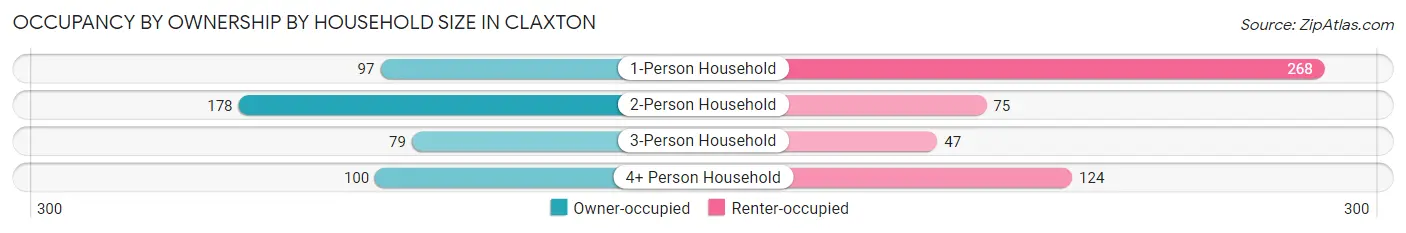
| Household Size | Owner-occupied | Renter-occupied |
| 1-Person Household | 97 (26.6%) | 268 (73.4%) |
| 2-Person Household | 178 (70.4%) | 75 (29.6%) |
| 3-Person Household | 79 (62.7%) | 47 (37.3%) |
| 4+ Person Household | 100 (44.6%) | 124 (55.4%) |
| Total Housing Units | 454 (46.9%) | 514 (53.1%) |
Occupancy by Educational Attainment in Claxton
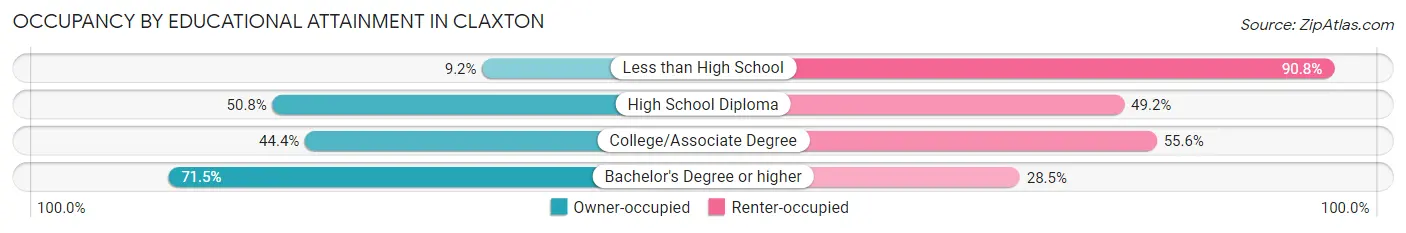
| Household Size | Owner-occupied | Renter-occupied |
| Less than High School | 11 (9.2%) | 108 (90.8%) |
| High School Diploma | 184 (50.8%) | 178 (49.2%) |
| College/Associate Degree | 146 (44.4%) | 183 (55.6%) |
| Bachelor's Degree or higher | 113 (71.5%) | 45 (28.5%) |
Occupancy by Age of Householder in Claxton
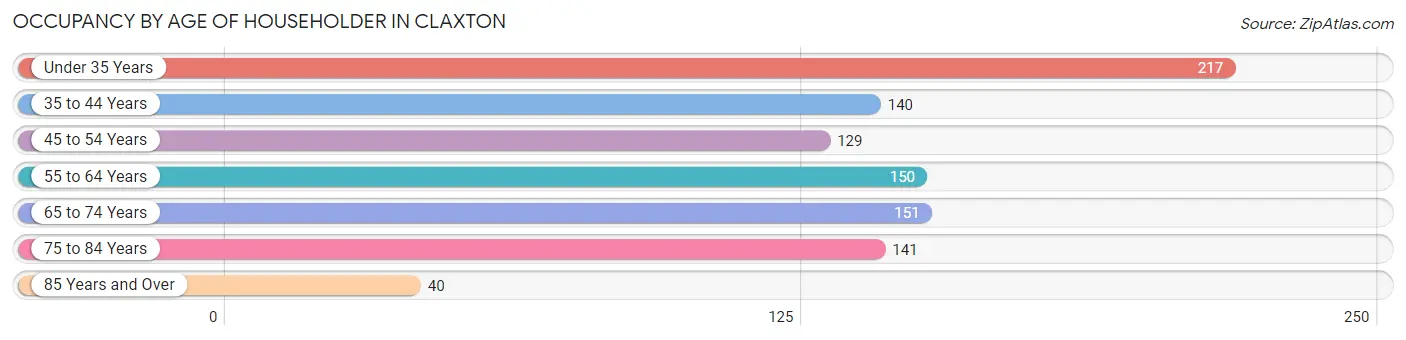
| Age Bracket | # Households | % Households |
| Under 35 Years | 217 | 22.4% |
| 35 to 44 Years | 140 | 14.5% |
| 45 to 54 Years | 129 | 13.3% |
| 55 to 64 Years | 150 | 15.5% |
| 65 to 74 Years | 151 | 15.6% |
| 75 to 84 Years | 141 | 14.6% |
| 85 Years and Over | 40 | 4.1% |
| Total | 968 | 100.0% |
Housing Finances in Claxton
Median Income by Occupancy in Claxton
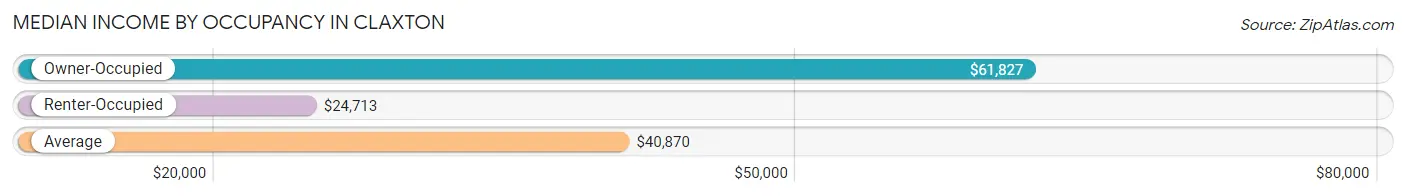
| Occupancy Type | # Households | Median Income |
| Owner-Occupied | 454 (46.9%) | $61,827 |
| Renter-Occupied | 514 (53.1%) | $24,713 |
| Average | 968 (100.0%) | $40,870 |
Occupancy by Householder Income Bracket in Claxton
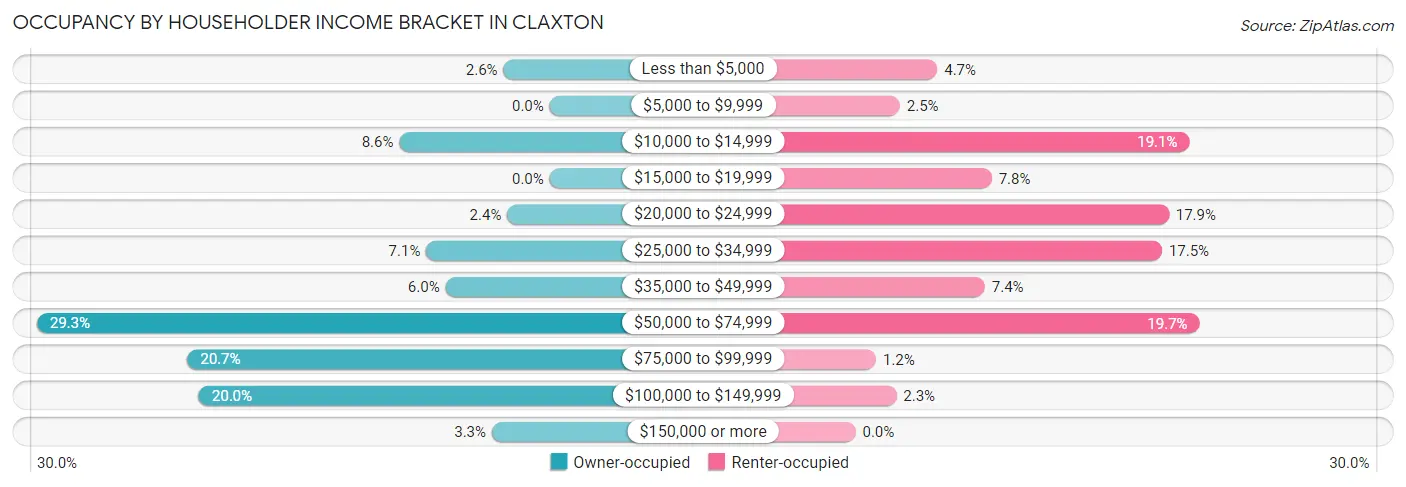
| Income Bracket | Owner-occupied | Renter-occupied |
| Less than $5,000 | 12 (2.6%) | 24 (4.7%) |
| $5,000 to $9,999 | 0 (0.0%) | 13 (2.5%) |
| $10,000 to $14,999 | 39 (8.6%) | 98 (19.1%) |
| $15,000 to $19,999 | 0 (0.0%) | 40 (7.8%) |
| $20,000 to $24,999 | 11 (2.4%) | 92 (17.9%) |
| $25,000 to $34,999 | 32 (7.0%) | 90 (17.5%) |
| $35,000 to $49,999 | 27 (5.9%) | 38 (7.4%) |
| $50,000 to $74,999 | 133 (29.3%) | 101 (19.7%) |
| $75,000 to $99,999 | 94 (20.7%) | 6 (1.2%) |
| $100,000 to $149,999 | 91 (20.0%) | 12 (2.3%) |
| $150,000 or more | 15 (3.3%) | 0 (0.0%) |
| Total | 454 (100.0%) | 514 (100.0%) |
Monthly Housing Cost Tiers in Claxton
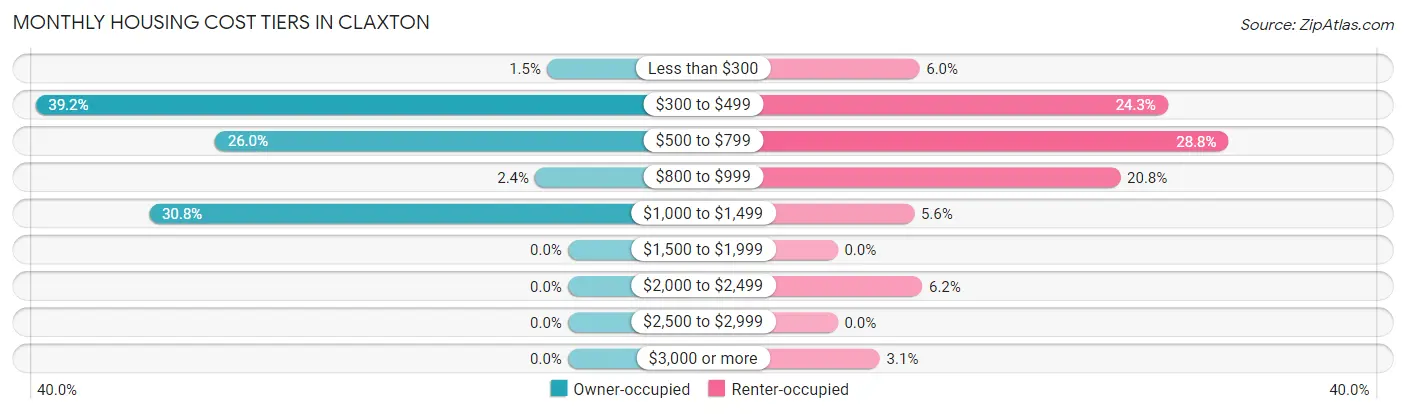
| Monthly Cost | Owner-occupied | Renter-occupied |
| Less than $300 | 7 (1.5%) | 31 (6.0%) |
| $300 to $499 | 178 (39.2%) | 125 (24.3%) |
| $500 to $799 | 118 (26.0%) | 148 (28.8%) |
| $800 to $999 | 11 (2.4%) | 107 (20.8%) |
| $1,000 to $1,499 | 140 (30.8%) | 29 (5.6%) |
| $1,500 to $1,999 | 0 (0.0%) | 0 (0.0%) |
| $2,000 to $2,499 | 0 (0.0%) | 32 (6.2%) |
| $2,500 to $2,999 | 0 (0.0%) | 0 (0.0%) |
| $3,000 or more | 0 (0.0%) | 16 (3.1%) |
| Total | 454 (100.0%) | 514 (100.0%) |
Physical Housing Characteristics in Claxton
Housing Structures in Claxton
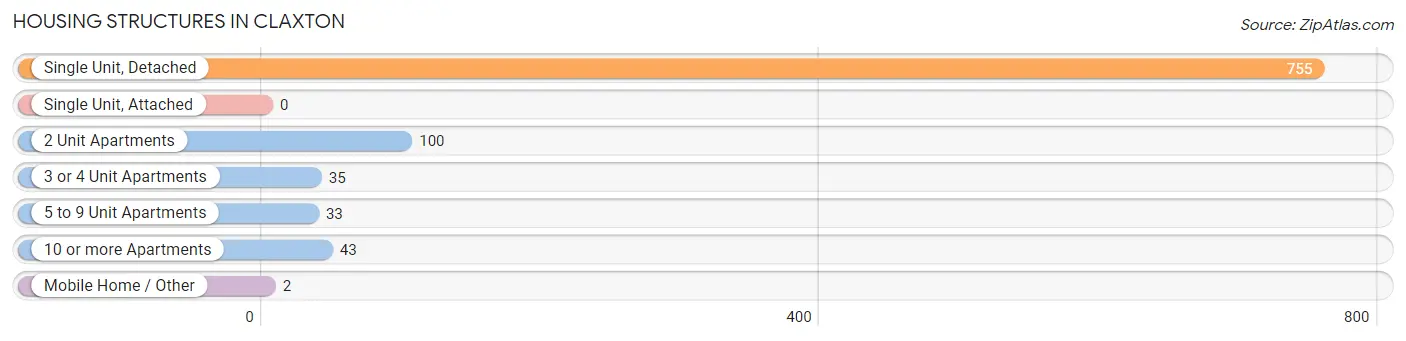
| Structure Type | # Housing Units | % Housing Units |
| Single Unit, Detached | 755 | 78.0% |
| Single Unit, Attached | 0 | 0.0% |
| 2 Unit Apartments | 100 | 10.3% |
| 3 or 4 Unit Apartments | 35 | 3.6% |
| 5 to 9 Unit Apartments | 33 | 3.4% |
| 10 or more Apartments | 43 | 4.4% |
| Mobile Home / Other | 2 | 0.2% |
| Total | 968 | 100.0% |
Housing Structures by Occupancy in Claxton
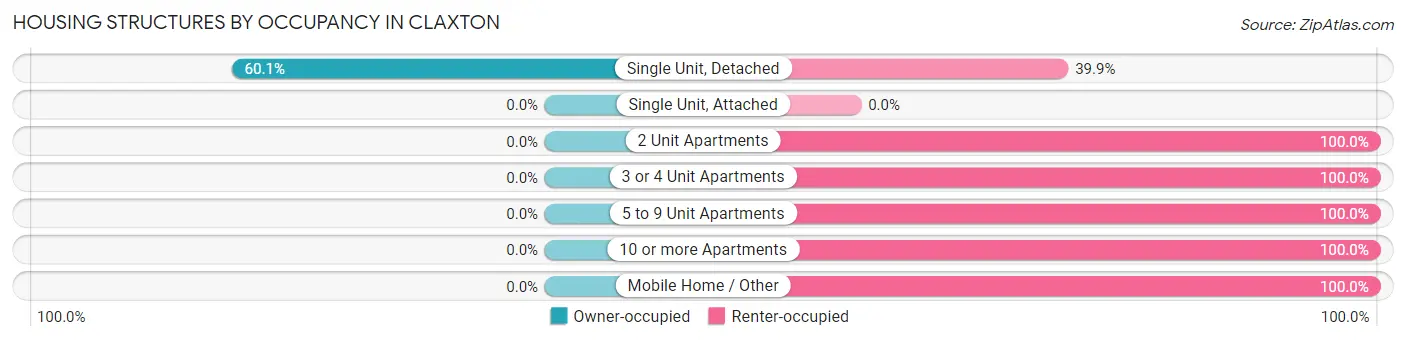
| Structure Type | Owner-occupied | Renter-occupied |
| Single Unit, Detached | 454 (60.1%) | 301 (39.9%) |
| Single Unit, Attached | 0 (0.0%) | 0 (0.0%) |
| 2 Unit Apartments | 0 (0.0%) | 100 (100.0%) |
| 3 or 4 Unit Apartments | 0 (0.0%) | 35 (100.0%) |
| 5 to 9 Unit Apartments | 0 (0.0%) | 33 (100.0%) |
| 10 or more Apartments | 0 (0.0%) | 43 (100.0%) |
| Mobile Home / Other | 0 (0.0%) | 2 (100.0%) |
| Total | 454 (46.9%) | 514 (53.1%) |
Housing Structures by Number of Rooms in Claxton
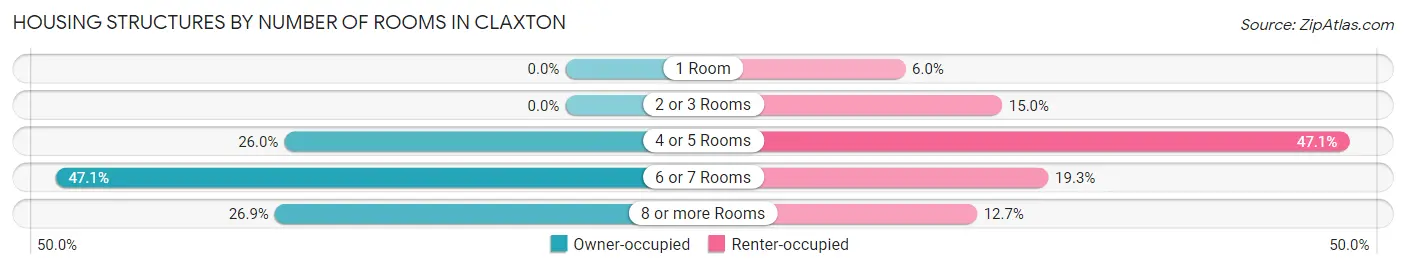
| Number of Rooms | Owner-occupied | Renter-occupied |
| 1 Room | 0 (0.0%) | 31 (6.0%) |
| 2 or 3 Rooms | 0 (0.0%) | 77 (15.0%) |
| 4 or 5 Rooms | 118 (26.0%) | 242 (47.1%) |
| 6 or 7 Rooms | 214 (47.1%) | 99 (19.3%) |
| 8 or more Rooms | 122 (26.9%) | 65 (12.7%) |
| Total | 454 (100.0%) | 514 (100.0%) |
Housing Structure by Heating Type in Claxton
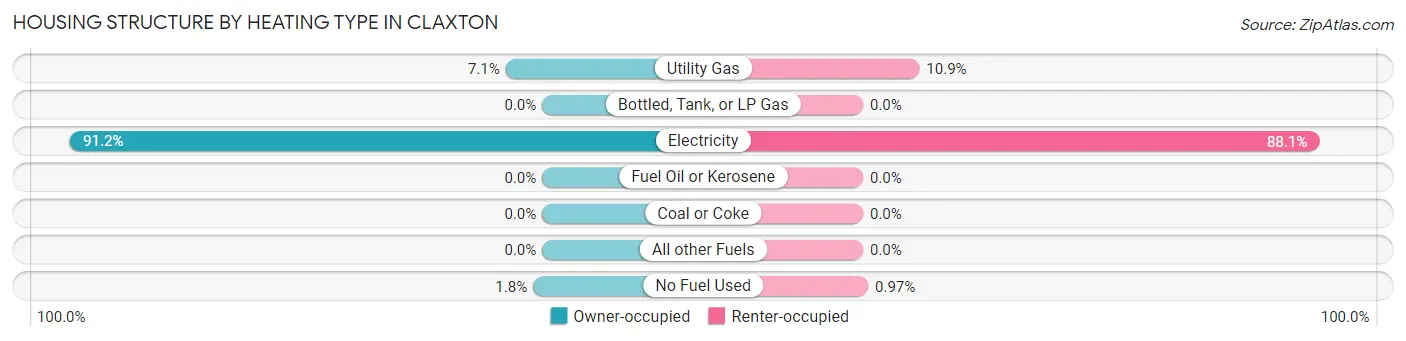
| Heating Type | Owner-occupied | Renter-occupied |
| Utility Gas | 32 (7.0%) | 56 (10.9%) |
| Bottled, Tank, or LP Gas | 0 (0.0%) | 0 (0.0%) |
| Electricity | 414 (91.2%) | 453 (88.1%) |
| Fuel Oil or Kerosene | 0 (0.0%) | 0 (0.0%) |
| Coal or Coke | 0 (0.0%) | 0 (0.0%) |
| All other Fuels | 0 (0.0%) | 0 (0.0%) |
| No Fuel Used | 8 (1.8%) | 5 (1.0%) |
| Total | 454 (100.0%) | 514 (100.0%) |
Household Vehicle Usage in Claxton
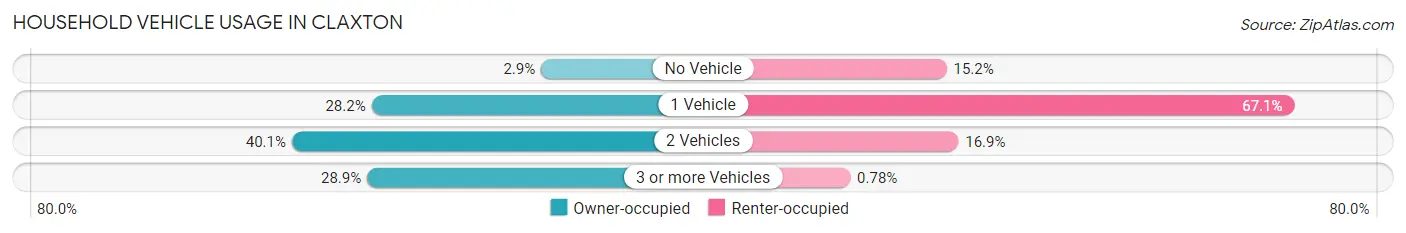
| Vehicles per Household | Owner-occupied | Renter-occupied |
| No Vehicle | 13 (2.9%) | 78 (15.2%) |
| 1 Vehicle | 128 (28.2%) | 345 (67.1%) |
| 2 Vehicles | 182 (40.1%) | 87 (16.9%) |
| 3 or more Vehicles | 131 (28.8%) | 4 (0.8%) |
| Total | 454 (100.0%) | 514 (100.0%) |
Real Estate & Mortgages in Claxton
Real Estate and Mortgage Overview in Claxton
| Characteristic | Without Mortgage | With Mortgage |
| Housing Units | 258 | 196 |
| Median Property Value | $150,400 | $103,100 |
| Median Household Income | $61,346 | $0 |
| Monthly Housing Costs | $478 | $0 |
| Real Estate Taxes | $1,438 | $20 |
Property Value by Mortgage Status in Claxton
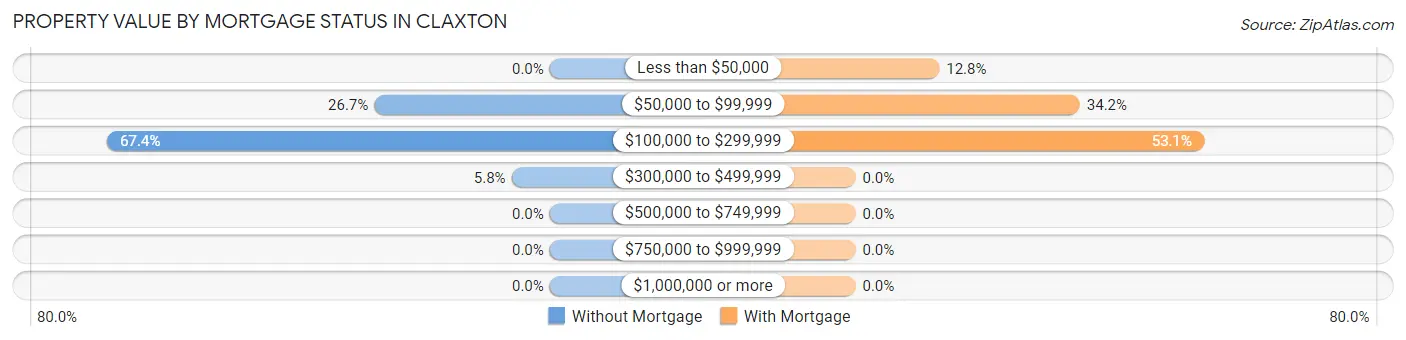
| Property Value | Without Mortgage | With Mortgage |
| Less than $50,000 | 0 (0.0%) | 25 (12.8%) |
| $50,000 to $99,999 | 69 (26.7%) | 67 (34.2%) |
| $100,000 to $299,999 | 174 (67.4%) | 104 (53.1%) |
| $300,000 to $499,999 | 15 (5.8%) | 0 (0.0%) |
| $500,000 to $749,999 | 0 (0.0%) | 0 (0.0%) |
| $750,000 to $999,999 | 0 (0.0%) | 0 (0.0%) |
| $1,000,000 or more | 0 (0.0%) | 0 (0.0%) |
| Total | 258 (100.0%) | 196 (100.0%) |
Household Income by Mortgage Status in Claxton
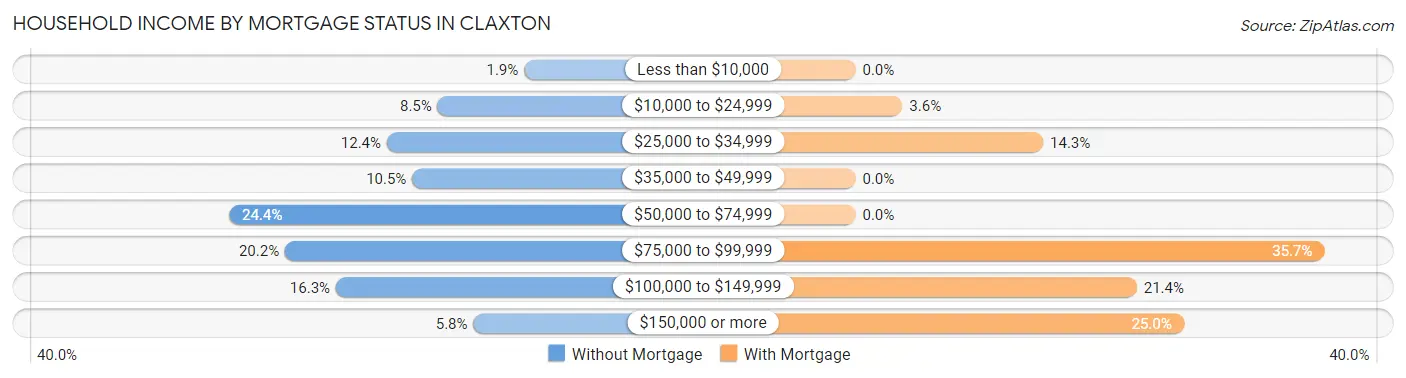
| Household Income | Without Mortgage | With Mortgage |
| Less than $10,000 | 5 (1.9%) | 0 (0.0%) |
| $10,000 to $24,999 | 22 (8.5%) | 7 (3.6%) |
| $25,000 to $34,999 | 32 (12.4%) | 28 (14.3%) |
| $35,000 to $49,999 | 27 (10.5%) | 0 (0.0%) |
| $50,000 to $74,999 | 63 (24.4%) | 0 (0.0%) |
| $75,000 to $99,999 | 52 (20.2%) | 70 (35.7%) |
| $100,000 to $149,999 | 42 (16.3%) | 42 (21.4%) |
| $150,000 or more | 15 (5.8%) | 49 (25.0%) |
| Total | 258 (100.0%) | 196 (100.0%) |
Property Value to Household Income Ratio in Claxton
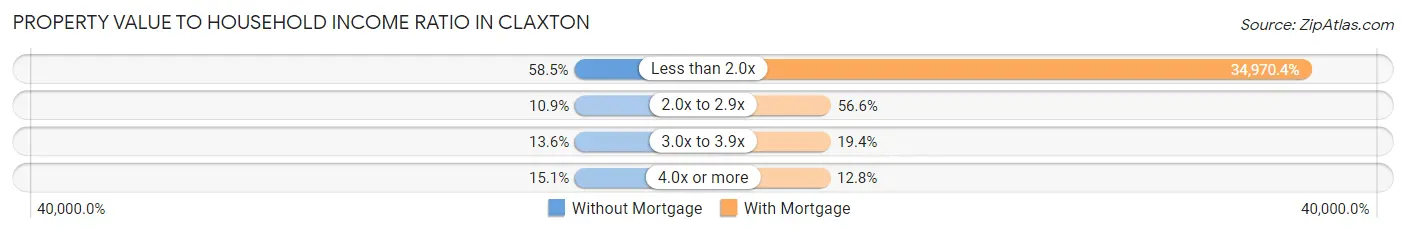
| Value-to-Income Ratio | Without Mortgage | With Mortgage |
| Less than 2.0x | 151 (58.5%) | 68,542 (34,970.4%) |
| 2.0x to 2.9x | 28 (10.8%) | 111 (56.6%) |
| 3.0x to 3.9x | 35 (13.6%) | 38 (19.4%) |
| 4.0x or more | 39 (15.1%) | 25 (12.8%) |
| Total | 258 (100.0%) | 196 (100.0%) |
Real Estate Taxes by Mortgage Status in Claxton
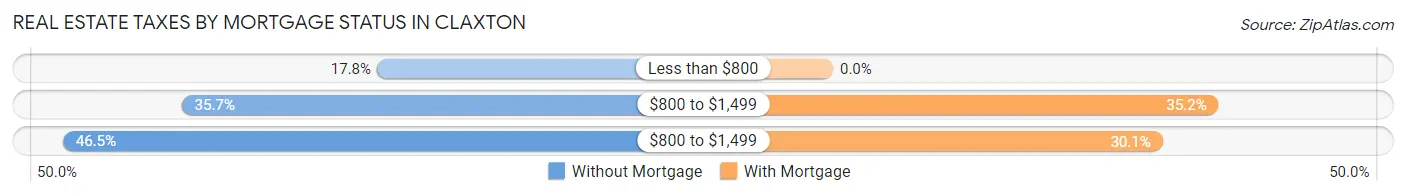
| Property Taxes | Without Mortgage | With Mortgage |
| Less than $800 | 46 (17.8%) | 0 (0.0%) |
| $800 to $1,499 | 92 (35.7%) | 69 (35.2%) |
| $800 to $1,499 | 120 (46.5%) | 59 (30.1%) |
| Total | 258 (100.0%) | 196 (100.0%) |
Health & Disability in Claxton
Health Insurance Coverage by Age in Claxton
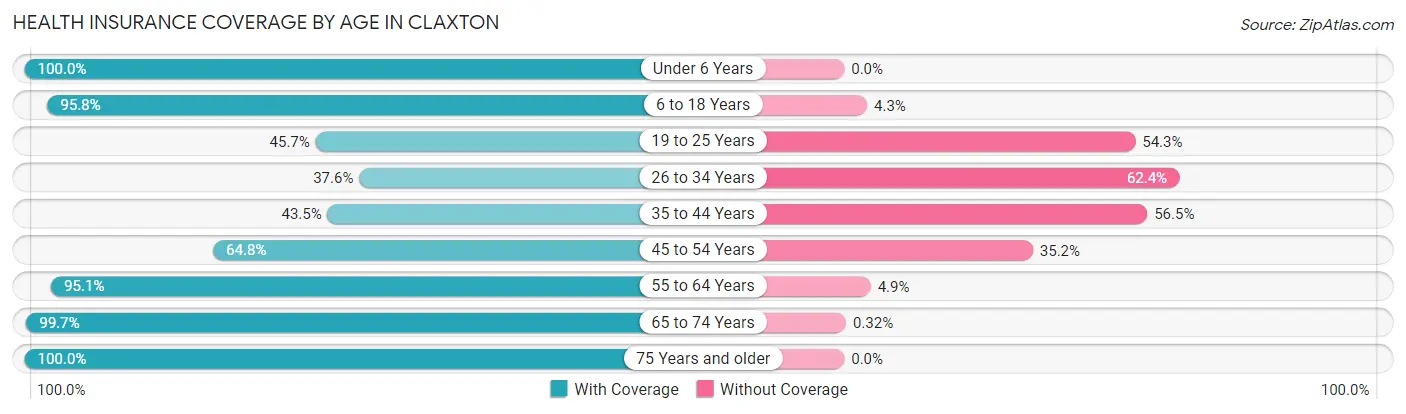
| Age Bracket | With Coverage | Without Coverage |
| Under 6 Years | 88 (100.0%) | 0 (0.0%) |
| 6 to 18 Years | 653 (95.8%) | 29 (4.3%) |
| 19 to 25 Years | 91 (45.7%) | 108 (54.3%) |
| 26 to 34 Years | 91 (37.6%) | 151 (62.4%) |
| 35 to 44 Years | 104 (43.5%) | 135 (56.5%) |
| 45 to 54 Years | 201 (64.8%) | 109 (35.2%) |
| 55 to 64 Years | 193 (95.1%) | 10 (4.9%) |
| 65 to 74 Years | 311 (99.7%) | 1 (0.3%) |
| 75 Years and older | 268 (100.0%) | 0 (0.0%) |
| Total | 2,000 (78.6%) | 543 (21.3%) |
Health Insurance Coverage by Citizenship Status in Claxton
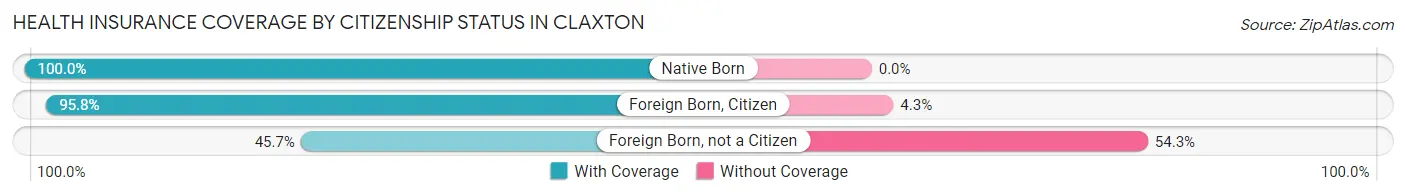
| Citizenship Status | With Coverage | Without Coverage |
| Native Born | 88 (100.0%) | 0 (0.0%) |
| Foreign Born, Citizen | 653 (95.8%) | 29 (4.3%) |
| Foreign Born, not a Citizen | 91 (45.7%) | 108 (54.3%) |
Health Insurance Coverage by Household Income in Claxton
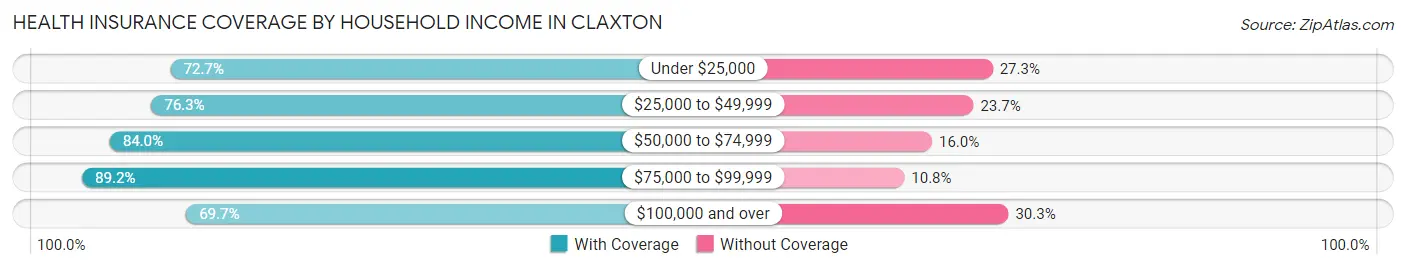
| Household Income | With Coverage | Without Coverage |
| Under $25,000 | 412 (72.7%) | 155 (27.3%) |
| $25,000 to $49,999 | 273 (76.3%) | 85 (23.7%) |
| $50,000 to $74,999 | 663 (84.0%) | 126 (16.0%) |
| $75,000 to $99,999 | 339 (89.2%) | 41 (10.8%) |
| $100,000 and over | 313 (69.7%) | 136 (30.3%) |
Public vs Private Health Insurance Coverage by Age in Claxton
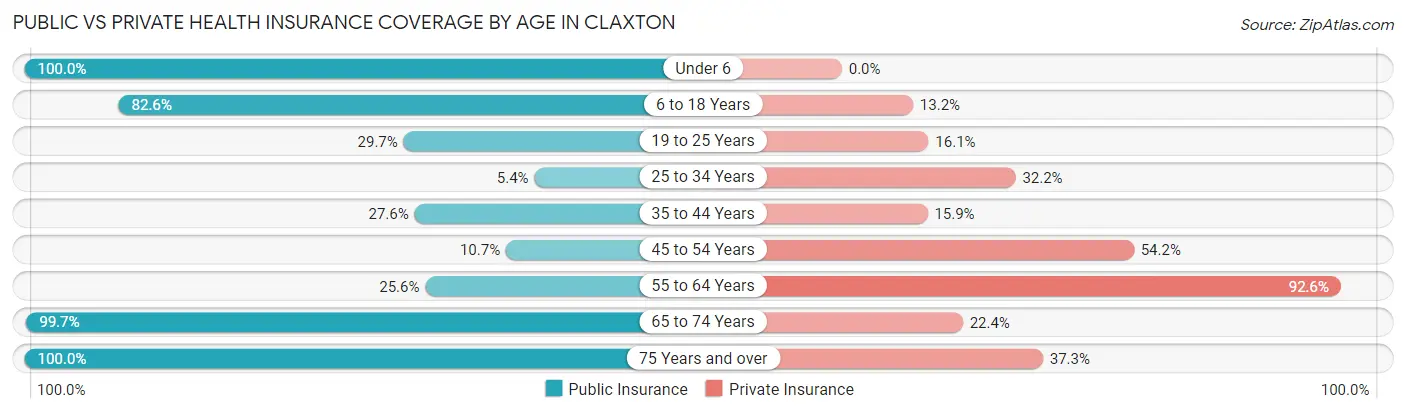
| Age Bracket | Public Insurance | Private Insurance |
| Under 6 | 88 (100.0%) | 0 (0.0%) |
| 6 to 18 Years | 563 (82.6%) | 90 (13.2%) |
| 19 to 25 Years | 59 (29.6%) | 32 (16.1%) |
| 25 to 34 Years | 13 (5.4%) | 78 (32.2%) |
| 35 to 44 Years | 66 (27.6%) | 38 (15.9%) |
| 45 to 54 Years | 33 (10.6%) | 168 (54.2%) |
| 55 to 64 Years | 52 (25.6%) | 188 (92.6%) |
| 65 to 74 Years | 311 (99.7%) | 70 (22.4%) |
| 75 Years and over | 268 (100.0%) | 100 (37.3%) |
| Total | 1,453 (57.1%) | 764 (30.0%) |
Disability Status by Sex by Age in Claxton
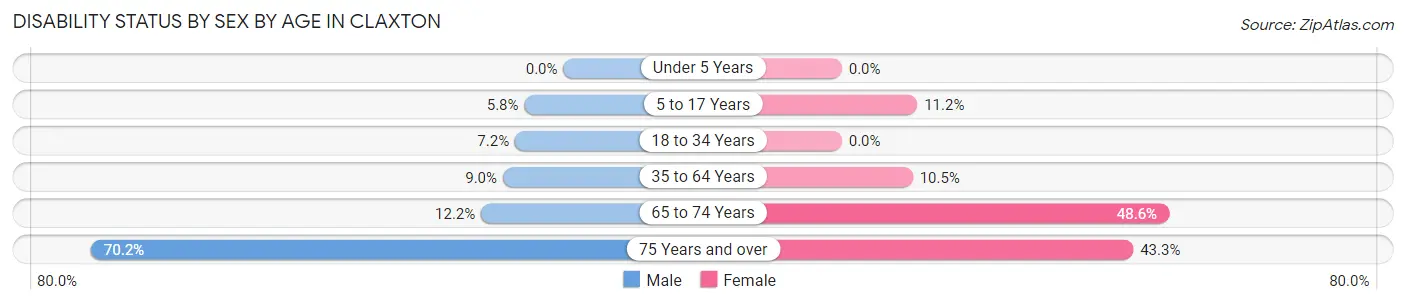
| Age Bracket | Male | Female |
| Under 5 Years | 0 (0.0%) | 0 (0.0%) |
| 5 to 17 Years | 14 (5.8%) | 28 (11.2%) |
| 18 to 34 Years | 27 (7.2%) | 0 (0.0%) |
| 35 to 64 Years | 30 (9.0%) | 44 (10.5%) |
| 65 to 74 Years | 21 (12.2%) | 68 (48.6%) |
| 75 Years and over | 47 (70.2%) | 87 (43.3%) |
Disability Class by Sex by Age in Claxton
Disability Class: Hearing Difficulty
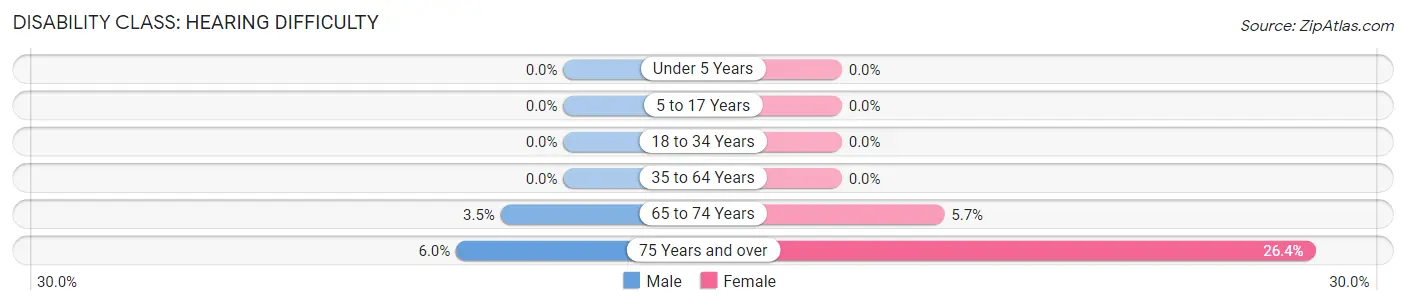
| Age Bracket | Male | Female |
| Under 5 Years | 0 (0.0%) | 0 (0.0%) |
| 5 to 17 Years | 0 (0.0%) | 0 (0.0%) |
| 18 to 34 Years | 0 (0.0%) | 0 (0.0%) |
| 35 to 64 Years | 0 (0.0%) | 0 (0.0%) |
| 65 to 74 Years | 6 (3.5%) | 8 (5.7%) |
| 75 Years and over | 4 (6.0%) | 53 (26.4%) |
Disability Class: Vision Difficulty
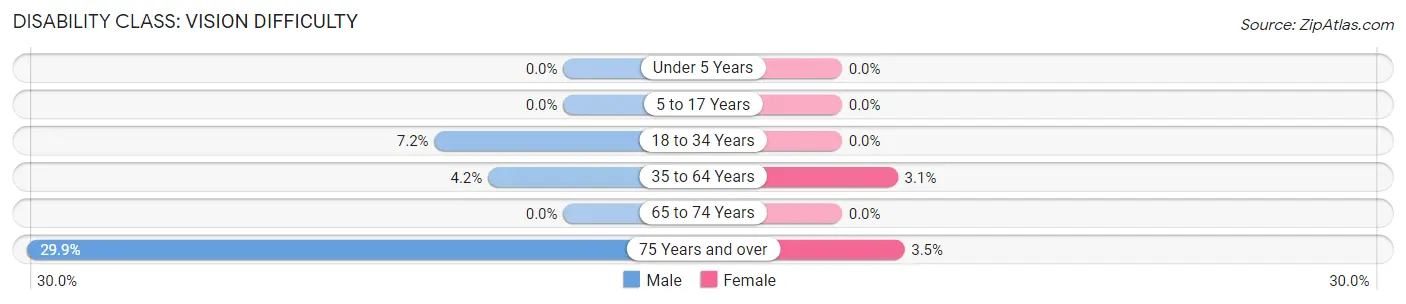
| Age Bracket | Male | Female |
| Under 5 Years | 0 (0.0%) | 0 (0.0%) |
| 5 to 17 Years | 0 (0.0%) | 0 (0.0%) |
| 18 to 34 Years | 27 (7.2%) | 0 (0.0%) |
| 35 to 64 Years | 14 (4.2%) | 13 (3.1%) |
| 65 to 74 Years | 0 (0.0%) | 0 (0.0%) |
| 75 Years and over | 20 (29.8%) | 7 (3.5%) |
Disability Class: Cognitive Difficulty
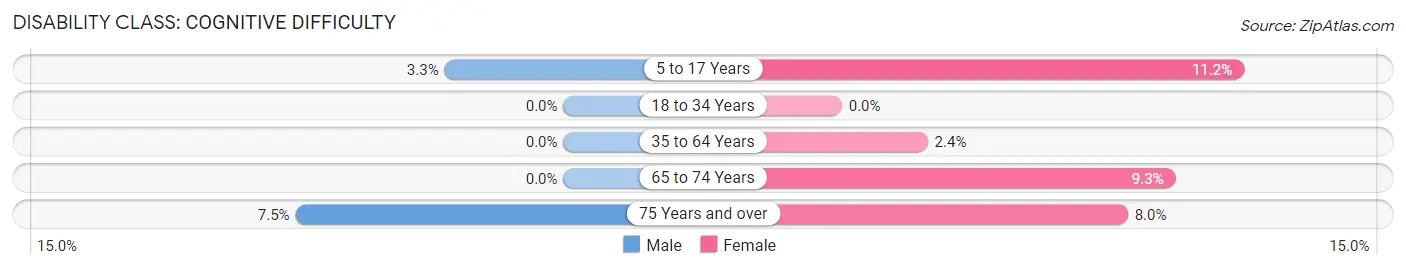
| Age Bracket | Male | Female |
| 5 to 17 Years | 8 (3.3%) | 28 (11.2%) |
| 18 to 34 Years | 0 (0.0%) | 0 (0.0%) |
| 35 to 64 Years | 0 (0.0%) | 10 (2.4%) |
| 65 to 74 Years | 0 (0.0%) | 13 (9.3%) |
| 75 Years and over | 5 (7.5%) | 16 (8.0%) |
Disability Class: Ambulatory Difficulty
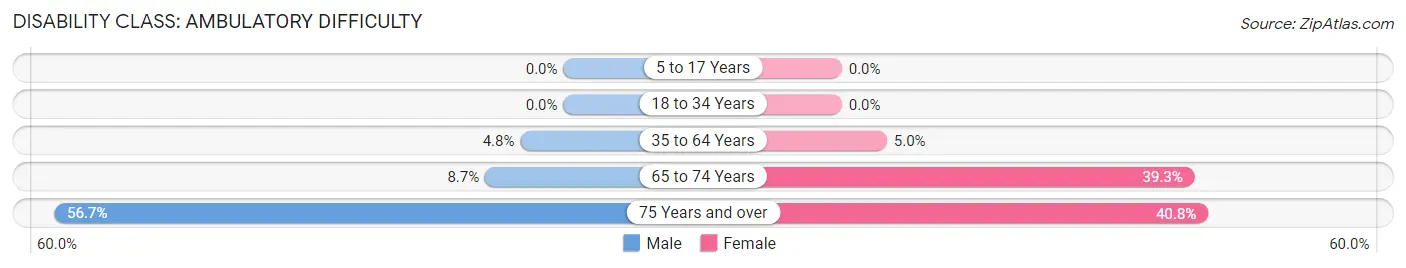
| Age Bracket | Male | Female |
| 5 to 17 Years | 0 (0.0%) | 0 (0.0%) |
| 18 to 34 Years | 0 (0.0%) | 0 (0.0%) |
| 35 to 64 Years | 16 (4.8%) | 21 (5.0%) |
| 65 to 74 Years | 15 (8.7%) | 55 (39.3%) |
| 75 Years and over | 38 (56.7%) | 82 (40.8%) |
Disability Class: Self-Care Difficulty
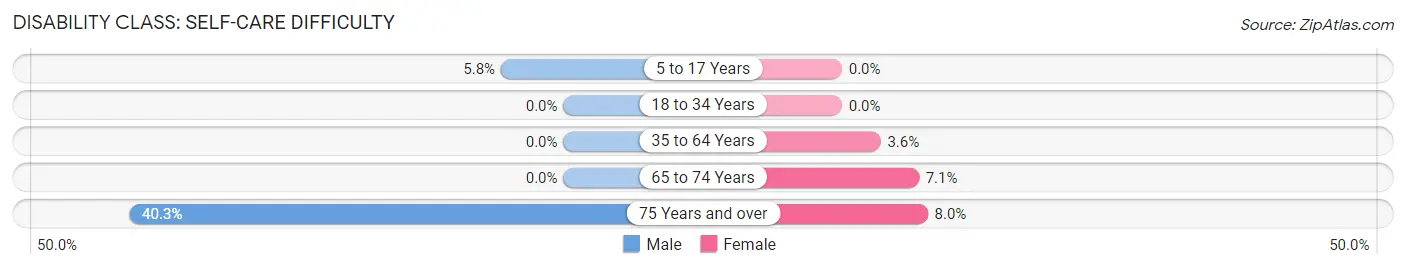
| Age Bracket | Male | Female |
| 5 to 17 Years | 14 (5.8%) | 0 (0.0%) |
| 18 to 34 Years | 0 (0.0%) | 0 (0.0%) |
| 35 to 64 Years | 0 (0.0%) | 15 (3.6%) |
| 65 to 74 Years | 0 (0.0%) | 10 (7.1%) |
| 75 Years and over | 27 (40.3%) | 16 (8.0%) |
Technology Access in Claxton
Computing Device Access in Claxton
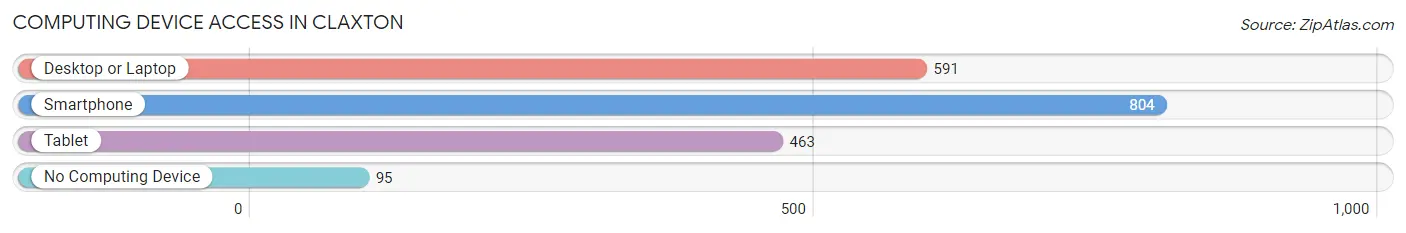
| Device Type | # Households | % Households |
| Desktop or Laptop | 591 | 61.1% |
| Smartphone | 804 | 83.1% |
| Tablet | 463 | 47.8% |
| No Computing Device | 95 | 9.8% |
| Total | 968 | 100.0% |
Internet Access in Claxton
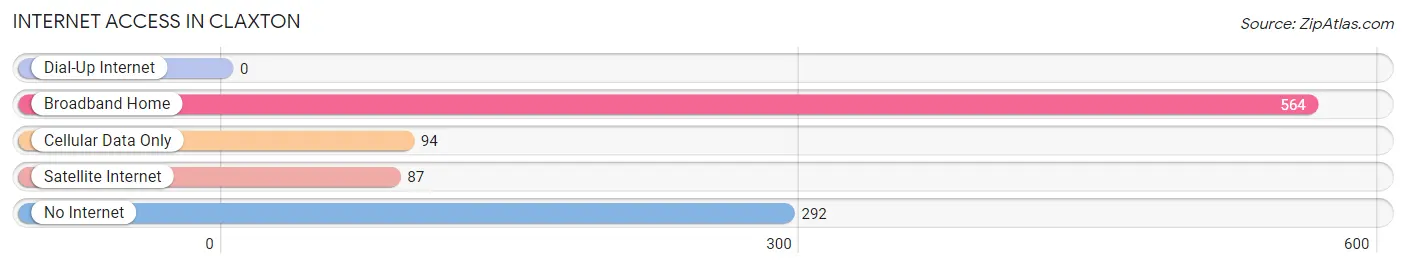
| Internet Type | # Households | % Households |
| Dial-Up Internet | 0 | 0.0% |
| Broadband Home | 564 | 58.3% |
| Cellular Data Only | 94 | 9.7% |
| Satellite Internet | 87 | 9.0% |
| No Internet | 292 | 30.2% |
| Total | 968 | 100.0% |
Claxton Summary
Claxton, Georgia is a small town located in Evans County, Georgia. It is situated in the southeastern part of the state, about 30 miles west of Savannah. The town was founded in 1891 and is named after a local family, the Claxtons. The population of Claxton was 2,717 at the 2010 census.
Geography
Claxton is located at 32°45'25" North, 82°2'25" West (32.7569, -82.0401). It is situated in the southeastern part of the state, about 30 miles west of Savannah. The town is located in the coastal plain region of Georgia, and is surrounded by farmland and pine forests. The town is located on the Ogeechee River, which is a major tributary of the Savannah River.
Climate
Claxton has a humid subtropical climate, with hot, humid summers and mild winters. The average annual temperature is around 70°F (21°C). The average annual precipitation is around 50 inches (127 cm).
Demographics
As of the 2010 census, there were 2,717 people, 1,093 households, and 745 families residing in the town. The population density was 1,072.3 people per square mile (414.7/km2). The racial makeup of the town was 68.2% White, 28.3% African American, 0.2% Native American, 0.7% Asian, 0.1% Pacific Islander, 0.7% from other races, and 1.7% from two or more races. Hispanic or Latino of any race were 2.2% of the population.
Economy
The economy of Claxton is largely based on agriculture and manufacturing. The town is home to several large poultry processing plants, as well as a number of smaller businesses. The town is also home to a number of small retail stores, restaurants, and other businesses.
Education
Claxton is served by the Evans County School System. The town has one elementary school, one middle school, and one high school. The town also has a number of private schools, including Claxton Christian Academy and Claxton Academy.
Transportation
Claxton is served by US Highway 280, which runs through the town. The town is also served by a number of local roads and highways. The nearest airport is the Savannah/Hilton Head International Airport, which is located about 30 miles away.
Culture
Claxton is home to a number of cultural attractions, including the Claxton Arts Center, which hosts a variety of art exhibitions and performances. The town also hosts a number of festivals throughout the year, including the Claxton Watermelon Festival and the Claxton Peach Festival. The town is also home to a number of historic sites, including the Claxton Historic District and the Claxton-Evans County Museum.
Common Questions
What is Per Capita Income in Claxton?
Per Capita income in Claxton is $19,708.
What is the Median Family Income in Claxton?
Median Family Income in Claxton is $56,649.
What is the Median Household income in Claxton?
Median Household Income in Claxton is $40,870.
What is Income or Wage Gap in Claxton?
Income or Wage Gap in Claxton is 39.9%.
Women in Claxton earn 60.1 cents for every dollar earned by a man.
What is Inequality or Gini Index in Claxton?
Inequality or Gini Index in Claxton is 0.42.
What is the Total Population of Claxton?
Total Population of Claxton is 2,573.
What is the Total Male Population of Claxton?
Total Male Population of Claxton is 1,266.
What is the Total Female Population of Claxton?
Total Female Population of Claxton is 1,307.
What is the Ratio of Males per 100 Females in Claxton?
There are 96.86 Males per 100 Females in Claxton.
What is the Ratio of Females per 100 Males in Claxton?
There are 103.24 Females per 100 Males in Claxton.
What is the Median Population Age in Claxton?
Median Population Age in Claxton is 36.9 Years.
What is the Average Family Size in Claxton
Average Family Size in Claxton is 3.4 People.
What is the Average Household Size in Claxton
Average Household Size in Claxton is 2.6 People.
How Large is the Labor Force in Claxton?
There are 1,110 People in the Labor Forcein in Claxton.
What is the Percentage of People in the Labor Force in Claxton?
54.9% of People are in the Labor Force in Claxton.
What is the Unemployment Rate in Claxton?
Unemployment Rate in Claxton is 3.2%.