Omega, GA Map & Demographics
Omega Map
Omega Overview
$17,373
PER CAPITA INCOME
$44,135
AVG FAMILY INCOME
$43,269
AVG HOUSEHOLD INCOME
48.7%
WAGE / INCOME GAP [ % ]
51.3¢/ $1
WAGE / INCOME GAP [ $ ]
0.38
INEQUALITY / GINI INDEX
1,302
TOTAL POPULATION
600
MALE POPULATION
702
FEMALE POPULATION
85.47
MALES / 100 FEMALES
117.00
FEMALES / 100 MALES
37.0
MEDIAN AGE
3.6
AVG FAMILY SIZE
3.1
AVG HOUSEHOLD SIZE
560
LABOR FORCE [ PEOPLE ]
59.1%
PERCENT IN LABOR FORCE
2.9%
UNEMPLOYMENT RATE
Omega Zip Codes
Omega Area Codes
Income in Omega
Income Overview in Omega
Per Capita Income in Omega is $17,373, while median incomes of families and households are $44,135 and $43,269 respectively.
| Characteristic | Number | Measure |
| Per Capita Income | 1,302 | $17,373 |
| Median Family Income | 317 | $44,135 |
| Mean Family Income | 317 | $53,945 |
| Median Household Income | 418 | $43,269 |
| Mean Household Income | 418 | $49,802 |
| Income Deficit | 317 | $0 |
| Wage / Income Gap (%) | 1,302 | 48.69% |
| Wage / Income Gap ($) | 1,302 | 51.31¢ per $1 |
| Gini / Inequality Index | 1,302 | 0.38 |
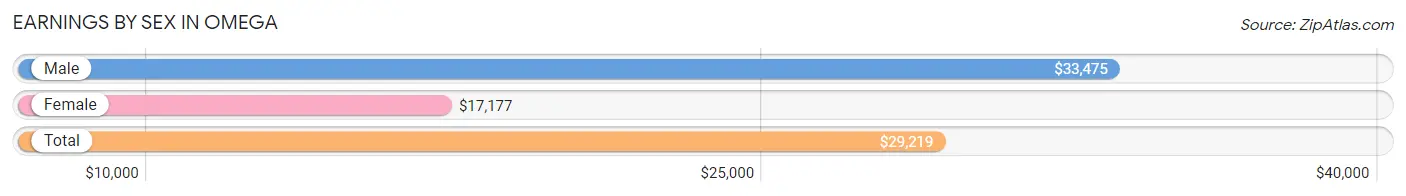
Earnings by Sex in Omega
Average Earnings in Omega are $29,219, $33,475 for men and $17,177 for women, a difference of 48.7%.
| Sex | Number | Average Earnings |
| Male | 305 (54.2%) | $33,475 |
| Female | 258 (45.8%) | $17,177 |
| Total | 563 (100.0%) | $29,219 |
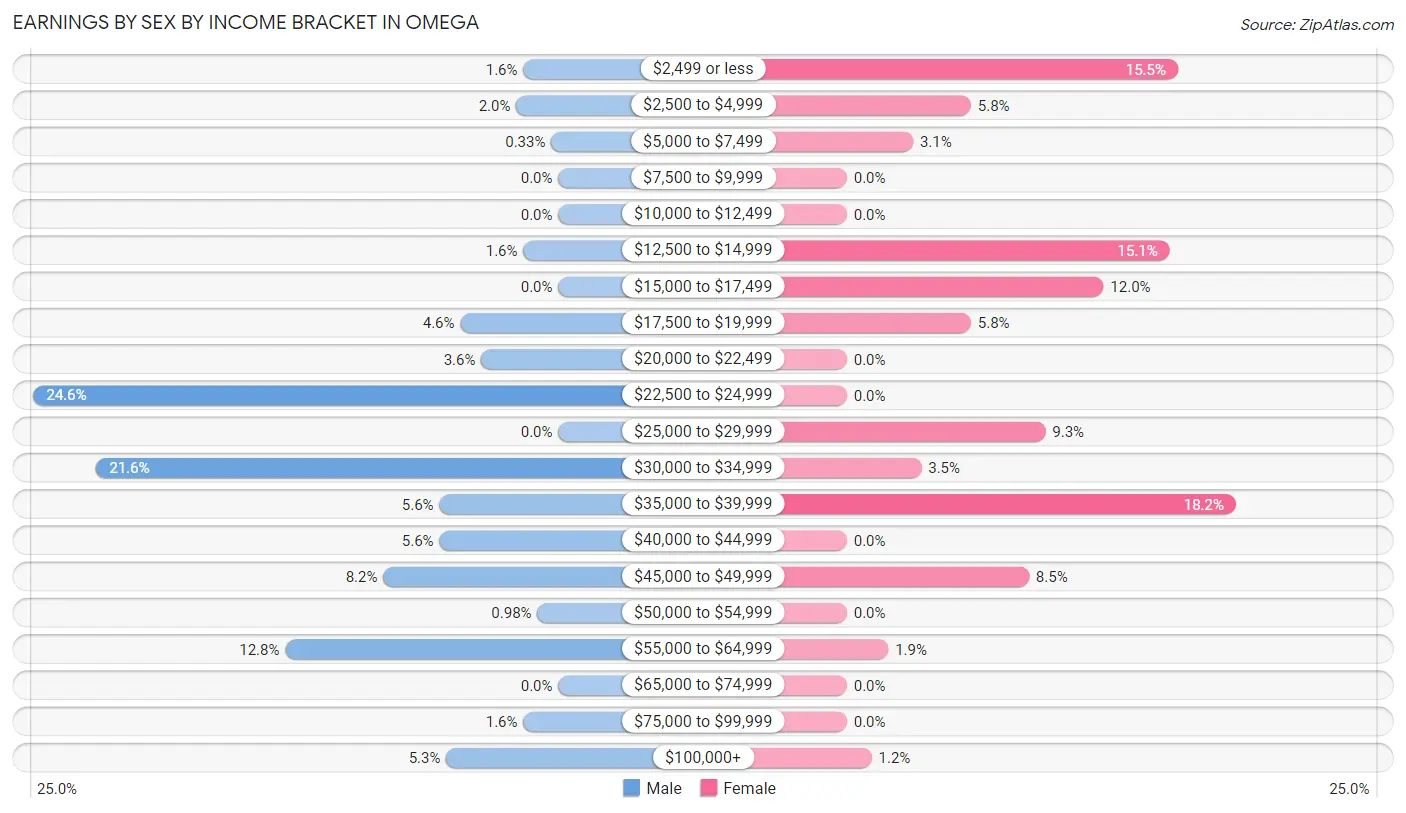
Earnings by Sex by Income Bracket in Omega
The most common earnings brackets in Omega are $22,500 to $24,999 for men (75 | 24.6%) and $35,000 to $39,999 for women (47 | 18.2%).
| Income | Male | Female |
| $2,499 or less | 5 (1.6%) | 40 (15.5%) |
| $2,500 to $4,999 | 6 (2.0%) | 15 (5.8%) |
| $5,000 to $7,499 | 1 (0.3%) | 8 (3.1%) |
| $7,500 to $9,999 | 0 (0.0%) | 0 (0.0%) |
| $10,000 to $12,499 | 0 (0.0%) | 0 (0.0%) |
| $12,500 to $14,999 | 5 (1.6%) | 39 (15.1%) |
| $15,000 to $17,499 | 0 (0.0%) | 31 (12.0%) |
| $17,500 to $19,999 | 14 (4.6%) | 15 (5.8%) |
| $20,000 to $22,499 | 11 (3.6%) | 0 (0.0%) |
| $22,500 to $24,999 | 75 (24.6%) | 0 (0.0%) |
| $25,000 to $29,999 | 0 (0.0%) | 24 (9.3%) |
| $30,000 to $34,999 | 66 (21.6%) | 9 (3.5%) |
| $35,000 to $39,999 | 17 (5.6%) | 47 (18.2%) |
| $40,000 to $44,999 | 17 (5.6%) | 0 (0.0%) |
| $45,000 to $49,999 | 25 (8.2%) | 22 (8.5%) |
| $50,000 to $54,999 | 3 (1.0%) | 0 (0.0%) |
| $55,000 to $64,999 | 39 (12.8%) | 5 (1.9%) |
| $65,000 to $74,999 | 0 (0.0%) | 0 (0.0%) |
| $75,000 to $99,999 | 5 (1.6%) | 0 (0.0%) |
| $100,000+ | 16 (5.2%) | 3 (1.2%) |
| Total | 305 (100.0%) | 258 (100.0%) |
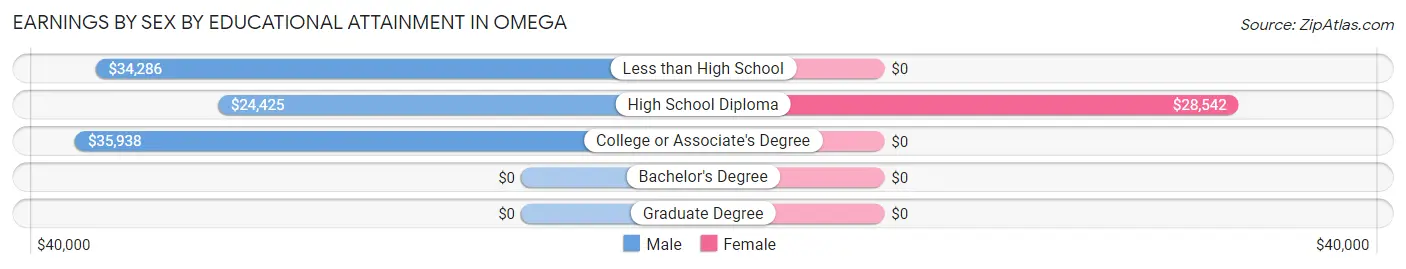
Earnings by Sex by Educational Attainment in Omega
| Educational Attainment | Male Income | Female Income |
| Less than High School | $34,286 | $0 |
| High School Diploma | $24,425 | $28,542 |
| College or Associate's Degree | $35,938 | $0 |
| Bachelor's Degree | - | - |
| Graduate Degree | - | - |
| Total | $33,352 | $0 |
Family Income in Omega
Family Income Brackets in Omega
According to the Omega family income data, there are 97 families falling into the $50,000 to $74,999 income range, which is the most common income bracket and makes up 30.6% of all families. Conversely, the $10,000 to $14,999 income bracket is the least frequent group with only 3 families (0.9%) belonging to this category.
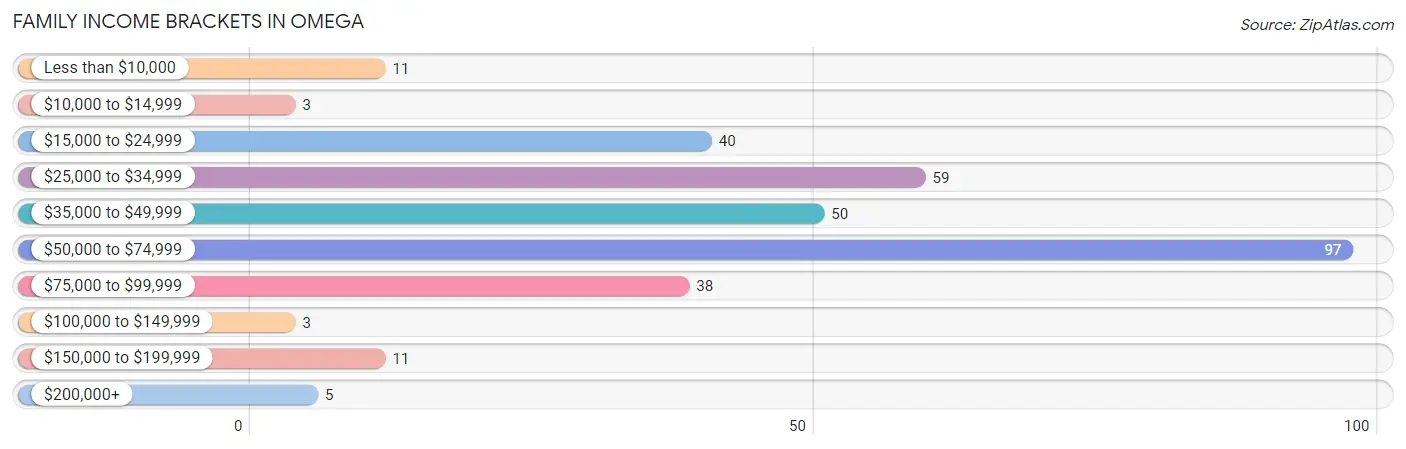
| Income Bracket | # Families | % Families |
| Less than $10,000 | 11 | 3.5% |
| $10,000 to $14,999 | 3 | 0.9% |
| $15,000 to $24,999 | 40 | 12.6% |
| $25,000 to $34,999 | 59 | 18.6% |
| $35,000 to $49,999 | 50 | 15.8% |
| $50,000 to $74,999 | 97 | 30.6% |
| $75,000 to $99,999 | 38 | 12.0% |
| $100,000 to $149,999 | 3 | 0.9% |
| $150,000 to $199,999 | 11 | 3.5% |
| $200,000+ | 5 | 1.6% |
Family Income by Famaliy Size in Omega
4-person families (14 | 4.4%) account for the highest median family income in Omega with $80,833 per family, while 4-person families (14 | 4.4%) have the highest median income of $20,208 per family member.
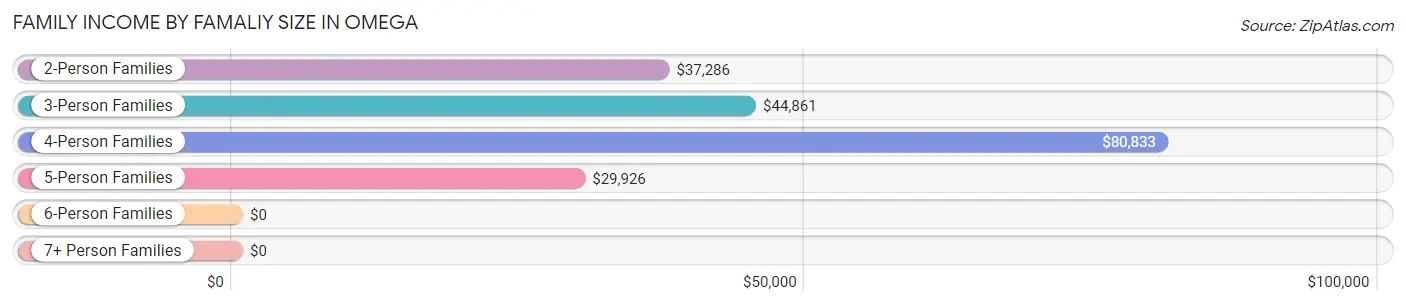
| Income Bracket | # Families | Median Income |
| 2-Person Families | 166 (52.4%) | $37,286 |
| 3-Person Families | 37 (11.7%) | $44,861 |
| 4-Person Families | 14 (4.4%) | $80,833 |
| 5-Person Families | 69 (21.8%) | $29,926 |
| 6-Person Families | 8 (2.5%) | $0 |
| 7+ Person Families | 23 (7.3%) | $0 |
| Total | 317 (100.0%) | $44,135 |
Family Income by Number of Earners in Omega
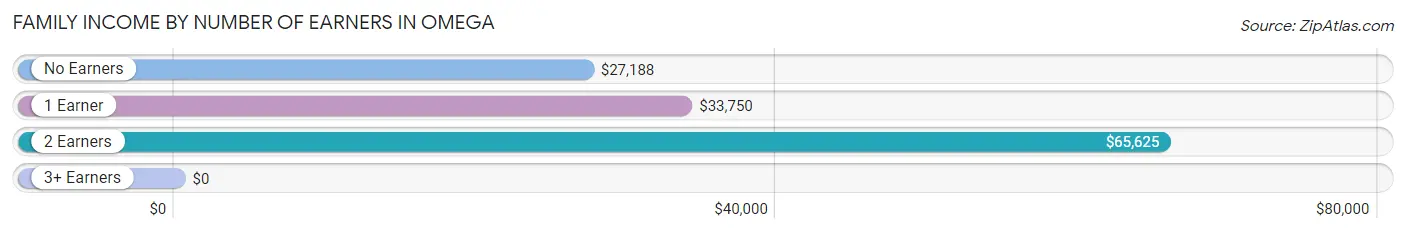
| Number of Earners | # Families | Median Income |
| No Earners | 36 (11.4%) | $27,188 |
| 1 Earner | 141 (44.5%) | $33,750 |
| 2 Earners | 124 (39.1%) | $65,625 |
| 3+ Earners | 16 (5.1%) | $0 |
| Total | 317 (100.0%) | $44,135 |
Household Income in Omega
Household Income Brackets in Omega
With 130 households falling in the category, the $50,000 to $74,999 income range is the most frequent in Omega, accounting for 31.1% of all households. In contrast, only 5 households (1.2%) fall into the $200,000+ income bracket, making it the least populous group.
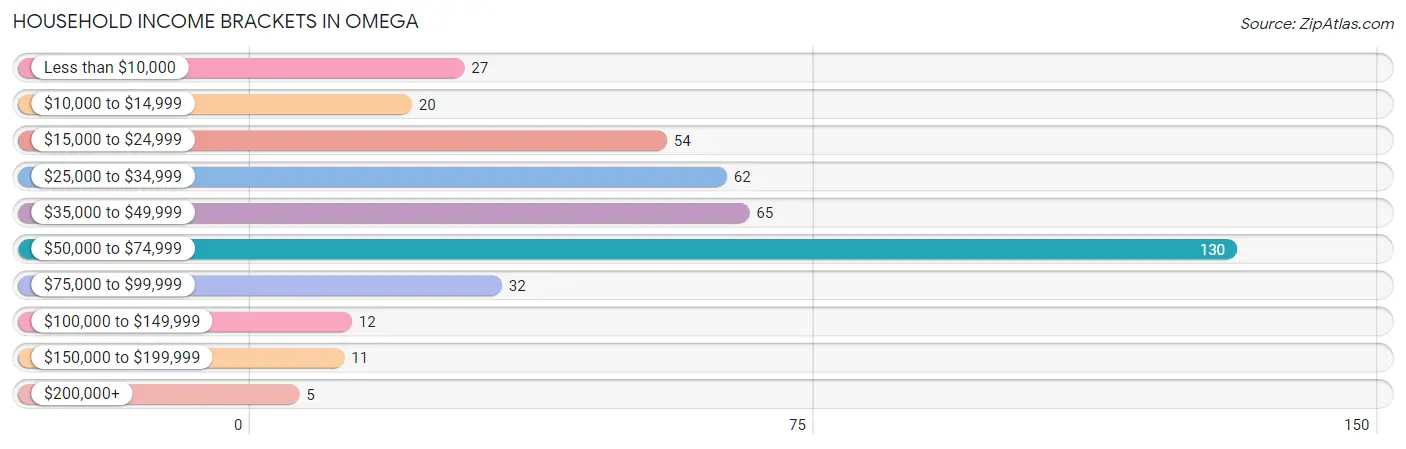
| Income Bracket | # Households | % Households |
| Less than $10,000 | 27 | 6.5% |
| $10,000 to $14,999 | 20 | 4.8% |
| $15,000 to $24,999 | 54 | 12.9% |
| $25,000 to $34,999 | 62 | 14.8% |
| $35,000 to $49,999 | 65 | 15.6% |
| $50,000 to $74,999 | 130 | 31.1% |
| $75,000 to $99,999 | 32 | 7.7% |
| $100,000 to $149,999 | 12 | 2.9% |
| $150,000 to $199,999 | 11 | 2.6% |
| $200,000+ | 5 | 1.2% |
Household Income by Householder Age in Omega
The median household income in Omega is $43,269, with the highest median household income of $114,167 found in the 15 to 24 years age bracket for the primary householder. A total of 14 households (3.4%) fall into this category. Meanwhile, the 65+ years age bracket for the primary householder has the lowest median household income of $0, with 67 households (16.0%) in this group.
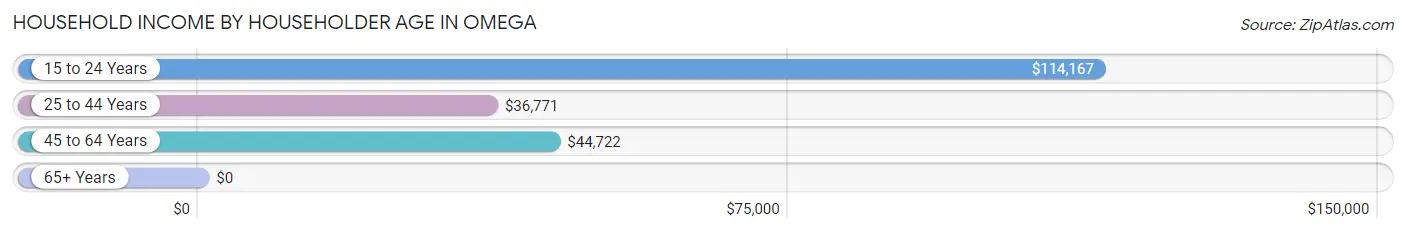
| Income Bracket | # Households | Median Income |
| 15 to 24 Years | 14 (3.4%) | $114,167 |
| 25 to 44 Years | 145 (34.7%) | $36,771 |
| 45 to 64 Years | 192 (45.9%) | $44,722 |
| 65+ Years | 67 (16.0%) | $0 |
| Total | 418 (100.0%) | $43,269 |
Poverty in Omega
Income Below Poverty by Sex and Age in Omega
With 34.2% poverty level for males and 37.6% for females among the residents of Omega, 5 year old males and 16 and 17 year old females are the most vulnerable to poverty, with 5 males (100.0%) and 33 females (73.3%) in their respective age groups living below the poverty level.
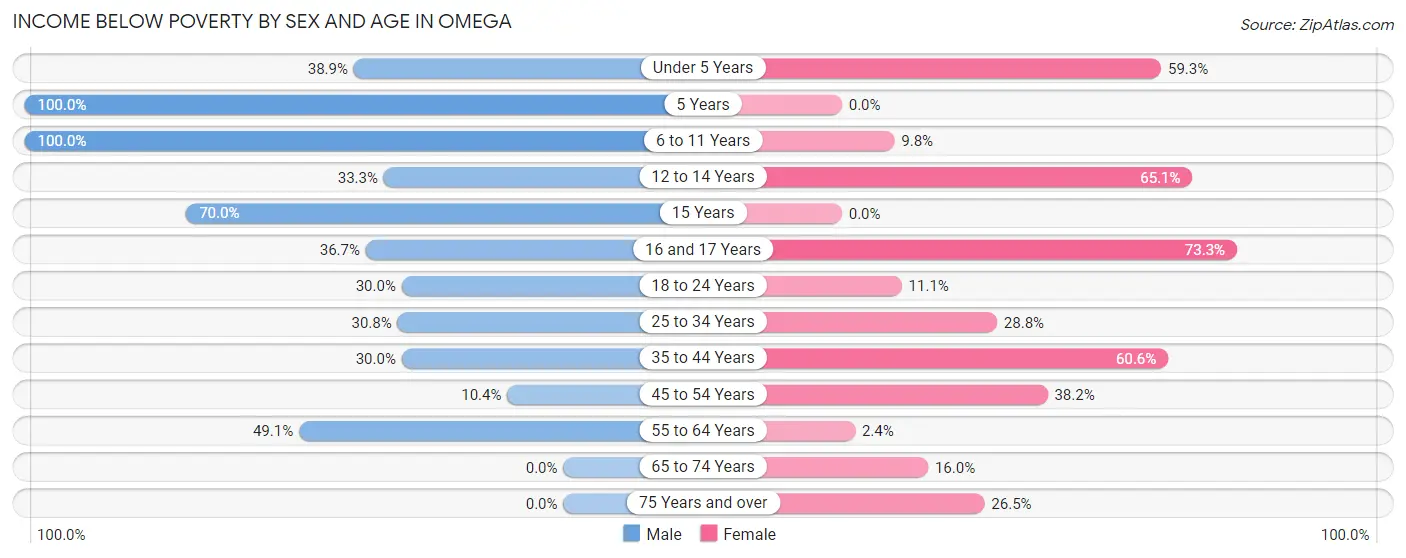
| Age Bracket | Male | Female |
| Under 5 Years | 28 (38.9%) | 48 (59.3%) |
| 5 Years | 5 (100.0%) | 0 (0.0%) |
| 6 to 11 Years | 30 (100.0%) | 4 (9.8%) |
| 12 to 14 Years | 4 (33.3%) | 54 (65.1%) |
| 15 Years | 7 (70.0%) | 0 (0.0%) |
| 16 and 17 Years | 11 (36.7%) | 33 (73.3%) |
| 18 to 24 Years | 18 (30.0%) | 2 (11.1%) |
| 25 to 34 Years | 12 (30.8%) | 19 (28.8%) |
| 35 to 44 Years | 24 (30.0%) | 43 (60.6%) |
| 45 to 54 Years | 13 (10.4%) | 42 (38.2%) |
| 55 to 64 Years | 53 (49.1%) | 2 (2.4%) |
| 65 to 74 Years | 0 (0.0%) | 8 (16.0%) |
| 75 Years and over | 0 (0.0%) | 9 (26.5%) |
| Total | 205 (34.2%) | 264 (37.6%) |
Income Above Poverty by Sex and Age in Omega
According to the poverty statistics in Omega, males aged 65 to 74 years and females aged 5 years are the age groups that are most secure financially, with 100.0% of males and 100.0% of females in these age groups living above the poverty line.
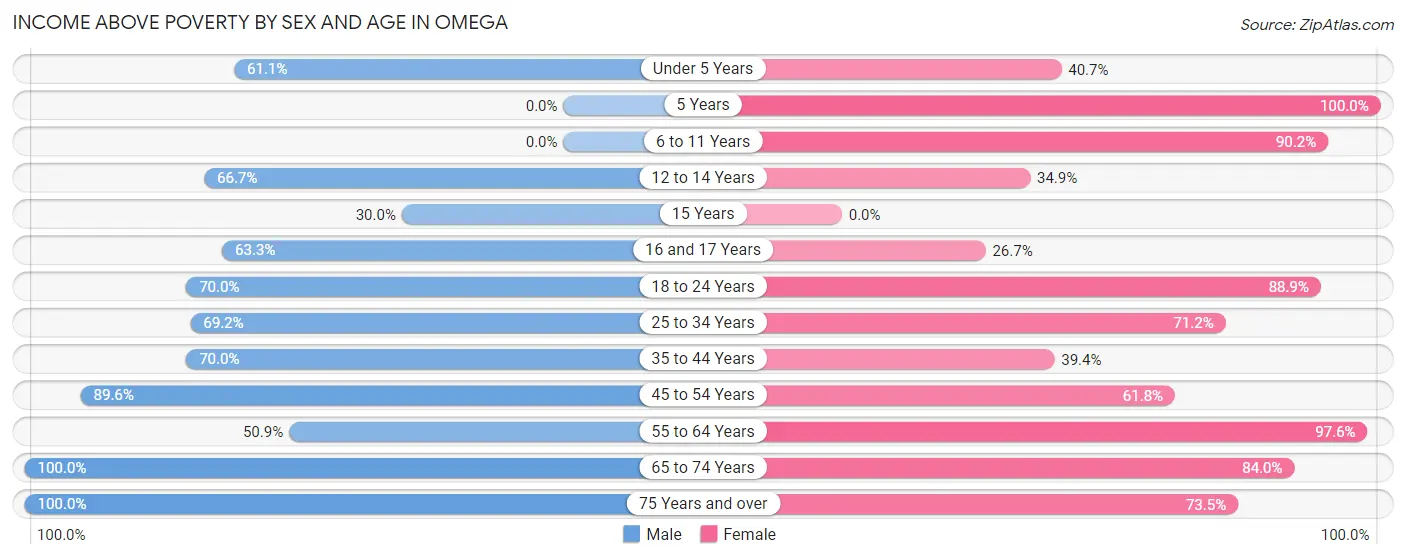
| Age Bracket | Male | Female |
| Under 5 Years | 44 (61.1%) | 33 (40.7%) |
| 5 Years | 0 (0.0%) | 21 (100.0%) |
| 6 to 11 Years | 0 (0.0%) | 37 (90.2%) |
| 12 to 14 Years | 8 (66.7%) | 29 (34.9%) |
| 15 Years | 3 (30.0%) | 0 (0.0%) |
| 16 and 17 Years | 19 (63.3%) | 12 (26.7%) |
| 18 to 24 Years | 42 (70.0%) | 16 (88.9%) |
| 25 to 34 Years | 27 (69.2%) | 47 (71.2%) |
| 35 to 44 Years | 56 (70.0%) | 28 (39.4%) |
| 45 to 54 Years | 112 (89.6%) | 68 (61.8%) |
| 55 to 64 Years | 55 (50.9%) | 80 (97.6%) |
| 65 to 74 Years | 11 (100.0%) | 42 (84.0%) |
| 75 Years and over | 18 (100.0%) | 25 (73.5%) |
| Total | 395 (65.8%) | 438 (62.4%) |
Income Below Poverty Among Married-Couple Families in Omega
The poverty statistics for married-couple families in Omega show that 15.2% or 31 of the total 204 families live below the poverty line. Families with 3 or 4 children have the highest poverty rate of 45.2%, comprising of 14 families. On the other hand, families with no children have the lowest poverty rate of 0.0%, which includes 0 families.
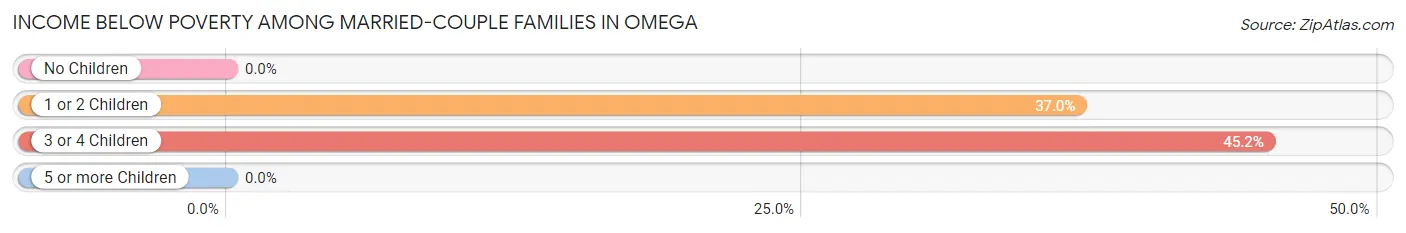
| Children | Above Poverty | Below Poverty |
| No Children | 104 (100.0%) | 0 (0.0%) |
| 1 or 2 Children | 29 (63.0%) | 17 (37.0%) |
| 3 or 4 Children | 17 (54.8%) | 14 (45.2%) |
| 5 or more Children | 23 (100.0%) | 0 (0.0%) |
| Total | 173 (84.8%) | 31 (15.2%) |
Income Below Poverty Among Single-Parent Households in Omega
According to the poverty data in Omega, 19.6% or 9 single-father households and 71.6% or 48 single-mother households are living below the poverty line. Among single-father households, those with 1 or 2 children have the highest poverty rate, with 8 households (100.0%) experiencing poverty. Likewise, among single-mother households, those with 3 or 4 children have the highest poverty rate, with 21 households (100.0%) falling below the poverty line.
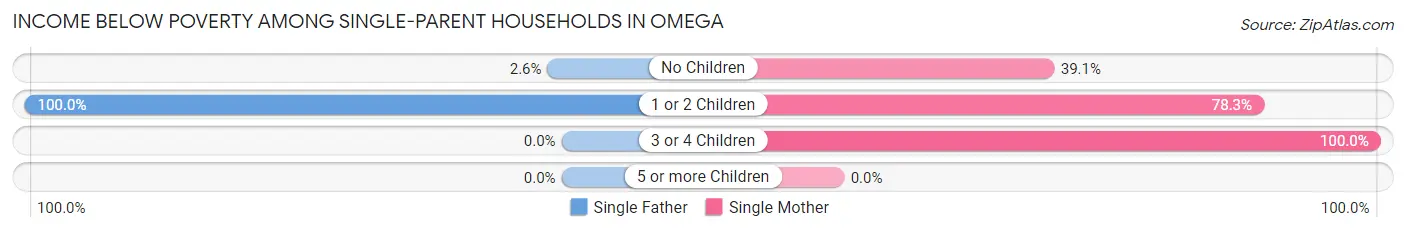
| Children | Single Father | Single Mother |
| No Children | 1 (2.6%) | 9 (39.1%) |
| 1 or 2 Children | 8 (100.0%) | 18 (78.3%) |
| 3 or 4 Children | 0 (0.0%) | 21 (100.0%) |
| 5 or more Children | 0 (0.0%) | 0 (0.0%) |
| Total | 9 (19.6%) | 48 (71.6%) |
Income Below Poverty Among Married-Couple vs Single-Parent Households in Omega
The poverty data for Omega shows that 31 of the married-couple family households (15.2%) and 57 of the single-parent households (50.4%) are living below the poverty level. Within the married-couple family households, those with 3 or 4 children have the highest poverty rate, with 14 households (45.2%) falling below the poverty line. Among the single-parent households, those with 3 or 4 children have the highest poverty rate, with 21 household (100.0%) living below poverty.
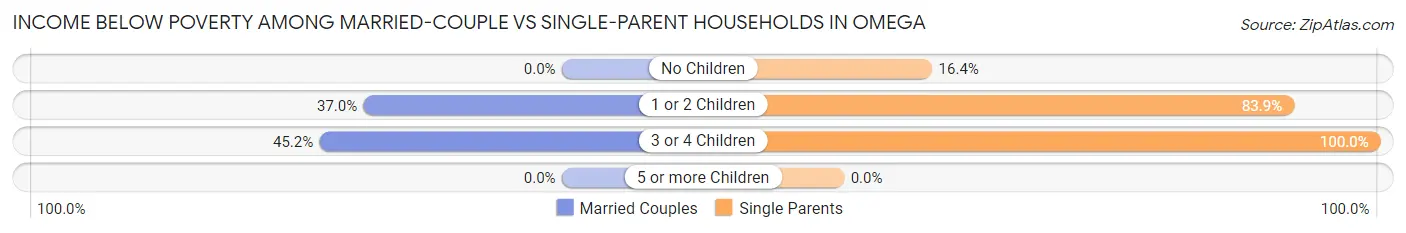
| Children | Married-Couple Families | Single-Parent Households |
| No Children | 0 (0.0%) | 10 (16.4%) |
| 1 or 2 Children | 17 (37.0%) | 26 (83.9%) |
| 3 or 4 Children | 14 (45.2%) | 21 (100.0%) |
| 5 or more Children | 0 (0.0%) | 0 (0.0%) |
| Total | 31 (15.2%) | 57 (50.4%) |
Race in Omega
The most populous races in Omega are Hispanic or Latino (808 | 62.1%), White / Caucasian (527 | 40.5%), and Some other Race (372 | 28.6%).
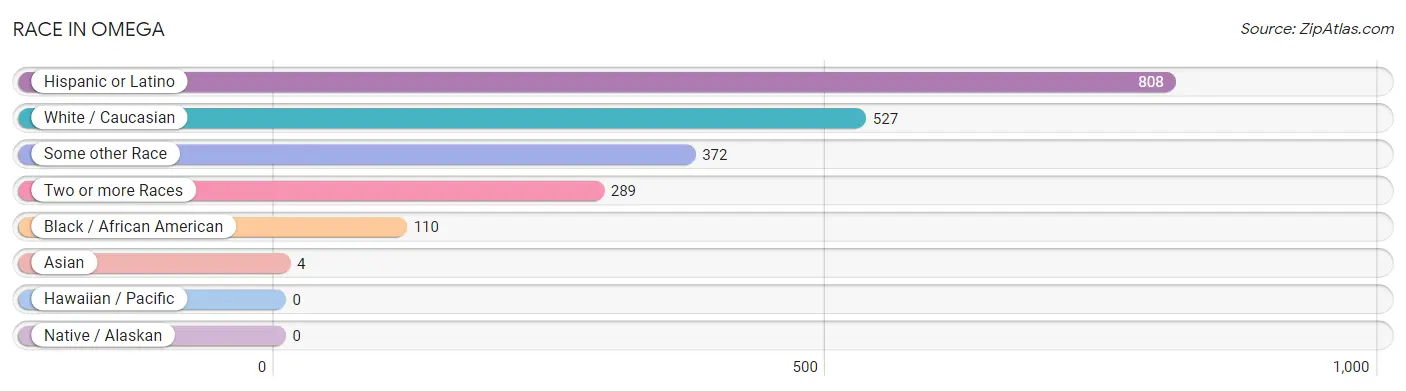
| Race | # Population | % Population |
| Asian | 4 | 0.3% |
| Black / African American | 110 | 8.5% |
| Hawaiian / Pacific | 0 | 0.0% |
| Hispanic or Latino | 808 | 62.1% |
| Native / Alaskan | 0 | 0.0% |
| White / Caucasian | 527 | 40.5% |
| Two or more Races | 289 | 22.2% |
| Some other Race | 372 | 28.6% |
| Total | 1,302 | 100.0% |
Ancestry in Omega
The most populous ancestries reported in Omega are Mexican (765 | 58.8%), American (258 | 19.8%), Puerto Rican (24 | 1.8%), English (21 | 1.6%), and Irish (20 | 1.5%), together accounting for 83.6% of all Omega residents.
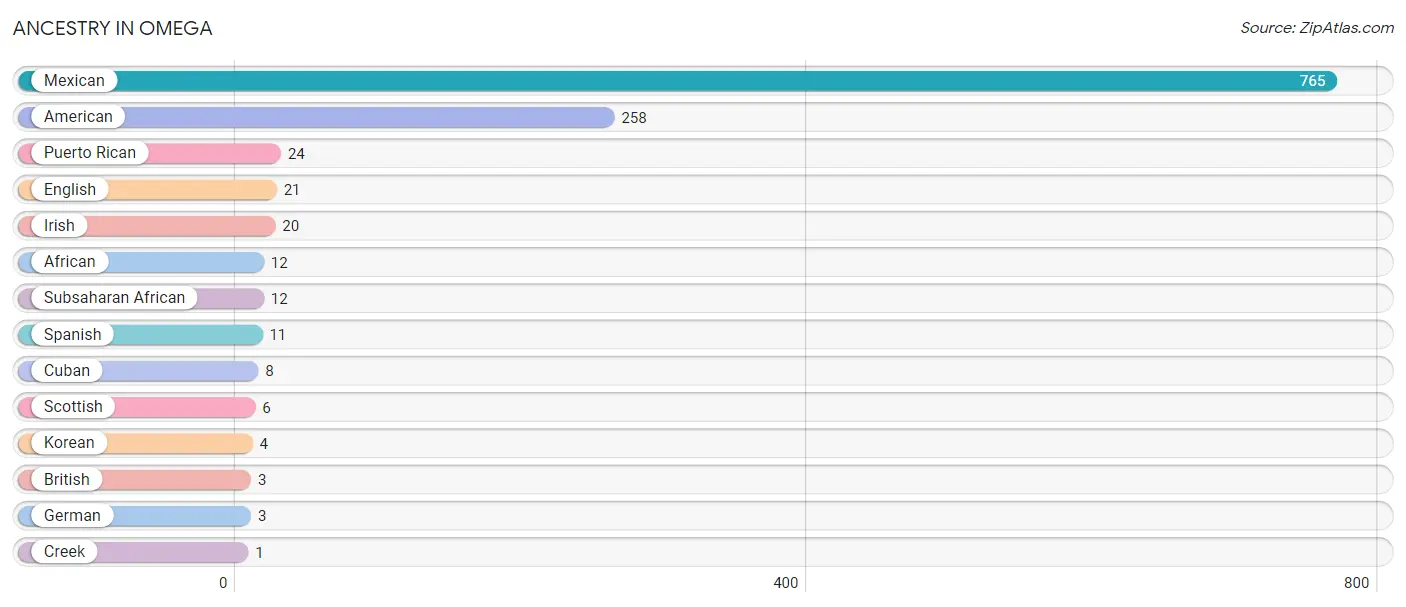
| Ancestry | # Population | % Population |
| African | 12 | 0.9% |
| American | 258 | 19.8% |
| British | 3 | 0.2% |
| Creek | 1 | 0.1% |
| Cuban | 8 | 0.6% |
| English | 21 | 1.6% |
| German | 3 | 0.2% |
| Irish | 20 | 1.5% |
| Korean | 4 | 0.3% |
| Mexican | 765 | 58.8% |
| Puerto Rican | 24 | 1.8% |
| Scottish | 6 | 0.5% |
| Spanish | 11 | 0.8% |
| Subsaharan African | 12 | 0.9% | View All 14 Rows |
Immigrants in Omega
The most numerous immigrant groups reported in Omega came from Central America (245 | 18.8%), Latin America (245 | 18.8%), Mexico (245 | 18.8%), Asia (4 | 0.3%), and Philippines (4 | 0.3%), together accounting for 57.1% of all Omega residents.
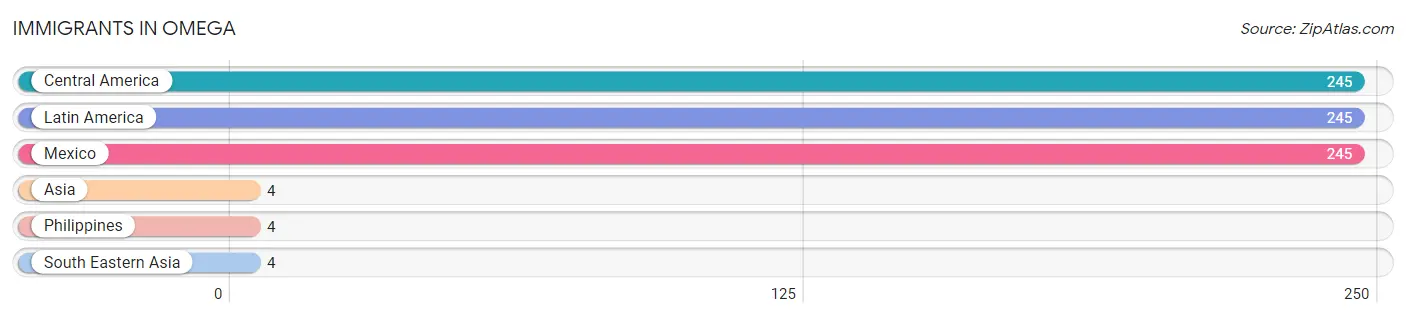
| Immigration Origin | # Population | % Population |
| Asia | 4 | 0.3% |
| Central America | 245 | 18.8% |
| Latin America | 245 | 18.8% |
| Mexico | 245 | 18.8% |
| Philippines | 4 | 0.3% |
| South Eastern Asia | 4 | 0.3% | View All 6 Rows |
Sex and Age in Omega
Sex and Age in Omega
The most populous age groups in Omega are 45 to 49 Years (84 | 14.0%) for men and 10 to 14 Years (90 | 12.8%) for women.
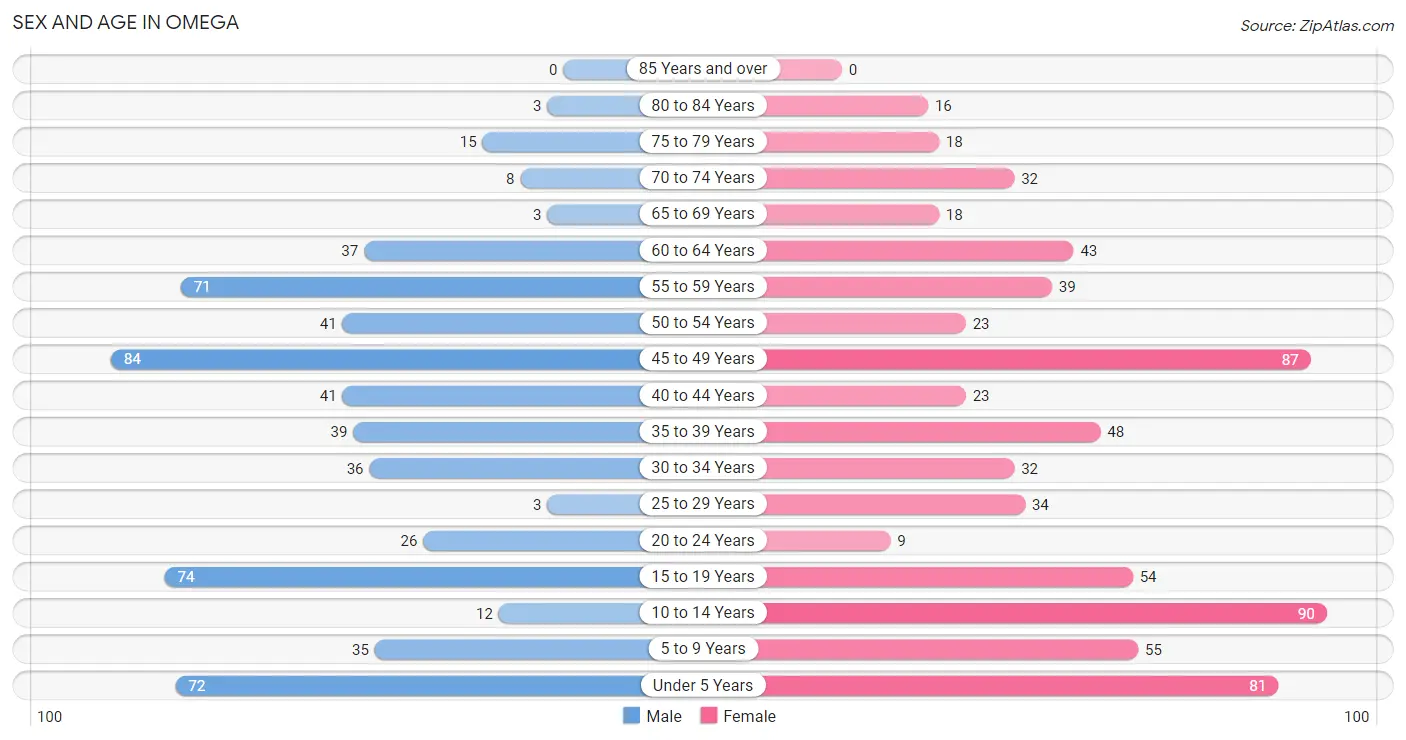
| Age Bracket | Male | Female |
| Under 5 Years | 72 (12.0%) | 81 (11.5%) |
| 5 to 9 Years | 35 (5.8%) | 55 (7.8%) |
| 10 to 14 Years | 12 (2.0%) | 90 (12.8%) |
| 15 to 19 Years | 74 (12.3%) | 54 (7.7%) |
| 20 to 24 Years | 26 (4.3%) | 9 (1.3%) |
| 25 to 29 Years | 3 (0.5%) | 34 (4.8%) |
| 30 to 34 Years | 36 (6.0%) | 32 (4.6%) |
| 35 to 39 Years | 39 (6.5%) | 48 (6.8%) |
| 40 to 44 Years | 41 (6.8%) | 23 (3.3%) |
| 45 to 49 Years | 84 (14.0%) | 87 (12.4%) |
| 50 to 54 Years | 41 (6.8%) | 23 (3.3%) |
| 55 to 59 Years | 71 (11.8%) | 39 (5.6%) |
| 60 to 64 Years | 37 (6.2%) | 43 (6.1%) |
| 65 to 69 Years | 3 (0.5%) | 18 (2.6%) |
| 70 to 74 Years | 8 (1.3%) | 32 (4.6%) |
| 75 to 79 Years | 15 (2.5%) | 18 (2.6%) |
| 80 to 84 Years | 3 (0.5%) | 16 (2.3%) |
| 85 Years and over | 0 (0.0%) | 0 (0.0%) |
| Total | 600 (100.0%) | 702 (100.0%) |
Families and Households in Omega
Median Family Size in Omega
The median family size in Omega is 3.61 persons per family, with single female/mother families (67 | 21.1%) accounting for the largest median family size of 4.55 persons per family. On the other hand, single male/father families (46 | 14.5%) represent the smallest median family size with 2.52 persons per family.
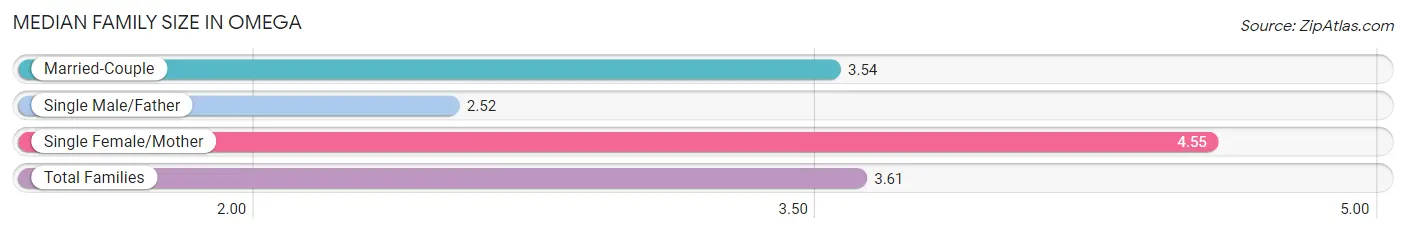
| Family Type | # Families | Family Size |
| Married-Couple | 204 (64.3%) | 3.54 |
| Single Male/Father | 46 (14.5%) | 2.52 |
| Single Female/Mother | 67 (21.1%) | 4.55 |
| Total Families | 317 (100.0%) | 3.61 |
Median Household Size in Omega
The median household size in Omega is 3.11 persons per household, with single female/mother households (67 | 16.0%) accounting for the largest median household size of 5 persons per household. non-family households (101 | 24.2%) represent the smallest median household size with 1.06 persons per household.
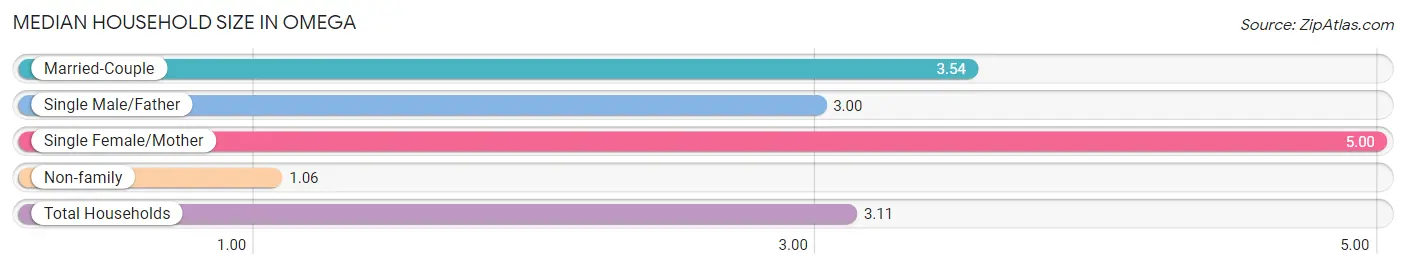
| Household Type | # Households | Household Size |
| Married-Couple | 204 (48.8%) | 3.54 |
| Single Male/Father | 46 (11.0%) | 3.00 |
| Single Female/Mother | 67 (16.0%) | 5.00 |
| Non-family | 101 (24.2%) | 1.06 |
| Total Households | 418 (100.0%) | 3.11 |
Household Size by Marriage Status in Omega
Out of a total of 418 households in Omega, 317 (75.8%) are family households, while 101 (24.2%) are nonfamily households. The most numerous type of family households are 2-person households, comprising 153, and the most common type of nonfamily households are 1-person households, comprising 95.
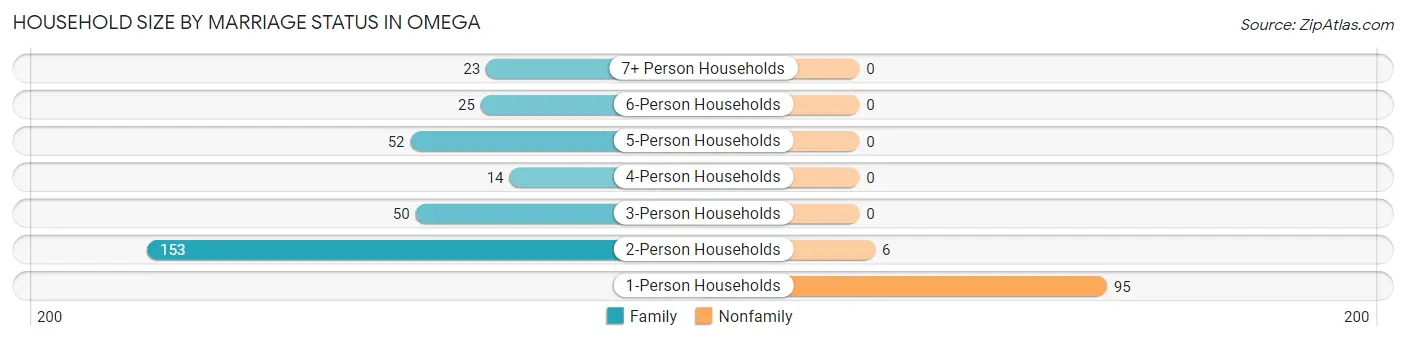
| Household Size | Family Households | Nonfamily Households |
| 1-Person Households | - | 95 (22.7%) |
| 2-Person Households | 153 (36.6%) | 6 (1.4%) |
| 3-Person Households | 50 (12.0%) | 0 (0.0%) |
| 4-Person Households | 14 (3.4%) | 0 (0.0%) |
| 5-Person Households | 52 (12.4%) | 0 (0.0%) |
| 6-Person Households | 25 (6.0%) | 0 (0.0%) |
| 7+ Person Households | 23 (5.5%) | 0 (0.0%) |
| Total | 317 (75.8%) | 101 (24.2%) |
Female Fertility in Omega
Fertility by Age in Omega
Average fertility rate in Omega is 84.0 births per 1,000 women. Women in the age bracket of 20 to 34 years have the highest fertility rate with 307.0 births per 1,000 women. Women in the age bracket of 20 to 34 years acount for 95.8% of all women with births.
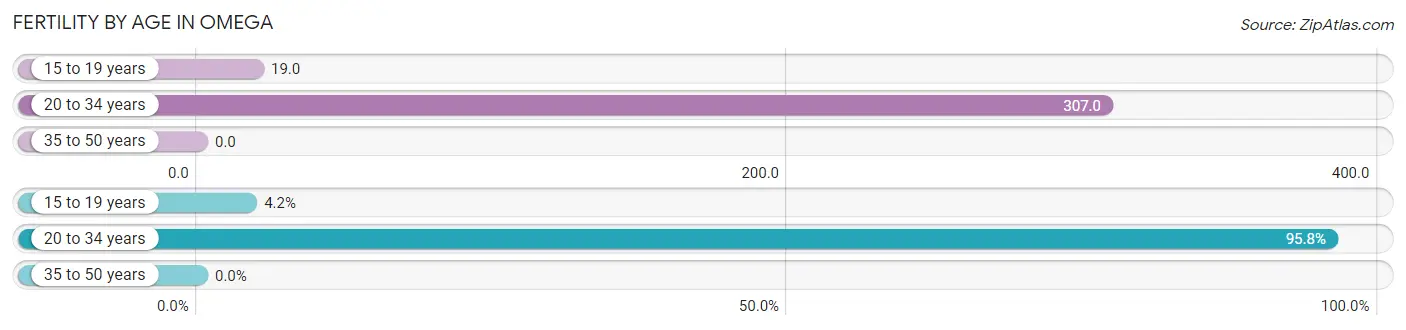
| Age Bracket | Women with Births | Births / 1,000 Women |
| 15 to 19 years | 1 (4.2%) | 19.0 |
| 20 to 34 years | 23 (95.8%) | 307.0 |
| 35 to 50 years | 0 (0.0%) | 0.0 |
| Total | 24 (100.0%) | 84.0 |
Fertility by Age by Marriage Status in Omega
95.8% of women with births (24) in Omega are married. The highest percentage of unmarried women with births falls into 15 to 19 years age bracket with 100.0% of them unmarried at the time of birth, while the lowest percentage of unmarried women with births belong to 20 to 34 years age bracket with 0.0% of them unmarried.
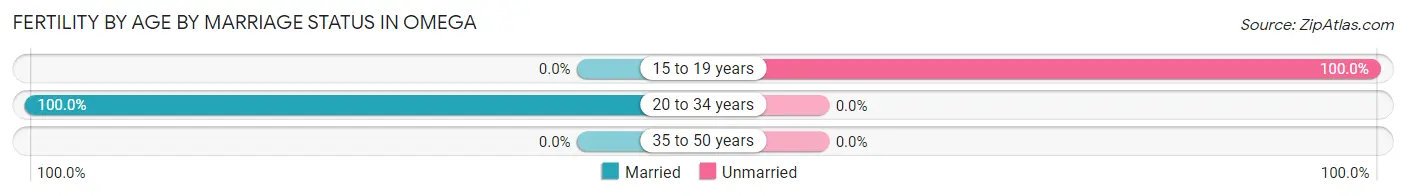
| Age Bracket | Married | Unmarried |
| 15 to 19 years | 0 (0.0%) | 1 (100.0%) |
| 20 to 34 years | 23 (100.0%) | 0 (0.0%) |
| 35 to 50 years | 0 (0.0%) | 0 (0.0%) |
| Total | 23 (95.8%) | 1 (4.2%) |
Fertility by Education in Omega
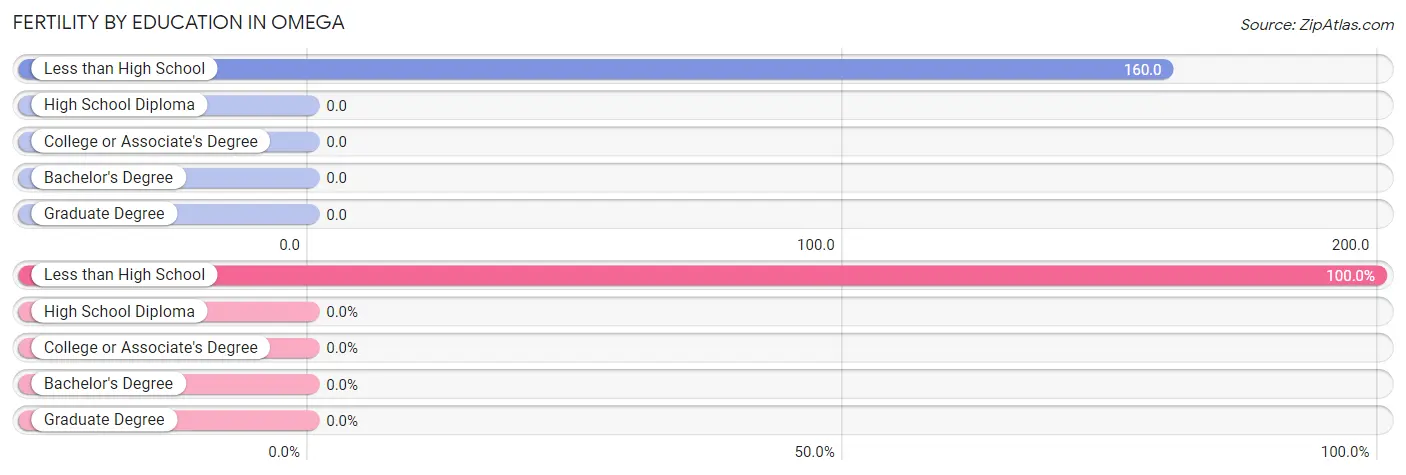
| Educational Attainment | Women with Births | Births / 1,000 Women |
| Less than High School | 24 (100.0%) | 160.0 |
| High School Diploma | 0 (0.0%) | 0.0 |
| College or Associate's Degree | 0 (0.0%) | 0.0 |
| Bachelor's Degree | 0 (0.0%) | 0.0 |
| Graduate Degree | 0 (0.0%) | 0.0 |
| Total | 24 (100.0%) | 84.0 |
Fertility by Education by Marriage Status in Omega
4.2% of women with births in Omega are unmarried. Women with the educational attainment of less than high school are most likely to be married with 95.8% of them married at childbirth, while women with the educational attainment of less than high school are least likely to be married with 4.2% of them unmarried at childbirth.
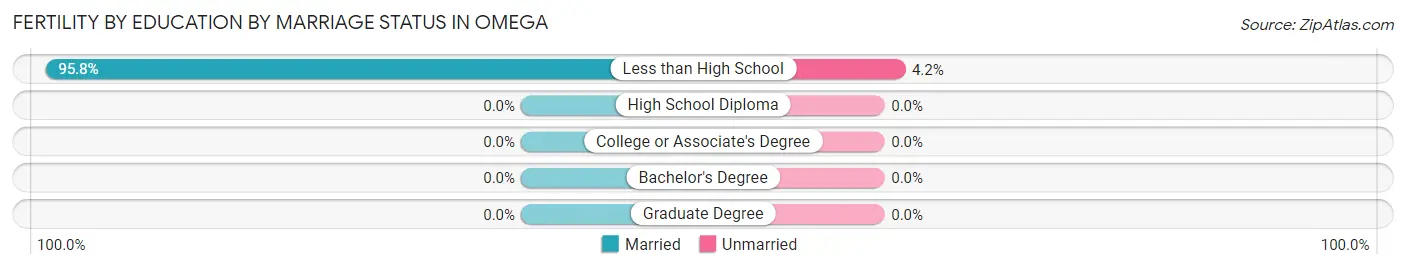
| Educational Attainment | Married | Unmarried |
| Less than High School | 23 (95.8%) | 1 (4.2%) |
| High School Diploma | 0 (0.0%) | 0 (0.0%) |
| College or Associate's Degree | 0 (0.0%) | 0 (0.0%) |
| Bachelor's Degree | 0 (0.0%) | 0 (0.0%) |
| Graduate Degree | 0 (0.0%) | 0 (0.0%) |
| Total | 23 (95.8%) | 1 (4.2%) |
Employment Characteristics in Omega
Employment by Class of Employer in Omega
Among the 532 employed individuals in Omega, private company employees (402 | 75.6%), not-for-profit organizations (68 | 12.8%), and local government employees (35 | 6.6%) make up the most common classes of employment.
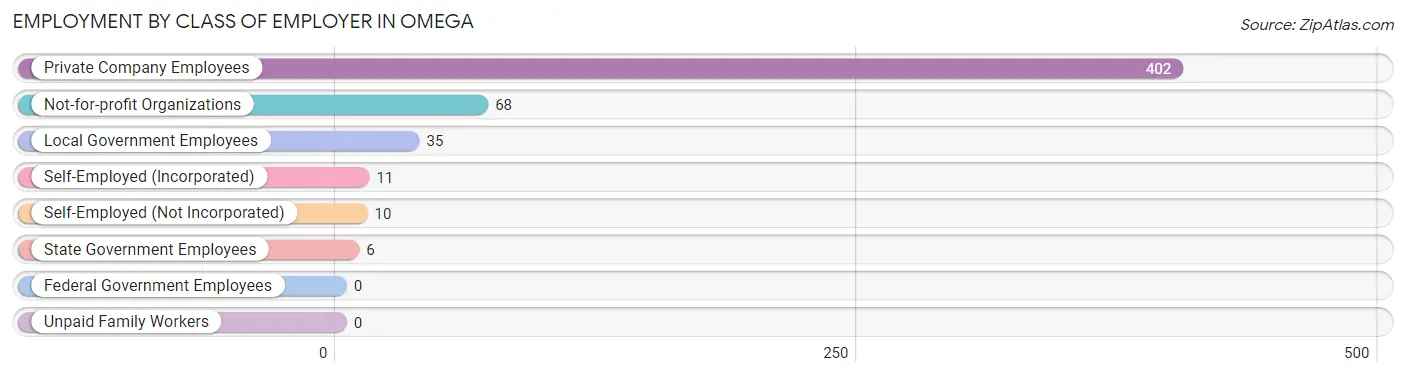
| Employer Class | # Employees | % Employees |
| Private Company Employees | 402 | 75.6% |
| Self-Employed (Incorporated) | 11 | 2.1% |
| Self-Employed (Not Incorporated) | 10 | 1.9% |
| Not-for-profit Organizations | 68 | 12.8% |
| Local Government Employees | 35 | 6.6% |
| State Government Employees | 6 | 1.1% |
| Federal Government Employees | 0 | 0.0% |
| Unpaid Family Workers | 0 | 0.0% |
| Total | 532 | 100.0% |
Employment Status by Age in Omega
According to the labor force statistics for Omega, out of the total population over 16 years of age (947), 59.1% or 560 individuals are in the labor force, with 2.9% or 16 of them unemployed. The age group with the highest labor force participation rate is 45 to 54 years, with 90.2% or 212 individuals in the labor force. Within the labor force, the 16 to 19 years age range has the highest percentage of unemployed individuals, with 16.7% or 12 of them being unemployed.
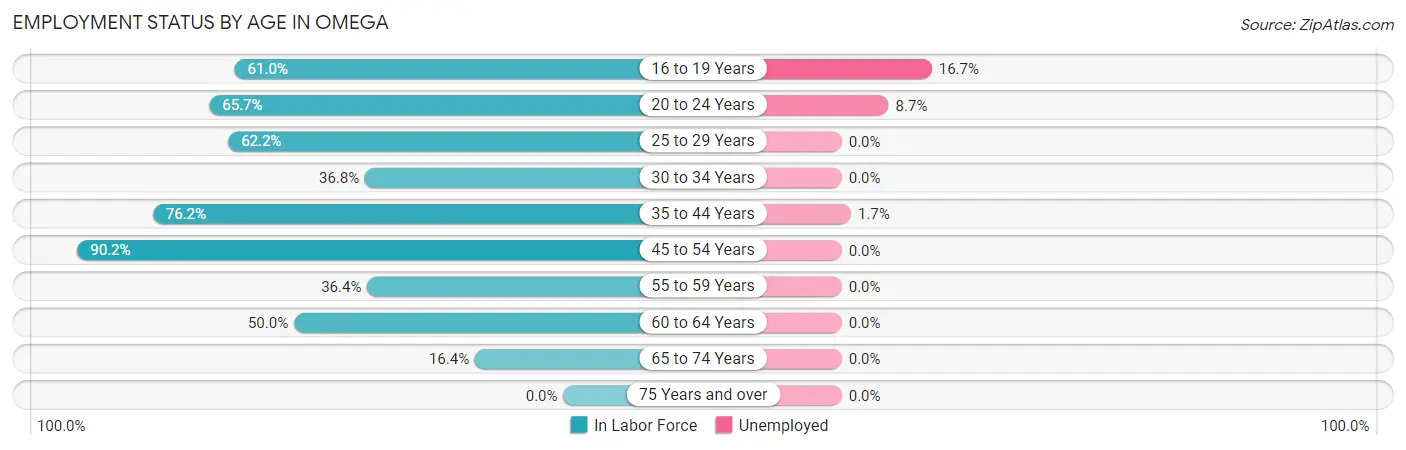
| Age Bracket | In Labor Force | Unemployed |
| 16 to 19 Years | 72 (61.0%) | 12 (16.7%) |
| 20 to 24 Years | 23 (65.7%) | 2 (8.7%) |
| 25 to 29 Years | 23 (62.2%) | 0 (0.0%) |
| 30 to 34 Years | 25 (36.8%) | 0 (0.0%) |
| 35 to 44 Years | 115 (76.2%) | 2 (1.7%) |
| 45 to 54 Years | 212 (90.2%) | 0 (0.0%) |
| 55 to 59 Years | 40 (36.4%) | 0 (0.0%) |
| 60 to 64 Years | 40 (50.0%) | 0 (0.0%) |
| 65 to 74 Years | 10 (16.4%) | 0 (0.0%) |
| 75 Years and over | 0 (0.0%) | 0 (0.0%) |
| Total | 560 (59.1%) | 16 (2.9%) |
Employment Status by Educational Attainment in Omega
According to labor force statistics for Omega, 66.8% of individuals (455) out of the total population between 25 and 64 years of age (681) are in the labor force, with 0.4% or 2 of them being unemployed. The group with the highest labor force participation rate are those with the educational attainment of bachelor's degree or higher, with 100.0% or 17 individuals in the labor force. Within the labor force, individuals with high school diploma education have the highest percentage of unemployment, with 1.1% or 2 of them being unemployed.
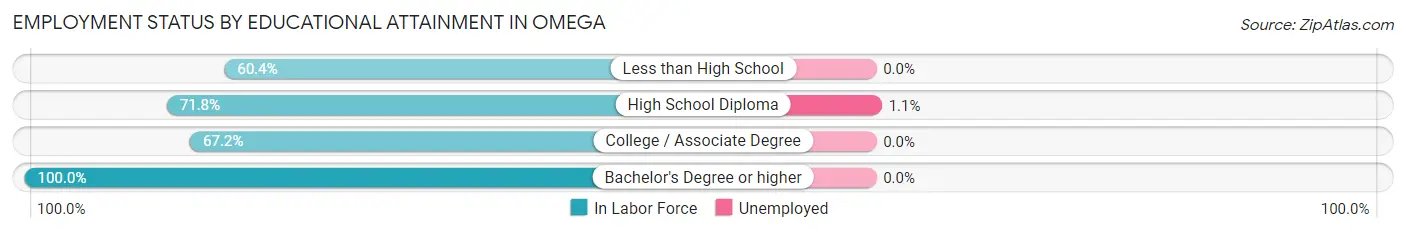
| Educational Attainment | In Labor Force | Unemployed |
| Less than High School | 174 (60.4%) | 0 (0.0%) |
| High School Diploma | 176 (71.8%) | 3 (1.1%) |
| College / Associate Degree | 88 (67.2%) | 0 (0.0%) |
| Bachelor's Degree or higher | 17 (100.0%) | 0 (0.0%) |
| Total | 455 (66.8%) | 3 (0.4%) |
Employment Occupations by Sex in Omega
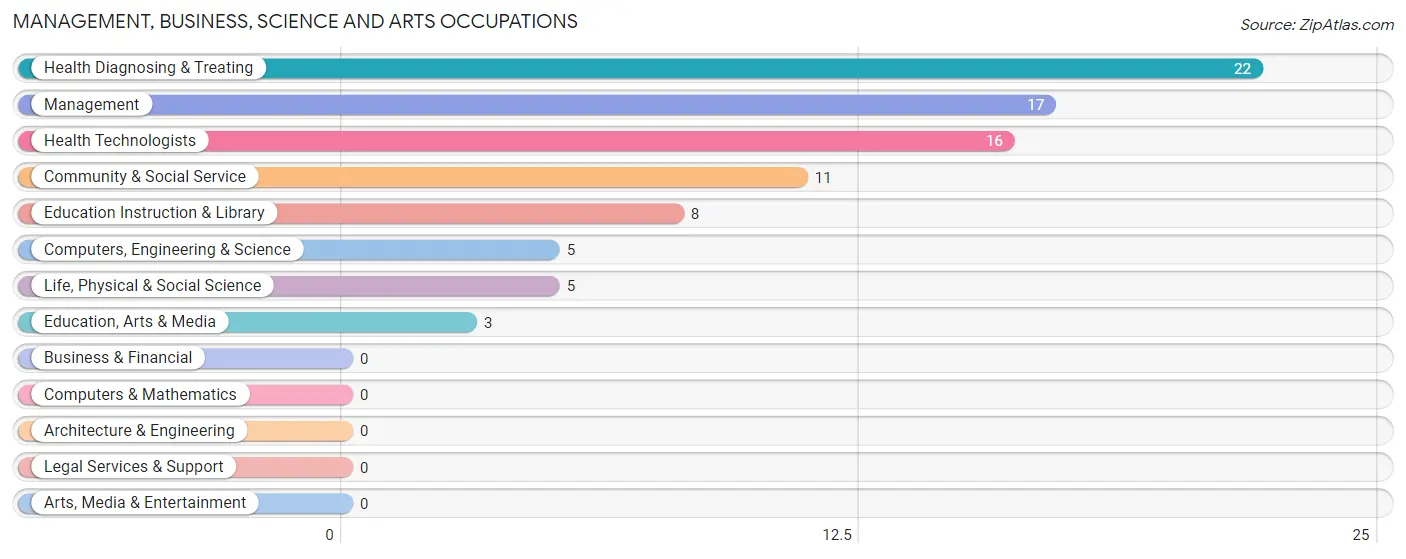
Management, Business, Science and Arts Occupations
The most common Management, Business, Science and Arts occupations in Omega are Health Diagnosing & Treating (22 | 4.0%), Management (17 | 3.1%), Health Technologists (16 | 2.9%), Community & Social Service (11 | 2.0%), and Education Instruction & Library (8 | 1.5%).
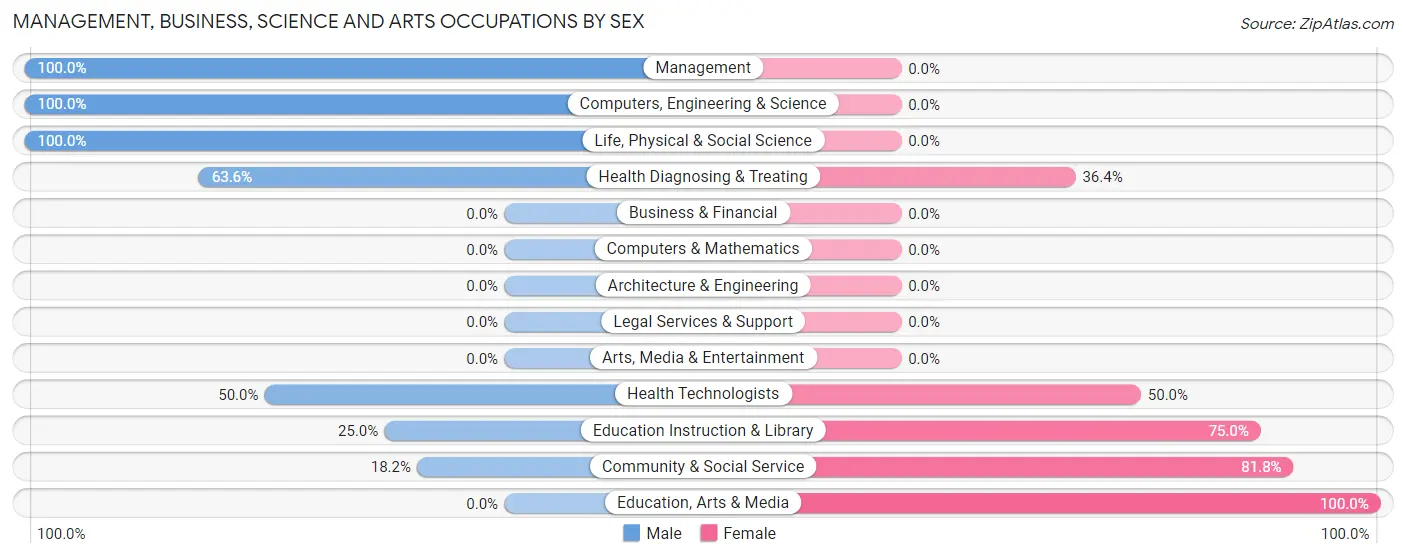
Management, Business, Science and Arts Occupations by Sex
Within the Management, Business, Science and Arts occupations in Omega, the most male-oriented occupations are Management (100.0%), Computers, Engineering & Science (100.0%), and Life, Physical & Social Science (100.0%), while the most female-oriented occupations are Education, Arts & Media (100.0%), Community & Social Service (81.8%), and Education Instruction & Library (75.0%).
| Occupation | Male | Female |
| Management | 17 (100.0%) | 0 (0.0%) |
| Business & Financial | 0 (0.0%) | 0 (0.0%) |
| Computers, Engineering & Science | 5 (100.0%) | 0 (0.0%) |
| Computers & Mathematics | 0 (0.0%) | 0 (0.0%) |
| Architecture & Engineering | 0 (0.0%) | 0 (0.0%) |
| Life, Physical & Social Science | 5 (100.0%) | 0 (0.0%) |
| Community & Social Service | 2 (18.2%) | 9 (81.8%) |
| Education, Arts & Media | 0 (0.0%) | 3 (100.0%) |
| Legal Services & Support | 0 (0.0%) | 0 (0.0%) |
| Education Instruction & Library | 2 (25.0%) | 6 (75.0%) |
| Arts, Media & Entertainment | 0 (0.0%) | 0 (0.0%) |
| Health Diagnosing & Treating | 14 (63.6%) | 8 (36.4%) |
| Health Technologists | 8 (50.0%) | 8 (50.0%) |
| Total (Category) | 38 (69.1%) | 17 (30.9%) |
| Total (Overall) | 289 (53.1%) | 255 (46.9%) |
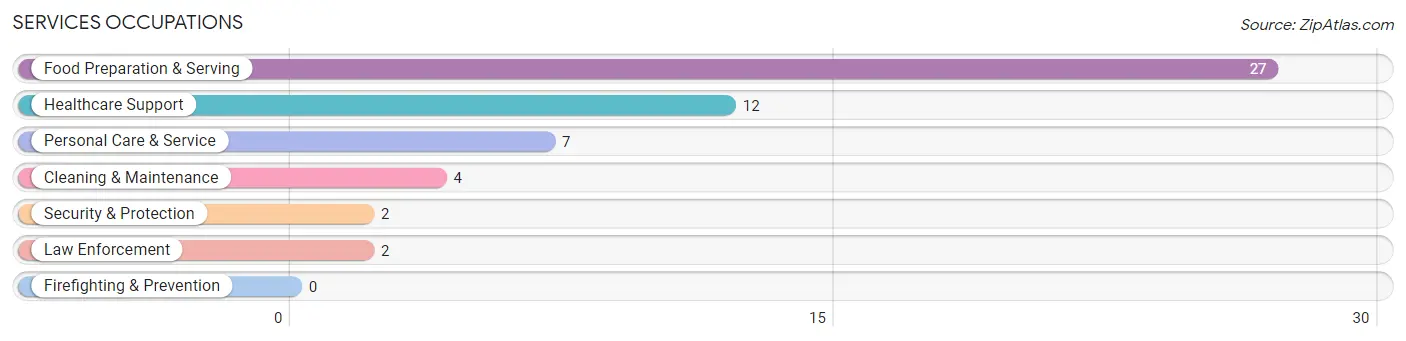
Services Occupations
The most common Services occupations in Omega are Food Preparation & Serving (27 | 5.0%), Healthcare Support (12 | 2.2%), Personal Care & Service (7 | 1.3%), Cleaning & Maintenance (4 | 0.7%), and Security & Protection (2 | 0.4%).
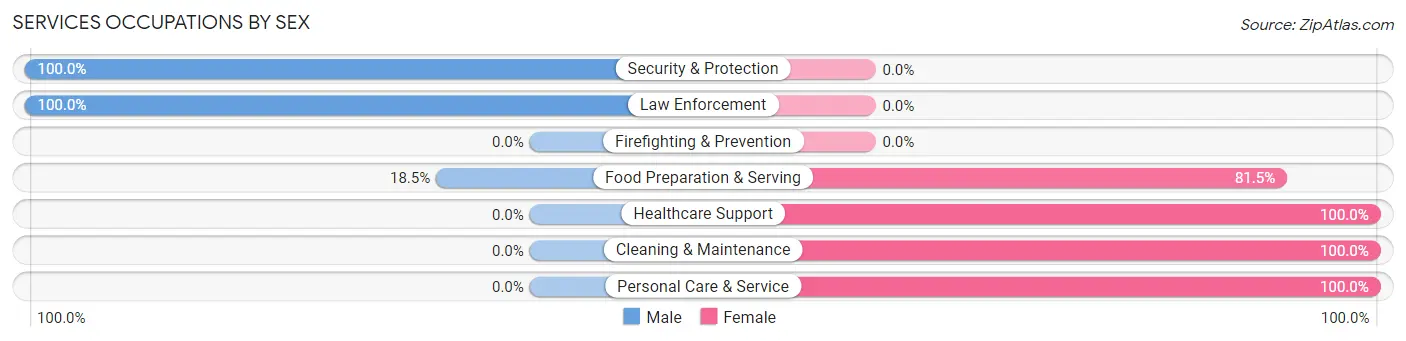
Services Occupations by Sex
Within the Services occupations in Omega, the most male-oriented occupations are Security & Protection (100.0%), Law Enforcement (100.0%), and Food Preparation & Serving (18.5%), while the most female-oriented occupations are Healthcare Support (100.0%), Cleaning & Maintenance (100.0%), and Personal Care & Service (100.0%).
| Occupation | Male | Female |
| Healthcare Support | 0 (0.0%) | 12 (100.0%) |
| Security & Protection | 2 (100.0%) | 0 (0.0%) |
| Firefighting & Prevention | 0 (0.0%) | 0 (0.0%) |
| Law Enforcement | 2 (100.0%) | 0 (0.0%) |
| Food Preparation & Serving | 5 (18.5%) | 22 (81.5%) |
| Cleaning & Maintenance | 0 (0.0%) | 4 (100.0%) |
| Personal Care & Service | 0 (0.0%) | 7 (100.0%) |
| Total (Category) | 7 (13.5%) | 45 (86.5%) |
| Total (Overall) | 289 (53.1%) | 255 (46.9%) |
Sales and Office Occupations
The most common Sales and Office occupations in Omega are Sales & Related (91 | 16.7%), and Office & Administration (62 | 11.4%).
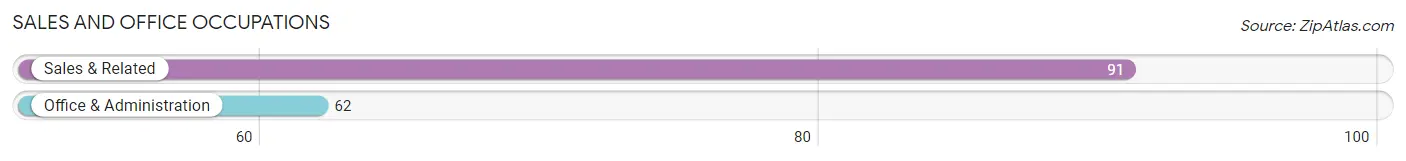
Sales and Office Occupations by Sex
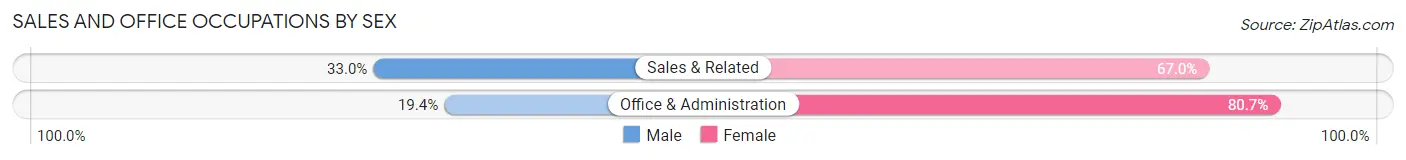
| Occupation | Male | Female |
| Sales & Related | 30 (33.0%) | 61 (67.0%) |
| Office & Administration | 12 (19.4%) | 50 (80.6%) |
| Total (Category) | 42 (27.5%) | 111 (72.6%) |
| Total (Overall) | 289 (53.1%) | 255 (46.9%) |
Natural Resources, Construction and Maintenance Occupations
The most common Natural Resources, Construction and Maintenance occupations in Omega are Construction & Extraction (108 | 19.9%), Farming, Fishing & Forestry (78 | 14.3%), and Installation, Maintenance & Repair (22 | 4.0%).
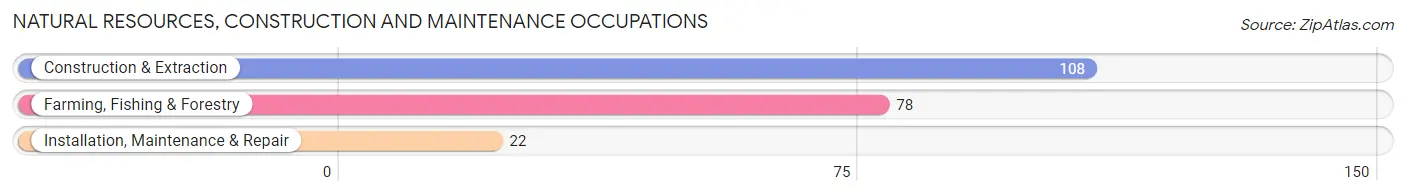
Natural Resources, Construction and Maintenance Occupations by Sex
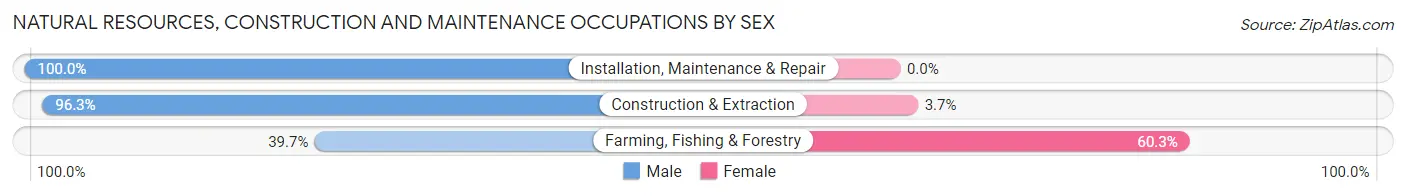
| Occupation | Male | Female |
| Farming, Fishing & Forestry | 31 (39.7%) | 47 (60.3%) |
| Construction & Extraction | 104 (96.3%) | 4 (3.7%) |
| Installation, Maintenance & Repair | 22 (100.0%) | 0 (0.0%) |
| Total (Category) | 157 (75.5%) | 51 (24.5%) |
| Total (Overall) | 289 (53.1%) | 255 (46.9%) |
Production, Transportation and Moving Occupations
The most common Production, Transportation and Moving occupations in Omega are Transportation (36 | 6.6%), Material Moving (26 | 4.8%), and Production (14 | 2.6%).
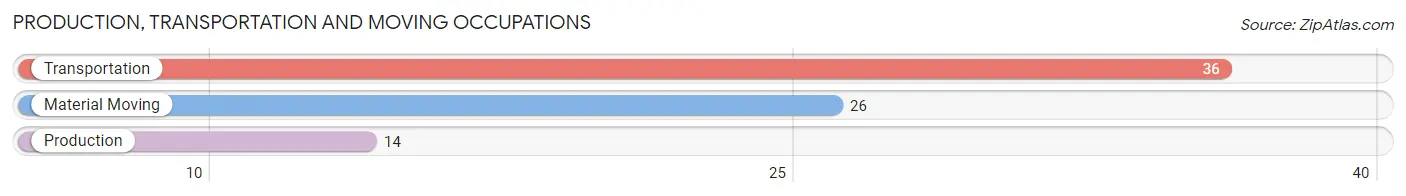
Production, Transportation and Moving Occupations by Sex
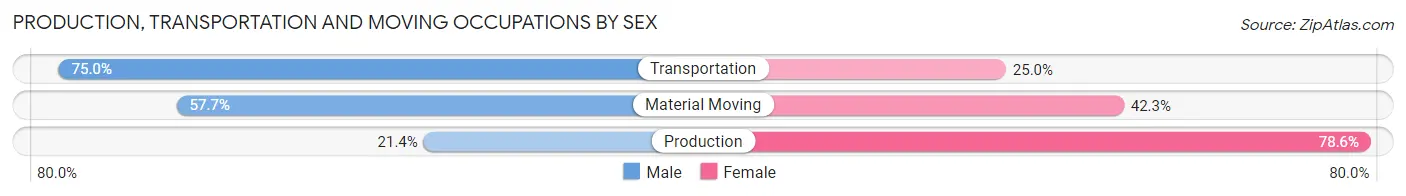
| Occupation | Male | Female |
| Production | 3 (21.4%) | 11 (78.6%) |
| Transportation | 27 (75.0%) | 9 (25.0%) |
| Material Moving | 15 (57.7%) | 11 (42.3%) |
| Total (Category) | 45 (59.2%) | 31 (40.8%) |
| Total (Overall) | 289 (53.1%) | 255 (46.9%) |
Employment Industries by Sex in Omega
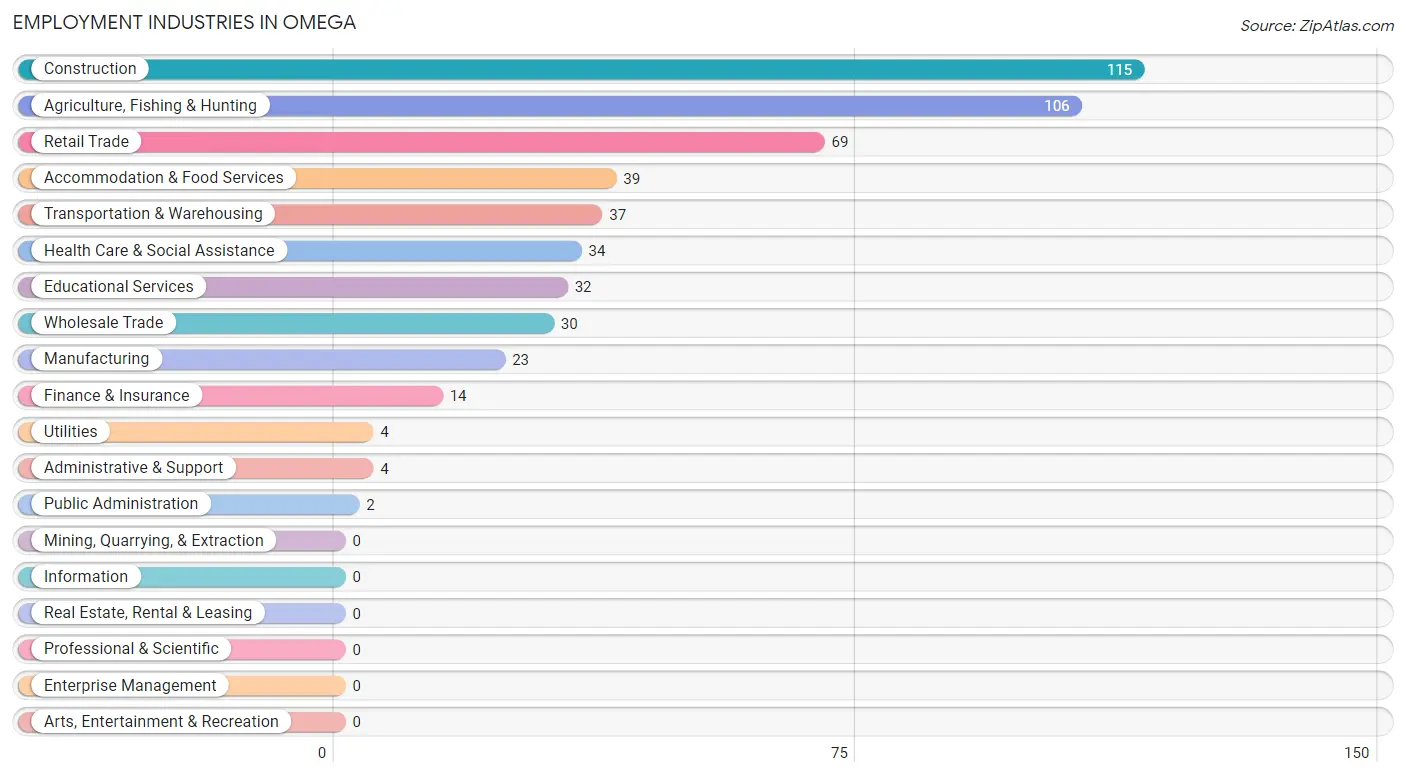
Employment Industries in Omega
The major employment industries in Omega include Construction (115 | 21.1%), Agriculture, Fishing & Hunting (106 | 19.5%), Retail Trade (69 | 12.7%), Accommodation & Food Services (39 | 7.2%), and Transportation & Warehousing (37 | 6.8%).
Employment Industries by Sex in Omega
The Omega industries that see more men than women are Public Administration (100.0%), Construction (93.0%), and Transportation & Warehousing (83.8%), whereas the industries that tend to have a higher number of women are Utilities (100.0%), Finance & Insurance (100.0%), and Administrative & Support (100.0%).
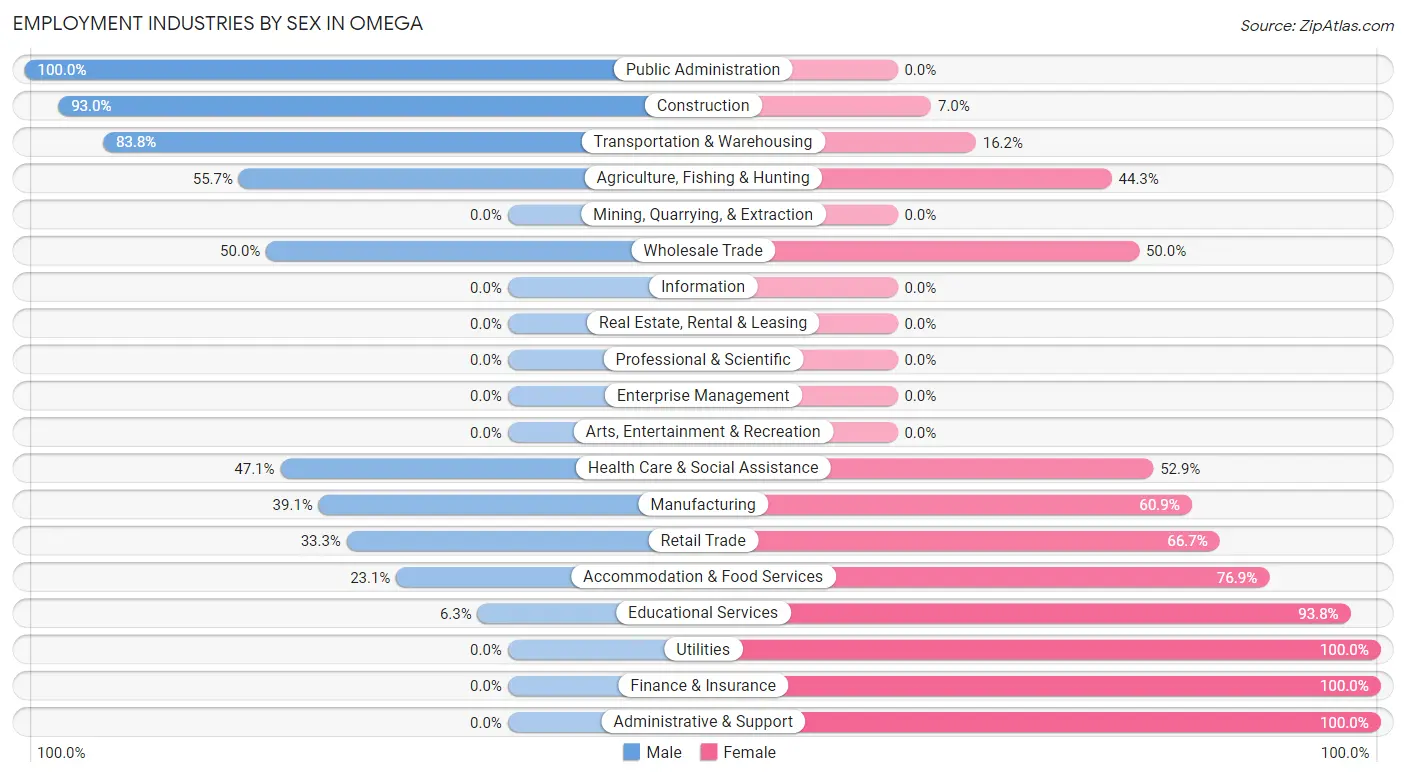
| Industry | Male | Female |
| Agriculture, Fishing & Hunting | 59 (55.7%) | 47 (44.3%) |
| Mining, Quarrying, & Extraction | 0 (0.0%) | 0 (0.0%) |
| Construction | 107 (93.0%) | 8 (7.0%) |
| Manufacturing | 9 (39.1%) | 14 (60.9%) |
| Wholesale Trade | 15 (50.0%) | 15 (50.0%) |
| Retail Trade | 23 (33.3%) | 46 (66.7%) |
| Transportation & Warehousing | 31 (83.8%) | 6 (16.2%) |
| Utilities | 0 (0.0%) | 4 (100.0%) |
| Information | 0 (0.0%) | 0 (0.0%) |
| Finance & Insurance | 0 (0.0%) | 14 (100.0%) |
| Real Estate, Rental & Leasing | 0 (0.0%) | 0 (0.0%) |
| Professional & Scientific | 0 (0.0%) | 0 (0.0%) |
| Enterprise Management | 0 (0.0%) | 0 (0.0%) |
| Administrative & Support | 0 (0.0%) | 4 (100.0%) |
| Educational Services | 2 (6.2%) | 30 (93.8%) |
| Health Care & Social Assistance | 16 (47.1%) | 18 (52.9%) |
| Arts, Entertainment & Recreation | 0 (0.0%) | 0 (0.0%) |
| Accommodation & Food Services | 9 (23.1%) | 30 (76.9%) |
| Public Administration | 2 (100.0%) | 0 (0.0%) |
| Total | 289 (53.1%) | 255 (46.9%) |
Education in Omega
School Enrollment in Omega
The most common levels of schooling among the 316 students in Omega are high school (110 | 34.8%), middle school (66 | 20.9%), and elementary school (64 | 20.3%).
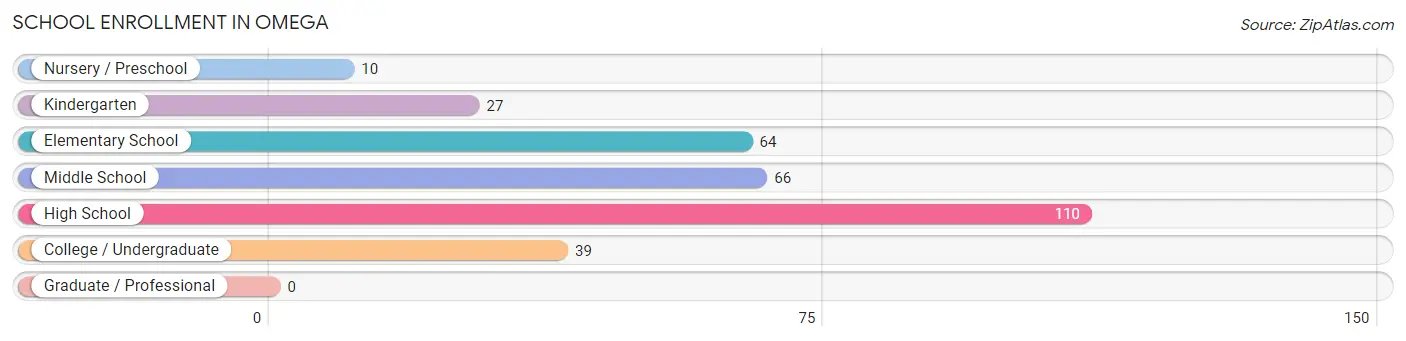
| School Level | # Students | % Students |
| Nursery / Preschool | 10 | 3.2% |
| Kindergarten | 27 | 8.5% |
| Elementary School | 64 | 20.3% |
| Middle School | 66 | 20.9% |
| High School | 110 | 34.8% |
| College / Undergraduate | 39 | 12.3% |
| Graduate / Professional | 0 | 0.0% |
| Total | 316 | 100.0% |
School Enrollment by Age by Funding Source in Omega
Out of a total of 316 students who are enrolled in schools in Omega, 13 (4.1%) attend a private institution, while the remaining 303 (95.9%) are enrolled in public schools. The age group of 25 to 34 year olds has the highest likelihood of being enrolled in private schools, with 3 (25.0% in the age bracket) enrolled. Conversely, the age group of 3 to 4 year olds has the lowest likelihood of being enrolled in a private school, with 11 (100.0% in the age bracket) attending a public institution.
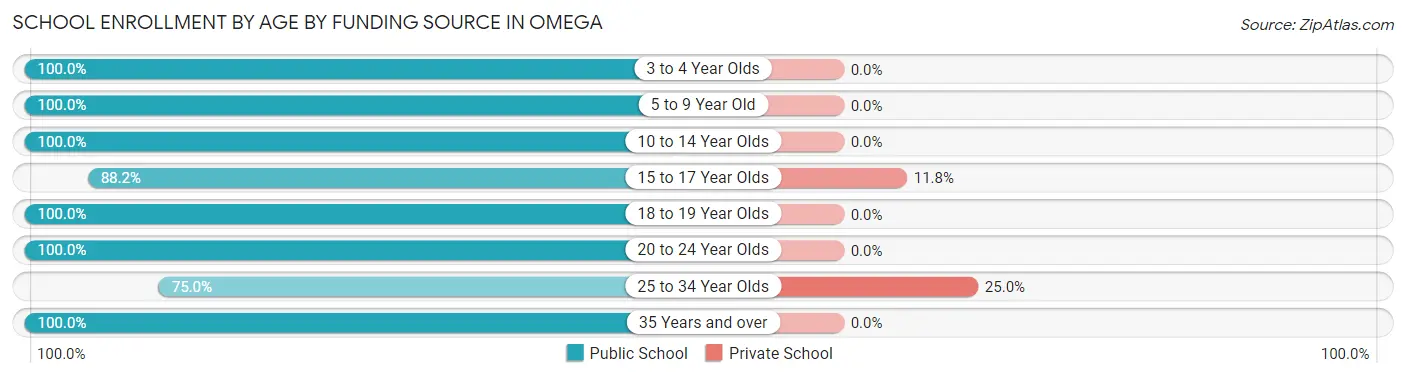
| Age Bracket | Public School | Private School |
| 3 to 4 Year Olds | 11 (100.0%) | 0 (0.0%) |
| 5 to 9 Year Old | 90 (100.0%) | 0 (0.0%) |
| 10 to 14 Year Olds | 91 (100.0%) | 0 (0.0%) |
| 15 to 17 Year Olds | 75 (88.2%) | 10 (11.8%) |
| 18 to 19 Year Olds | 8 (100.0%) | 0 (0.0%) |
| 20 to 24 Year Olds | 11 (100.0%) | 0 (0.0%) |
| 25 to 34 Year Olds | 9 (75.0%) | 3 (25.0%) |
| 35 Years and over | 8 (100.0%) | 0 (0.0%) |
| Total | 303 (95.9%) | 13 (4.1%) |
Educational Attainment by Field of Study in Omega
Bio, nature & agricultural (5 | 29.4%), arts & humanities (5 | 29.4%), multidisciplinary studies (4 | 23.5%), and education (3 | 17.6%) are the most common fields of study among 17 individuals in Omega who have obtained a bachelor's degree or higher.
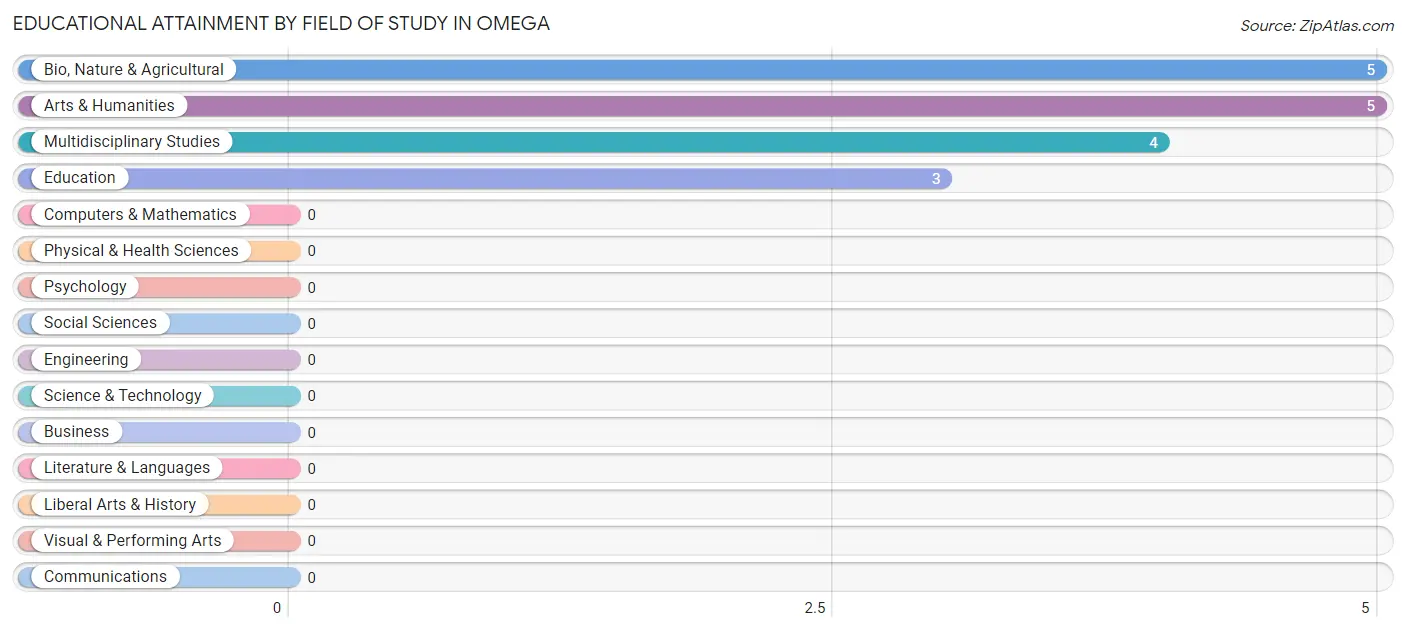
| Field of Study | # Graduates | % Graduates |
| Computers & Mathematics | 0 | 0.0% |
| Bio, Nature & Agricultural | 5 | 29.4% |
| Physical & Health Sciences | 0 | 0.0% |
| Psychology | 0 | 0.0% |
| Social Sciences | 0 | 0.0% |
| Engineering | 0 | 0.0% |
| Multidisciplinary Studies | 4 | 23.5% |
| Science & Technology | 0 | 0.0% |
| Business | 0 | 0.0% |
| Education | 3 | 17.6% |
| Literature & Languages | 0 | 0.0% |
| Liberal Arts & History | 0 | 0.0% |
| Visual & Performing Arts | 0 | 0.0% |
| Communications | 0 | 0.0% |
| Arts & Humanities | 5 | 29.4% |
| Total | 17 | 100.0% |
Transportation & Commute in Omega
Vehicle Availability by Sex in Omega
The most prevalent vehicle ownership categories in Omega are males with 2 vehicles (96, accounting for 34.7%) and females with 2 vehicles (76, making up 37.7%).
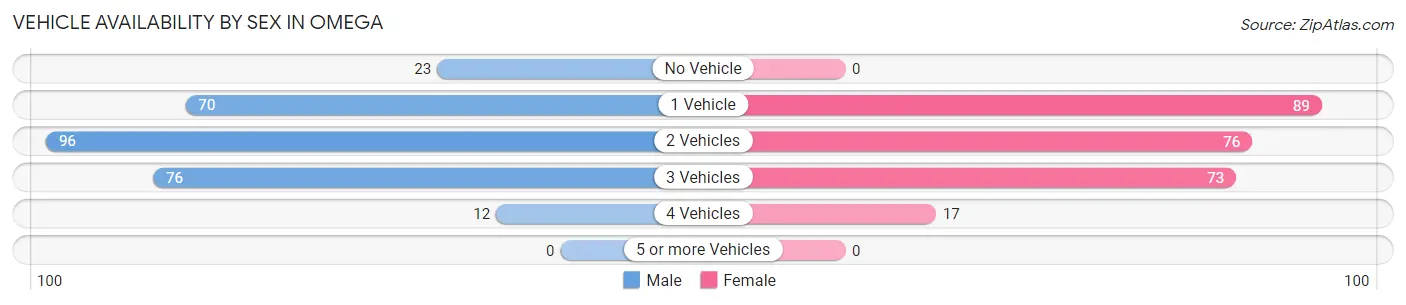
| Vehicles Available | Male | Female |
| No Vehicle | 23 (8.3%) | 0 (0.0%) |
| 1 Vehicle | 70 (25.3%) | 89 (34.9%) |
| 2 Vehicles | 96 (34.7%) | 76 (29.8%) |
| 3 Vehicles | 76 (27.4%) | 73 (28.6%) |
| 4 Vehicles | 12 (4.3%) | 17 (6.7%) |
| 5 or more Vehicles | 0 (0.0%) | 0 (0.0%) |
| Total | 277 (100.0%) | 255 (100.0%) |
Commute Time in Omega
The most frequently occuring commute durations in Omega are 20 to 24 minutes (163 commuters, 31.2%), 15 to 19 minutes (80 commuters, 15.3%), and 30 to 34 minutes (80 commuters, 15.3%).
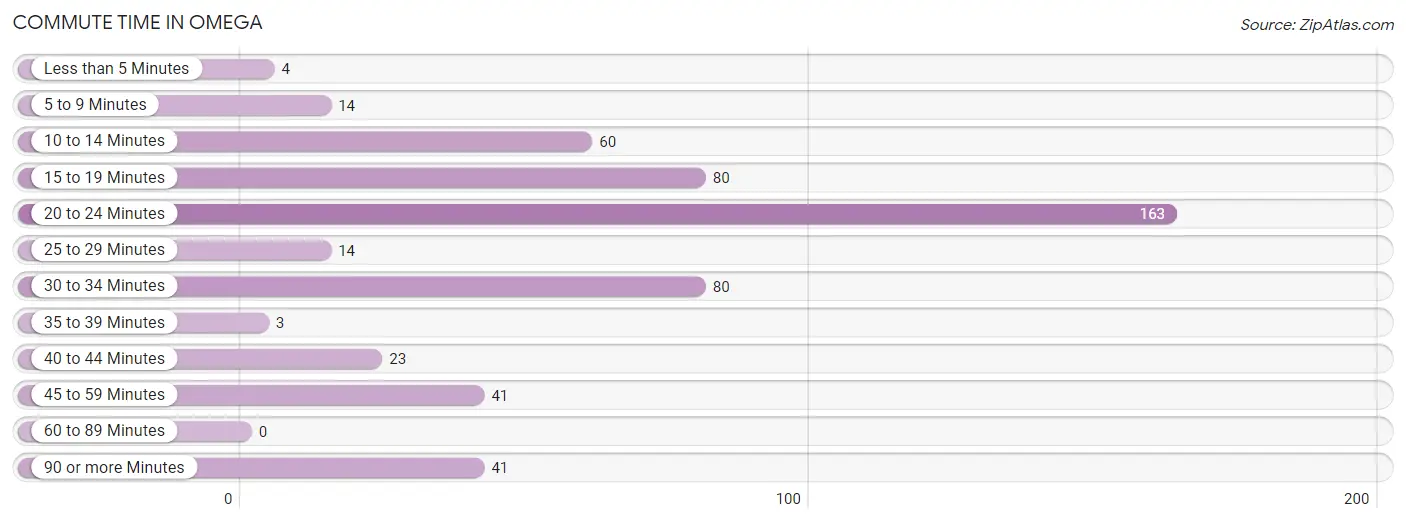
| Commute Time | # Commuters | % Commuters |
| Less than 5 Minutes | 4 | 0.8% |
| 5 to 9 Minutes | 14 | 2.7% |
| 10 to 14 Minutes | 60 | 11.5% |
| 15 to 19 Minutes | 80 | 15.3% |
| 20 to 24 Minutes | 163 | 31.2% |
| 25 to 29 Minutes | 14 | 2.7% |
| 30 to 34 Minutes | 80 | 15.3% |
| 35 to 39 Minutes | 3 | 0.6% |
| 40 to 44 Minutes | 23 | 4.4% |
| 45 to 59 Minutes | 41 | 7.8% |
| 60 to 89 Minutes | 0 | 0.0% |
| 90 or more Minutes | 41 | 7.8% |
Commute Time by Sex in Omega
The most common commute times in Omega are 20 to 24 minutes (70 commuters, 25.8%) for males and 20 to 24 minutes (93 commuters, 36.9%) for females.
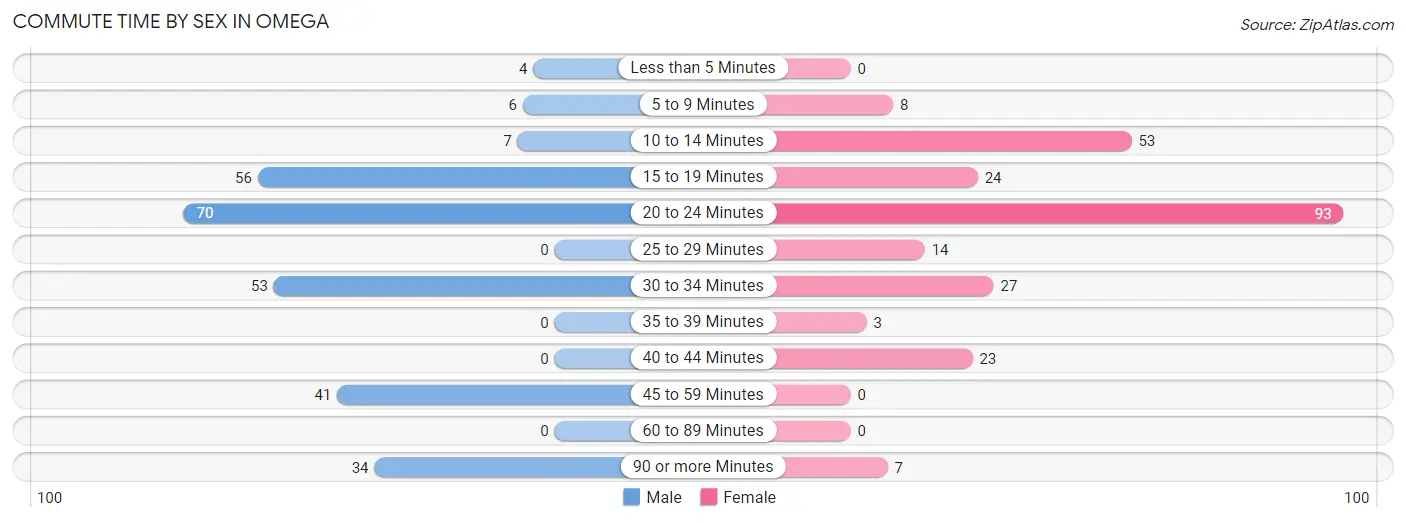
| Commute Time | Male | Female |
| Less than 5 Minutes | 4 (1.5%) | 0 (0.0%) |
| 5 to 9 Minutes | 6 (2.2%) | 8 (3.2%) |
| 10 to 14 Minutes | 7 (2.6%) | 53 (21.0%) |
| 15 to 19 Minutes | 56 (20.7%) | 24 (9.5%) |
| 20 to 24 Minutes | 70 (25.8%) | 93 (36.9%) |
| 25 to 29 Minutes | 0 (0.0%) | 14 (5.6%) |
| 30 to 34 Minutes | 53 (19.6%) | 27 (10.7%) |
| 35 to 39 Minutes | 0 (0.0%) | 3 (1.2%) |
| 40 to 44 Minutes | 0 (0.0%) | 23 (9.1%) |
| 45 to 59 Minutes | 41 (15.1%) | 0 (0.0%) |
| 60 to 89 Minutes | 0 (0.0%) | 0 (0.0%) |
| 90 or more Minutes | 34 (12.6%) | 7 (2.8%) |
Time of Departure to Work by Sex in Omega
The most frequent times of departure to work in Omega are 7:00 AM to 7:29 AM (83, 30.6%) for males and 7:00 AM to 7:29 AM (89, 35.3%) for females.
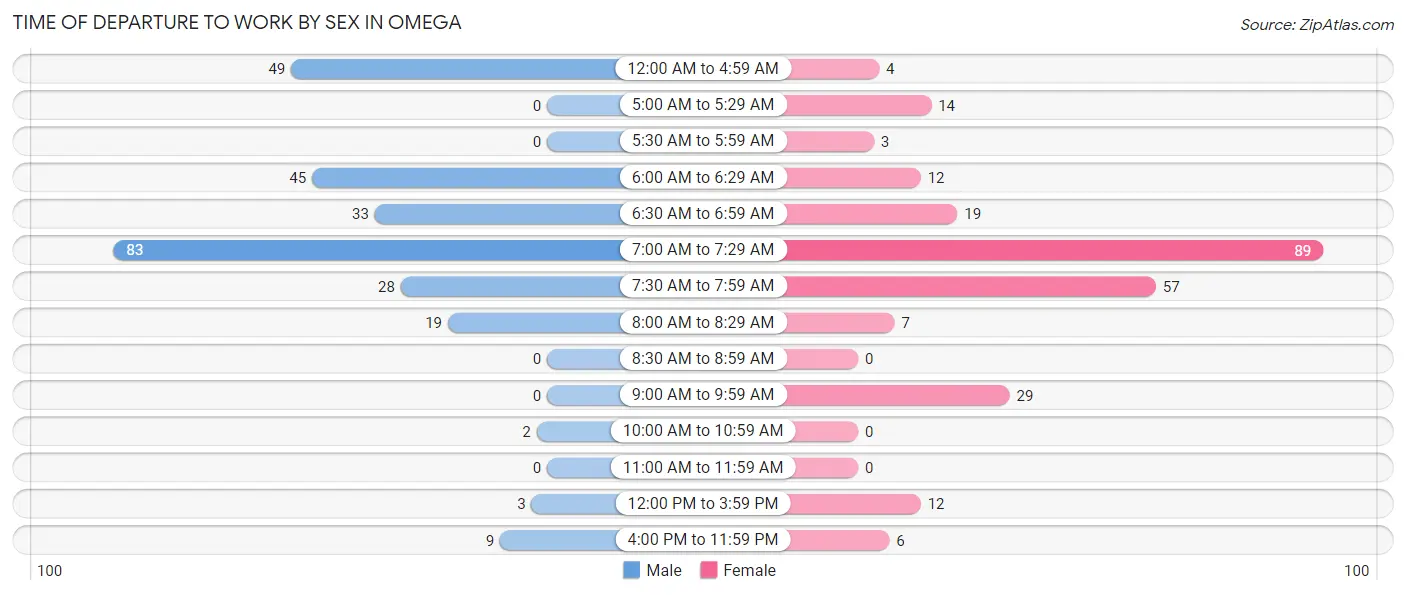
| Time of Departure | Male | Female |
| 12:00 AM to 4:59 AM | 49 (18.1%) | 4 (1.6%) |
| 5:00 AM to 5:29 AM | 0 (0.0%) | 14 (5.6%) |
| 5:30 AM to 5:59 AM | 0 (0.0%) | 3 (1.2%) |
| 6:00 AM to 6:29 AM | 45 (16.6%) | 12 (4.8%) |
| 6:30 AM to 6:59 AM | 33 (12.2%) | 19 (7.5%) |
| 7:00 AM to 7:29 AM | 83 (30.6%) | 89 (35.3%) |
| 7:30 AM to 7:59 AM | 28 (10.3%) | 57 (22.6%) |
| 8:00 AM to 8:29 AM | 19 (7.0%) | 7 (2.8%) |
| 8:30 AM to 8:59 AM | 0 (0.0%) | 0 (0.0%) |
| 9:00 AM to 9:59 AM | 0 (0.0%) | 29 (11.5%) |
| 10:00 AM to 10:59 AM | 2 (0.7%) | 0 (0.0%) |
| 11:00 AM to 11:59 AM | 0 (0.0%) | 0 (0.0%) |
| 12:00 PM to 3:59 PM | 3 (1.1%) | 12 (4.8%) |
| 4:00 PM to 11:59 PM | 9 (3.3%) | 6 (2.4%) |
| Total | 271 (100.0%) | 252 (100.0%) |
Housing Occupancy in Omega
Occupancy by Ownership in Omega
Of the total 418 dwellings in Omega, owner-occupied units account for 299 (71.5%), while renter-occupied units make up 119 (28.5%).
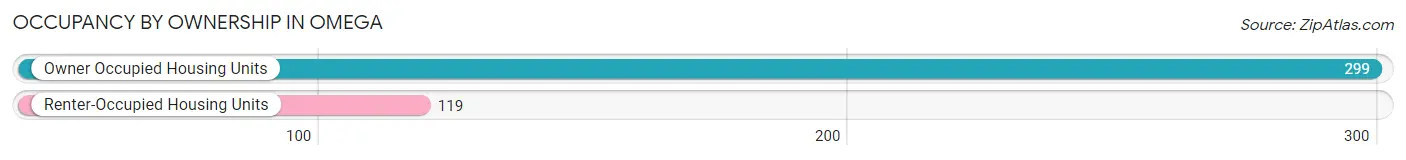
| Occupancy | # Housing Units | % Housing Units |
| Owner Occupied Housing Units | 299 | 71.5% |
| Renter-Occupied Housing Units | 119 | 28.5% |
| Total Occupied Housing Units | 418 | 100.0% |
Occupancy by Household Size in Omega
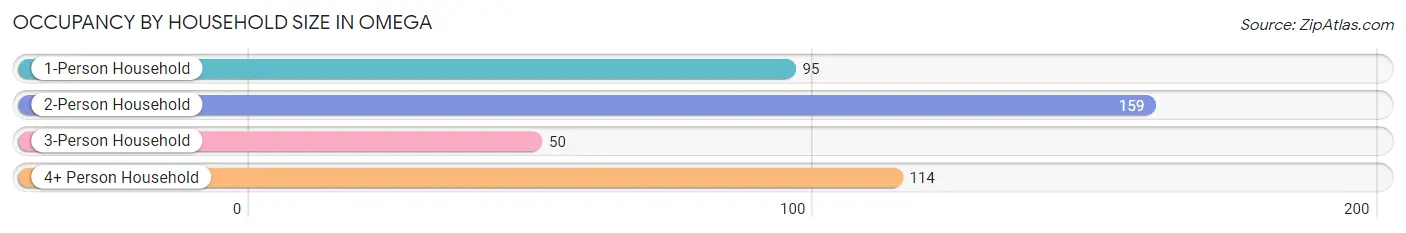
| Household Size | # Housing Units | % Housing Units |
| 1-Person Household | 95 | 22.7% |
| 2-Person Household | 159 | 38.0% |
| 3-Person Household | 50 | 12.0% |
| 4+ Person Household | 114 | 27.3% |
| Total Housing Units | 418 | 100.0% |
Occupancy by Ownership by Household Size in Omega
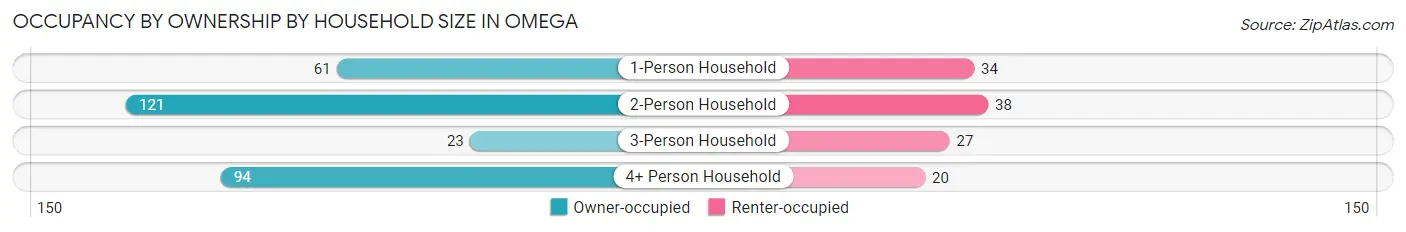
| Household Size | Owner-occupied | Renter-occupied |
| 1-Person Household | 61 (64.2%) | 34 (35.8%) |
| 2-Person Household | 121 (76.1%) | 38 (23.9%) |
| 3-Person Household | 23 (46.0%) | 27 (54.0%) |
| 4+ Person Household | 94 (82.5%) | 20 (17.5%) |
| Total Housing Units | 299 (71.5%) | 119 (28.5%) |
Occupancy by Educational Attainment in Omega
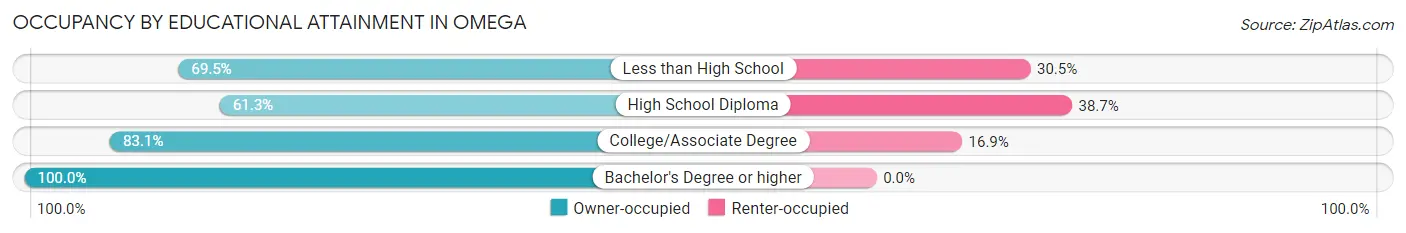
| Household Size | Owner-occupied | Renter-occupied |
| Less than High School | 98 (69.5%) | 43 (30.5%) |
| High School Diploma | 87 (61.3%) | 55 (38.7%) |
| College/Associate Degree | 103 (83.1%) | 21 (16.9%) |
| Bachelor's Degree or higher | 11 (100.0%) | 0 (0.0%) |
Occupancy by Age of Householder in Omega
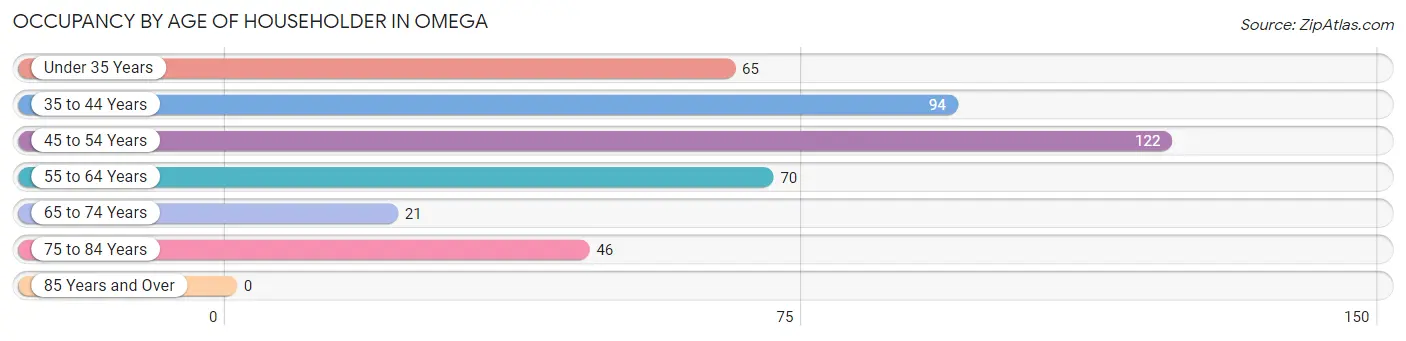
| Age Bracket | # Households | % Households |
| Under 35 Years | 65 | 15.5% |
| 35 to 44 Years | 94 | 22.5% |
| 45 to 54 Years | 122 | 29.2% |
| 55 to 64 Years | 70 | 16.8% |
| 65 to 74 Years | 21 | 5.0% |
| 75 to 84 Years | 46 | 11.0% |
| 85 Years and Over | 0 | 0.0% |
| Total | 418 | 100.0% |
Housing Finances in Omega
Median Income by Occupancy in Omega
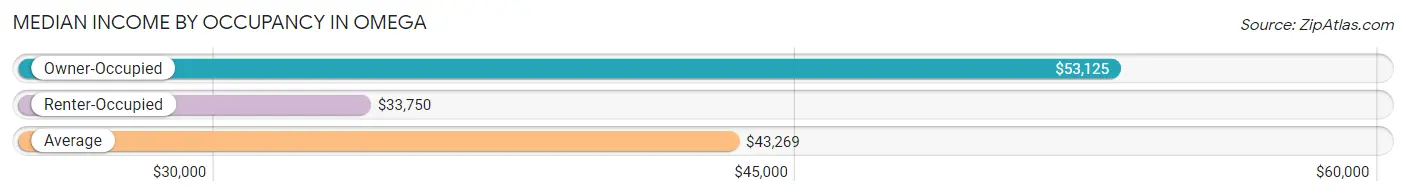
| Occupancy Type | # Households | Median Income |
| Owner-Occupied | 299 (71.5%) | $53,125 |
| Renter-Occupied | 119 (28.5%) | $33,750 |
| Average | 418 (100.0%) | $43,269 |
Occupancy by Householder Income Bracket in Omega
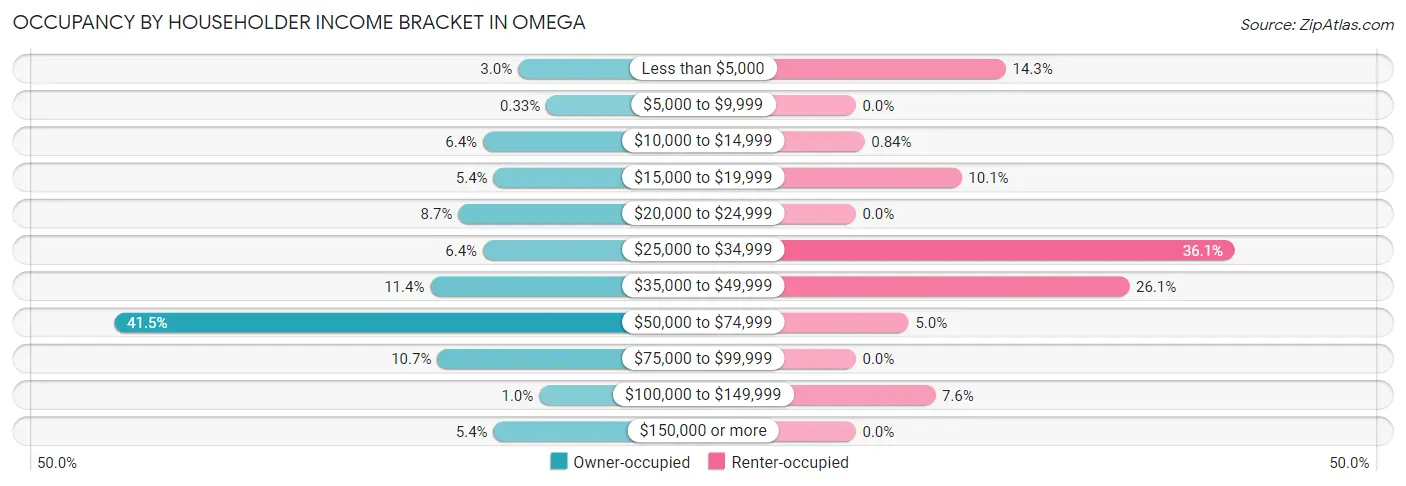
| Income Bracket | Owner-occupied | Renter-occupied |
| Less than $5,000 | 9 (3.0%) | 17 (14.3%) |
| $5,000 to $9,999 | 1 (0.3%) | 0 (0.0%) |
| $10,000 to $14,999 | 19 (6.4%) | 1 (0.8%) |
| $15,000 to $19,999 | 16 (5.3%) | 12 (10.1%) |
| $20,000 to $24,999 | 26 (8.7%) | 0 (0.0%) |
| $25,000 to $34,999 | 19 (6.4%) | 43 (36.1%) |
| $35,000 to $49,999 | 34 (11.4%) | 31 (26.1%) |
| $50,000 to $74,999 | 124 (41.5%) | 6 (5.0%) |
| $75,000 to $99,999 | 32 (10.7%) | 0 (0.0%) |
| $100,000 to $149,999 | 3 (1.0%) | 9 (7.6%) |
| $150,000 or more | 16 (5.3%) | 0 (0.0%) |
| Total | 299 (100.0%) | 119 (100.0%) |
Monthly Housing Cost Tiers in Omega
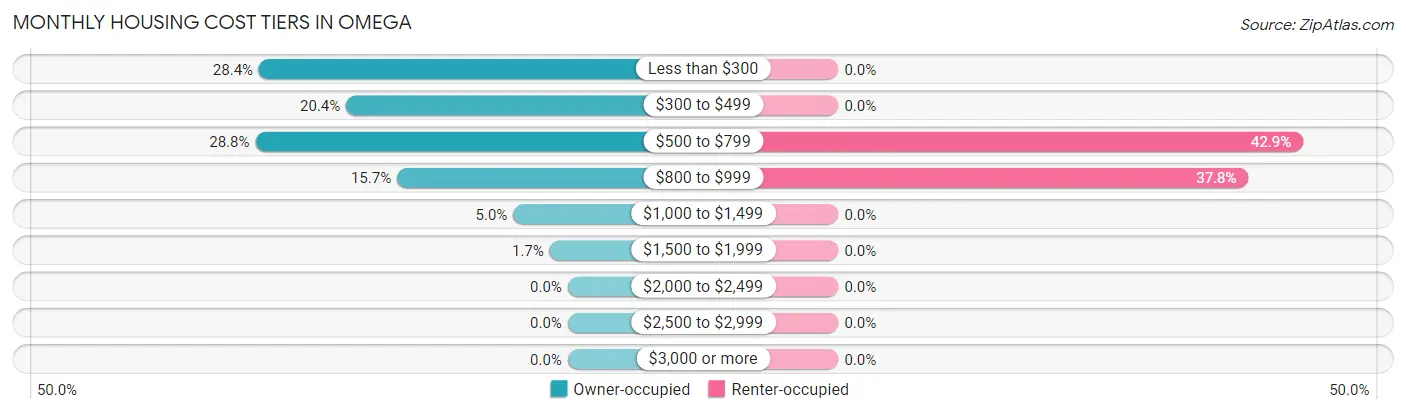
| Monthly Cost | Owner-occupied | Renter-occupied |
| Less than $300 | 85 (28.4%) | 0 (0.0%) |
| $300 to $499 | 61 (20.4%) | 0 (0.0%) |
| $500 to $799 | 86 (28.8%) | 51 (42.9%) |
| $800 to $999 | 47 (15.7%) | 45 (37.8%) |
| $1,000 to $1,499 | 15 (5.0%) | 0 (0.0%) |
| $1,500 to $1,999 | 5 (1.7%) | 0 (0.0%) |
| $2,000 to $2,499 | 0 (0.0%) | 0 (0.0%) |
| $2,500 to $2,999 | 0 (0.0%) | 0 (0.0%) |
| $3,000 or more | 0 (0.0%) | 0 (0.0%) |
| Total | 299 (100.0%) | 119 (100.0%) |
Physical Housing Characteristics in Omega
Housing Structures in Omega
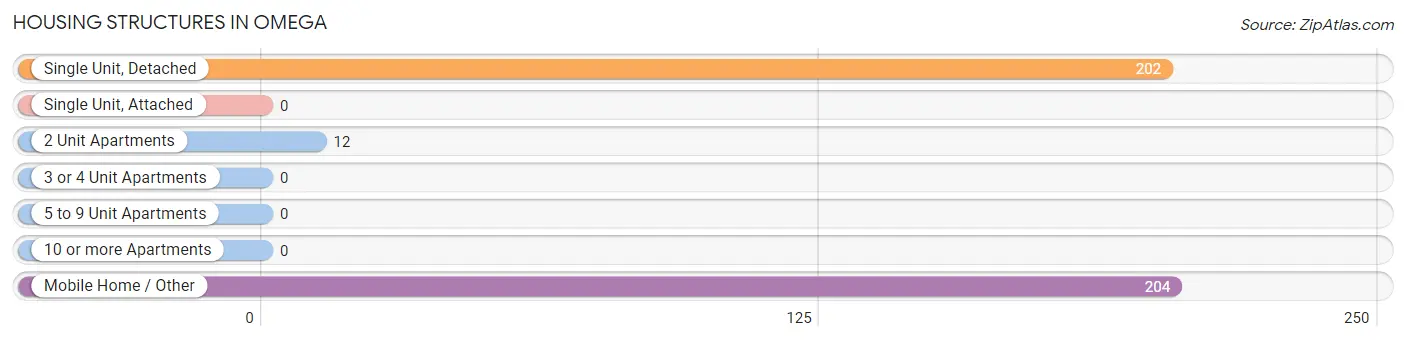
| Structure Type | # Housing Units | % Housing Units |
| Single Unit, Detached | 202 | 48.3% |
| Single Unit, Attached | 0 | 0.0% |
| 2 Unit Apartments | 12 | 2.9% |
| 3 or 4 Unit Apartments | 0 | 0.0% |
| 5 to 9 Unit Apartments | 0 | 0.0% |
| 10 or more Apartments | 0 | 0.0% |
| Mobile Home / Other | 204 | 48.8% |
| Total | 418 | 100.0% |
Housing Structures by Occupancy in Omega
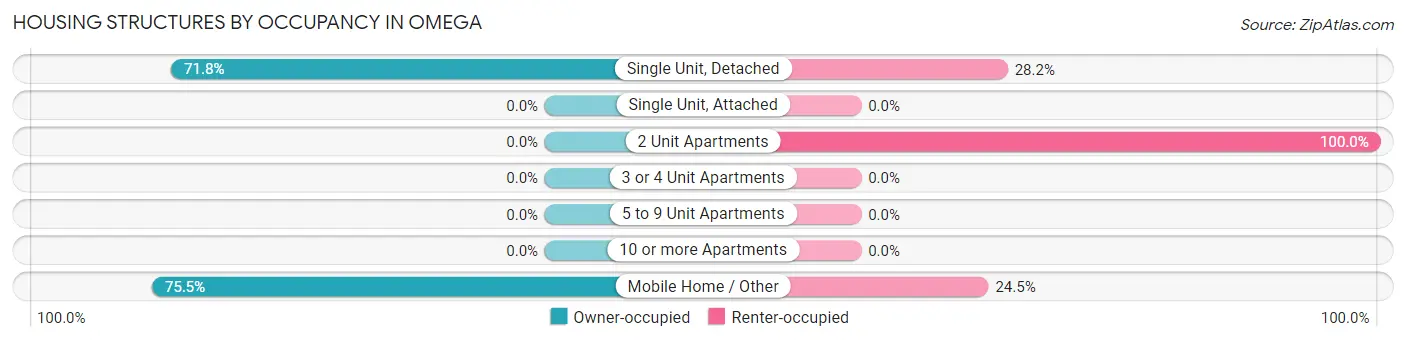
| Structure Type | Owner-occupied | Renter-occupied |
| Single Unit, Detached | 145 (71.8%) | 57 (28.2%) |
| Single Unit, Attached | 0 (0.0%) | 0 (0.0%) |
| 2 Unit Apartments | 0 (0.0%) | 12 (100.0%) |
| 3 or 4 Unit Apartments | 0 (0.0%) | 0 (0.0%) |
| 5 to 9 Unit Apartments | 0 (0.0%) | 0 (0.0%) |
| 10 or more Apartments | 0 (0.0%) | 0 (0.0%) |
| Mobile Home / Other | 154 (75.5%) | 50 (24.5%) |
| Total | 299 (71.5%) | 119 (28.5%) |
Housing Structures by Number of Rooms in Omega
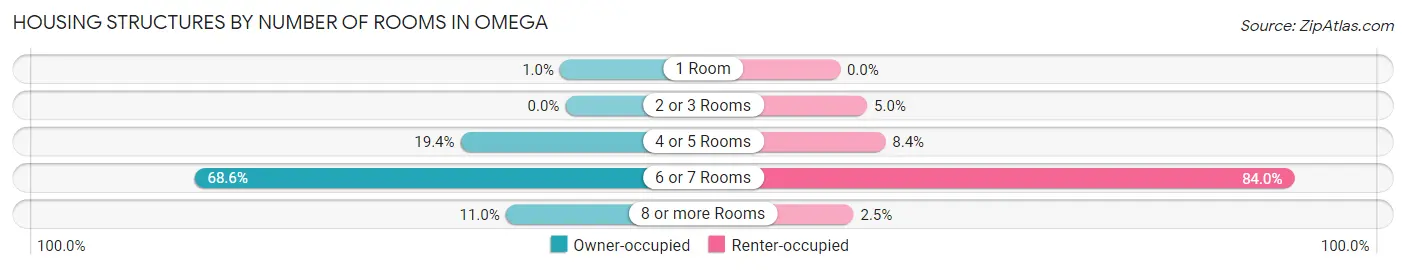
| Number of Rooms | Owner-occupied | Renter-occupied |
| 1 Room | 3 (1.0%) | 0 (0.0%) |
| 2 or 3 Rooms | 0 (0.0%) | 6 (5.0%) |
| 4 or 5 Rooms | 58 (19.4%) | 10 (8.4%) |
| 6 or 7 Rooms | 205 (68.6%) | 100 (84.0%) |
| 8 or more Rooms | 33 (11.0%) | 3 (2.5%) |
| Total | 299 (100.0%) | 119 (100.0%) |
Housing Structure by Heating Type in Omega
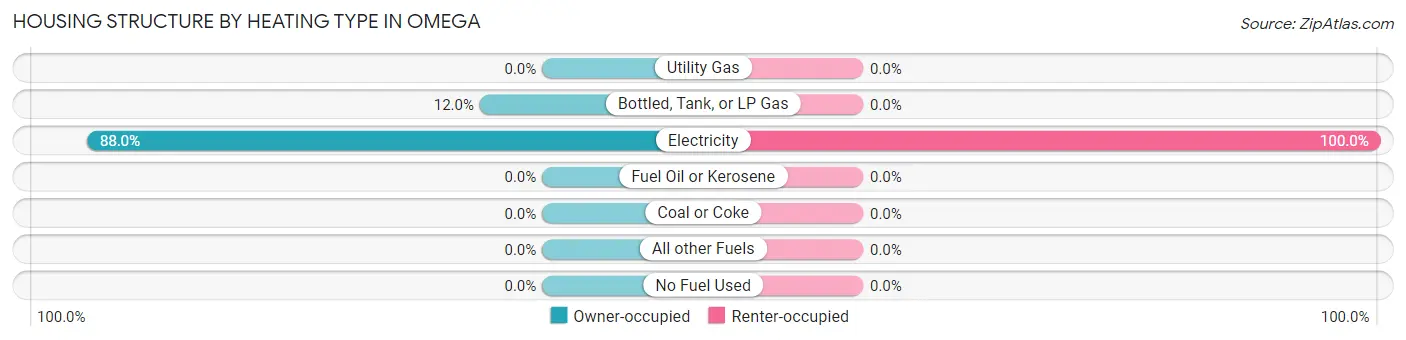
| Heating Type | Owner-occupied | Renter-occupied |
| Utility Gas | 0 (0.0%) | 0 (0.0%) |
| Bottled, Tank, or LP Gas | 36 (12.0%) | 0 (0.0%) |
| Electricity | 263 (88.0%) | 119 (100.0%) |
| Fuel Oil or Kerosene | 0 (0.0%) | 0 (0.0%) |
| Coal or Coke | 0 (0.0%) | 0 (0.0%) |
| All other Fuels | 0 (0.0%) | 0 (0.0%) |
| No Fuel Used | 0 (0.0%) | 0 (0.0%) |
| Total | 299 (100.0%) | 119 (100.0%) |
Household Vehicle Usage in Omega
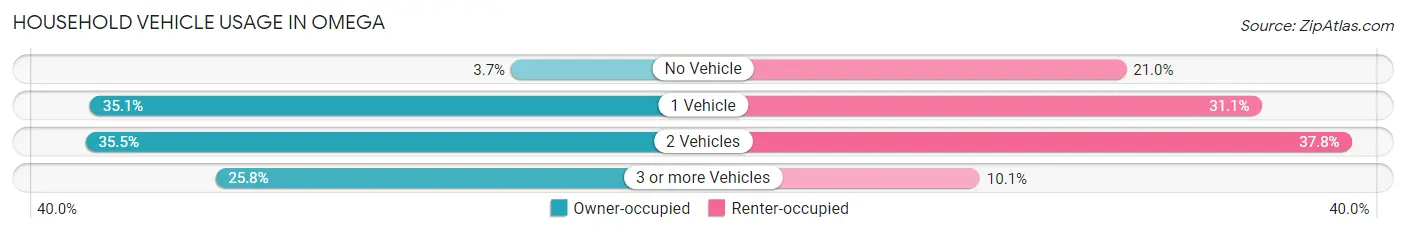
| Vehicles per Household | Owner-occupied | Renter-occupied |
| No Vehicle | 11 (3.7%) | 25 (21.0%) |
| 1 Vehicle | 105 (35.1%) | 37 (31.1%) |
| 2 Vehicles | 106 (35.4%) | 45 (37.8%) |
| 3 or more Vehicles | 77 (25.8%) | 12 (10.1%) |
| Total | 299 (100.0%) | 119 (100.0%) |
Real Estate & Mortgages in Omega
Real Estate and Mortgage Overview in Omega
| Characteristic | Without Mortgage | With Mortgage |
| Housing Units | 204 | 95 |
| Median Property Value | $71,500 | $91,300 |
| Median Household Income | $52,593 | $0 |
| Monthly Housing Costs | $340 | $0 |
| Real Estate Taxes | $385 | $0 |
Property Value by Mortgage Status in Omega
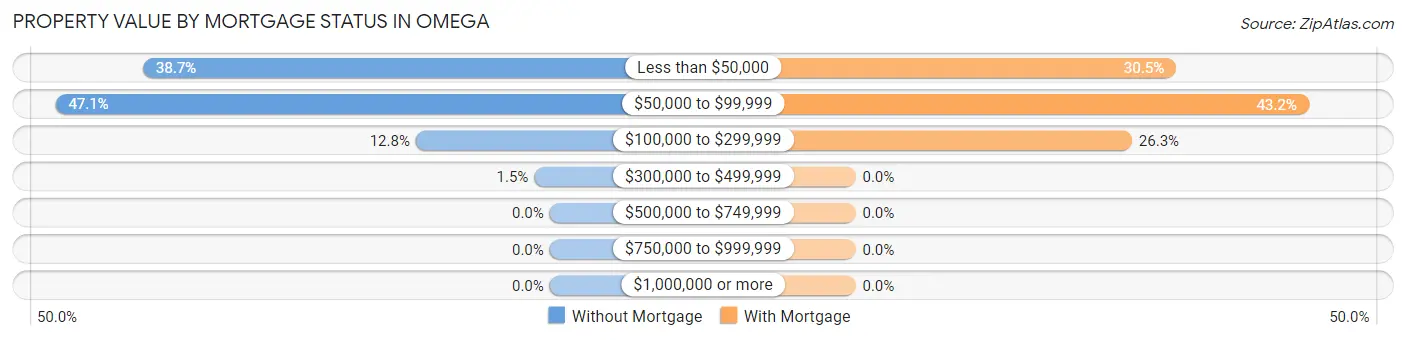
| Property Value | Without Mortgage | With Mortgage |
| Less than $50,000 | 79 (38.7%) | 29 (30.5%) |
| $50,000 to $99,999 | 96 (47.1%) | 41 (43.2%) |
| $100,000 to $299,999 | 26 (12.8%) | 25 (26.3%) |
| $300,000 to $499,999 | 3 (1.5%) | 0 (0.0%) |
| $500,000 to $749,999 | 0 (0.0%) | 0 (0.0%) |
| $750,000 to $999,999 | 0 (0.0%) | 0 (0.0%) |
| $1,000,000 or more | 0 (0.0%) | 0 (0.0%) |
| Total | 204 (100.0%) | 95 (100.0%) |
Household Income by Mortgage Status in Omega
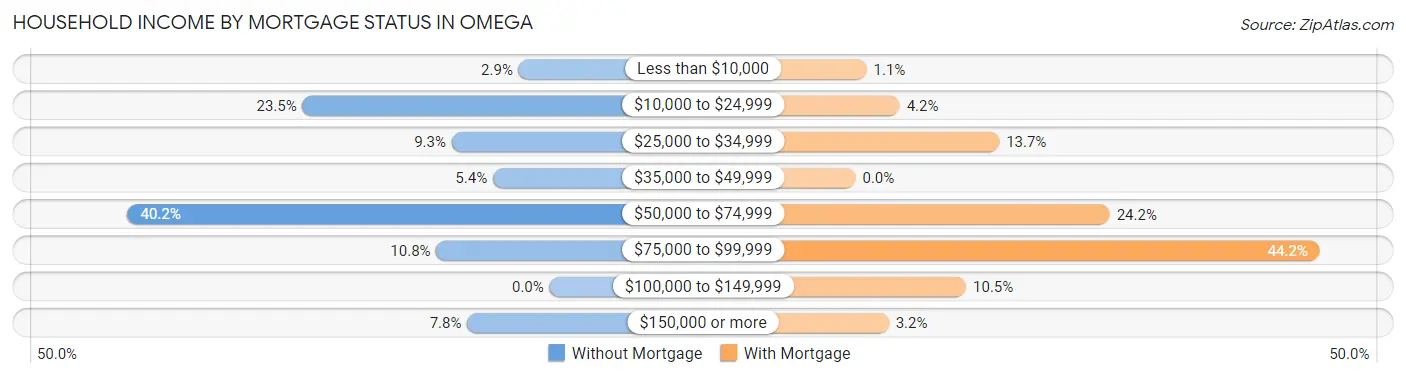
| Household Income | Without Mortgage | With Mortgage |
| Less than $10,000 | 6 (2.9%) | 1 (1.1%) |
| $10,000 to $24,999 | 48 (23.5%) | 4 (4.2%) |
| $25,000 to $34,999 | 19 (9.3%) | 13 (13.7%) |
| $35,000 to $49,999 | 11 (5.4%) | 0 (0.0%) |
| $50,000 to $74,999 | 82 (40.2%) | 23 (24.2%) |
| $75,000 to $99,999 | 22 (10.8%) | 42 (44.2%) |
| $100,000 to $149,999 | 0 (0.0%) | 10 (10.5%) |
| $150,000 or more | 16 (7.8%) | 3 (3.2%) |
| Total | 204 (100.0%) | 95 (100.0%) |
Property Value to Household Income Ratio in Omega
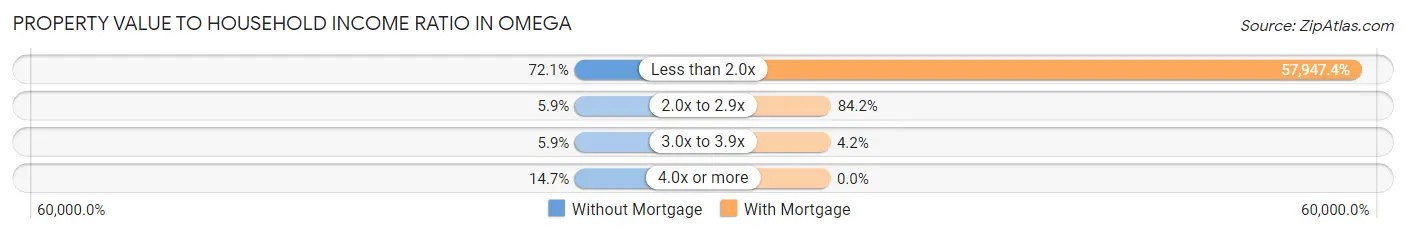
| Value-to-Income Ratio | Without Mortgage | With Mortgage |
| Less than 2.0x | 147 (72.1%) | 55,050 (57,947.4%) |
| 2.0x to 2.9x | 12 (5.9%) | 80 (84.2%) |
| 3.0x to 3.9x | 12 (5.9%) | 4 (4.2%) |
| 4.0x or more | 30 (14.7%) | 0 (0.0%) |
| Total | 204 (100.0%) | 95 (100.0%) |
Real Estate Taxes by Mortgage Status in Omega
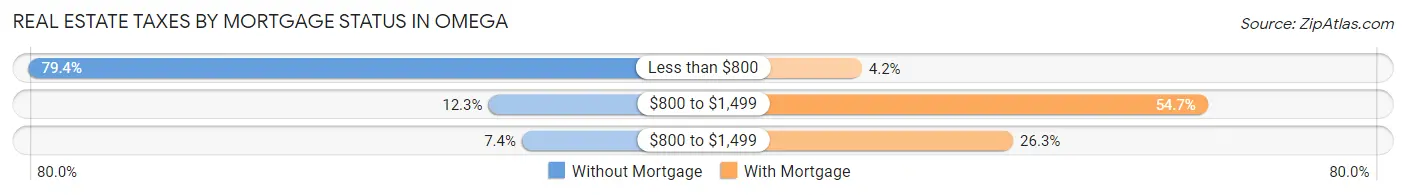
| Property Taxes | Without Mortgage | With Mortgage |
| Less than $800 | 162 (79.4%) | 4 (4.2%) |
| $800 to $1,499 | 25 (12.2%) | 52 (54.7%) |
| $800 to $1,499 | 15 (7.3%) | 25 (26.3%) |
| Total | 204 (100.0%) | 95 (100.0%) |
Health & Disability in Omega
Health Insurance Coverage by Age in Omega
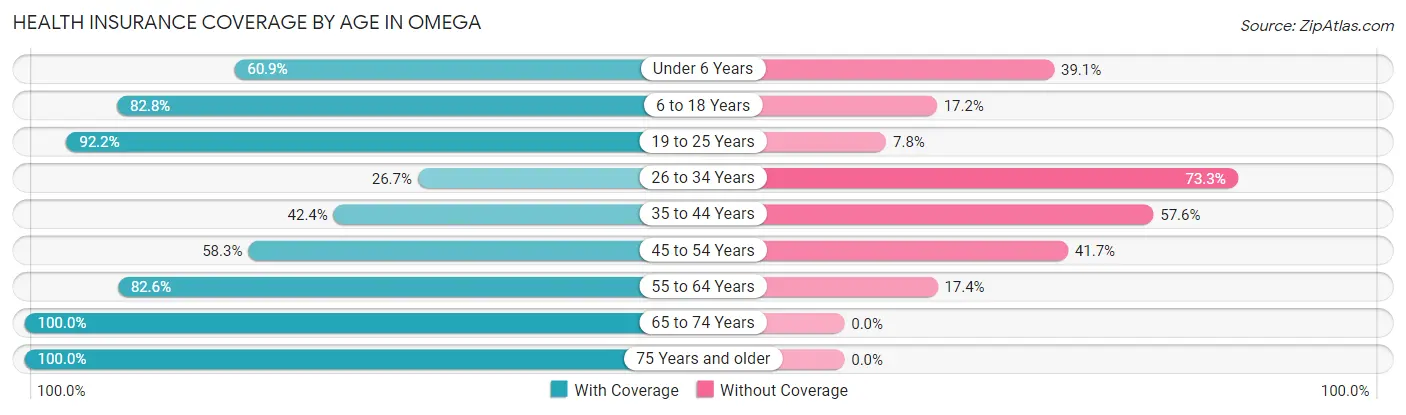
| Age Bracket | With Coverage | Without Coverage |
| Under 6 Years | 109 (60.9%) | 70 (39.1%) |
| 6 to 18 Years | 221 (82.8%) | 46 (17.2%) |
| 19 to 25 Years | 71 (92.2%) | 6 (7.8%) |
| 26 to 34 Years | 24 (26.7%) | 66 (73.3%) |
| 35 to 44 Years | 64 (42.4%) | 87 (57.6%) |
| 45 to 54 Years | 137 (58.3%) | 98 (41.7%) |
| 55 to 64 Years | 157 (82.6%) | 33 (17.4%) |
| 65 to 74 Years | 61 (100.0%) | 0 (0.0%) |
| 75 Years and older | 52 (100.0%) | 0 (0.0%) |
| Total | 896 (68.8%) | 406 (31.2%) |
Health Insurance Coverage by Citizenship Status in Omega
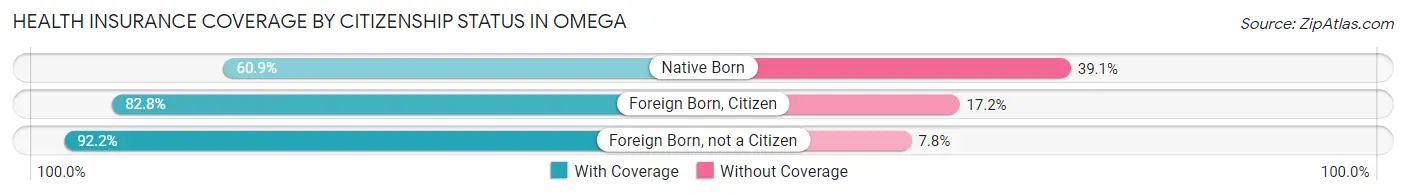
| Citizenship Status | With Coverage | Without Coverage |
| Native Born | 109 (60.9%) | 70 (39.1%) |
| Foreign Born, Citizen | 221 (82.8%) | 46 (17.2%) |
| Foreign Born, not a Citizen | 71 (92.2%) | 6 (7.8%) |
Health Insurance Coverage by Household Income in Omega
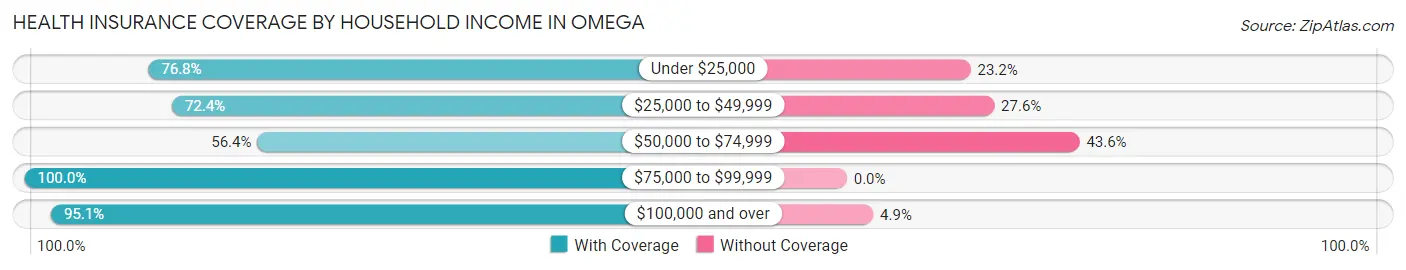
| Household Income | With Coverage | Without Coverage |
| Under $25,000 | 159 (76.8%) | 48 (23.2%) |
| $25,000 to $49,999 | 215 (72.4%) | 82 (27.6%) |
| $50,000 to $74,999 | 352 (56.4%) | 272 (43.6%) |
| $75,000 to $99,999 | 93 (100.0%) | 0 (0.0%) |
| $100,000 and over | 77 (95.1%) | 4 (4.9%) |
Public vs Private Health Insurance Coverage by Age in Omega
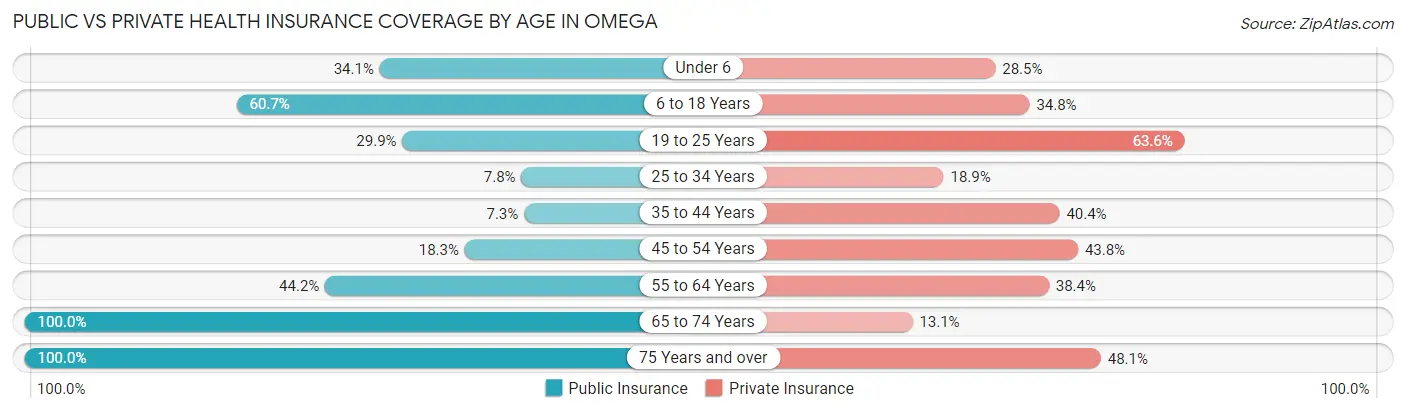
| Age Bracket | Public Insurance | Private Insurance |
| Under 6 | 61 (34.1%) | 51 (28.5%) |
| 6 to 18 Years | 162 (60.7%) | 93 (34.8%) |
| 19 to 25 Years | 23 (29.9%) | 49 (63.6%) |
| 25 to 34 Years | 7 (7.8%) | 17 (18.9%) |
| 35 to 44 Years | 11 (7.3%) | 61 (40.4%) |
| 45 to 54 Years | 43 (18.3%) | 103 (43.8%) |
| 55 to 64 Years | 84 (44.2%) | 73 (38.4%) |
| 65 to 74 Years | 61 (100.0%) | 8 (13.1%) |
| 75 Years and over | 52 (100.0%) | 25 (48.1%) |
| Total | 504 (38.7%) | 480 (36.9%) |
Disability Status by Sex by Age in Omega
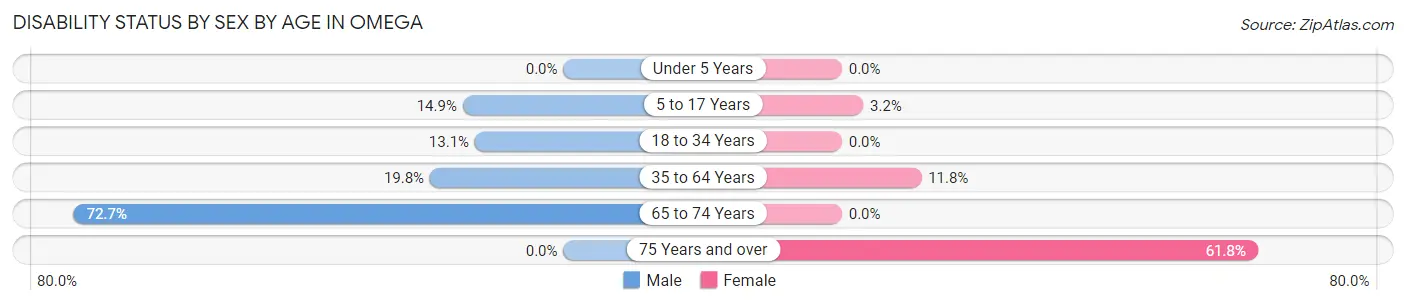
| Age Bracket | Male | Female |
| Under 5 Years | 0 (0.0%) | 0 (0.0%) |
| 5 to 17 Years | 13 (14.9%) | 6 (3.2%) |
| 18 to 34 Years | 13 (13.1%) | 0 (0.0%) |
| 35 to 64 Years | 62 (19.8%) | 31 (11.8%) |
| 65 to 74 Years | 8 (72.7%) | 0 (0.0%) |
| 75 Years and over | 0 (0.0%) | 21 (61.8%) |
Disability Class by Sex by Age in Omega
Disability Class: Hearing Difficulty
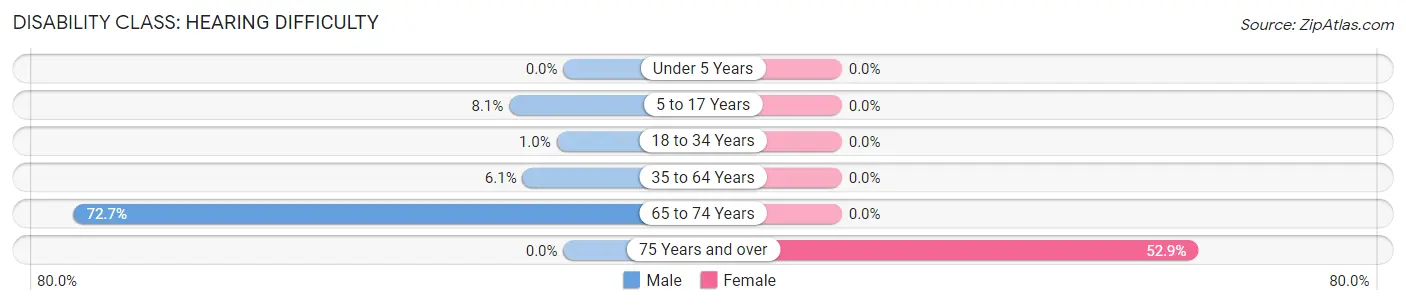
| Age Bracket | Male | Female |
| Under 5 Years | 0 (0.0%) | 0 (0.0%) |
| 5 to 17 Years | 7 (8.1%) | 0 (0.0%) |
| 18 to 34 Years | 1 (1.0%) | 0 (0.0%) |
| 35 to 64 Years | 19 (6.1%) | 0 (0.0%) |
| 65 to 74 Years | 8 (72.7%) | 0 (0.0%) |
| 75 Years and over | 0 (0.0%) | 18 (52.9%) |
Disability Class: Vision Difficulty
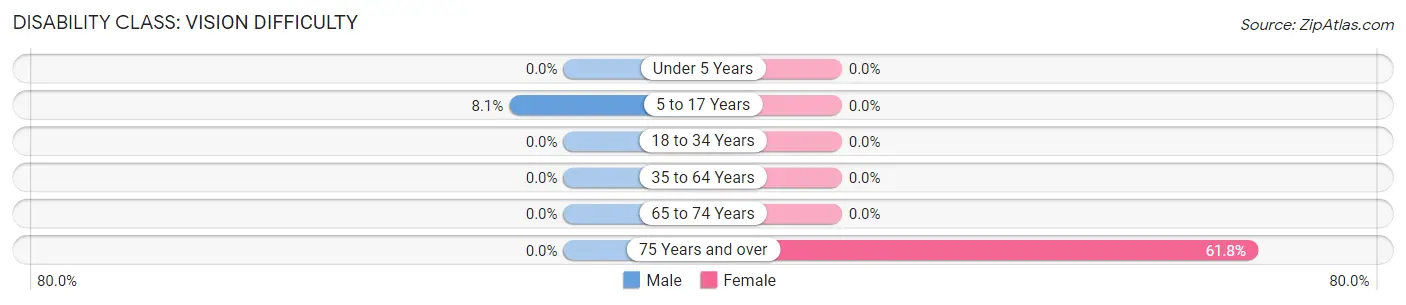
| Age Bracket | Male | Female |
| Under 5 Years | 0 (0.0%) | 0 (0.0%) |
| 5 to 17 Years | 7 (8.1%) | 0 (0.0%) |
| 18 to 34 Years | 0 (0.0%) | 0 (0.0%) |
| 35 to 64 Years | 0 (0.0%) | 0 (0.0%) |
| 65 to 74 Years | 0 (0.0%) | 0 (0.0%) |
| 75 Years and over | 0 (0.0%) | 21 (61.8%) |
Disability Class: Cognitive Difficulty
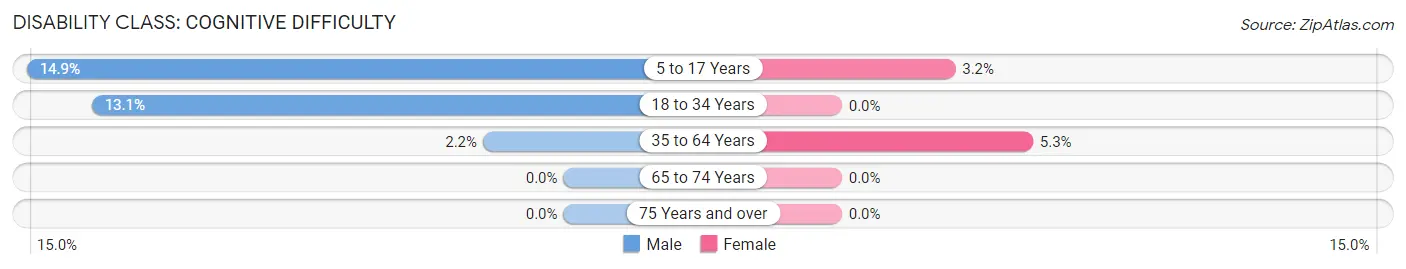
| Age Bracket | Male | Female |
| 5 to 17 Years | 13 (14.9%) | 6 (3.2%) |
| 18 to 34 Years | 13 (13.1%) | 0 (0.0%) |
| 35 to 64 Years | 7 (2.2%) | 14 (5.3%) |
| 65 to 74 Years | 0 (0.0%) | 0 (0.0%) |
| 75 Years and over | 0 (0.0%) | 0 (0.0%) |
Disability Class: Ambulatory Difficulty
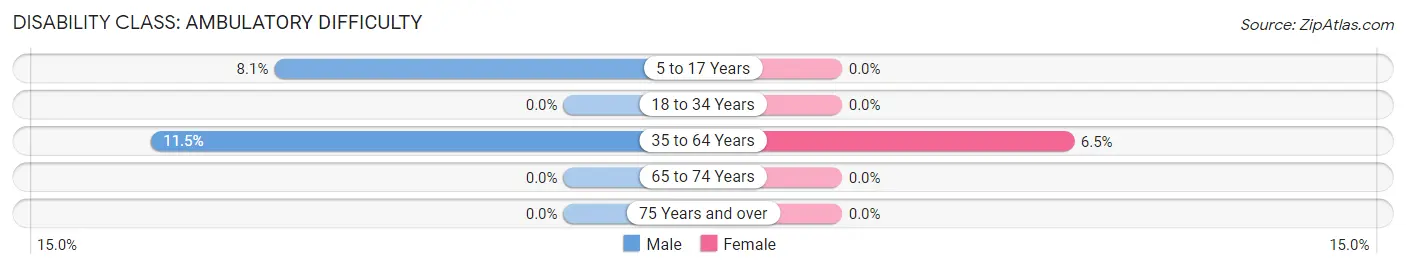
| Age Bracket | Male | Female |
| 5 to 17 Years | 7 (8.1%) | 0 (0.0%) |
| 18 to 34 Years | 0 (0.0%) | 0 (0.0%) |
| 35 to 64 Years | 36 (11.5%) | 17 (6.5%) |
| 65 to 74 Years | 0 (0.0%) | 0 (0.0%) |
| 75 Years and over | 0 (0.0%) | 0 (0.0%) |
Disability Class: Self-Care Difficulty
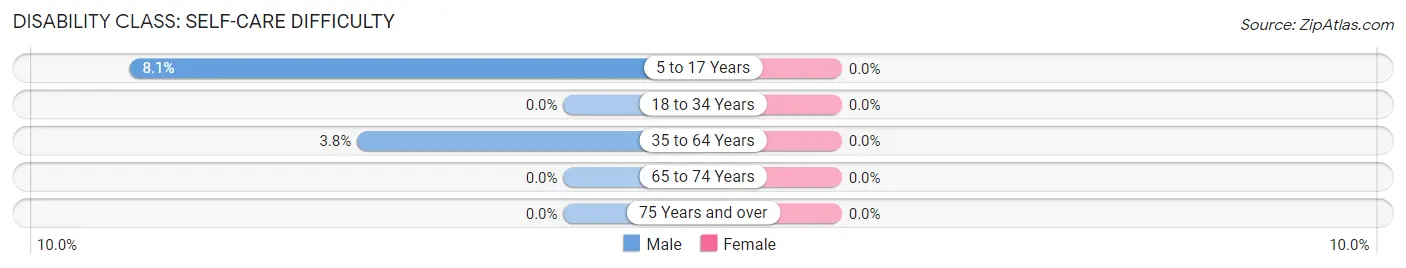
| Age Bracket | Male | Female |
| 5 to 17 Years | 7 (8.1%) | 0 (0.0%) |
| 18 to 34 Years | 0 (0.0%) | 0 (0.0%) |
| 35 to 64 Years | 12 (3.8%) | 0 (0.0%) |
| 65 to 74 Years | 0 (0.0%) | 0 (0.0%) |
| 75 Years and over | 0 (0.0%) | 0 (0.0%) |
Technology Access in Omega
Computing Device Access in Omega
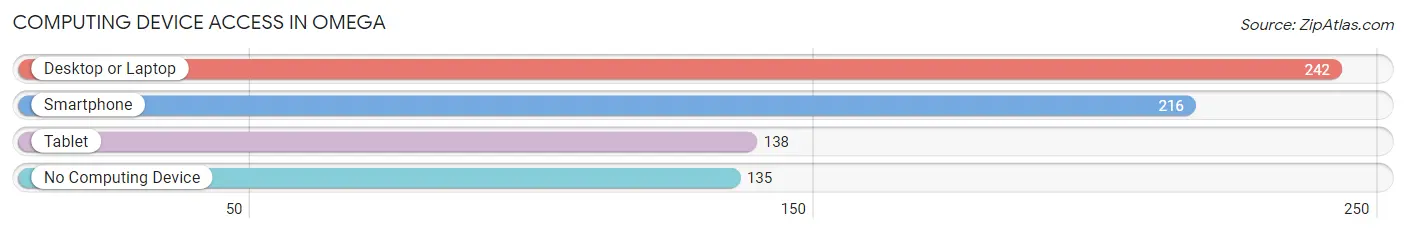
| Device Type | # Households | % Households |
| Desktop or Laptop | 242 | 57.9% |
| Smartphone | 216 | 51.7% |
| Tablet | 138 | 33.0% |
| No Computing Device | 135 | 32.3% |
| Total | 418 | 100.0% |
Internet Access in Omega
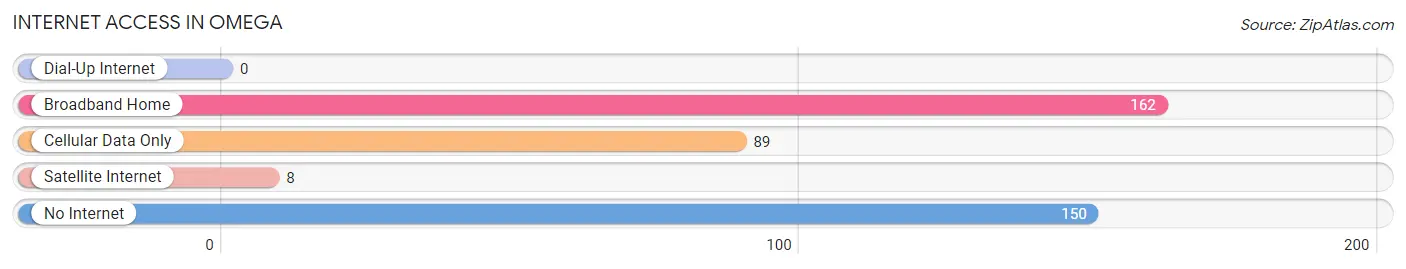
| Internet Type | # Households | % Households |
| Dial-Up Internet | 0 | 0.0% |
| Broadband Home | 162 | 38.8% |
| Cellular Data Only | 89 | 21.3% |
| Satellite Internet | 8 | 1.9% |
| No Internet | 150 | 35.9% |
| Total | 418 | 100.0% |
Omega Summary
Omega is a city located in the state of Georgia in the United States of America. It is the county seat of Dooly County and is located in the south-central part of the state. As of the 2010 census, the population of Omega was 2,845.
History
The area that is now Omega was first settled in the early 1800s by settlers from the Carolinas and Virginia. The town was originally known as "Dooly Court House" and was the county seat of Dooly County. In 1854, the town was renamed Omega after the Greek letter, which was chosen to represent the end of the county's troubles.
In the late 1800s, Omega was a thriving agricultural center, with cotton, corn, and peanuts being the main crops. The town also had a number of stores, churches, and a hotel.
In the early 1900s, Omega began to experience a decline in population as many of its citizens moved away to larger cities in search of better economic opportunities. The Great Depression of the 1930s further exacerbated the town's economic woes.
In the 1950s, Omega began to experience a resurgence in population and economic activity. The town was revitalized by the construction of a new courthouse and the opening of a new hospital. The town also experienced a boom in the manufacturing sector, with the opening of several new factories.
Geography
Omega is located in the south-central part of Georgia, in Dooly County. It is situated at the intersection of U.S. Route 41 and Georgia State Route 90. The city is located approximately 60 miles south of Macon and 90 miles north of Albany.
The city has a total area of 4.2 square miles, all of which is land. The city is located in a predominantly rural area, with the nearest large city being Macon, which is located approximately 60 miles to the north.
Economy
Omega's economy is largely based on agriculture and manufacturing. The city is home to several factories, including a paper mill, a furniture factory, and a plastics plant. The city also has a number of retail stores, restaurants, and other businesses.
The city is also home to a number of agricultural operations, including cotton, corn, and peanut farms. The city is also home to a number of poultry farms, which produce eggs and chicken for the local market.
Demographics
As of the 2010 census, the population of Omega was 2,845. The racial makeup of the city was 65.3% White, 30.2% African American, 0.3% Native American, 0.2% Asian, 0.1% Pacific Islander, 2.7% from other races, and 1.4% from two or more races. Hispanic or Latino of any race were 4.3% of the population.
The median income for a household in the city was $30,938, and the median income for a family was $37,917. The per capita income for the city was $15,945. About 18.2% of families and 22.2% of the population were below the poverty line, including 33.3% of those under age 18 and 16.2% of those age 65 or over.
Common Questions
What is Per Capita Income in Omega?
Per Capita income in Omega is $17,373.
What is the Median Family Income in Omega?
Median Family Income in Omega is $44,135.
What is the Median Household income in Omega?
Median Household Income in Omega is $43,269.
What is Income or Wage Gap in Omega?
Income or Wage Gap in Omega is 48.7%.
Women in Omega earn 51.3 cents for every dollar earned by a man.
What is Inequality or Gini Index in Omega?
Inequality or Gini Index in Omega is 0.38.
What is the Total Population of Omega?
Total Population of Omega is 1,302.
What is the Total Male Population of Omega?
Total Male Population of Omega is 600.
What is the Total Female Population of Omega?
Total Female Population of Omega is 702.
What is the Ratio of Males per 100 Females in Omega?
There are 85.47 Males per 100 Females in Omega.
What is the Ratio of Females per 100 Males in Omega?
There are 117.00 Females per 100 Males in Omega.
What is the Median Population Age in Omega?
Median Population Age in Omega is 37.0 Years.
What is the Average Family Size in Omega
Average Family Size in Omega is 3.6 People.
What is the Average Household Size in Omega
Average Household Size in Omega is 3.1 People.
How Large is the Labor Force in Omega?
There are 560 People in the Labor Forcein in Omega.
What is the Percentage of People in the Labor Force in Omega?
59.1% of People are in the Labor Force in Omega.
What is the Unemployment Rate in Omega?
Unemployment Rate in Omega is 2.9%.