Ray City, GA Map & Demographics
Ray City Map
Ray City Overview
$19,342
PER CAPITA INCOME
$50,714
AVG FAMILY INCOME
$46,875
AVG HOUSEHOLD INCOME
4.7%
WAGE / INCOME GAP [ % ]
95.3¢/ $1
WAGE / INCOME GAP [ $ ]
0.37
INEQUALITY / GINI INDEX
1,043
TOTAL POPULATION
533
MALE POPULATION
510
FEMALE POPULATION
104.51
MALES / 100 FEMALES
95.68
FEMALES / 100 MALES
24.8
MEDIAN AGE
3.8
AVG FAMILY SIZE
3.2
AVG HOUSEHOLD SIZE
430
LABOR FORCE [ PEOPLE ]
61.7%
PERCENT IN LABOR FORCE
10.4%
UNEMPLOYMENT RATE
Ray City Zip Codes
Ray City Area Codes
Income in Ray City
Income Overview in Ray City
Per Capita Income in Ray City is $19,342, while median incomes of families and households are $50,714 and $46,875 respectively.
| Characteristic | Number | Measure |
| Per Capita Income | 1,043 | $19,342 |
| Median Family Income | 230 | $50,714 |
| Mean Family Income | 230 | $61,523 |
| Median Household Income | 327 | $46,875 |
| Mean Household Income | 327 | $55,097 |
| Income Deficit | 230 | $0 |
| Wage / Income Gap (%) | 1,043 | 4.74% |
| Wage / Income Gap ($) | 1,043 | 95.26¢ per $1 |
| Gini / Inequality Index | 1,043 | 0.37 |
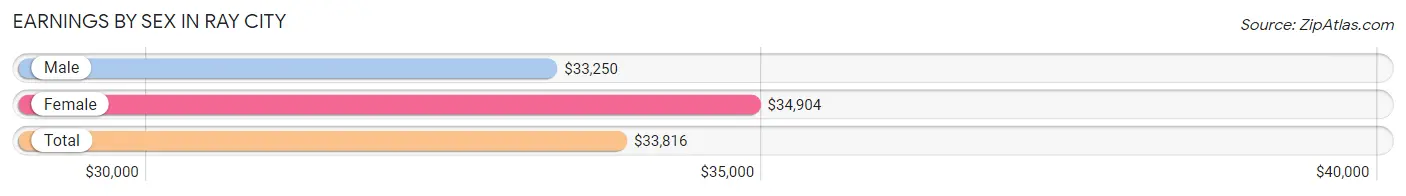
Earnings by Sex in Ray City
Average Earnings in Ray City are $33,816, $33,250 for men and $34,904 for women, a difference of 4.7%.
| Sex | Number | Average Earnings |
| Male | 187 (44.3%) | $33,250 |
| Female | 235 (55.7%) | $34,904 |
| Total | 422 (100.0%) | $33,816 |
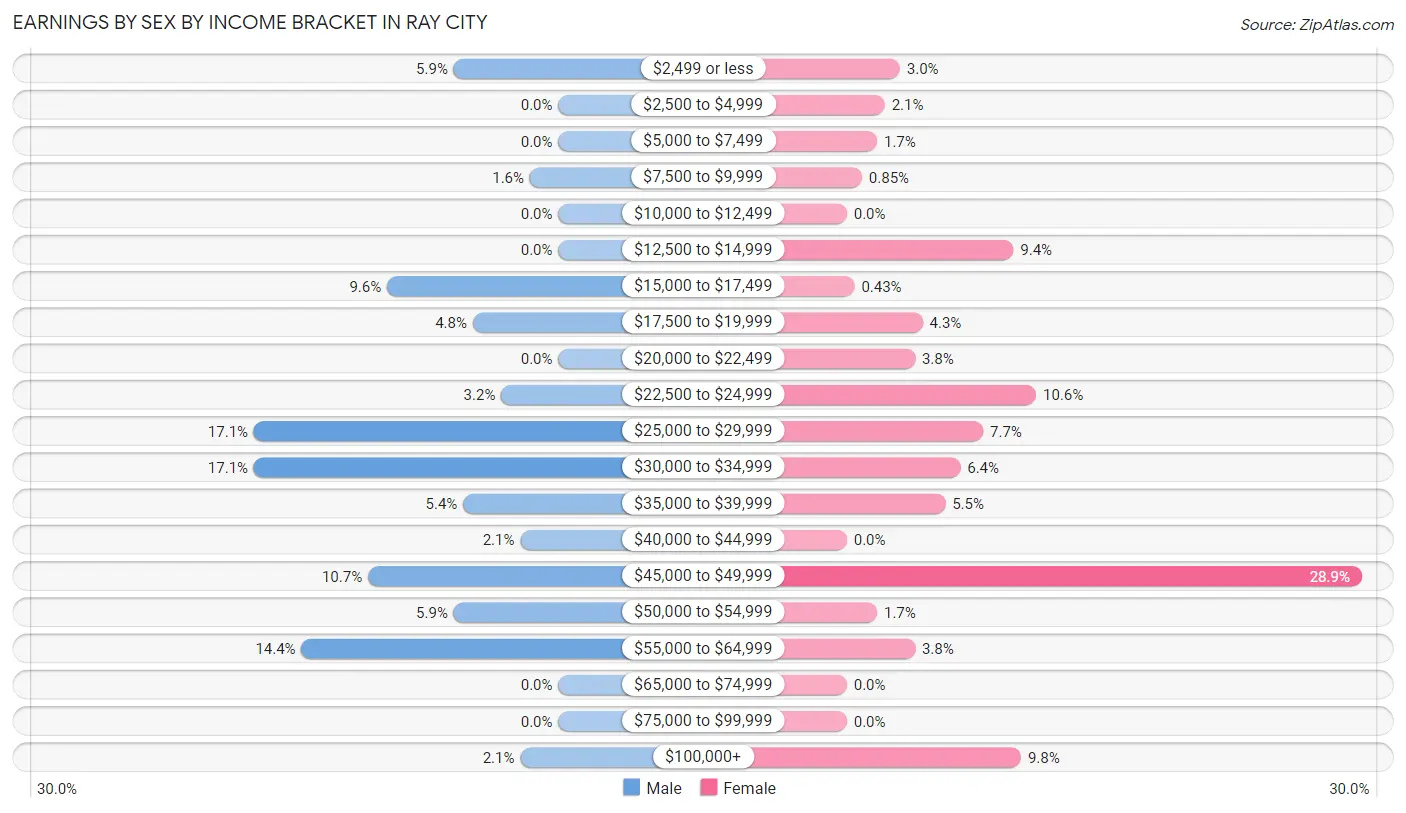
Earnings by Sex by Income Bracket in Ray City
The most common earnings brackets in Ray City are $25,000 to $29,999 for men (32 | 17.1%) and $45,000 to $49,999 for women (68 | 28.9%).
| Income | Male | Female |
| $2,499 or less | 11 (5.9%) | 7 (3.0%) |
| $2,500 to $4,999 | 0 (0.0%) | 5 (2.1%) |
| $5,000 to $7,499 | 0 (0.0%) | 4 (1.7%) |
| $7,500 to $9,999 | 3 (1.6%) | 2 (0.9%) |
| $10,000 to $12,499 | 0 (0.0%) | 0 (0.0%) |
| $12,500 to $14,999 | 0 (0.0%) | 22 (9.4%) |
| $15,000 to $17,499 | 18 (9.6%) | 1 (0.4%) |
| $17,500 to $19,999 | 9 (4.8%) | 10 (4.3%) |
| $20,000 to $22,499 | 0 (0.0%) | 9 (3.8%) |
| $22,500 to $24,999 | 6 (3.2%) | 25 (10.6%) |
| $25,000 to $29,999 | 32 (17.1%) | 18 (7.7%) |
| $30,000 to $34,999 | 32 (17.1%) | 15 (6.4%) |
| $35,000 to $39,999 | 10 (5.3%) | 13 (5.5%) |
| $40,000 to $44,999 | 4 (2.1%) | 0 (0.0%) |
| $45,000 to $49,999 | 20 (10.7%) | 68 (28.9%) |
| $50,000 to $54,999 | 11 (5.9%) | 4 (1.7%) |
| $55,000 to $64,999 | 27 (14.4%) | 9 (3.8%) |
| $65,000 to $74,999 | 0 (0.0%) | 0 (0.0%) |
| $75,000 to $99,999 | 0 (0.0%) | 0 (0.0%) |
| $100,000+ | 4 (2.1%) | 23 (9.8%) |
| Total | 187 (100.0%) | 235 (100.0%) |
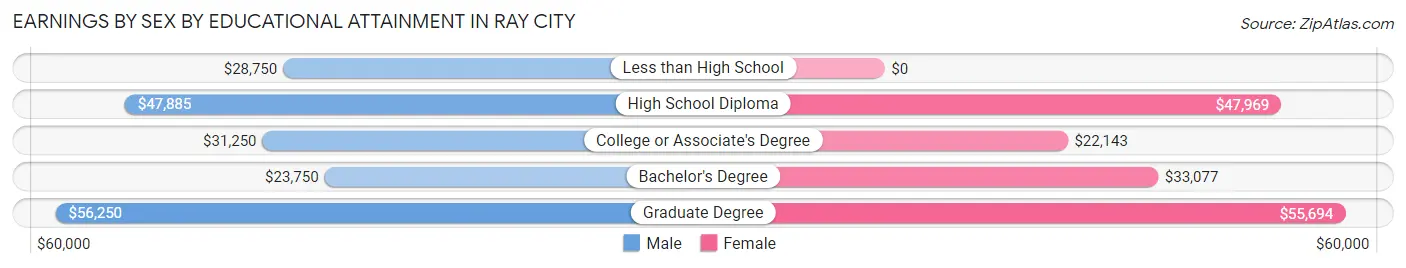
Earnings by Sex by Educational Attainment in Ray City
Average earnings in Ray City are $34,100 for men and $36,250 for women, a difference of 5.9%. Men with an educational attainment of graduate degree enjoy the highest average annual earnings of $56,250, while those with bachelor's degree education earn the least with $23,750. Women with an educational attainment of graduate degree earn the most with the average annual earnings of $55,694, while those with college or associate's degree education have the smallest earnings of $22,143.
| Educational Attainment | Male Income | Female Income |
| Less than High School | $28,750 | $0 |
| High School Diploma | $47,885 | $47,969 |
| College or Associate's Degree | $31,250 | $22,143 |
| Bachelor's Degree | $23,750 | $33,077 |
| Graduate Degree | $56,250 | $55,694 |
| Total | $34,100 | $36,250 |
Family Income in Ray City
Family Income Brackets in Ray City
According to the Ray City family income data, there are 60 families falling into the $75,000 to $99,999 income range, which is the most common income bracket and makes up 26.1% of all families.
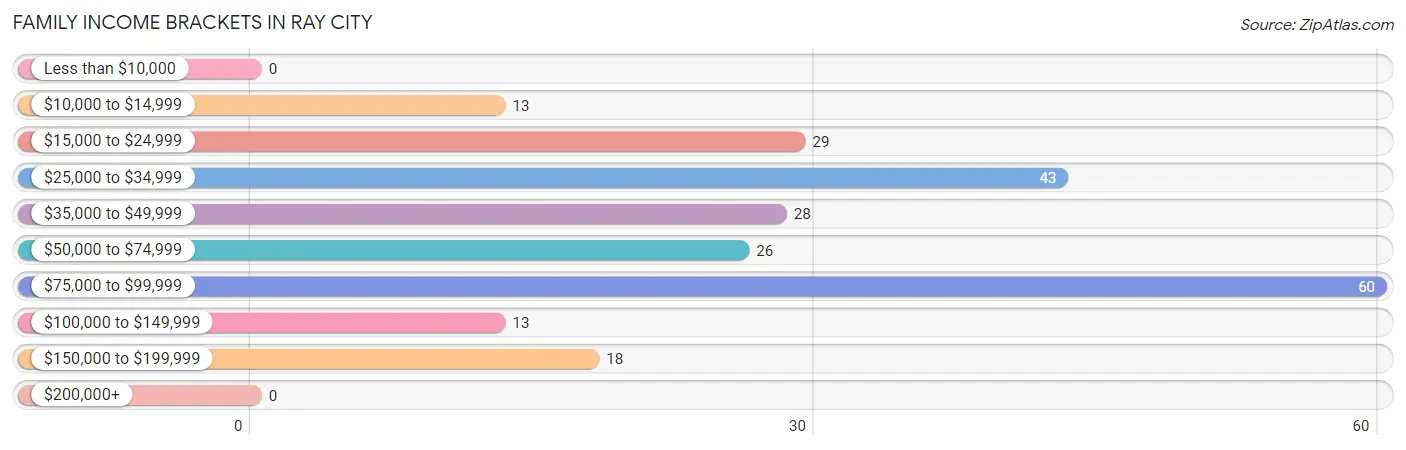
| Income Bracket | # Families | % Families |
| Less than $10,000 | 0 | 0.0% |
| $10,000 to $14,999 | 13 | 5.7% |
| $15,000 to $24,999 | 29 | 12.6% |
| $25,000 to $34,999 | 43 | 18.7% |
| $35,000 to $49,999 | 28 | 12.2% |
| $50,000 to $74,999 | 26 | 11.3% |
| $75,000 to $99,999 | 60 | 26.1% |
| $100,000 to $149,999 | 13 | 5.7% |
| $150,000 to $199,999 | 18 | 7.8% |
| $200,000+ | 0 | 0.0% |
Family Income by Famaliy Size in Ray City
3-person families (98 | 42.6%) account for the highest median family income in Ray City with $80,071 per family, while 3-person families (98 | 42.6%) have the highest median income of $26,690 per family member.
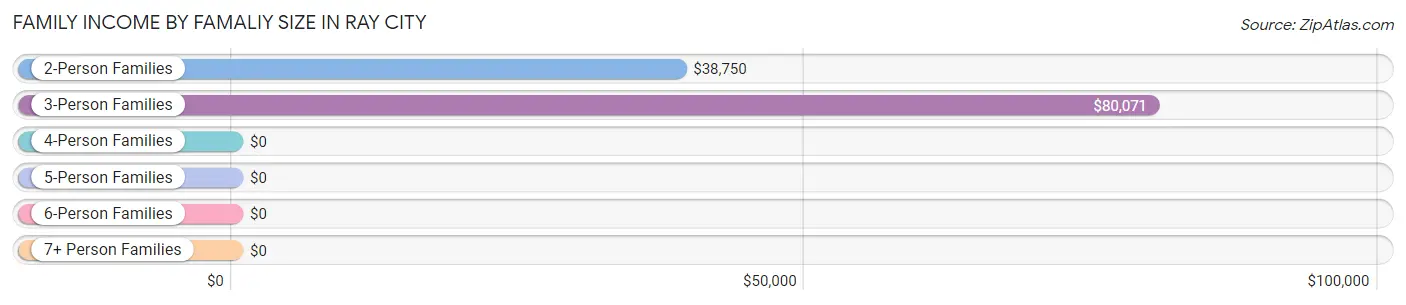
| Income Bracket | # Families | Median Income |
| 2-Person Families | 78 (33.9%) | $38,750 |
| 3-Person Families | 98 (42.6%) | $80,071 |
| 4-Person Families | 31 (13.5%) | $0 |
| 5-Person Families | 23 (10.0%) | $0 |
| 6-Person Families | 0 (0.0%) | $0 |
| 7+ Person Families | 0 (0.0%) | $0 |
| Total | 230 (100.0%) | $50,714 |
Family Income by Number of Earners in Ray City
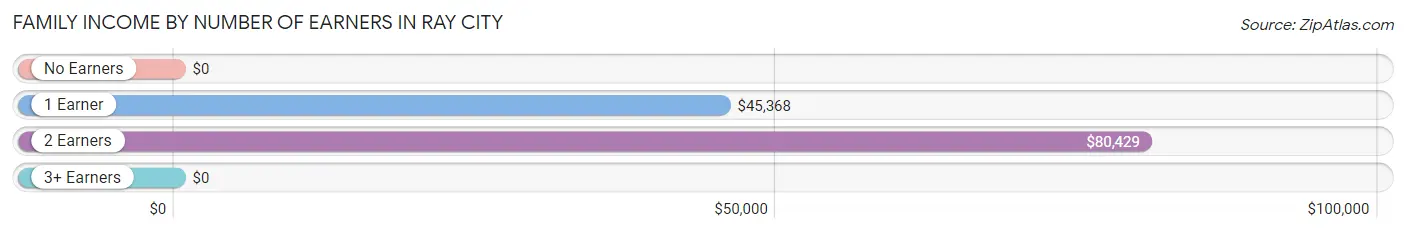
| Number of Earners | # Families | Median Income |
| No Earners | 21 (9.1%) | $0 |
| 1 Earner | 113 (49.1%) | $45,368 |
| 2 Earners | 86 (37.4%) | $80,429 |
| 3+ Earners | 10 (4.3%) | $0 |
| Total | 230 (100.0%) | $50,714 |
Household Income in Ray City
Household Income Brackets in Ray City
With 69 households falling in the category, the $75,000 to $99,999 income range is the most frequent in Ray City, accounting for 21.1% of all households.
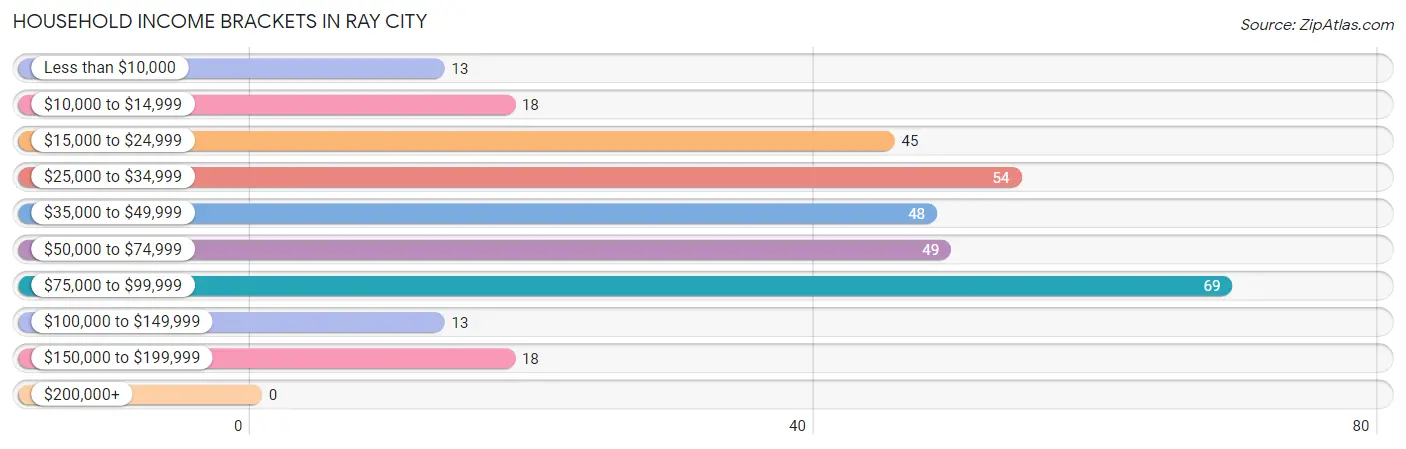
| Income Bracket | # Households | % Households |
| Less than $10,000 | 13 | 4.0% |
| $10,000 to $14,999 | 18 | 5.5% |
| $15,000 to $24,999 | 45 | 13.8% |
| $25,000 to $34,999 | 54 | 16.5% |
| $35,000 to $49,999 | 48 | 14.7% |
| $50,000 to $74,999 | 49 | 15.0% |
| $75,000 to $99,999 | 69 | 21.1% |
| $100,000 to $149,999 | 13 | 4.0% |
| $150,000 to $199,999 | 18 | 5.5% |
| $200,000+ | 0 | 0.0% |
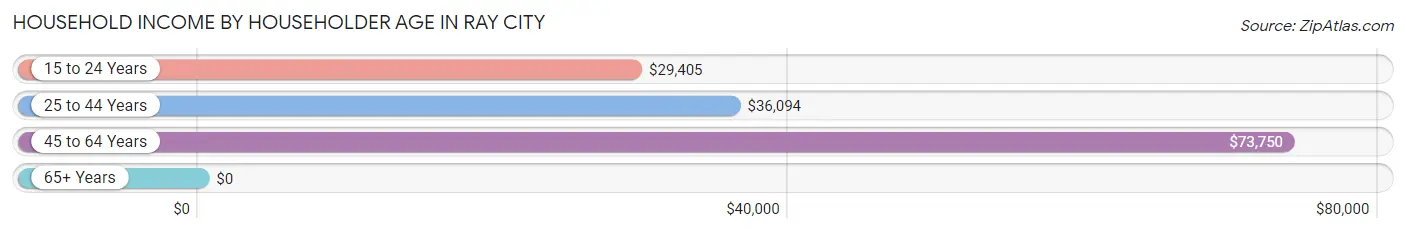
Household Income by Householder Age in Ray City
The median household income in Ray City is $46,875, with the highest median household income of $73,750 found in the 45 to 64 years age bracket for the primary householder. A total of 123 households (37.6%) fall into this category. Meanwhile, the 65+ years age bracket for the primary householder has the lowest median household income of $0, with 45 households (13.8%) in this group.
| Income Bracket | # Households | Median Income |
| 15 to 24 Years | 56 (17.1%) | $29,405 |
| 25 to 44 Years | 103 (31.5%) | $36,094 |
| 45 to 64 Years | 123 (37.6%) | $73,750 |
| 65+ Years | 45 (13.8%) | $0 |
| Total | 327 (100.0%) | $46,875 |
Poverty in Ray City
Income Below Poverty by Sex and Age in Ray City
With 17.9% poverty level for males and 21.3% for females among the residents of Ray City, 16 and 17 year old males and 6 to 11 year old females are the most vulnerable to poverty, with 22 males (100.0%) and 33 females (78.6%) in their respective age groups living below the poverty level.
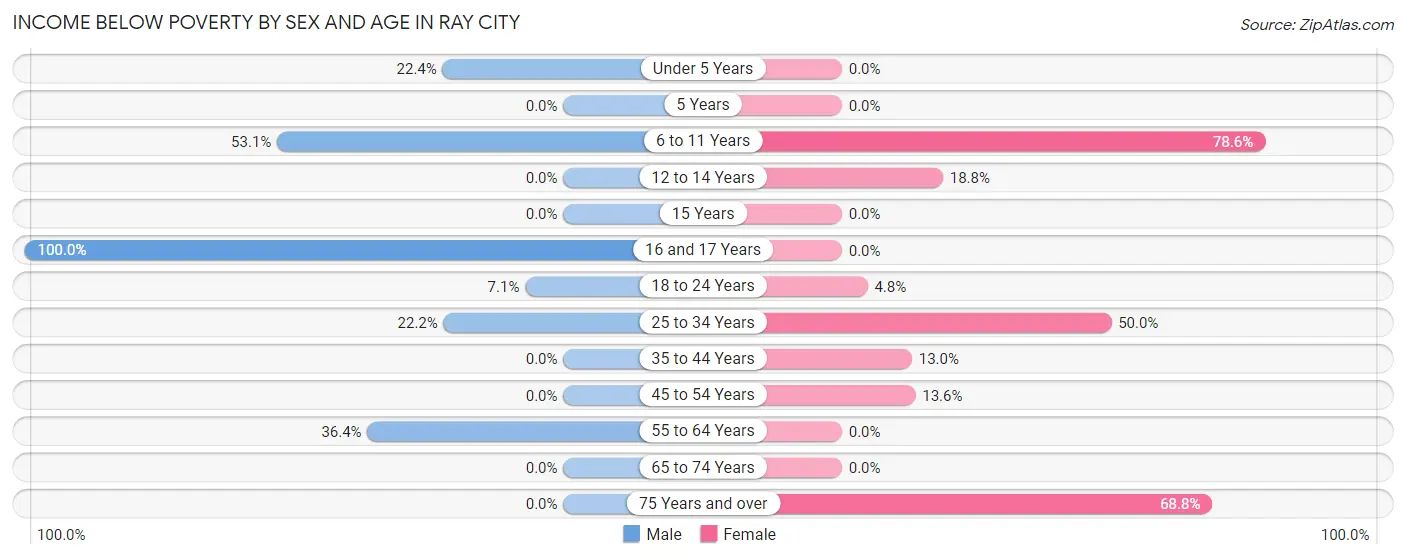
| Age Bracket | Male | Female |
| Under 5 Years | 13 (22.4%) | 0 (0.0%) |
| 5 Years | 0 (0.0%) | 0 (0.0%) |
| 6 to 11 Years | 17 (53.1%) | 33 (78.6%) |
| 12 to 14 Years | 0 (0.0%) | 6 (18.8%) |
| 15 Years | 0 (0.0%) | 0 (0.0%) |
| 16 and 17 Years | 22 (100.0%) | 0 (0.0%) |
| 18 to 24 Years | 7 (7.1%) | 3 (4.8%) |
| 25 to 34 Years | 14 (22.2%) | 31 (50.0%) |
| 35 to 44 Years | 0 (0.0%) | 10 (13.0%) |
| 45 to 54 Years | 0 (0.0%) | 12 (13.6%) |
| 55 to 64 Years | 16 (36.4%) | 0 (0.0%) |
| 65 to 74 Years | 0 (0.0%) | 0 (0.0%) |
| 75 Years and over | 0 (0.0%) | 11 (68.8%) |
| Total | 89 (17.9%) | 106 (21.3%) |
Income Above Poverty by Sex and Age in Ray City
According to the poverty statistics in Ray City, males aged 12 to 14 years and females aged under 5 years are the age groups that are most secure financially, with 100.0% of males and 100.0% of females in these age groups living above the poverty line.
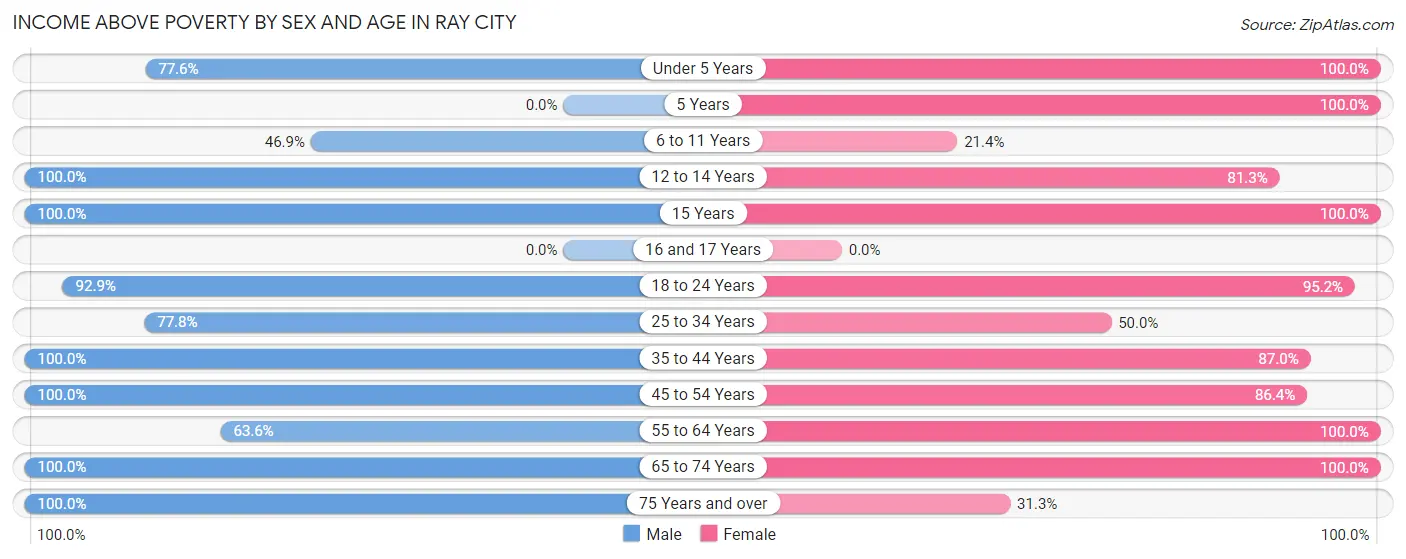
| Age Bracket | Male | Female |
| Under 5 Years | 45 (77.6%) | 27 (100.0%) |
| 5 Years | 0 (0.0%) | 27 (100.0%) |
| 6 to 11 Years | 15 (46.9%) | 9 (21.4%) |
| 12 to 14 Years | 5 (100.0%) | 26 (81.2%) |
| 15 Years | 54 (100.0%) | 20 (100.0%) |
| 16 and 17 Years | 0 (0.0%) | 0 (0.0%) |
| 18 to 24 Years | 92 (92.9%) | 60 (95.2%) |
| 25 to 34 Years | 49 (77.8%) | 31 (50.0%) |
| 35 to 44 Years | 24 (100.0%) | 67 (87.0%) |
| 45 to 54 Years | 53 (100.0%) | 76 (86.4%) |
| 55 to 64 Years | 28 (63.6%) | 26 (100.0%) |
| 65 to 74 Years | 34 (100.0%) | 18 (100.0%) |
| 75 Years and over | 8 (100.0%) | 5 (31.2%) |
| Total | 407 (82.1%) | 392 (78.7%) |
Income Below Poverty Among Married-Couple Families in Ray City
The poverty statistics for married-couple families in Ray City show that 15.4% or 24 of the total 156 families live below the poverty line. Families with 3 or 4 children have the highest poverty rate of 70.6%, comprising of 12 families. On the other hand, families with 1 or 2 children have the lowest poverty rate of 6.4%, which includes 3 families.
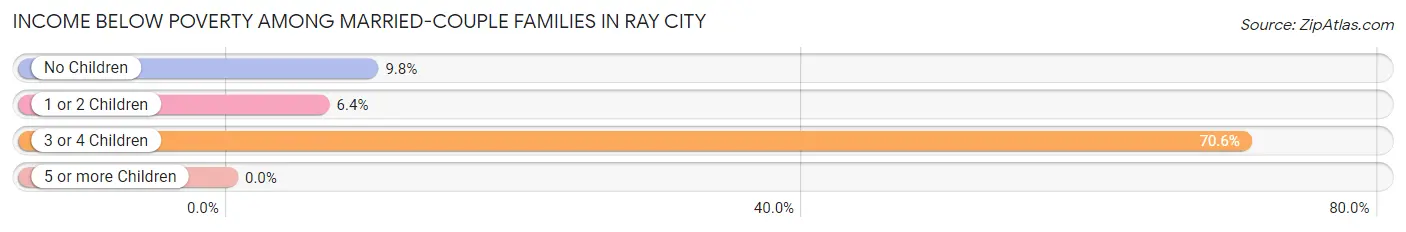
| Children | Above Poverty | Below Poverty |
| No Children | 83 (90.2%) | 9 (9.8%) |
| 1 or 2 Children | 44 (93.6%) | 3 (6.4%) |
| 3 or 4 Children | 5 (29.4%) | 12 (70.6%) |
| 5 or more Children | 0 (0.0%) | 0 (0.0%) |
| Total | 132 (84.6%) | 24 (15.4%) |
Income Below Poverty Among Single-Parent Households in Ray City
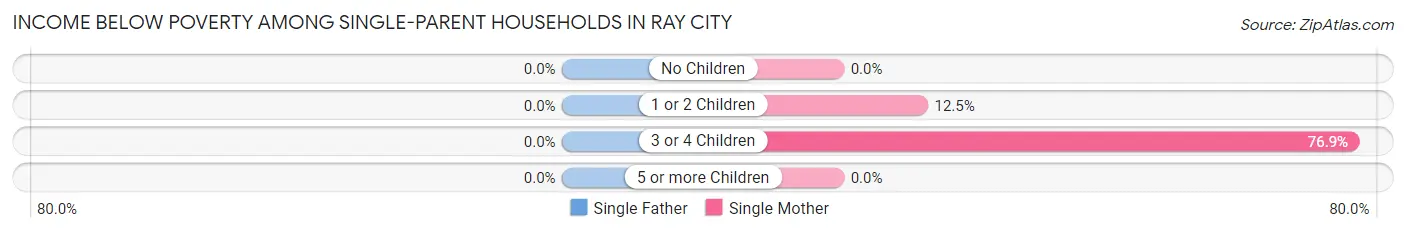
| Children | Single Father | Single Mother |
| No Children | 0 (0.0%) | 0 (0.0%) |
| 1 or 2 Children | 0 (0.0%) | 6 (12.5%) |
| 3 or 4 Children | 0 (0.0%) | 10 (76.9%) |
| 5 or more Children | 0 (0.0%) | 0 (0.0%) |
| Total | 0 (0.0%) | 16 (24.6%) |
Income Below Poverty Among Married-Couple vs Single-Parent Households in Ray City
The poverty data for Ray City shows that 24 of the married-couple family households (15.4%) and 16 of the single-parent households (21.6%) are living below the poverty level. Within the married-couple family households, those with 3 or 4 children have the highest poverty rate, with 12 households (70.6%) falling below the poverty line. Among the single-parent households, those with 3 or 4 children have the highest poverty rate, with 10 household (76.9%) living below poverty.
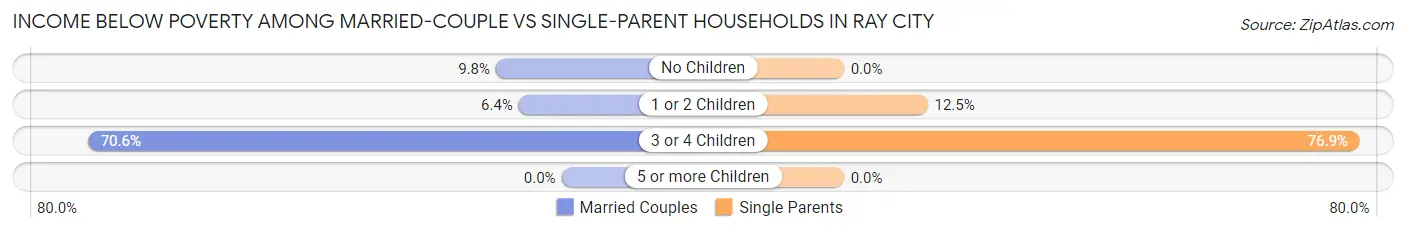
| Children | Married-Couple Families | Single-Parent Households |
| No Children | 9 (9.8%) | 0 (0.0%) |
| 1 or 2 Children | 3 (6.4%) | 6 (12.5%) |
| 3 or 4 Children | 12 (70.6%) | 10 (76.9%) |
| 5 or more Children | 0 (0.0%) | 0 (0.0%) |
| Total | 24 (15.4%) | 16 (21.6%) |
Race in Ray City
The most populous races in Ray City are White / Caucasian (649 | 62.2%), Black / African American (270 | 25.9%), and Hispanic or Latino (164 | 15.7%).
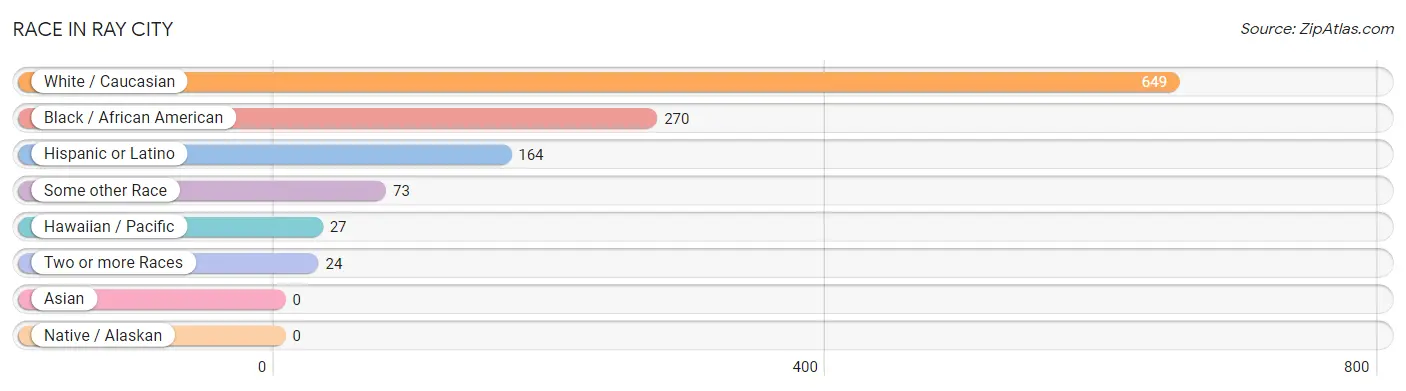
| Race | # Population | % Population |
| Asian | 0 | 0.0% |
| Black / African American | 270 | 25.9% |
| Hawaiian / Pacific | 27 | 2.6% |
| Hispanic or Latino | 164 | 15.7% |
| Native / Alaskan | 0 | 0.0% |
| White / Caucasian | 649 | 62.2% |
| Two or more Races | 24 | 2.3% |
| Some other Race | 73 | 7.0% |
| Total | 1,043 | 100.0% |
Ancestry in Ray City
The most populous ancestries reported in Ray City are Mexican (105 | 10.1%), American (73 | 7.0%), German (46 | 4.4%), Spanish (32 | 3.1%), and English (27 | 2.6%), together accounting for 27.1% of all Ray City residents.
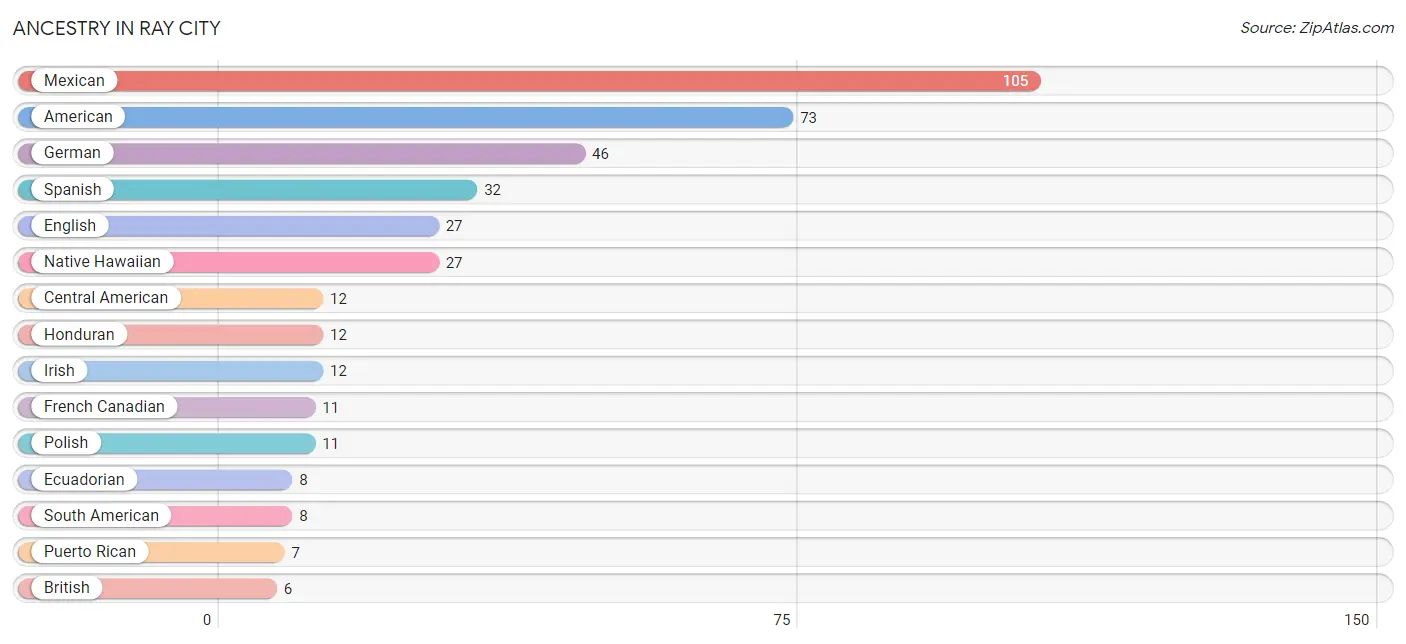
| Ancestry | # Population | % Population |
| American | 73 | 7.0% |
| British | 6 | 0.6% |
| Central American | 12 | 1.1% |
| Cherokee | 3 | 0.3% |
| Czech | 2 | 0.2% |
| Dutch | 2 | 0.2% |
| Ecuadorian | 8 | 0.8% |
| English | 27 | 2.6% |
| French Canadian | 11 | 1.1% |
| German | 46 | 4.4% |
| Honduran | 12 | 1.1% |
| Irish | 12 | 1.1% |
| Mexican | 105 | 10.1% |
| Native Hawaiian | 27 | 2.6% |
| Norwegian | 6 | 0.6% |
| Polish | 11 | 1.1% |
| Puerto Rican | 7 | 0.7% |
| Scotch-Irish | 6 | 0.6% |
| Scottish | 2 | 0.2% |
| Sioux | 4 | 0.4% |
| South American | 8 | 0.8% |
| Spanish | 32 | 3.1% |
| Swedish | 1 | 0.1% | View All 23 Rows |
Immigrants in Ray City
The most numerous immigrant groups reported in Ray City came from Latin America (27 | 2.6%), Central America (19 | 1.8%), Honduras (19 | 1.8%), Ecuador (8 | 0.8%), and South America (8 | 0.8%), together accounting for 7.8% of all Ray City residents.
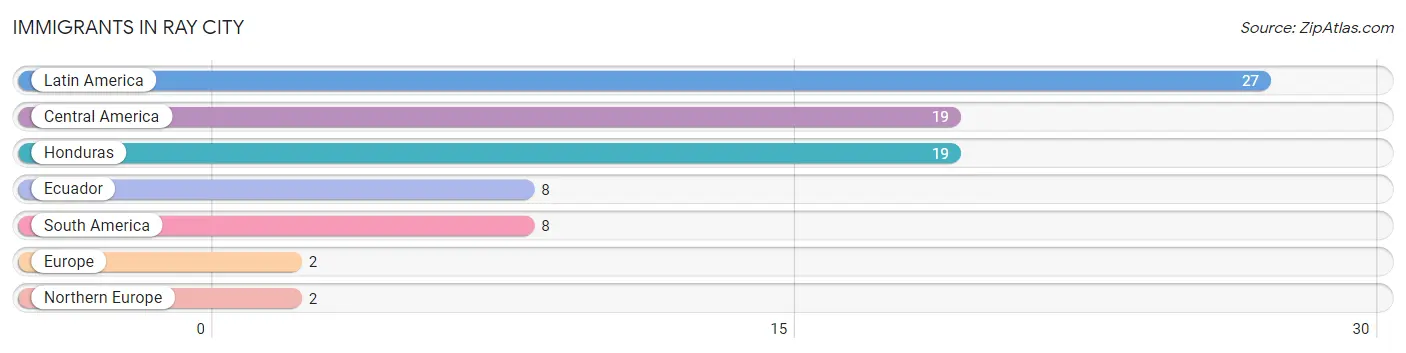
| Immigration Origin | # Population | % Population |
| Central America | 19 | 1.8% |
| Ecuador | 8 | 0.8% |
| Europe | 2 | 0.2% |
| Honduras | 19 | 1.8% |
| Latin America | 27 | 2.6% |
| Northern Europe | 2 | 0.2% |
| South America | 8 | 0.8% | View All 7 Rows |
Sex and Age in Ray City
Sex and Age in Ray City
The most populous age groups in Ray City are 15 to 19 Years (132 | 24.8%) for men and 5 to 9 Years (77 | 15.1%) for women.
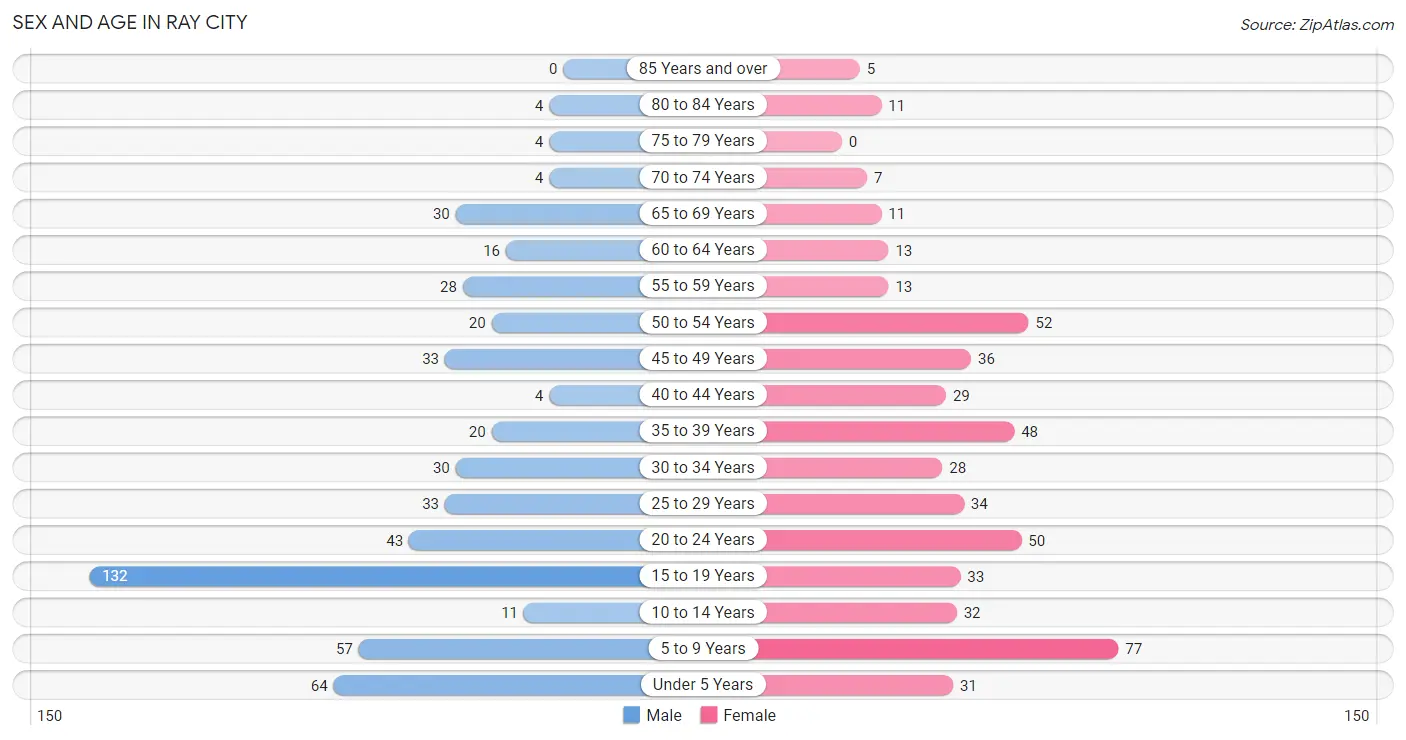
| Age Bracket | Male | Female |
| Under 5 Years | 64 (12.0%) | 31 (6.1%) |
| 5 to 9 Years | 57 (10.7%) | 77 (15.1%) |
| 10 to 14 Years | 11 (2.1%) | 32 (6.3%) |
| 15 to 19 Years | 132 (24.8%) | 33 (6.5%) |
| 20 to 24 Years | 43 (8.1%) | 50 (9.8%) |
| 25 to 29 Years | 33 (6.2%) | 34 (6.7%) |
| 30 to 34 Years | 30 (5.6%) | 28 (5.5%) |
| 35 to 39 Years | 20 (3.7%) | 48 (9.4%) |
| 40 to 44 Years | 4 (0.7%) | 29 (5.7%) |
| 45 to 49 Years | 33 (6.2%) | 36 (7.1%) |
| 50 to 54 Years | 20 (3.7%) | 52 (10.2%) |
| 55 to 59 Years | 28 (5.2%) | 13 (2.5%) |
| 60 to 64 Years | 16 (3.0%) | 13 (2.5%) |
| 65 to 69 Years | 30 (5.6%) | 11 (2.2%) |
| 70 to 74 Years | 4 (0.7%) | 7 (1.4%) |
| 75 to 79 Years | 4 (0.7%) | 0 (0.0%) |
| 80 to 84 Years | 4 (0.7%) | 11 (2.2%) |
| 85 Years and over | 0 (0.0%) | 5 (1.0%) |
| Total | 533 (100.0%) | 510 (100.0%) |
Families and Households in Ray City
Median Family Size in Ray City
The median family size in Ray City is 3.79 persons per family, with single female/mother families (65 | 28.3%) accounting for the largest median family size of 5.28 persons per family. On the other hand, single male/father families (9 | 3.9%) represent the smallest median family size with 2.89 persons per family.
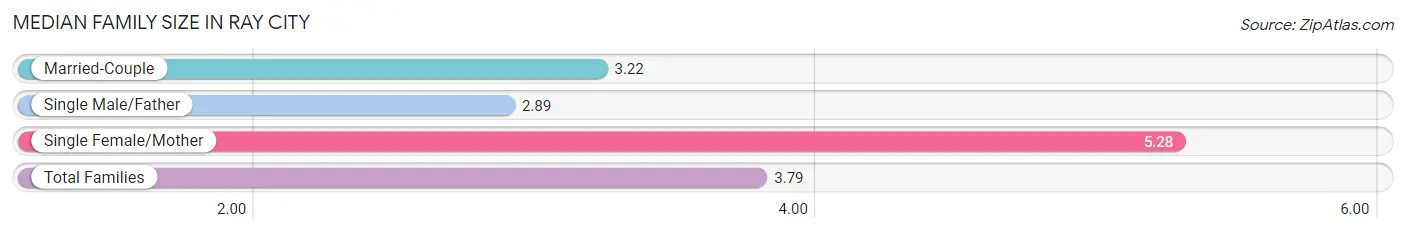
| Family Type | # Families | Family Size |
| Married-Couple | 156 (67.8%) | 3.22 |
| Single Male/Father | 9 (3.9%) | 2.89 |
| Single Female/Mother | 65 (28.3%) | 5.28 |
| Total Families | 230 (100.0%) | 3.79 |
Median Household Size in Ray City
The median household size in Ray City is 3.19 persons per household, with single female/mother households (65 | 19.9%) accounting for the largest median household size of 5.4 persons per household. non-family households (97 | 29.7%) represent the smallest median household size with 1.53 persons per household.
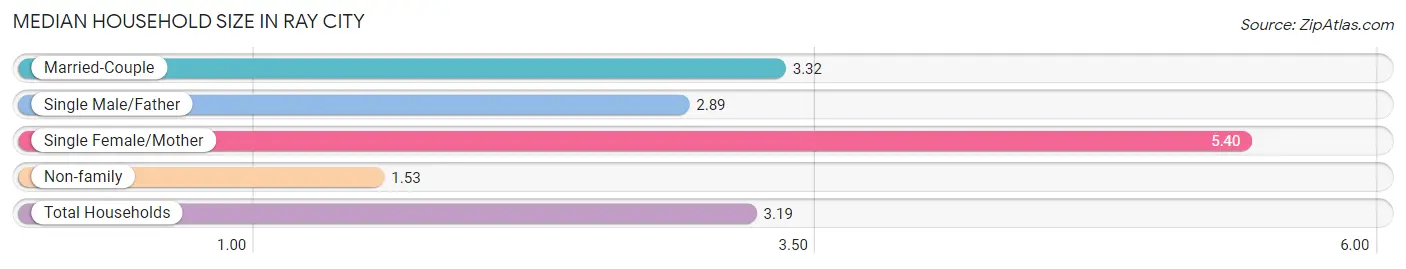
| Household Type | # Households | Household Size |
| Married-Couple | 156 (47.7%) | 3.32 |
| Single Male/Father | 9 (2.8%) | 2.89 |
| Single Female/Mother | 65 (19.9%) | 5.40 |
| Non-family | 97 (29.7%) | 1.53 |
| Total Households | 327 (100.0%) | 3.19 |
Household Size by Marriage Status in Ray City
Out of a total of 327 households in Ray City, 230 (70.3%) are family households, while 97 (29.7%) are nonfamily households. The most numerous type of family households are 2-person households, comprising 78, and the most common type of nonfamily households are 1-person households, comprising 77.
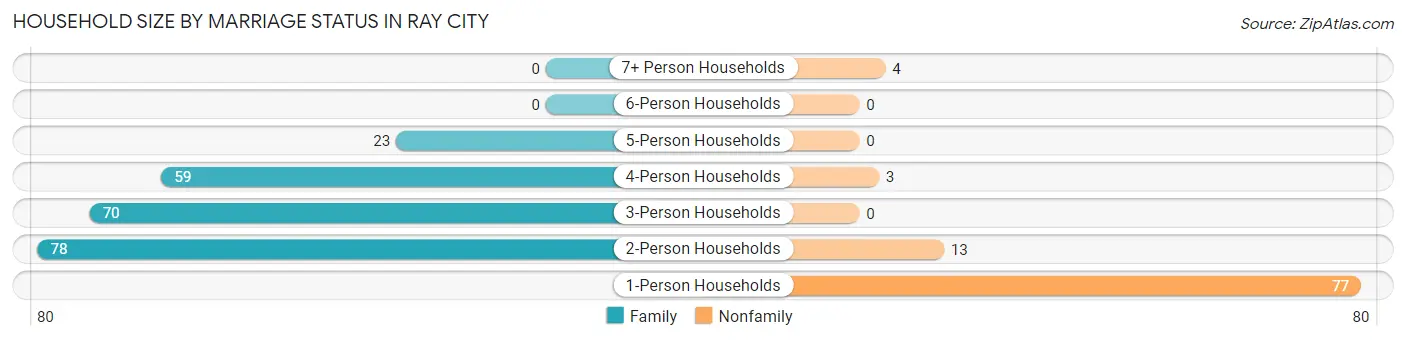
| Household Size | Family Households | Nonfamily Households |
| 1-Person Households | - | 77 (23.5%) |
| 2-Person Households | 78 (23.8%) | 13 (4.0%) |
| 3-Person Households | 70 (21.4%) | 0 (0.0%) |
| 4-Person Households | 59 (18.0%) | 3 (0.9%) |
| 5-Person Households | 23 (7.0%) | 0 (0.0%) |
| 6-Person Households | 0 (0.0%) | 0 (0.0%) |
| 7+ Person Households | 0 (0.0%) | 4 (1.2%) |
| Total | 230 (70.3%) | 97 (29.7%) |
Female Fertility in Ray City
Fertility by Age in Ray City
Average fertility rate in Ray City is 37.0 births per 1,000 women. Women in the age bracket of 20 to 34 years have the highest fertility rate with 89.0 births per 1,000 women. Women in the age bracket of 20 to 34 years acount for 100.0% of all women with births.
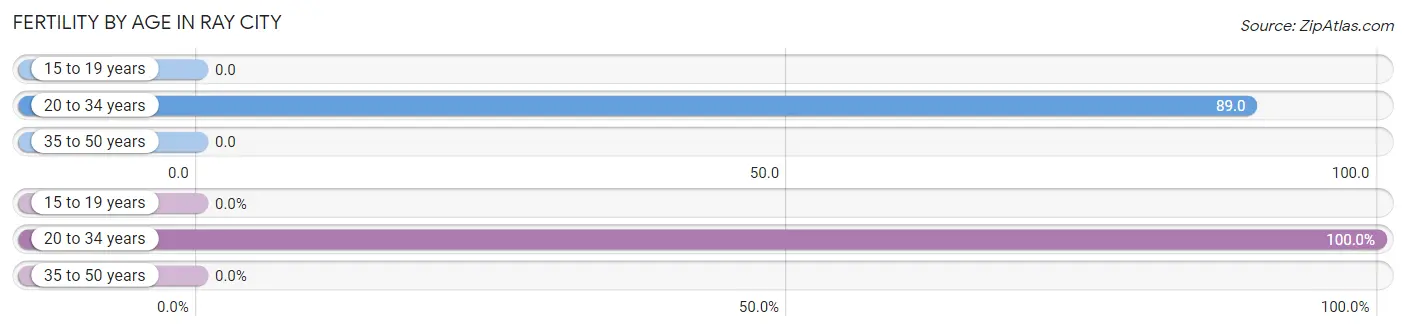
| Age Bracket | Women with Births | Births / 1,000 Women |
| 15 to 19 years | 0 (0.0%) | 0.0 |
| 20 to 34 years | 10 (100.0%) | 89.0 |
| 35 to 50 years | 0 (0.0%) | 0.0 |
| Total | 10 (100.0%) | 37.0 |
Fertility by Age by Marriage Status in Ray City
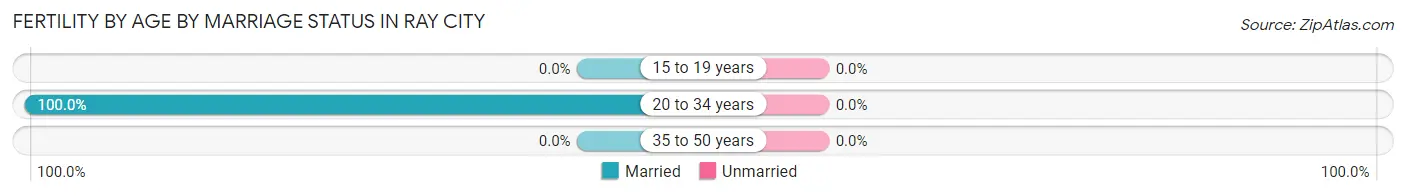
| Age Bracket | Married | Unmarried |
| 15 to 19 years | 0 (0.0%) | 0 (0.0%) |
| 20 to 34 years | 10 (100.0%) | 0 (0.0%) |
| 35 to 50 years | 0 (0.0%) | 0 (0.0%) |
| Total | 10 (100.0%) | 0 (0.0%) |
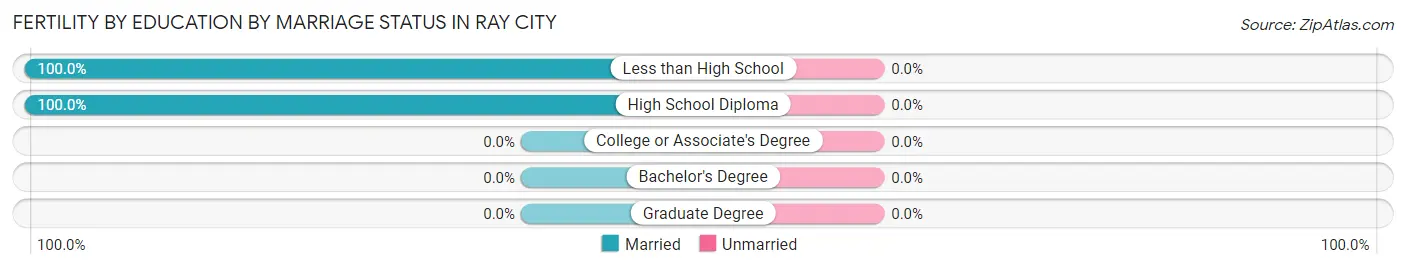
Fertility by Education in Ray City
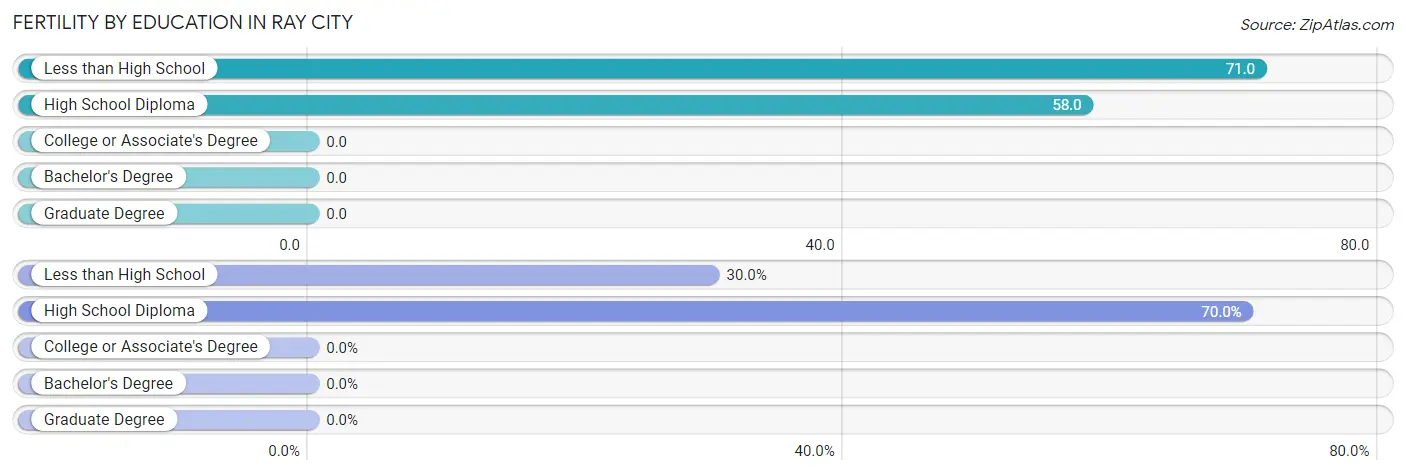
| Educational Attainment | Women with Births | Births / 1,000 Women |
| Less than High School | 3 (30.0%) | 71.0 |
| High School Diploma | 7 (70.0%) | 58.0 |
| College or Associate's Degree | 0 (0.0%) | 0.0 |
| Bachelor's Degree | 0 (0.0%) | 0.0 |
| Graduate Degree | 0 (0.0%) | 0.0 |
| Total | 10 (100.0%) | 37.0 |
Fertility by Education by Marriage Status in Ray City
| Educational Attainment | Married | Unmarried |
| Less than High School | 3 (100.0%) | 0 (0.0%) |
| High School Diploma | 7 (100.0%) | 0 (0.0%) |
| College or Associate's Degree | 0 (0.0%) | 0 (0.0%) |
| Bachelor's Degree | 0 (0.0%) | 0 (0.0%) |
| Graduate Degree | 0 (0.0%) | 0 (0.0%) |
| Total | 10 (100.0%) | 0 (0.0%) |
Employment Characteristics in Ray City
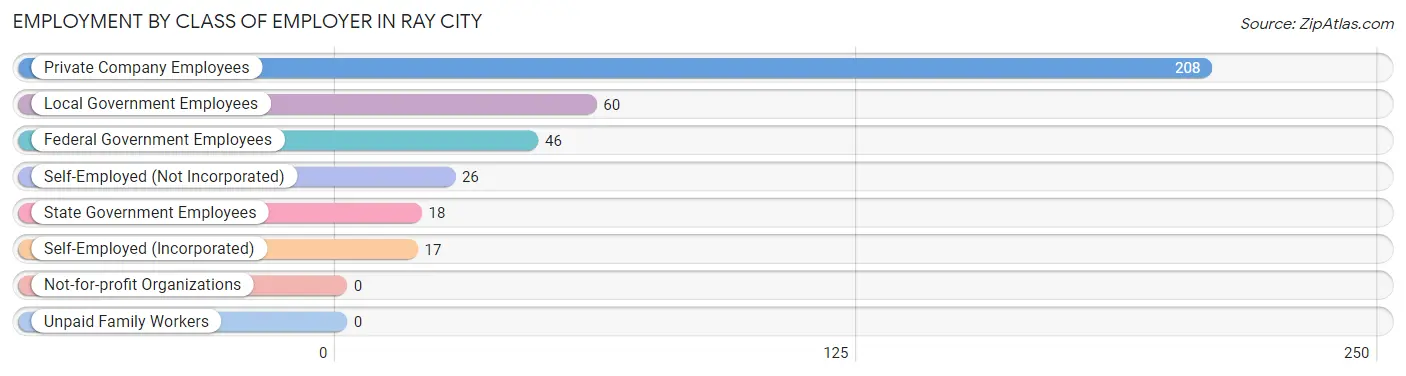
Employment by Class of Employer in Ray City
Among the 375 employed individuals in Ray City, private company employees (208 | 55.5%), local government employees (60 | 16.0%), and federal government employees (46 | 12.3%) make up the most common classes of employment.
| Employer Class | # Employees | % Employees |
| Private Company Employees | 208 | 55.5% |
| Self-Employed (Incorporated) | 17 | 4.5% |
| Self-Employed (Not Incorporated) | 26 | 6.9% |
| Not-for-profit Organizations | 0 | 0.0% |
| Local Government Employees | 60 | 16.0% |
| State Government Employees | 18 | 4.8% |
| Federal Government Employees | 46 | 12.3% |
| Unpaid Family Workers | 0 | 0.0% |
| Total | 375 | 100.0% |
Employment Status by Age in Ray City
According to the labor force statistics for Ray City, out of the total population over 16 years of age (697), 61.7% or 430 individuals are in the labor force, with 10.4% or 45 of them unemployed. The age group with the highest labor force participation rate is 35 to 44 years, with 100.0% or 101 individuals in the labor force. Within the labor force, the 30 to 34 years age range has the highest percentage of unemployed individuals, with 31.9% or 16 of them being unemployed.
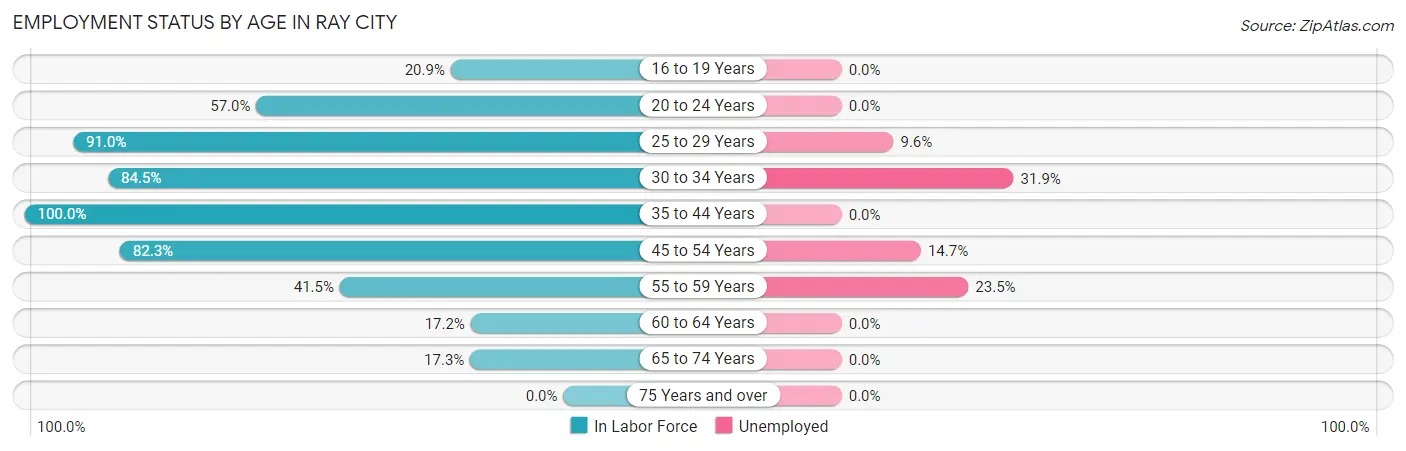
| Age Bracket | In Labor Force | Unemployed |
| 16 to 19 Years | 19 (20.9%) | 0 (0.0%) |
| 20 to 24 Years | 53 (57.0%) | 0 (0.0%) |
| 25 to 29 Years | 61 (91.0%) | 6 (9.6%) |
| 30 to 34 Years | 49 (84.5%) | 16 (31.9%) |
| 35 to 44 Years | 101 (100.0%) | 0 (0.0%) |
| 45 to 54 Years | 116 (82.3%) | 17 (14.7%) |
| 55 to 59 Years | 17 (41.5%) | 4 (23.5%) |
| 60 to 64 Years | 5 (17.2%) | 0 (0.0%) |
| 65 to 74 Years | 9 (17.3%) | 0 (0.0%) |
| 75 Years and over | 0 (0.0%) | 0 (0.0%) |
| Total | 430 (61.7%) | 45 (10.4%) |
Employment Status by Educational Attainment in Ray City
According to labor force statistics for Ray City, 79.9% of individuals (349) out of the total population between 25 and 64 years of age (437) are in the labor force, with 12.2% or 43 of them being unemployed. The group with the highest labor force participation rate are those with the educational attainment of less than high school, with 90.0% or 27 individuals in the labor force. Within the labor force, individuals with bachelor's degree or higher education have the highest percentage of unemployment, with 28.3% or 18 of them being unemployed.
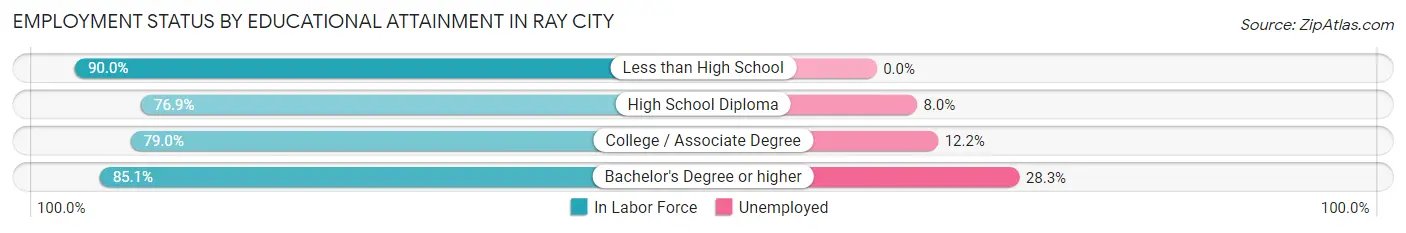
| Educational Attainment | In Labor Force | Unemployed |
| Less than High School | 27 (90.0%) | 0 (0.0%) |
| High School Diploma | 150 (76.9%) | 16 (8.0%) |
| College / Associate Degree | 109 (79.0%) | 17 (12.2%) |
| Bachelor's Degree or higher | 63 (85.1%) | 21 (28.3%) |
| Total | 349 (79.9%) | 53 (12.2%) |
Employment Occupations by Sex in Ray City
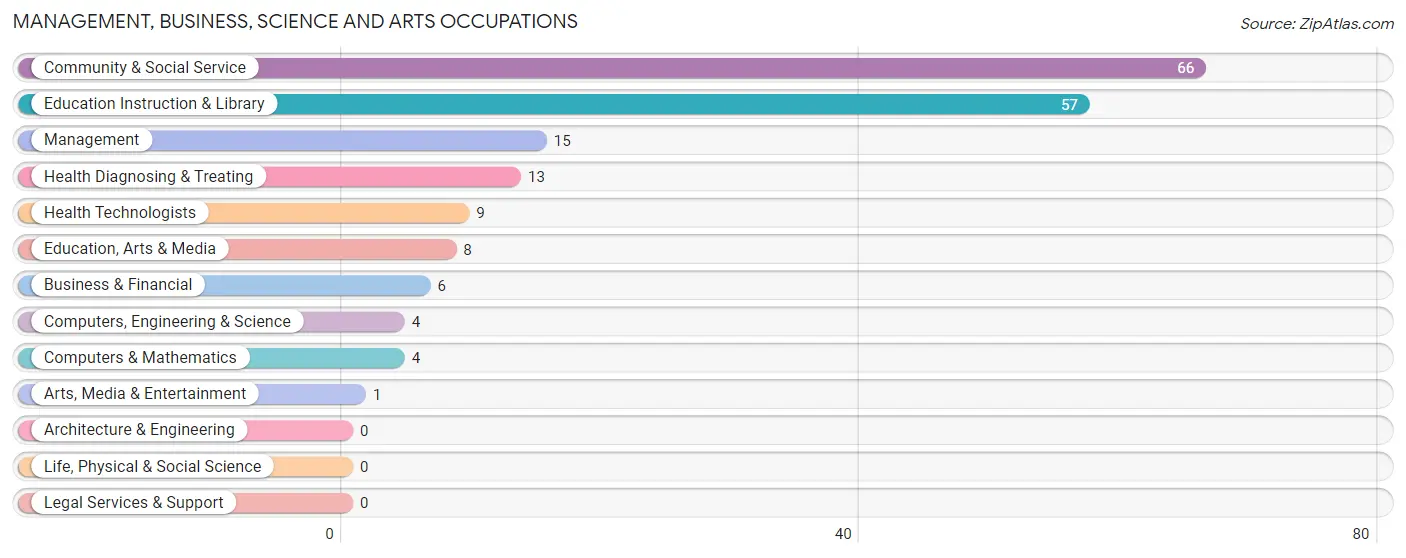
Management, Business, Science and Arts Occupations
The most common Management, Business, Science and Arts occupations in Ray City are Community & Social Service (66 | 18.6%), Education Instruction & Library (57 | 16.1%), Management (15 | 4.2%), Health Diagnosing & Treating (13 | 3.7%), and Health Technologists (9 | 2.5%).
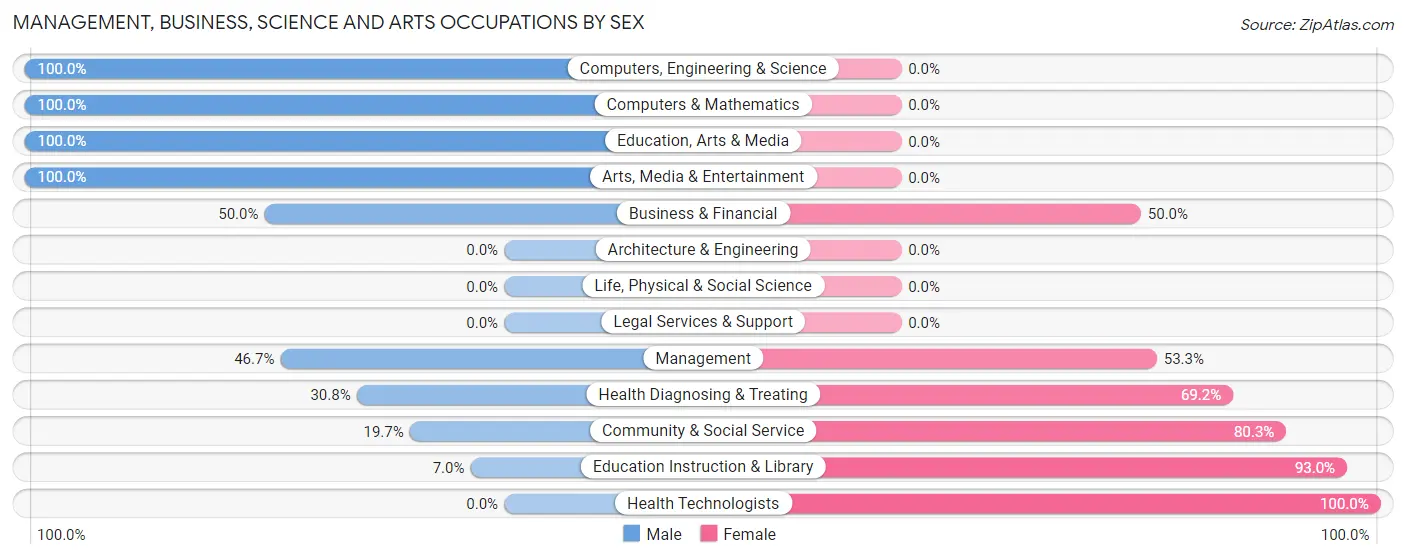
Management, Business, Science and Arts Occupations by Sex
Within the Management, Business, Science and Arts occupations in Ray City, the most male-oriented occupations are Computers, Engineering & Science (100.0%), Computers & Mathematics (100.0%), and Education, Arts & Media (100.0%), while the most female-oriented occupations are Health Technologists (100.0%), Education Instruction & Library (93.0%), and Community & Social Service (80.3%).
| Occupation | Male | Female |
| Management | 7 (46.7%) | 8 (53.3%) |
| Business & Financial | 3 (50.0%) | 3 (50.0%) |
| Computers, Engineering & Science | 4 (100.0%) | 0 (0.0%) |
| Computers & Mathematics | 4 (100.0%) | 0 (0.0%) |
| Architecture & Engineering | 0 (0.0%) | 0 (0.0%) |
| Life, Physical & Social Science | 0 (0.0%) | 0 (0.0%) |
| Community & Social Service | 13 (19.7%) | 53 (80.3%) |
| Education, Arts & Media | 8 (100.0%) | 0 (0.0%) |
| Legal Services & Support | 0 (0.0%) | 0 (0.0%) |
| Education Instruction & Library | 4 (7.0%) | 53 (93.0%) |
| Arts, Media & Entertainment | 1 (100.0%) | 0 (0.0%) |
| Health Diagnosing & Treating | 4 (30.8%) | 9 (69.2%) |
| Health Technologists | 0 (0.0%) | 9 (100.0%) |
| Total (Category) | 31 (29.8%) | 73 (70.2%) |
| Total (Overall) | 150 (42.4%) | 204 (57.6%) |
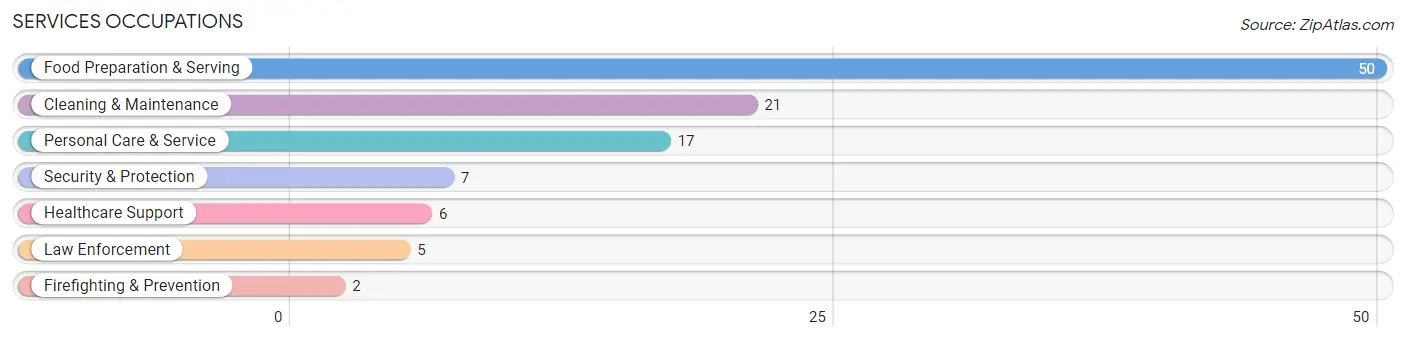
Services Occupations
The most common Services occupations in Ray City are Food Preparation & Serving (50 | 14.1%), Cleaning & Maintenance (21 | 5.9%), Personal Care & Service (17 | 4.8%), Security & Protection (7 | 2.0%), and Healthcare Support (6 | 1.7%).
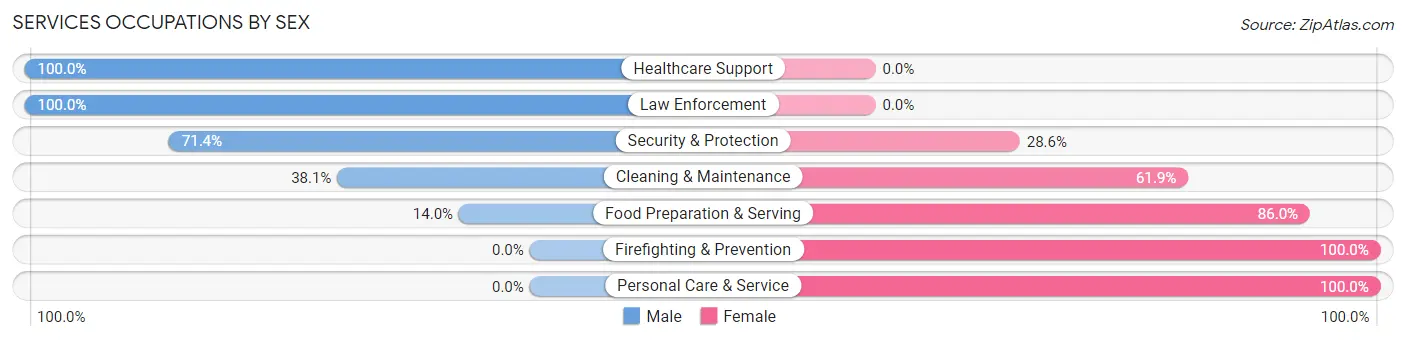
Services Occupations by Sex
Within the Services occupations in Ray City, the most male-oriented occupations are Healthcare Support (100.0%), Law Enforcement (100.0%), and Security & Protection (71.4%), while the most female-oriented occupations are Firefighting & Prevention (100.0%), Personal Care & Service (100.0%), and Food Preparation & Serving (86.0%).
| Occupation | Male | Female |
| Healthcare Support | 6 (100.0%) | 0 (0.0%) |
| Security & Protection | 5 (71.4%) | 2 (28.6%) |
| Firefighting & Prevention | 0 (0.0%) | 2 (100.0%) |
| Law Enforcement | 5 (100.0%) | 0 (0.0%) |
| Food Preparation & Serving | 7 (14.0%) | 43 (86.0%) |
| Cleaning & Maintenance | 8 (38.1%) | 13 (61.9%) |
| Personal Care & Service | 0 (0.0%) | 17 (100.0%) |
| Total (Category) | 26 (25.7%) | 75 (74.3%) |
| Total (Overall) | 150 (42.4%) | 204 (57.6%) |
Sales and Office Occupations
The most common Sales and Office occupations in Ray City are Office & Administration (34 | 9.6%), and Sales & Related (25 | 7.1%).
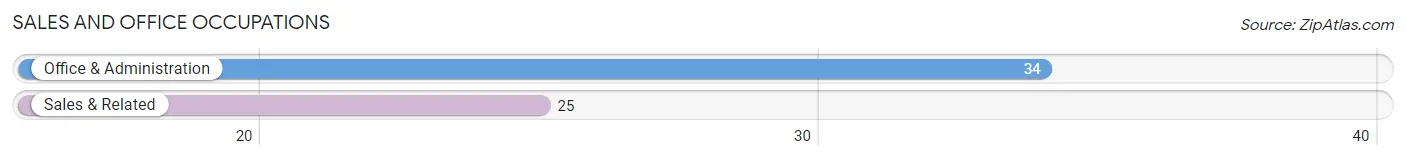
Sales and Office Occupations by Sex
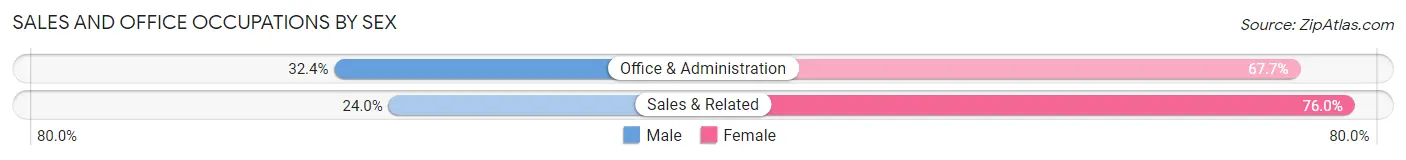
| Occupation | Male | Female |
| Sales & Related | 6 (24.0%) | 19 (76.0%) |
| Office & Administration | 11 (32.4%) | 23 (67.6%) |
| Total (Category) | 17 (28.8%) | 42 (71.2%) |
| Total (Overall) | 150 (42.4%) | 204 (57.6%) |
Natural Resources, Construction and Maintenance Occupations
The most common Natural Resources, Construction and Maintenance occupations in Ray City are Construction & Extraction (9 | 2.5%), and Installation, Maintenance & Repair (2 | 0.6%).
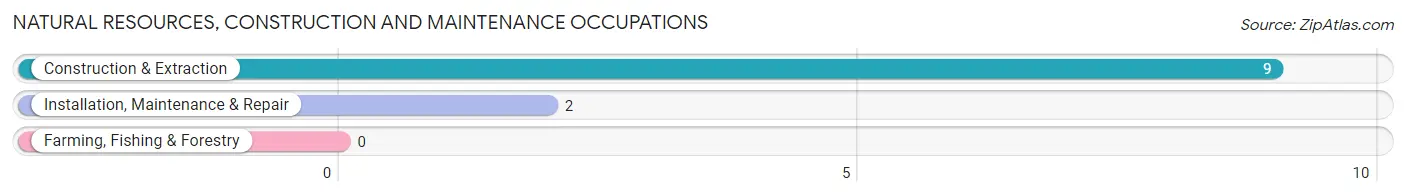
Natural Resources, Construction and Maintenance Occupations by Sex
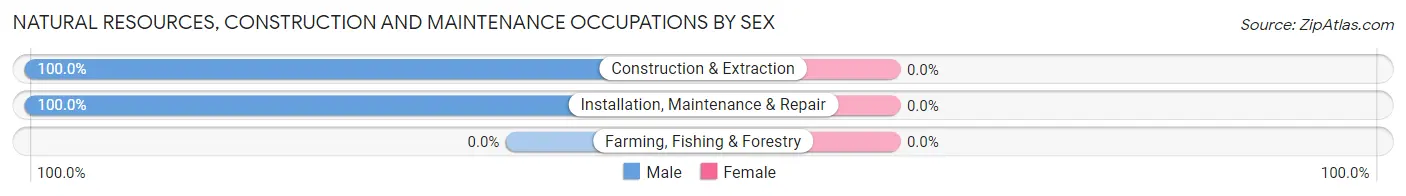
| Occupation | Male | Female |
| Farming, Fishing & Forestry | 0 (0.0%) | 0 (0.0%) |
| Construction & Extraction | 9 (100.0%) | 0 (0.0%) |
| Installation, Maintenance & Repair | 2 (100.0%) | 0 (0.0%) |
| Total (Category) | 11 (100.0%) | 0 (0.0%) |
| Total (Overall) | 150 (42.4%) | 204 (57.6%) |
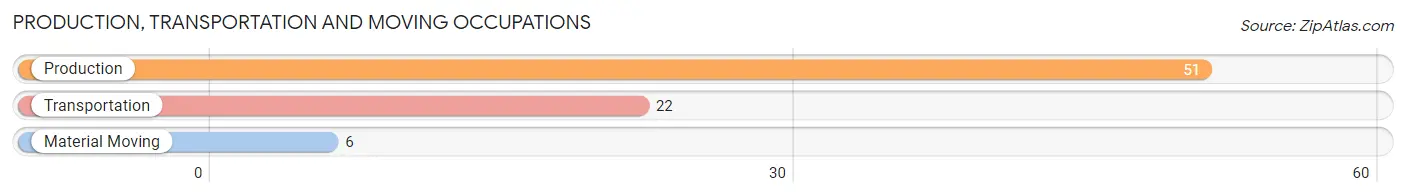
Production, Transportation and Moving Occupations
The most common Production, Transportation and Moving occupations in Ray City are Production (51 | 14.4%), Transportation (22 | 6.2%), and Material Moving (6 | 1.7%).
Production, Transportation and Moving Occupations by Sex
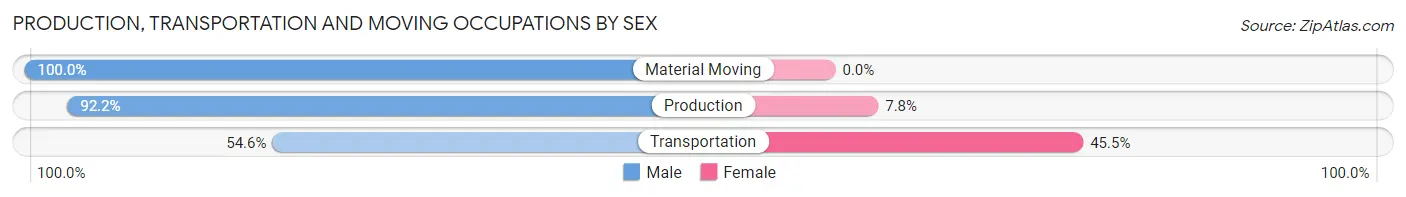
| Occupation | Male | Female |
| Production | 47 (92.2%) | 4 (7.8%) |
| Transportation | 12 (54.5%) | 10 (45.5%) |
| Material Moving | 6 (100.0%) | 0 (0.0%) |
| Total (Category) | 65 (82.3%) | 14 (17.7%) |
| Total (Overall) | 150 (42.4%) | 204 (57.6%) |
Employment Industries by Sex in Ray City
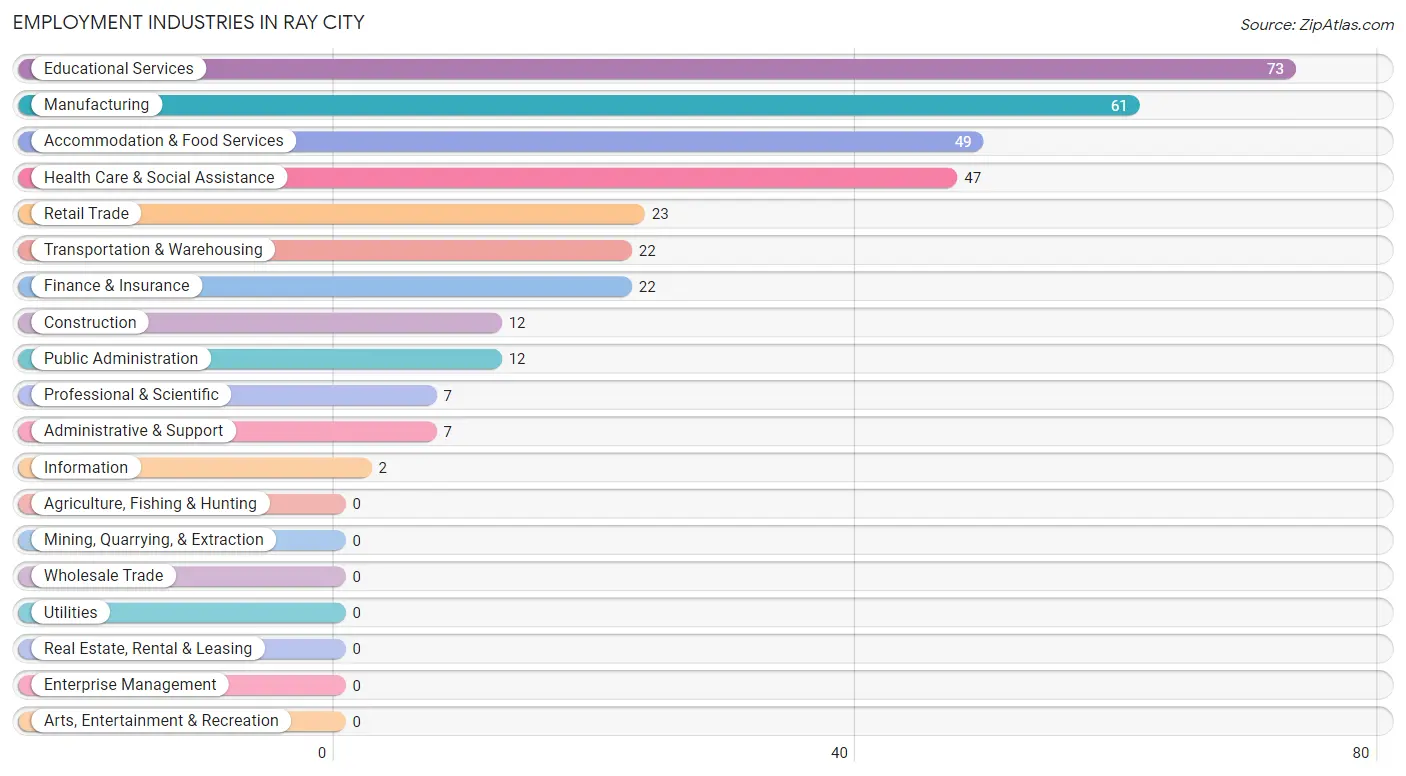
Employment Industries in Ray City
The major employment industries in Ray City include Educational Services (73 | 20.6%), Manufacturing (61 | 17.2%), Accommodation & Food Services (49 | 13.8%), Health Care & Social Assistance (47 | 13.3%), and Retail Trade (23 | 6.5%).
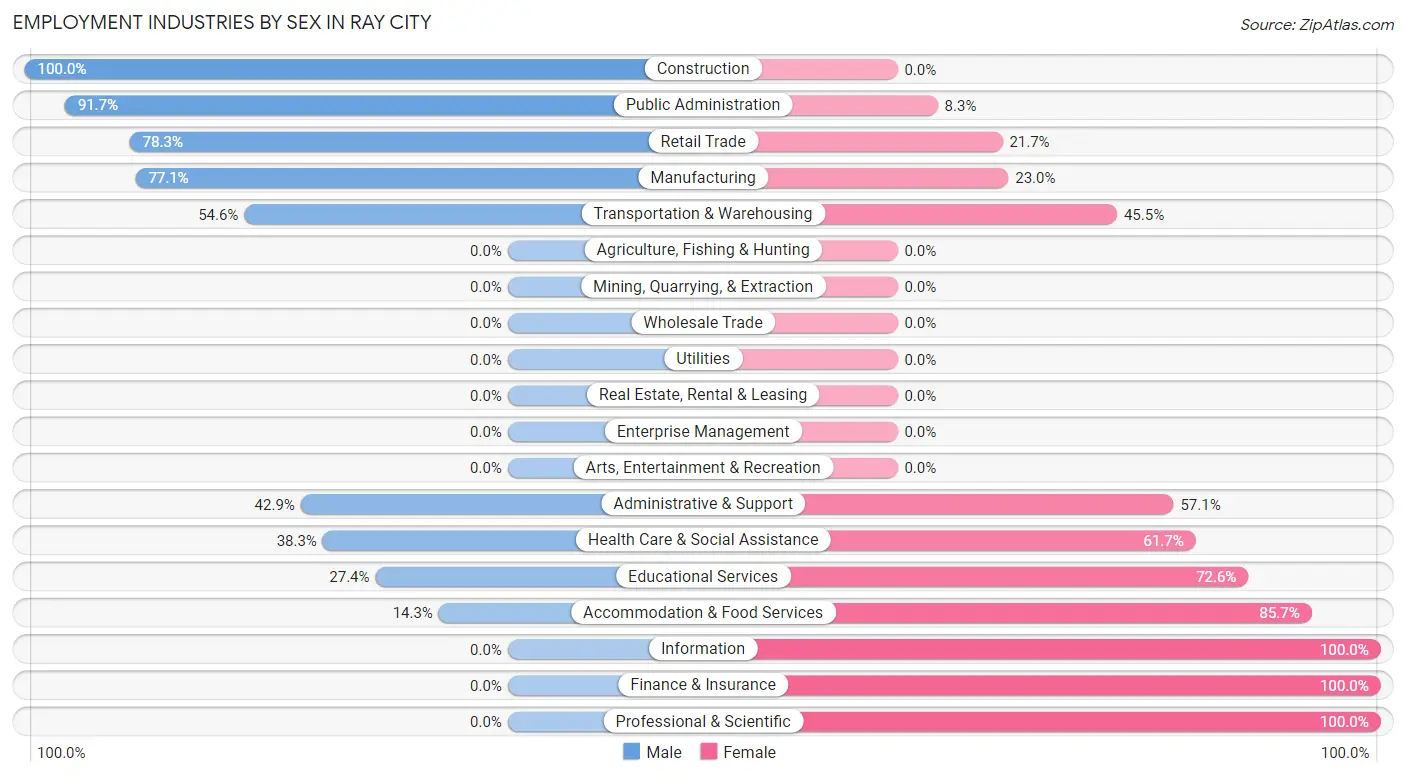
Employment Industries by Sex in Ray City
The Ray City industries that see more men than women are Construction (100.0%), Public Administration (91.7%), and Retail Trade (78.3%), whereas the industries that tend to have a higher number of women are Information (100.0%), Finance & Insurance (100.0%), and Professional & Scientific (100.0%).
| Industry | Male | Female |
| Agriculture, Fishing & Hunting | 0 (0.0%) | 0 (0.0%) |
| Mining, Quarrying, & Extraction | 0 (0.0%) | 0 (0.0%) |
| Construction | 12 (100.0%) | 0 (0.0%) |
| Manufacturing | 47 (77.0%) | 14 (23.0%) |
| Wholesale Trade | 0 (0.0%) | 0 (0.0%) |
| Retail Trade | 18 (78.3%) | 5 (21.7%) |
| Transportation & Warehousing | 12 (54.5%) | 10 (45.5%) |
| Utilities | 0 (0.0%) | 0 (0.0%) |
| Information | 0 (0.0%) | 2 (100.0%) |
| Finance & Insurance | 0 (0.0%) | 22 (100.0%) |
| Real Estate, Rental & Leasing | 0 (0.0%) | 0 (0.0%) |
| Professional & Scientific | 0 (0.0%) | 7 (100.0%) |
| Enterprise Management | 0 (0.0%) | 0 (0.0%) |
| Administrative & Support | 3 (42.9%) | 4 (57.1%) |
| Educational Services | 20 (27.4%) | 53 (72.6%) |
| Health Care & Social Assistance | 18 (38.3%) | 29 (61.7%) |
| Arts, Entertainment & Recreation | 0 (0.0%) | 0 (0.0%) |
| Accommodation & Food Services | 7 (14.3%) | 42 (85.7%) |
| Public Administration | 11 (91.7%) | 1 (8.3%) |
| Total | 150 (42.4%) | 204 (57.6%) |
Education in Ray City
School Enrollment in Ray City
The most common levels of schooling among the 276 students in Ray City are high school (101 | 36.6%), elementary school (78 | 28.3%), and kindergarten (39 | 14.1%).
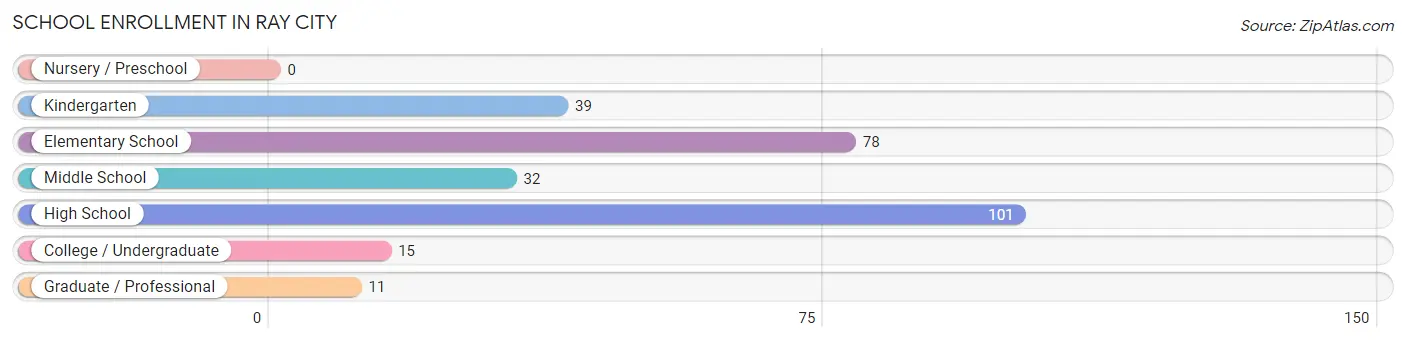
| School Level | # Students | % Students |
| Nursery / Preschool | 0 | 0.0% |
| Kindergarten | 39 | 14.1% |
| Elementary School | 78 | 28.3% |
| Middle School | 32 | 11.6% |
| High School | 101 | 36.6% |
| College / Undergraduate | 15 | 5.4% |
| Graduate / Professional | 11 | 4.0% |
| Total | 276 | 100.0% |
School Enrollment by Age by Funding Source in Ray City
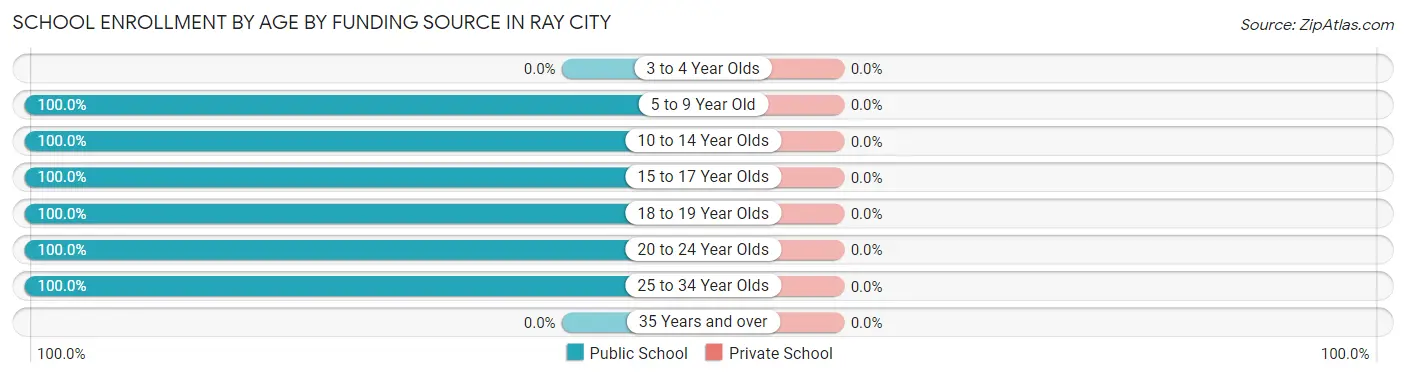
| Age Bracket | Public School | Private School |
| 3 to 4 Year Olds | 0 (0.0%) | 0 (0.0%) |
| 5 to 9 Year Old | 122 (100.0%) | 0 (0.0%) |
| 10 to 14 Year Olds | 43 (100.0%) | 0 (0.0%) |
| 15 to 17 Year Olds | 74 (100.0%) | 0 (0.0%) |
| 18 to 19 Year Olds | 11 (100.0%) | 0 (0.0%) |
| 20 to 24 Year Olds | 11 (100.0%) | 0 (0.0%) |
| 25 to 34 Year Olds | 15 (100.0%) | 0 (0.0%) |
| 35 Years and over | 0 (0.0%) | 0 (0.0%) |
| Total | 276 (100.0%) | 0 (0.0%) |
Educational Attainment by Field of Study in Ray City
Education (32 | 36.4%), business (21 | 23.9%), arts & humanities (18 | 20.4%), science & technology (6 | 6.8%), and literature & languages (4 | 4.5%) are the most common fields of study among 88 individuals in Ray City who have obtained a bachelor's degree or higher.
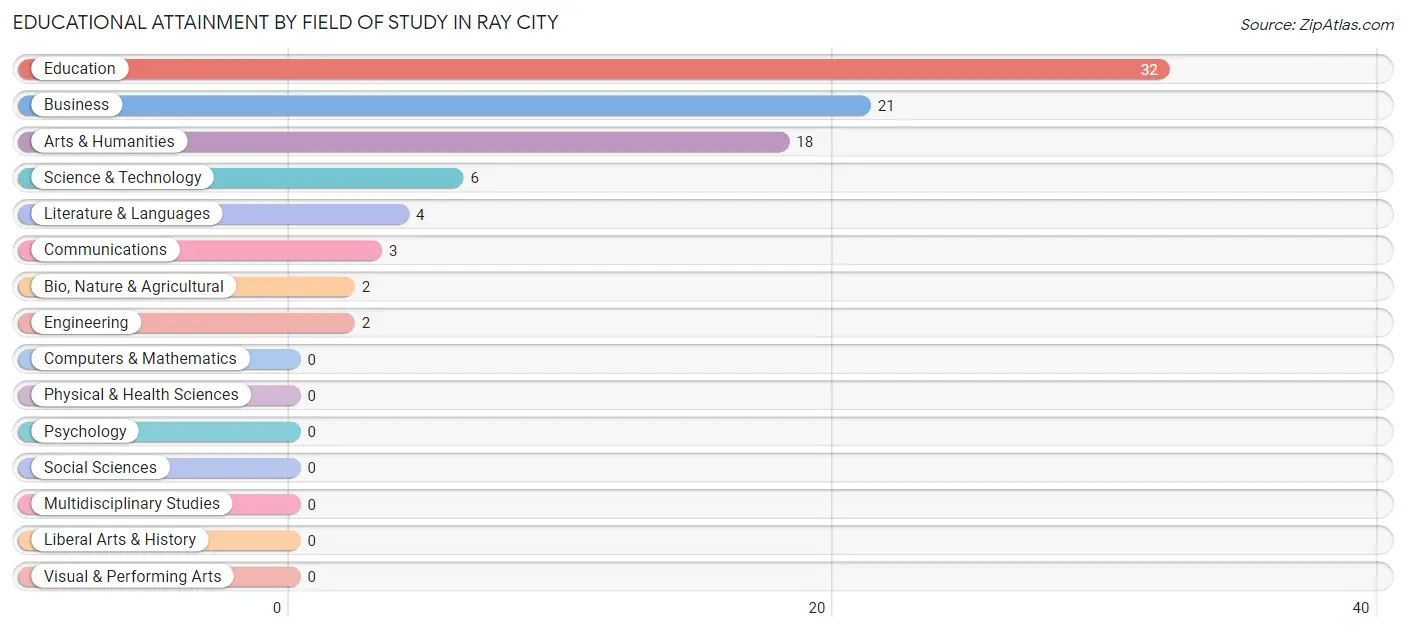
| Field of Study | # Graduates | % Graduates |
| Computers & Mathematics | 0 | 0.0% |
| Bio, Nature & Agricultural | 2 | 2.3% |
| Physical & Health Sciences | 0 | 0.0% |
| Psychology | 0 | 0.0% |
| Social Sciences | 0 | 0.0% |
| Engineering | 2 | 2.3% |
| Multidisciplinary Studies | 0 | 0.0% |
| Science & Technology | 6 | 6.8% |
| Business | 21 | 23.9% |
| Education | 32 | 36.4% |
| Literature & Languages | 4 | 4.5% |
| Liberal Arts & History | 0 | 0.0% |
| Visual & Performing Arts | 0 | 0.0% |
| Communications | 3 | 3.4% |
| Arts & Humanities | 18 | 20.4% |
| Total | 88 | 100.0% |
Transportation & Commute in Ray City
Vehicle Availability by Sex in Ray City
The most prevalent vehicle ownership categories in Ray City are males with 2 vehicles (84, accounting for 47.7%) and females with 2 vehicles (104, making up 42.2%).
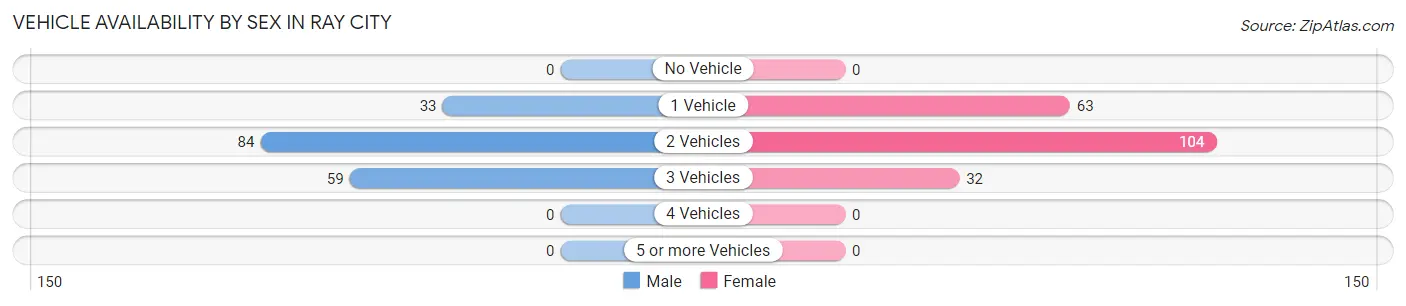
| Vehicles Available | Male | Female |
| No Vehicle | 0 (0.0%) | 0 (0.0%) |
| 1 Vehicle | 33 (18.8%) | 63 (31.7%) |
| 2 Vehicles | 84 (47.7%) | 104 (52.3%) |
| 3 Vehicles | 59 (33.5%) | 32 (16.1%) |
| 4 Vehicles | 0 (0.0%) | 0 (0.0%) |
| 5 or more Vehicles | 0 (0.0%) | 0 (0.0%) |
| Total | 176 (100.0%) | 199 (100.0%) |
Commute Time in Ray City
The most frequently occuring commute durations in Ray City are 30 to 34 minutes (103 commuters, 28.4%), 15 to 19 minutes (76 commuters, 21.0%), and 20 to 24 minutes (50 commuters, 13.8%).
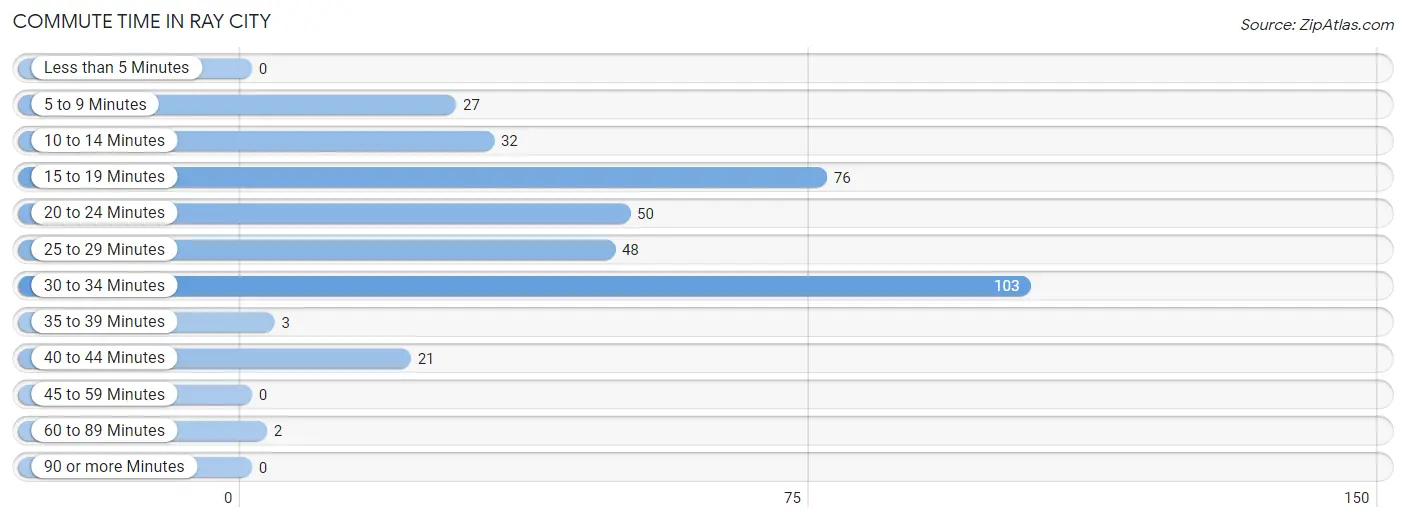
| Commute Time | # Commuters | % Commuters |
| Less than 5 Minutes | 0 | 0.0% |
| 5 to 9 Minutes | 27 | 7.5% |
| 10 to 14 Minutes | 32 | 8.8% |
| 15 to 19 Minutes | 76 | 21.0% |
| 20 to 24 Minutes | 50 | 13.8% |
| 25 to 29 Minutes | 48 | 13.3% |
| 30 to 34 Minutes | 103 | 28.4% |
| 35 to 39 Minutes | 3 | 0.8% |
| 40 to 44 Minutes | 21 | 5.8% |
| 45 to 59 Minutes | 0 | 0.0% |
| 60 to 89 Minutes | 2 | 0.5% |
| 90 or more Minutes | 0 | 0.0% |
Commute Time by Sex in Ray City
The most common commute times in Ray City are 15 to 19 minutes (58 commuters, 34.1%) for males and 30 to 34 minutes (90 commuters, 46.9%) for females.
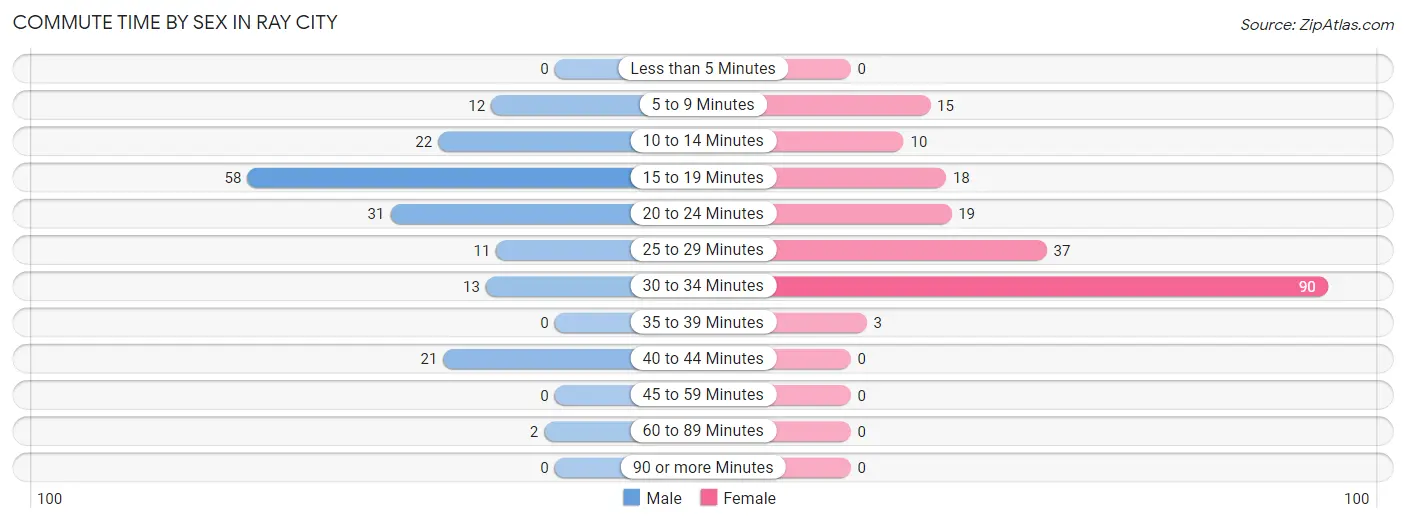
| Commute Time | Male | Female |
| Less than 5 Minutes | 0 (0.0%) | 0 (0.0%) |
| 5 to 9 Minutes | 12 (7.1%) | 15 (7.8%) |
| 10 to 14 Minutes | 22 (12.9%) | 10 (5.2%) |
| 15 to 19 Minutes | 58 (34.1%) | 18 (9.4%) |
| 20 to 24 Minutes | 31 (18.2%) | 19 (9.9%) |
| 25 to 29 Minutes | 11 (6.5%) | 37 (19.3%) |
| 30 to 34 Minutes | 13 (7.6%) | 90 (46.9%) |
| 35 to 39 Minutes | 0 (0.0%) | 3 (1.6%) |
| 40 to 44 Minutes | 21 (12.3%) | 0 (0.0%) |
| 45 to 59 Minutes | 0 (0.0%) | 0 (0.0%) |
| 60 to 89 Minutes | 2 (1.2%) | 0 (0.0%) |
| 90 or more Minutes | 0 (0.0%) | 0 (0.0%) |
Time of Departure to Work by Sex in Ray City
The most frequent times of departure to work in Ray City are 7:00 AM to 7:29 AM (66, 38.8%) for males and 12:00 AM to 4:59 AM (53, 27.6%) for females.
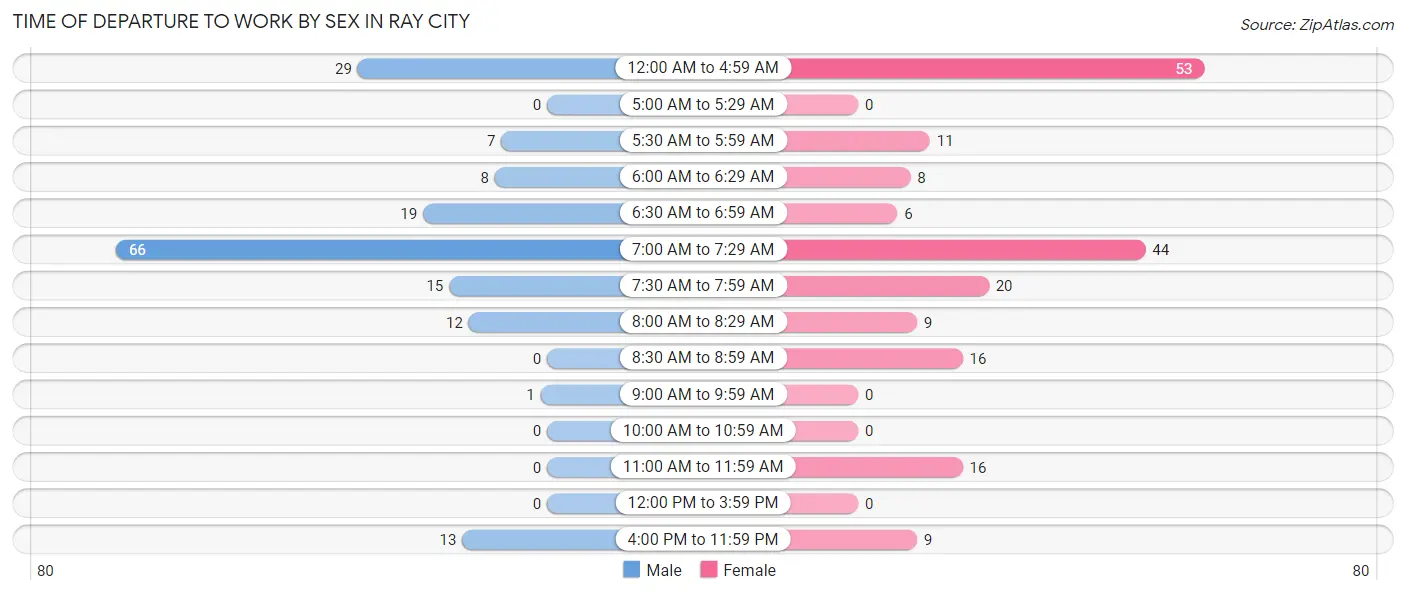
| Time of Departure | Male | Female |
| 12:00 AM to 4:59 AM | 29 (17.1%) | 53 (27.6%) |
| 5:00 AM to 5:29 AM | 0 (0.0%) | 0 (0.0%) |
| 5:30 AM to 5:59 AM | 7 (4.1%) | 11 (5.7%) |
| 6:00 AM to 6:29 AM | 8 (4.7%) | 8 (4.2%) |
| 6:30 AM to 6:59 AM | 19 (11.2%) | 6 (3.1%) |
| 7:00 AM to 7:29 AM | 66 (38.8%) | 44 (22.9%) |
| 7:30 AM to 7:59 AM | 15 (8.8%) | 20 (10.4%) |
| 8:00 AM to 8:29 AM | 12 (7.1%) | 9 (4.7%) |
| 8:30 AM to 8:59 AM | 0 (0.0%) | 16 (8.3%) |
| 9:00 AM to 9:59 AM | 1 (0.6%) | 0 (0.0%) |
| 10:00 AM to 10:59 AM | 0 (0.0%) | 0 (0.0%) |
| 11:00 AM to 11:59 AM | 0 (0.0%) | 16 (8.3%) |
| 12:00 PM to 3:59 PM | 0 (0.0%) | 0 (0.0%) |
| 4:00 PM to 11:59 PM | 13 (7.6%) | 9 (4.7%) |
| Total | 170 (100.0%) | 192 (100.0%) |
Housing Occupancy in Ray City
Occupancy by Ownership in Ray City
Of the total 327 dwellings in Ray City, owner-occupied units account for 163 (49.8%), while renter-occupied units make up 164 (50.1%).
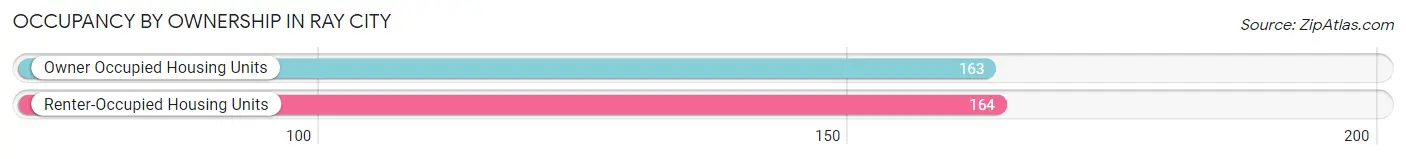
| Occupancy | # Housing Units | % Housing Units |
| Owner Occupied Housing Units | 163 | 49.8% |
| Renter-Occupied Housing Units | 164 | 50.1% |
| Total Occupied Housing Units | 327 | 100.0% |
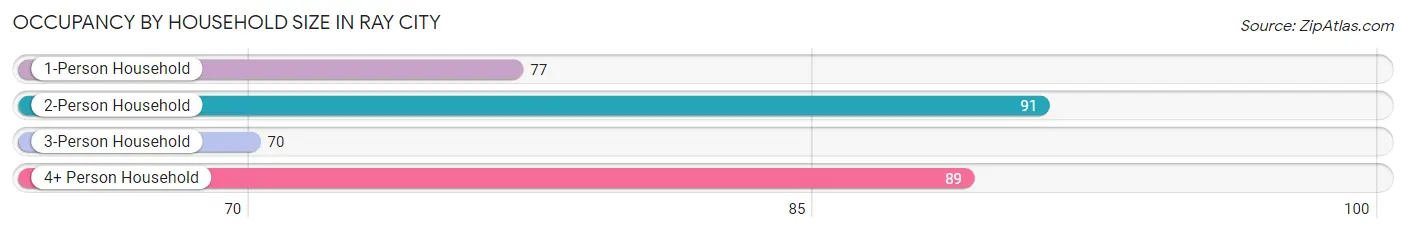
Occupancy by Household Size in Ray City
| Household Size | # Housing Units | % Housing Units |
| 1-Person Household | 77 | 23.5% |
| 2-Person Household | 91 | 27.8% |
| 3-Person Household | 70 | 21.4% |
| 4+ Person Household | 89 | 27.2% |
| Total Housing Units | 327 | 100.0% |
Occupancy by Ownership by Household Size in Ray City
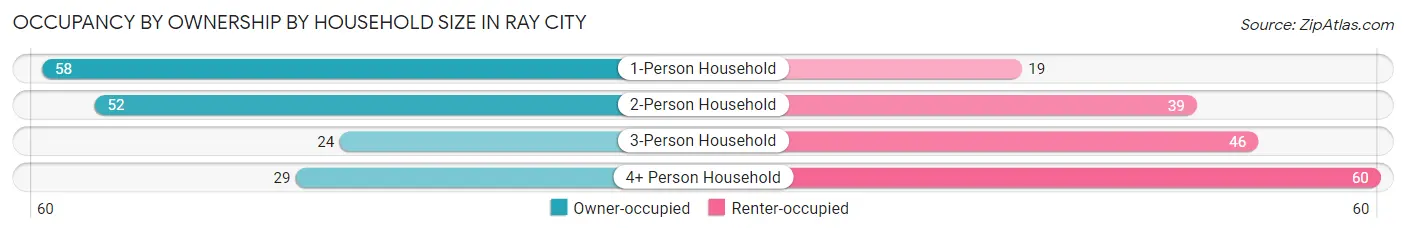
| Household Size | Owner-occupied | Renter-occupied |
| 1-Person Household | 58 (75.3%) | 19 (24.7%) |
| 2-Person Household | 52 (57.1%) | 39 (42.9%) |
| 3-Person Household | 24 (34.3%) | 46 (65.7%) |
| 4+ Person Household | 29 (32.6%) | 60 (67.4%) |
| Total Housing Units | 163 (49.8%) | 164 (50.1%) |
Occupancy by Educational Attainment in Ray City
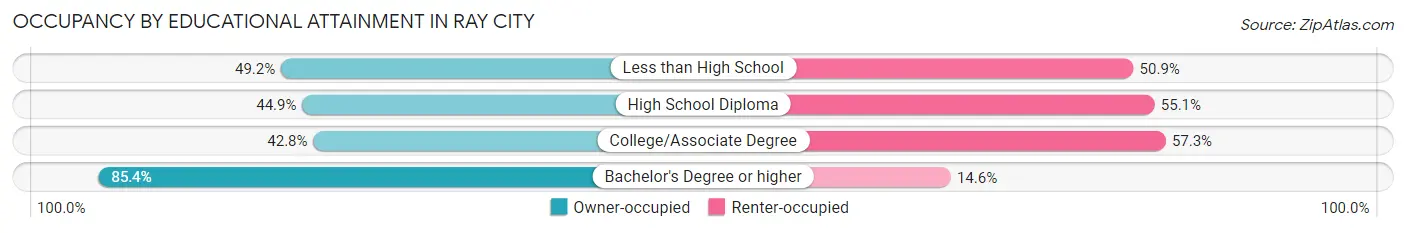
| Household Size | Owner-occupied | Renter-occupied |
| Less than High School | 29 (49.1%) | 30 (50.8%) |
| High School Diploma | 40 (44.9%) | 49 (55.1%) |
| College/Associate Degree | 59 (42.7%) | 79 (57.3%) |
| Bachelor's Degree or higher | 35 (85.4%) | 6 (14.6%) |
Occupancy by Age of Householder in Ray City
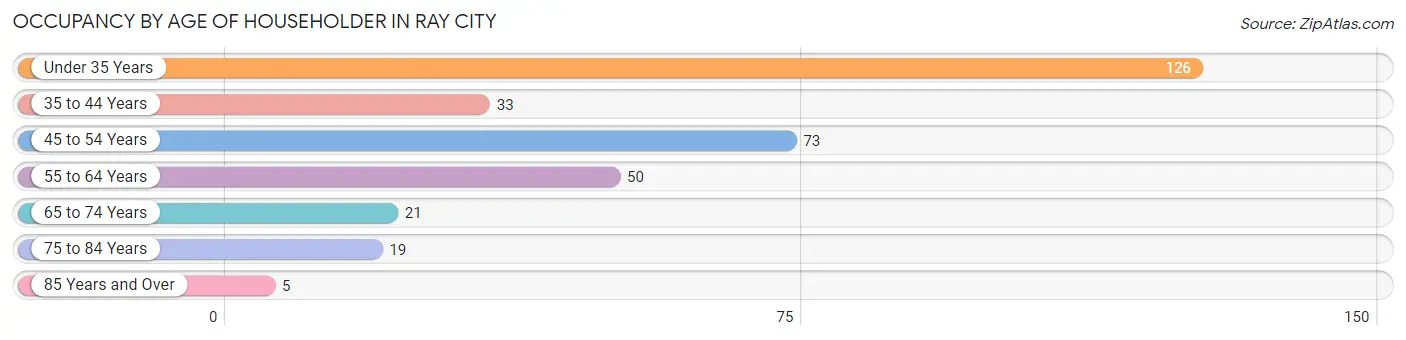
| Age Bracket | # Households | % Households |
| Under 35 Years | 126 | 38.5% |
| 35 to 44 Years | 33 | 10.1% |
| 45 to 54 Years | 73 | 22.3% |
| 55 to 64 Years | 50 | 15.3% |
| 65 to 74 Years | 21 | 6.4% |
| 75 to 84 Years | 19 | 5.8% |
| 85 Years and Over | 5 | 1.5% |
| Total | 327 | 100.0% |
Housing Finances in Ray City
Median Income by Occupancy in Ray City
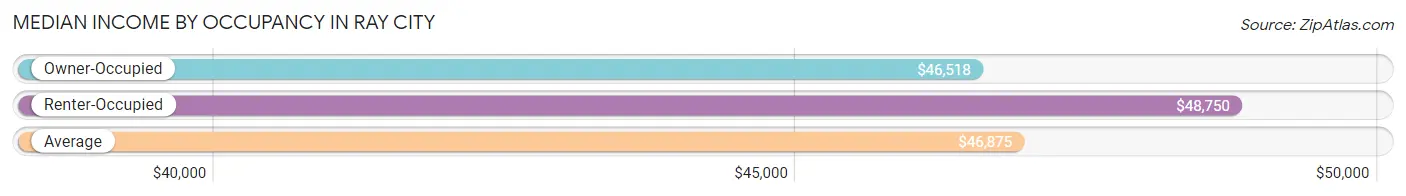
| Occupancy Type | # Households | Median Income |
| Owner-Occupied | 163 (49.8%) | $46,518 |
| Renter-Occupied | 164 (50.1%) | $48,750 |
| Average | 327 (100.0%) | $46,875 |
Occupancy by Householder Income Bracket in Ray City
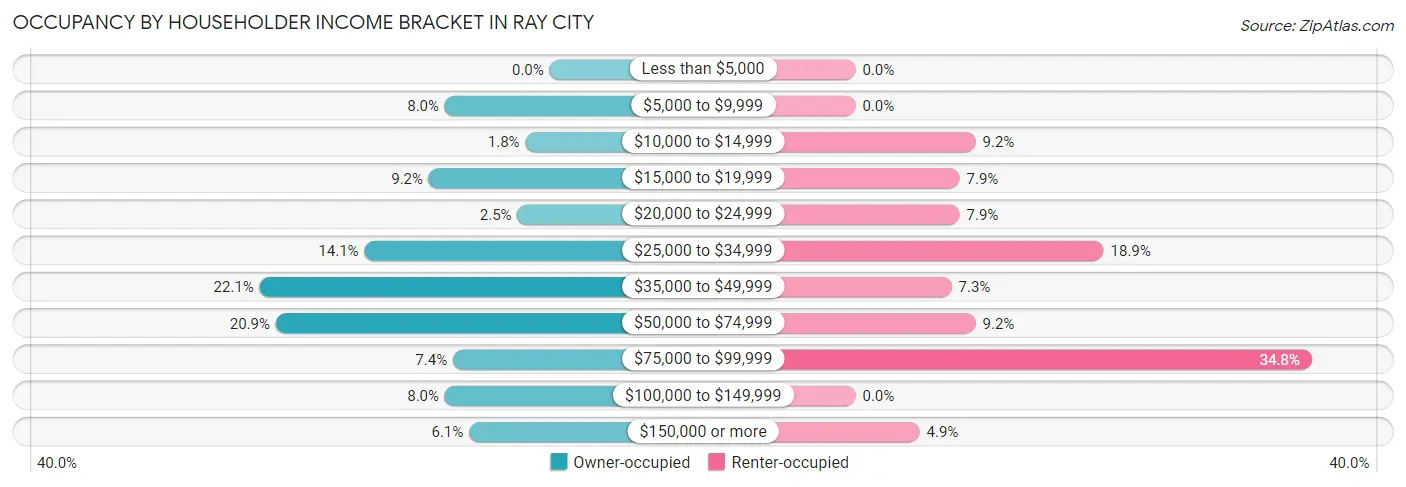
| Income Bracket | Owner-occupied | Renter-occupied |
| Less than $5,000 | 0 (0.0%) | 0 (0.0%) |
| $5,000 to $9,999 | 13 (8.0%) | 0 (0.0%) |
| $10,000 to $14,999 | 3 (1.8%) | 15 (9.1%) |
| $15,000 to $19,999 | 15 (9.2%) | 13 (7.9%) |
| $20,000 to $24,999 | 4 (2.5%) | 13 (7.9%) |
| $25,000 to $34,999 | 23 (14.1%) | 31 (18.9%) |
| $35,000 to $49,999 | 36 (22.1%) | 12 (7.3%) |
| $50,000 to $74,999 | 34 (20.9%) | 15 (9.1%) |
| $75,000 to $99,999 | 12 (7.4%) | 57 (34.8%) |
| $100,000 to $149,999 | 13 (8.0%) | 0 (0.0%) |
| $150,000 or more | 10 (6.1%) | 8 (4.9%) |
| Total | 163 (100.0%) | 164 (100.0%) |
Monthly Housing Cost Tiers in Ray City
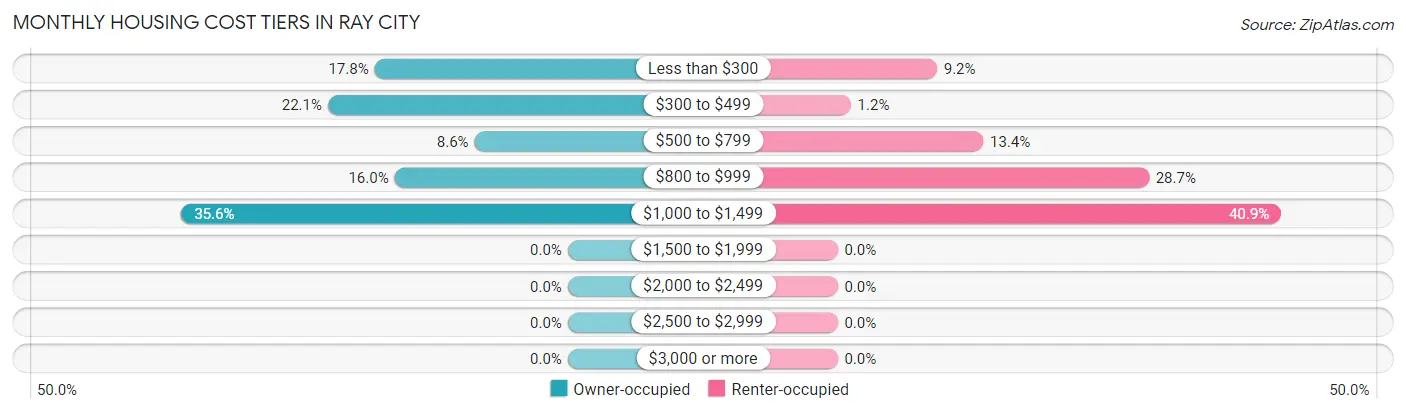
| Monthly Cost | Owner-occupied | Renter-occupied |
| Less than $300 | 29 (17.8%) | 15 (9.1%) |
| $300 to $499 | 36 (22.1%) | 2 (1.2%) |
| $500 to $799 | 14 (8.6%) | 22 (13.4%) |
| $800 to $999 | 26 (16.0%) | 47 (28.7%) |
| $1,000 to $1,499 | 58 (35.6%) | 67 (40.8%) |
| $1,500 to $1,999 | 0 (0.0%) | 0 (0.0%) |
| $2,000 to $2,499 | 0 (0.0%) | 0 (0.0%) |
| $2,500 to $2,999 | 0 (0.0%) | 0 (0.0%) |
| $3,000 or more | 0 (0.0%) | 0 (0.0%) |
| Total | 163 (100.0%) | 164 (100.0%) |
Physical Housing Characteristics in Ray City
Housing Structures in Ray City
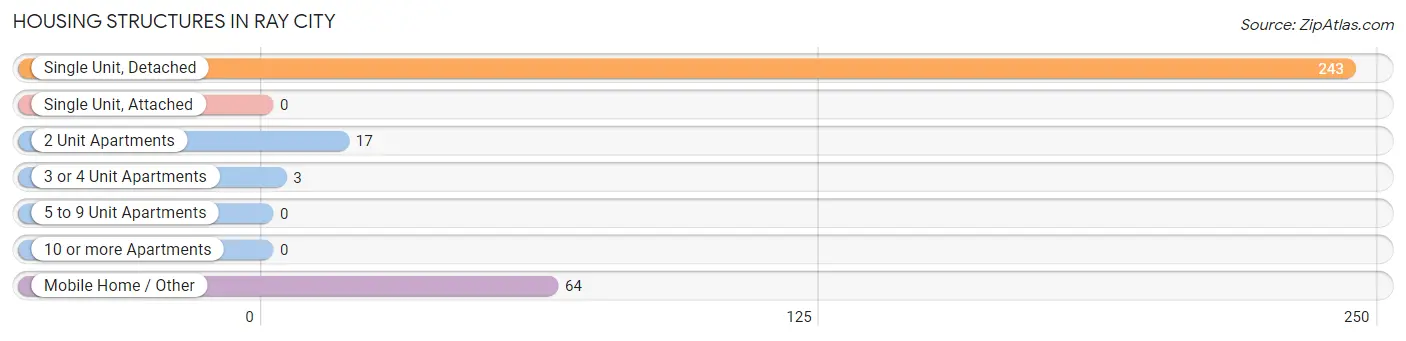
| Structure Type | # Housing Units | % Housing Units |
| Single Unit, Detached | 243 | 74.3% |
| Single Unit, Attached | 0 | 0.0% |
| 2 Unit Apartments | 17 | 5.2% |
| 3 or 4 Unit Apartments | 3 | 0.9% |
| 5 to 9 Unit Apartments | 0 | 0.0% |
| 10 or more Apartments | 0 | 0.0% |
| Mobile Home / Other | 64 | 19.6% |
| Total | 327 | 100.0% |
Housing Structures by Occupancy in Ray City
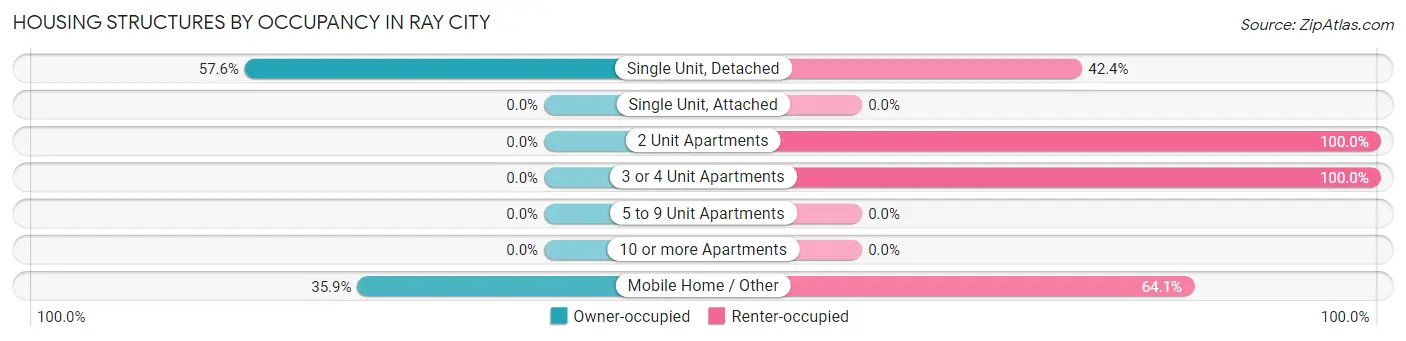
| Structure Type | Owner-occupied | Renter-occupied |
| Single Unit, Detached | 140 (57.6%) | 103 (42.4%) |
| Single Unit, Attached | 0 (0.0%) | 0 (0.0%) |
| 2 Unit Apartments | 0 (0.0%) | 17 (100.0%) |
| 3 or 4 Unit Apartments | 0 (0.0%) | 3 (100.0%) |
| 5 to 9 Unit Apartments | 0 (0.0%) | 0 (0.0%) |
| 10 or more Apartments | 0 (0.0%) | 0 (0.0%) |
| Mobile Home / Other | 23 (35.9%) | 41 (64.1%) |
| Total | 163 (49.8%) | 164 (50.1%) |
Housing Structures by Number of Rooms in Ray City
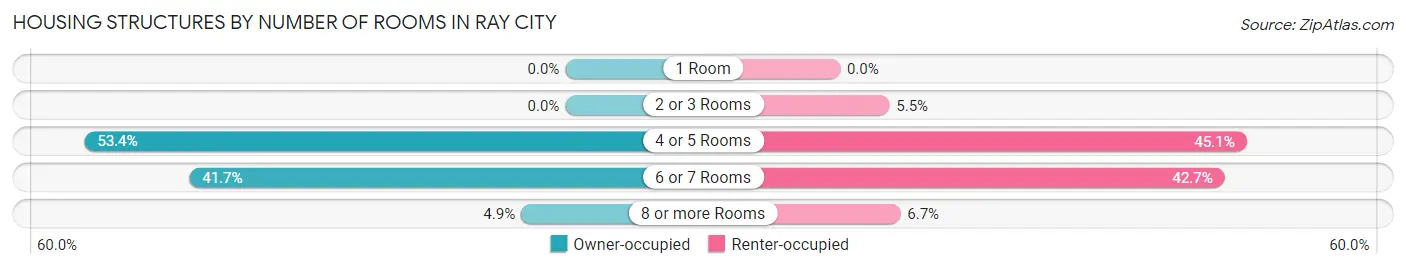
| Number of Rooms | Owner-occupied | Renter-occupied |
| 1 Room | 0 (0.0%) | 0 (0.0%) |
| 2 or 3 Rooms | 0 (0.0%) | 9 (5.5%) |
| 4 or 5 Rooms | 87 (53.4%) | 74 (45.1%) |
| 6 or 7 Rooms | 68 (41.7%) | 70 (42.7%) |
| 8 or more Rooms | 8 (4.9%) | 11 (6.7%) |
| Total | 163 (100.0%) | 164 (100.0%) |
Housing Structure by Heating Type in Ray City
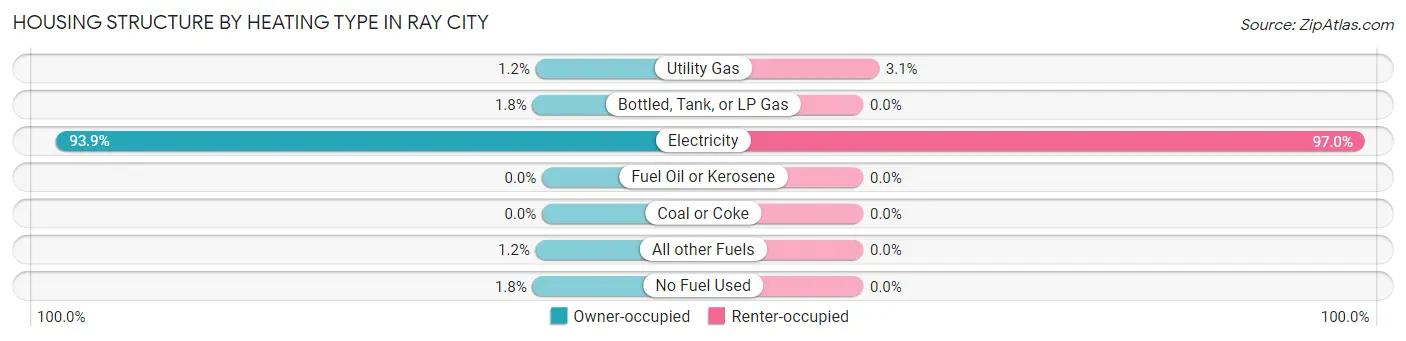
| Heating Type | Owner-occupied | Renter-occupied |
| Utility Gas | 2 (1.2%) | 5 (3.0%) |
| Bottled, Tank, or LP Gas | 3 (1.8%) | 0 (0.0%) |
| Electricity | 153 (93.9%) | 159 (97.0%) |
| Fuel Oil or Kerosene | 0 (0.0%) | 0 (0.0%) |
| Coal or Coke | 0 (0.0%) | 0 (0.0%) |
| All other Fuels | 2 (1.2%) | 0 (0.0%) |
| No Fuel Used | 3 (1.8%) | 0 (0.0%) |
| Total | 163 (100.0%) | 164 (100.0%) |
Household Vehicle Usage in Ray City
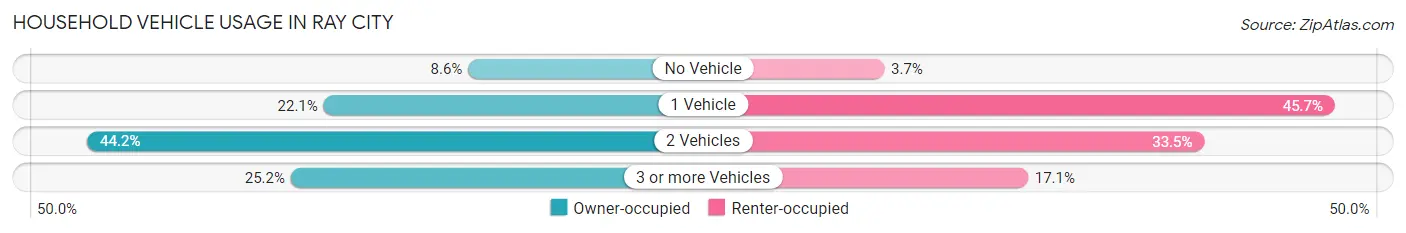
| Vehicles per Household | Owner-occupied | Renter-occupied |
| No Vehicle | 14 (8.6%) | 6 (3.7%) |
| 1 Vehicle | 36 (22.1%) | 75 (45.7%) |
| 2 Vehicles | 72 (44.2%) | 55 (33.5%) |
| 3 or more Vehicles | 41 (25.2%) | 28 (17.1%) |
| Total | 163 (100.0%) | 164 (100.0%) |
Real Estate & Mortgages in Ray City
Real Estate and Mortgage Overview in Ray City
| Characteristic | Without Mortgage | With Mortgage |
| Housing Units | 65 | 98 |
| Median Property Value | $108,500 | $119,500 |
| Median Household Income | $36,042 | $0 |
| Monthly Housing Costs | $325 | $0 |
| Real Estate Taxes | $724 | $9 |
Property Value by Mortgage Status in Ray City
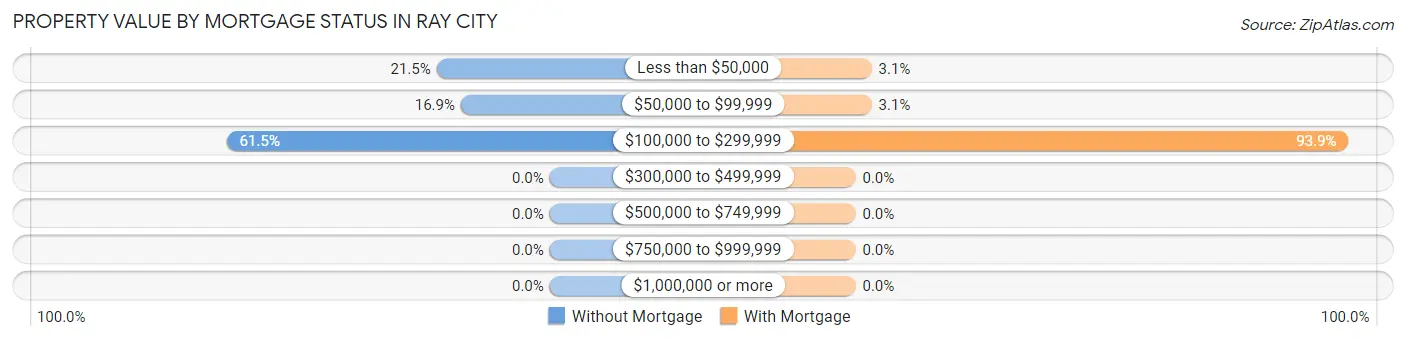
| Property Value | Without Mortgage | With Mortgage |
| Less than $50,000 | 14 (21.5%) | 3 (3.1%) |
| $50,000 to $99,999 | 11 (16.9%) | 3 (3.1%) |
| $100,000 to $299,999 | 40 (61.5%) | 92 (93.9%) |
| $300,000 to $499,999 | 0 (0.0%) | 0 (0.0%) |
| $500,000 to $749,999 | 0 (0.0%) | 0 (0.0%) |
| $750,000 to $999,999 | 0 (0.0%) | 0 (0.0%) |
| $1,000,000 or more | 0 (0.0%) | 0 (0.0%) |
| Total | 65 (100.0%) | 98 (100.0%) |
Household Income by Mortgage Status in Ray City
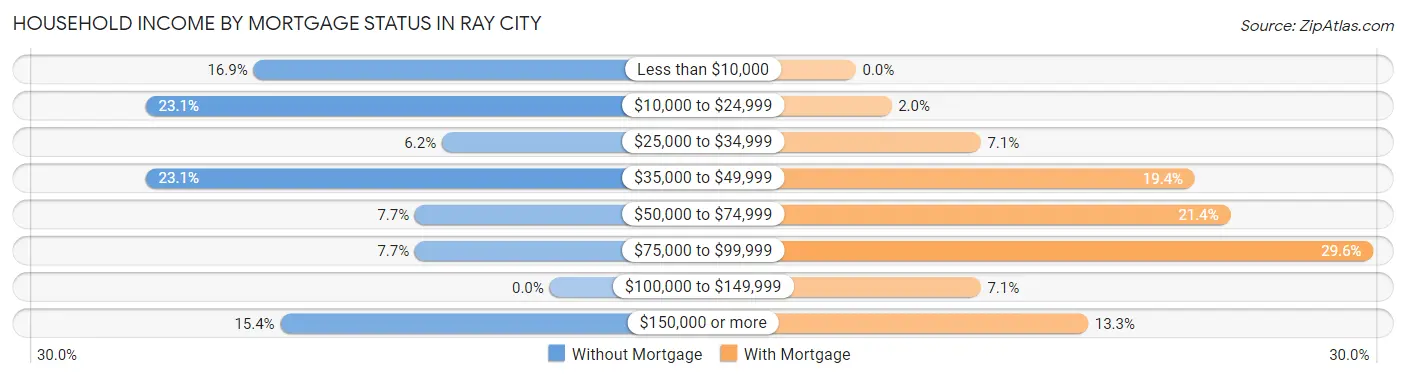
| Household Income | Without Mortgage | With Mortgage |
| Less than $10,000 | 11 (16.9%) | 0 (0.0%) |
| $10,000 to $24,999 | 15 (23.1%) | 2 (2.0%) |
| $25,000 to $34,999 | 4 (6.1%) | 7 (7.1%) |
| $35,000 to $49,999 | 15 (23.1%) | 19 (19.4%) |
| $50,000 to $74,999 | 5 (7.7%) | 21 (21.4%) |
| $75,000 to $99,999 | 5 (7.7%) | 29 (29.6%) |
| $100,000 to $149,999 | 0 (0.0%) | 7 (7.1%) |
| $150,000 or more | 10 (15.4%) | 13 (13.3%) |
| Total | 65 (100.0%) | 98 (100.0%) |
Property Value to Household Income Ratio in Ray City
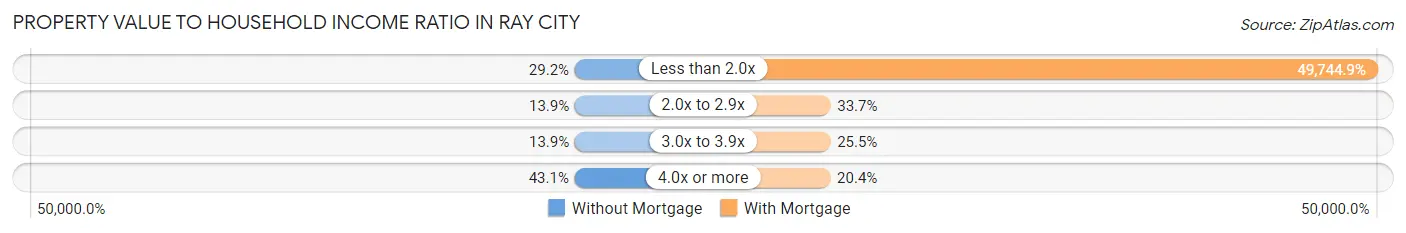
| Value-to-Income Ratio | Without Mortgage | With Mortgage |
| Less than 2.0x | 19 (29.2%) | 48,750 (49,744.9%) |
| 2.0x to 2.9x | 9 (13.9%) | 33 (33.7%) |
| 3.0x to 3.9x | 9 (13.9%) | 25 (25.5%) |
| 4.0x or more | 28 (43.1%) | 20 (20.4%) |
| Total | 65 (100.0%) | 98 (100.0%) |
Real Estate Taxes by Mortgage Status in Ray City
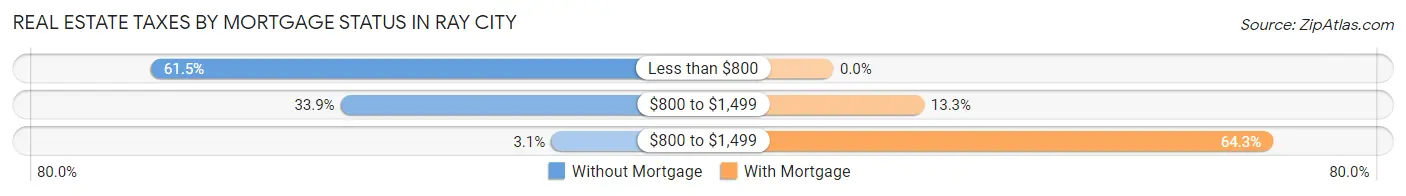
| Property Taxes | Without Mortgage | With Mortgage |
| Less than $800 | 40 (61.5%) | 0 (0.0%) |
| $800 to $1,499 | 22 (33.9%) | 13 (13.3%) |
| $800 to $1,499 | 2 (3.1%) | 63 (64.3%) |
| Total | 65 (100.0%) | 98 (100.0%) |
Health & Disability in Ray City
Health Insurance Coverage by Age in Ray City
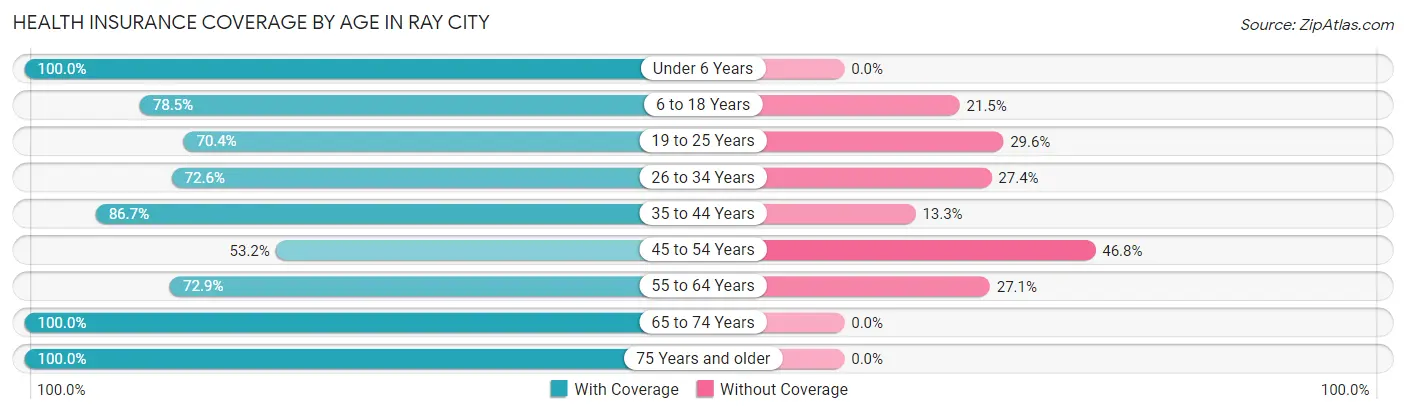
| Age Bracket | With Coverage | Without Coverage |
| Under 6 Years | 122 (100.0%) | 0 (0.0%) |
| 6 to 18 Years | 241 (78.5%) | 66 (21.5%) |
| 19 to 25 Years | 57 (70.4%) | 24 (29.6%) |
| 26 to 34 Years | 82 (72.6%) | 31 (27.4%) |
| 35 to 44 Years | 85 (86.7%) | 13 (13.3%) |
| 45 to 54 Years | 75 (53.2%) | 66 (46.8%) |
| 55 to 64 Years | 51 (72.9%) | 19 (27.1%) |
| 65 to 74 Years | 52 (100.0%) | 0 (0.0%) |
| 75 Years and older | 24 (100.0%) | 0 (0.0%) |
| Total | 789 (78.3%) | 219 (21.7%) |
Health Insurance Coverage by Citizenship Status in Ray City
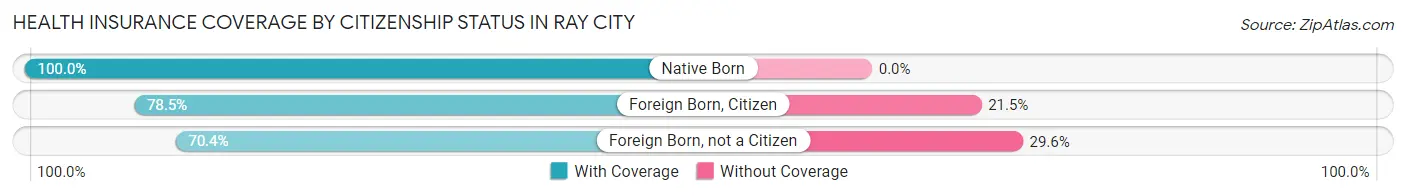
| Citizenship Status | With Coverage | Without Coverage |
| Native Born | 122 (100.0%) | 0 (0.0%) |
| Foreign Born, Citizen | 241 (78.5%) | 66 (21.5%) |
| Foreign Born, not a Citizen | 57 (70.4%) | 24 (29.6%) |
Health Insurance Coverage by Household Income in Ray City
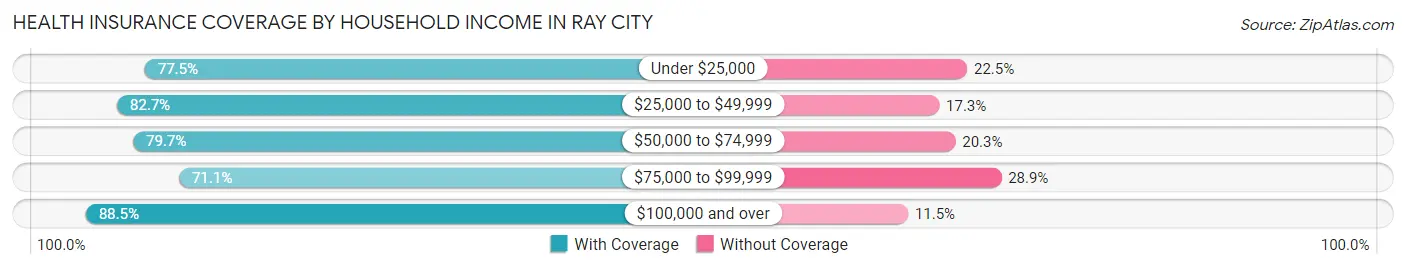
| Household Income | With Coverage | Without Coverage |
| Under $25,000 | 141 (77.5%) | 41 (22.5%) |
| $25,000 to $49,999 | 239 (82.7%) | 50 (17.3%) |
| $50,000 to $74,999 | 98 (79.7%) | 25 (20.3%) |
| $75,000 to $99,999 | 226 (71.1%) | 92 (28.9%) |
| $100,000 and over | 85 (88.5%) | 11 (11.5%) |
Public vs Private Health Insurance Coverage by Age in Ray City
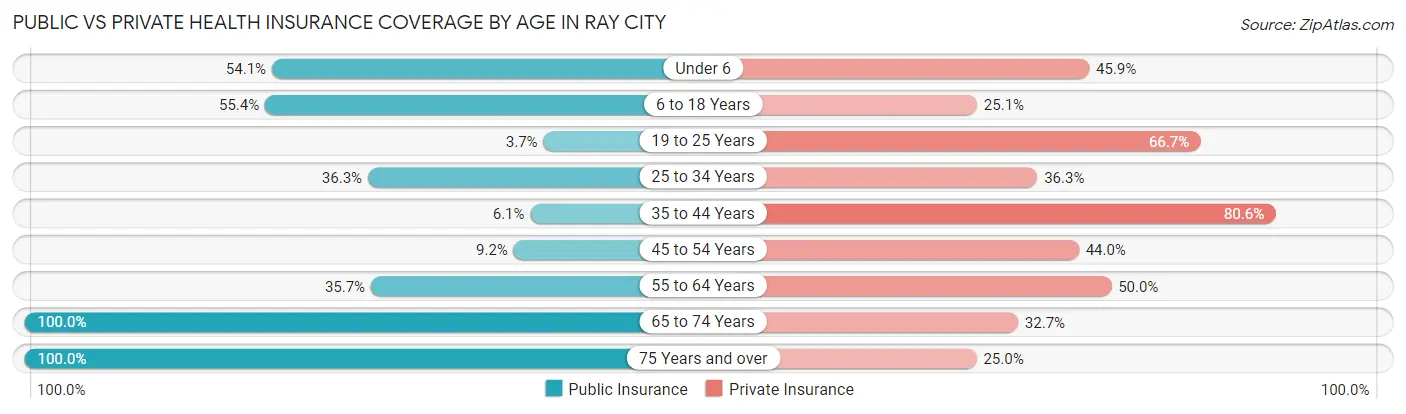
| Age Bracket | Public Insurance | Private Insurance |
| Under 6 | 66 (54.1%) | 56 (45.9%) |
| 6 to 18 Years | 170 (55.4%) | 77 (25.1%) |
| 19 to 25 Years | 3 (3.7%) | 54 (66.7%) |
| 25 to 34 Years | 41 (36.3%) | 41 (36.3%) |
| 35 to 44 Years | 6 (6.1%) | 79 (80.6%) |
| 45 to 54 Years | 13 (9.2%) | 62 (44.0%) |
| 55 to 64 Years | 25 (35.7%) | 35 (50.0%) |
| 65 to 74 Years | 52 (100.0%) | 17 (32.7%) |
| 75 Years and over | 24 (100.0%) | 6 (25.0%) |
| Total | 400 (39.7%) | 427 (42.4%) |
Disability Status by Sex by Age in Ray City
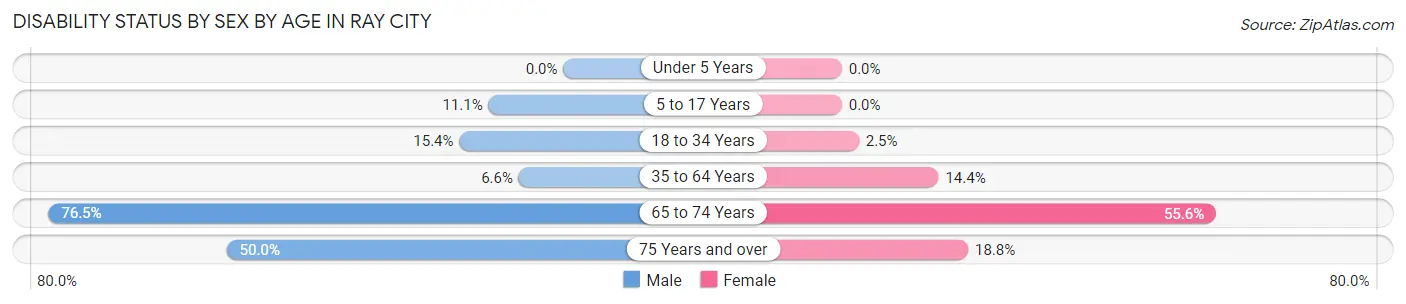
| Age Bracket | Male | Female |
| Under 5 Years | 0 (0.0%) | 0 (0.0%) |
| 5 to 17 Years | 16 (11.1%) | 0 (0.0%) |
| 18 to 34 Years | 21 (15.4%) | 3 (2.5%) |
| 35 to 64 Years | 8 (6.6%) | 27 (14.4%) |
| 65 to 74 Years | 26 (76.5%) | 10 (55.6%) |
| 75 Years and over | 4 (50.0%) | 3 (18.8%) |
Disability Class by Sex by Age in Ray City
Disability Class: Hearing Difficulty
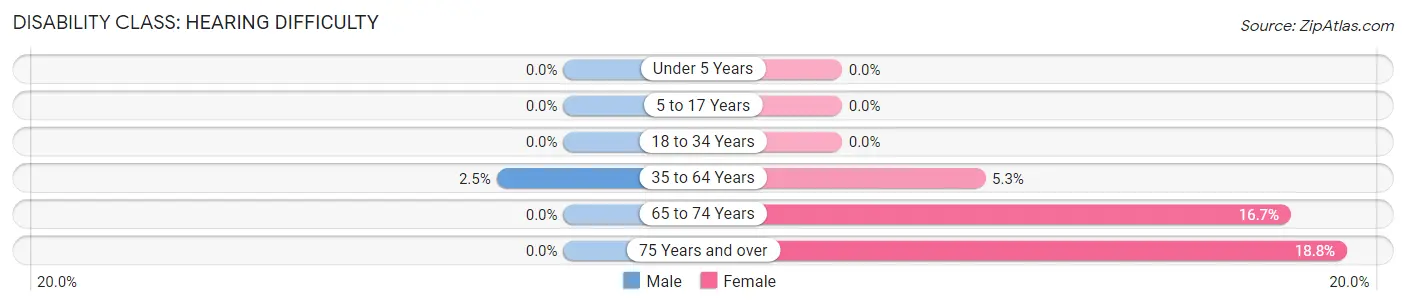
| Age Bracket | Male | Female |
| Under 5 Years | 0 (0.0%) | 0 (0.0%) |
| 5 to 17 Years | 0 (0.0%) | 0 (0.0%) |
| 18 to 34 Years | 0 (0.0%) | 0 (0.0%) |
| 35 to 64 Years | 3 (2.5%) | 10 (5.3%) |
| 65 to 74 Years | 0 (0.0%) | 3 (16.7%) |
| 75 Years and over | 0 (0.0%) | 3 (18.8%) |
Disability Class: Vision Difficulty
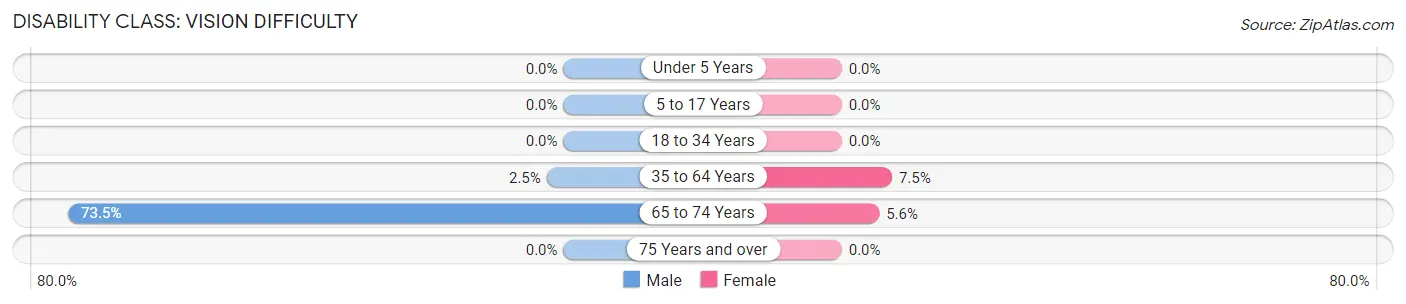
| Age Bracket | Male | Female |
| Under 5 Years | 0 (0.0%) | 0 (0.0%) |
| 5 to 17 Years | 0 (0.0%) | 0 (0.0%) |
| 18 to 34 Years | 0 (0.0%) | 0 (0.0%) |
| 35 to 64 Years | 3 (2.5%) | 14 (7.4%) |
| 65 to 74 Years | 25 (73.5%) | 1 (5.6%) |
| 75 Years and over | 0 (0.0%) | 0 (0.0%) |
Disability Class: Cognitive Difficulty
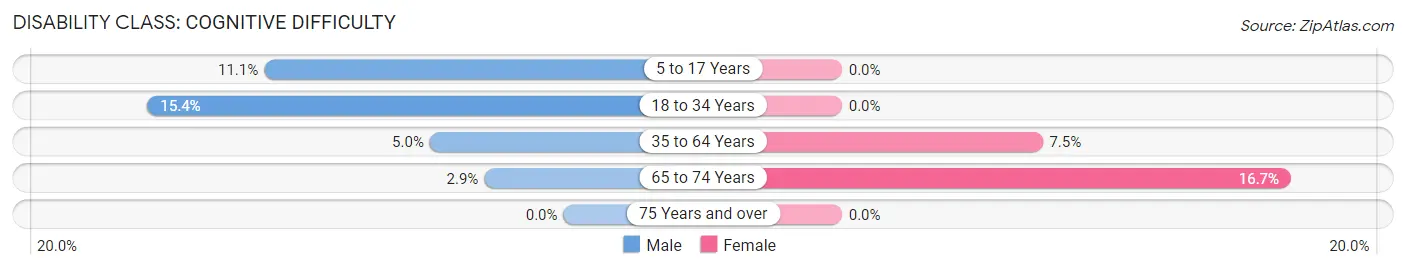
| Age Bracket | Male | Female |
| 5 to 17 Years | 16 (11.1%) | 0 (0.0%) |
| 18 to 34 Years | 21 (15.4%) | 0 (0.0%) |
| 35 to 64 Years | 6 (5.0%) | 14 (7.4%) |
| 65 to 74 Years | 1 (2.9%) | 3 (16.7%) |
| 75 Years and over | 0 (0.0%) | 0 (0.0%) |
Disability Class: Ambulatory Difficulty
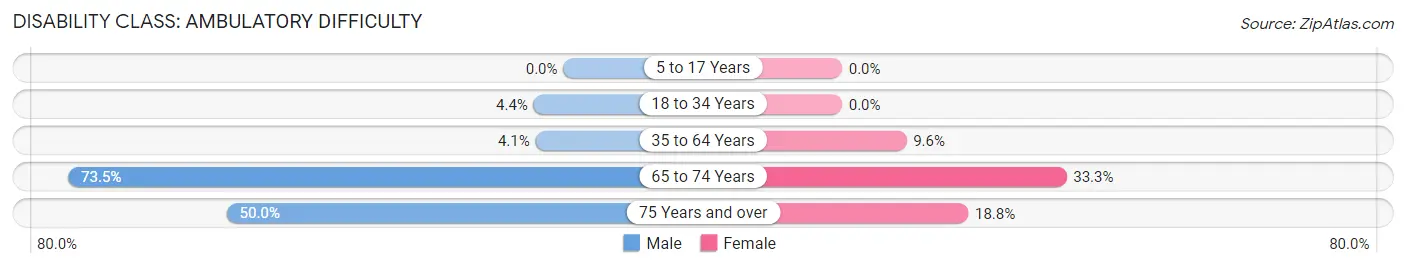
| Age Bracket | Male | Female |
| 5 to 17 Years | 0 (0.0%) | 0 (0.0%) |
| 18 to 34 Years | 6 (4.4%) | 0 (0.0%) |
| 35 to 64 Years | 5 (4.1%) | 18 (9.6%) |
| 65 to 74 Years | 25 (73.5%) | 6 (33.3%) |
| 75 Years and over | 4 (50.0%) | 3 (18.8%) |
Disability Class: Self-Care Difficulty
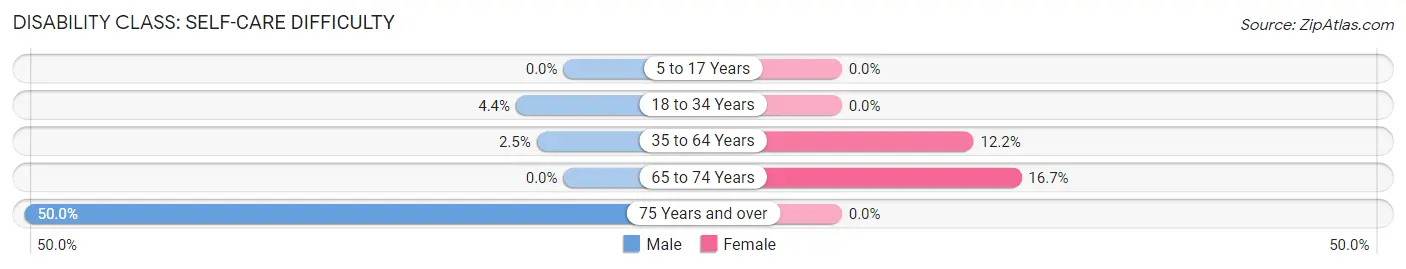
| Age Bracket | Male | Female |
| 5 to 17 Years | 0 (0.0%) | 0 (0.0%) |
| 18 to 34 Years | 6 (4.4%) | 0 (0.0%) |
| 35 to 64 Years | 3 (2.5%) | 23 (12.2%) |
| 65 to 74 Years | 0 (0.0%) | 3 (16.7%) |
| 75 Years and over | 4 (50.0%) | 0 (0.0%) |
Technology Access in Ray City
Computing Device Access in Ray City
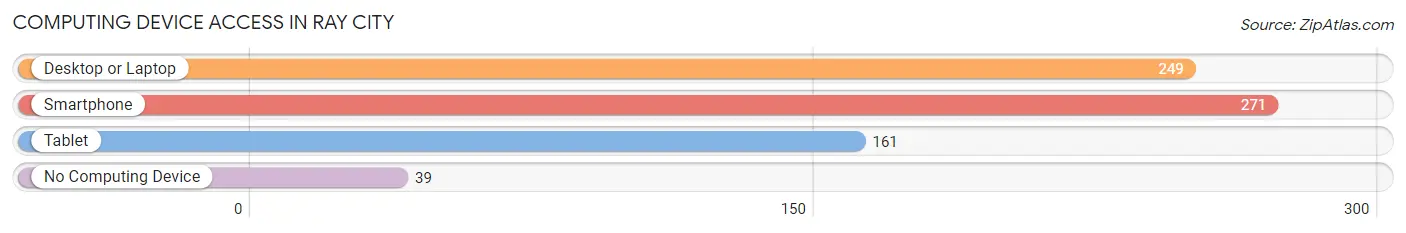
| Device Type | # Households | % Households |
| Desktop or Laptop | 249 | 76.1% |
| Smartphone | 271 | 82.9% |
| Tablet | 161 | 49.2% |
| No Computing Device | 39 | 11.9% |
| Total | 327 | 100.0% |
Internet Access in Ray City
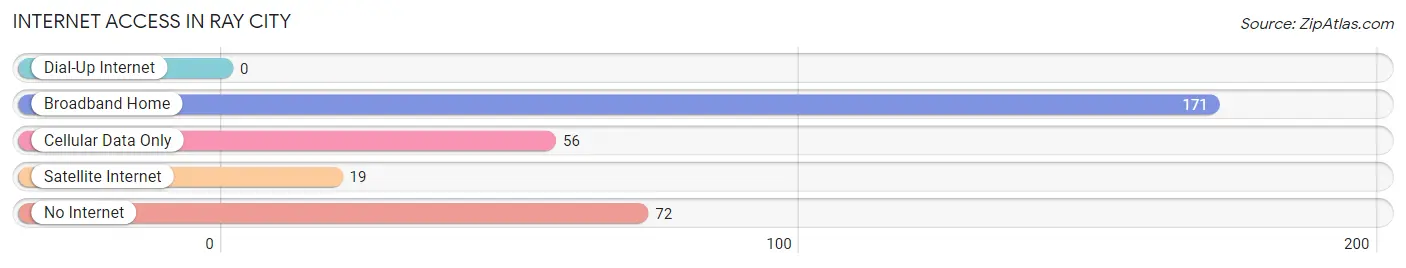
| Internet Type | # Households | % Households |
| Dial-Up Internet | 0 | 0.0% |
| Broadband Home | 171 | 52.3% |
| Cellular Data Only | 56 | 17.1% |
| Satellite Internet | 19 | 5.8% |
| No Internet | 72 | 22.0% |
| Total | 327 | 100.0% |
Ray City Summary
Ray City is a small town located in Berrien County, Georgia, United States. It is situated along the Alapaha River, approximately 10 miles south of the county seat of Nashville. The population of Ray City was 1,092 at the 2010 census.
History
Ray City was founded in 1891 by the Ray family, who had moved to the area from South Carolina. The town was named after the family’s patriarch, William Ray. The town was incorporated in 1895 and was the first incorporated town in Berrien County.
In the early 1900s, Ray City was a thriving agricultural community. The town was home to several cotton gins, a sawmill, a grist mill, and a syrup mill. The town also had a hotel, a bank, a post office, and several stores.
In the 1920s, the town began to decline as the boll weevil destroyed the cotton crop and the Great Depression hit the area. The town’s population decreased from 1,500 in 1920 to just over 500 in 1940.
In the 1950s, the town began to experience a resurgence as the economy improved and the population increased to 1,000. The town was home to several businesses, including a grocery store, a hardware store, a drug store, and a movie theater.
Geography
Ray City is located in the southeastern corner of Berrien County at 31°25'25" North, 83°14'45" West (31.423, -83.246). It is situated along the Alapaha River, approximately 10 miles south of the county seat of Nashville.
The town has a total area of 1.2 square miles, all of which is land. The terrain is mostly flat with some rolling hills. The town is located in the Coastal Plain region of Georgia.
Economy
The economy of Ray City is largely based on agriculture. The town is home to several farms that produce cotton, peanuts, corn, and soybeans. The town also has several businesses, including a grocery store, a hardware store, a drug store, and a movie theater.
Demographics
As of the 2010 census, there were 1,092 people, 431 households, and 294 families residing in Ray City. The population density was 908.3 people per square mile. The racial makeup of the town was 79.2% White, 17.2% African American, 0.2% Native American, 0.2% Asian, 0.1% Pacific Islander, 1.2% from other races, and 1.9% from two or more races. Hispanic or Latino of any race were 3.2% of the population.
The median income for a household in Ray City was $30,000, and the median income for a family was $35,000. The per capita income for the town was $14,000. About 18.2% of families and 22.2% of the population were below the poverty line, including 28.2% of those under age 18 and 16.2% of those age 65 or over.
Common Questions
What is Per Capita Income in Ray City?
Per Capita income in Ray City is $19,342.
What is the Median Family Income in Ray City?
Median Family Income in Ray City is $50,714.
What is the Median Household income in Ray City?
Median Household Income in Ray City is $46,875.
What is Income or Wage Gap in Ray City?
Income or Wage Gap in Ray City is 4.7%.
Women in Ray City earn 95.3 cents for every dollar earned by a man.
What is Inequality or Gini Index in Ray City?
Inequality or Gini Index in Ray City is 0.37.
What is the Total Population of Ray City?
Total Population of Ray City is 1,043.
What is the Total Male Population of Ray City?
Total Male Population of Ray City is 533.
What is the Total Female Population of Ray City?
Total Female Population of Ray City is 510.
What is the Ratio of Males per 100 Females in Ray City?
There are 104.51 Males per 100 Females in Ray City.
What is the Ratio of Females per 100 Males in Ray City?
There are 95.68 Females per 100 Males in Ray City.
What is the Median Population Age in Ray City?
Median Population Age in Ray City is 24.8 Years.
What is the Average Family Size in Ray City
Average Family Size in Ray City is 3.8 People.
What is the Average Household Size in Ray City
Average Household Size in Ray City is 3.2 People.
How Large is the Labor Force in Ray City?
There are 430 People in the Labor Forcein in Ray City.
What is the Percentage of People in the Labor Force in Ray City?
61.7% of People are in the Labor Force in Ray City.
What is the Unemployment Rate in Ray City?
Unemployment Rate in Ray City is 10.4%.