Rockingham, GA Map & Demographics
Rockingham Map
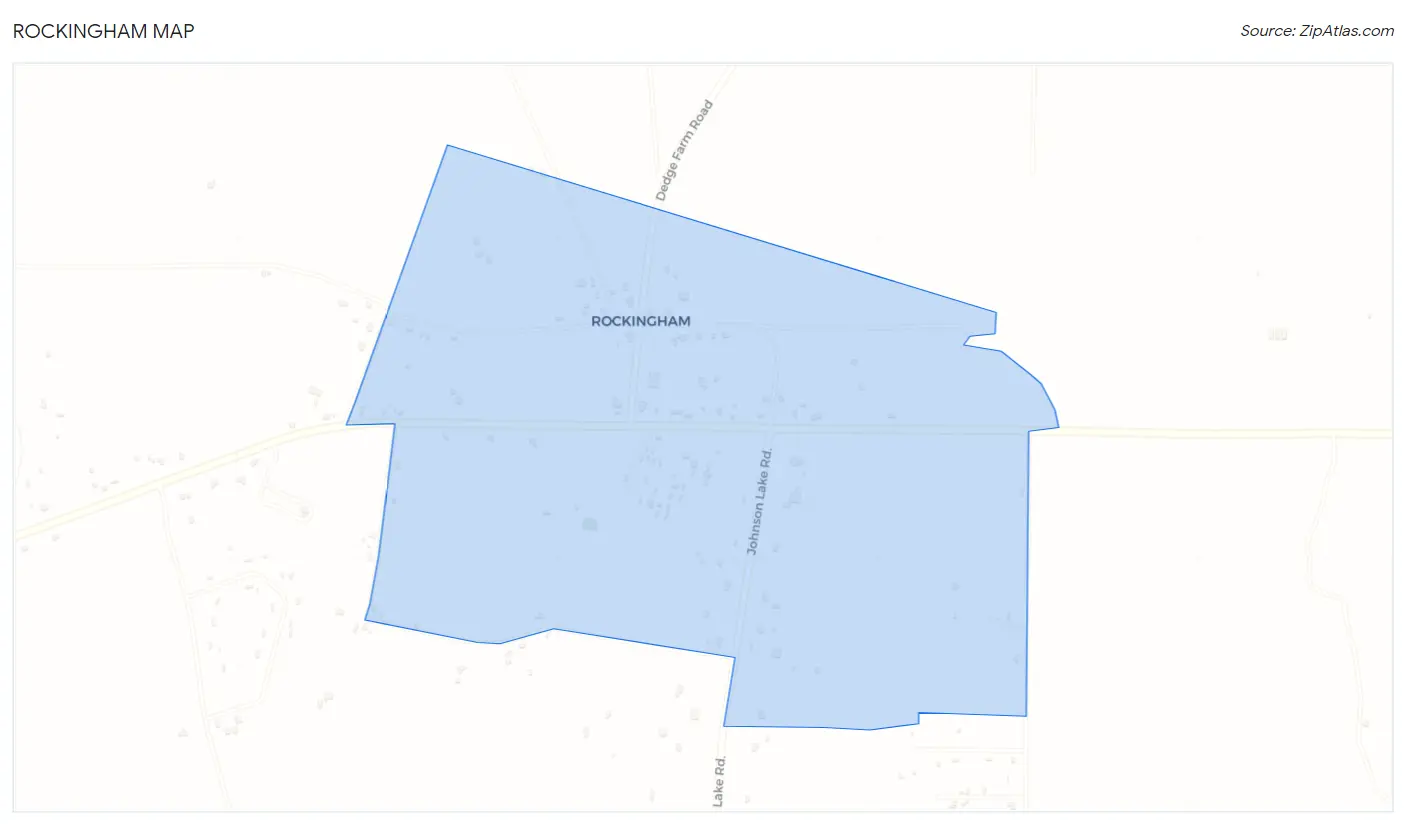
Rockingham Overview
$23,313
PER CAPITA INCOME
$19,399
AVG HOUSEHOLD INCOME
0.49
INEQUALITY / GINI INDEX
151
TOTAL POPULATION
90
MALE POPULATION
61
FEMALE POPULATION
147.54
MALES / 100 FEMALES
67.78
FEMALES / 100 MALES
68.4
MEDIAN AGE
1.7
AVG FAMILY SIZE
1.5
AVG HOUSEHOLD SIZE
77
LABOR FORCE [ PEOPLE ]
51.0%
PERCENT IN LABOR FORCE
Income in Rockingham
Income Overview in Rockingham
| Characteristic | Number | Measure |
| Per Capita Income | 151 | $23,313 |
| Median Family Income | 73 | $0 |
| Mean Family Income | 73 | $44,559 |
| Median Household Income | 99 | $19,399 |
| Mean Household Income | 99 | $37,790 |
| Income Deficit | 73 | $0 |
| Wage / Income Gap (%) | 151 | 0.00% |
| Wage / Income Gap ($) | 151 | 100.00¢ per $1 |
| Gini / Inequality Index | 151 | 0.49 |
Earnings by Sex in Rockingham
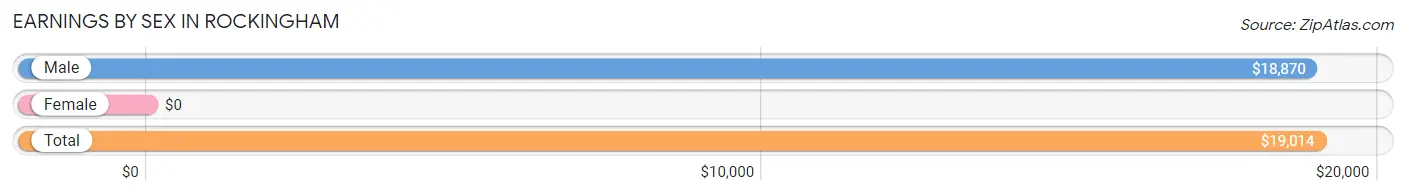
| Sex | Number | Average Earnings |
| Male | 71 (92.2%) | $18,870 |
| Female | 6 (7.8%) | $0 |
| Total | 77 (100.0%) | $19,014 |
Earnings by Sex by Income Bracket in Rockingham
The most common earnings brackets in Rockingham are $17,500 to $19,999 for men (52 | 73.2%) and $25,000 to $29,999 for women (6 | 100.0%).
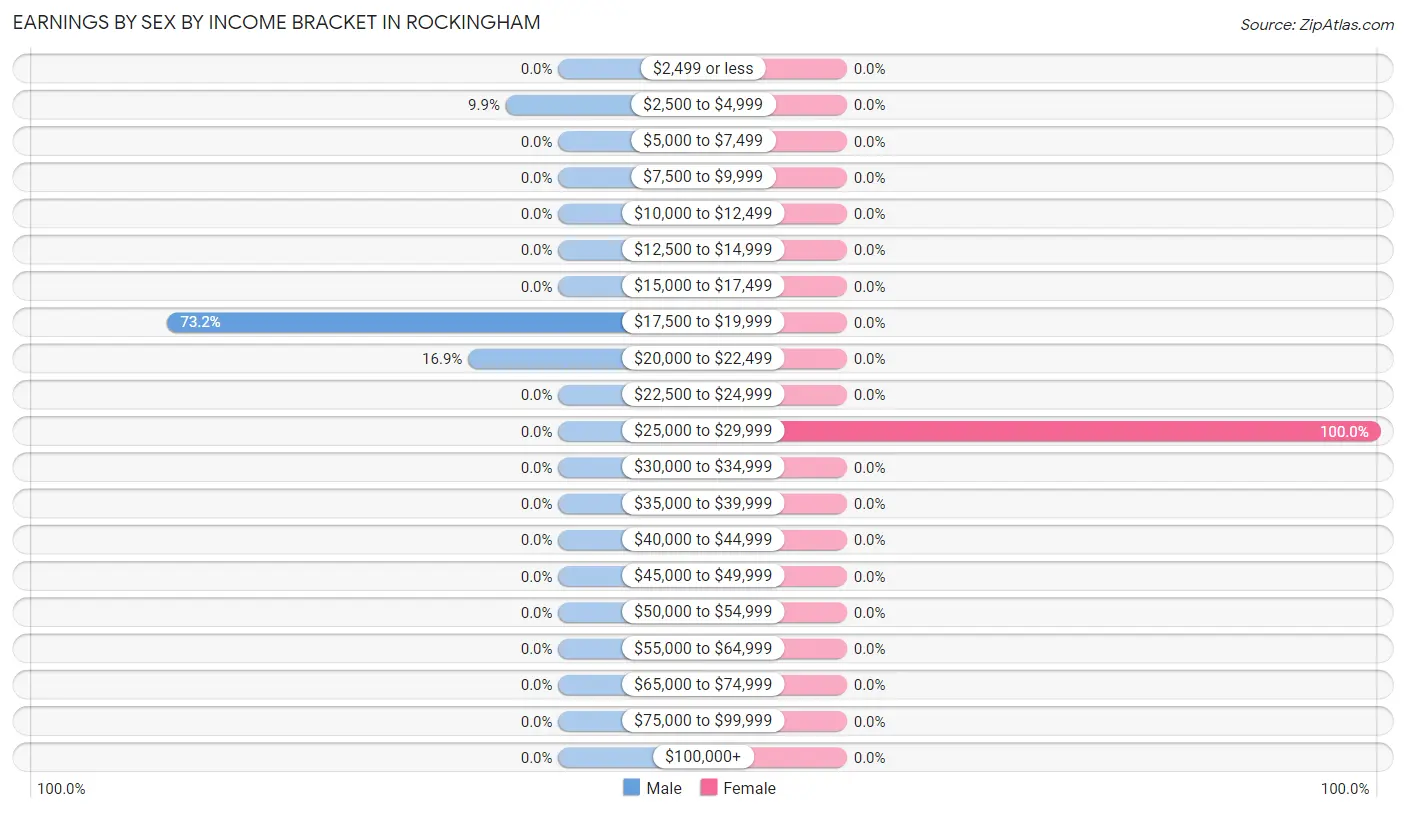
| Income | Male | Female |
| $2,499 or less | 0 (0.0%) | 0 (0.0%) |
| $2,500 to $4,999 | 7 (9.9%) | 0 (0.0%) |
| $5,000 to $7,499 | 0 (0.0%) | 0 (0.0%) |
| $7,500 to $9,999 | 0 (0.0%) | 0 (0.0%) |
| $10,000 to $12,499 | 0 (0.0%) | 0 (0.0%) |
| $12,500 to $14,999 | 0 (0.0%) | 0 (0.0%) |
| $15,000 to $17,499 | 0 (0.0%) | 0 (0.0%) |
| $17,500 to $19,999 | 52 (73.2%) | 0 (0.0%) |
| $20,000 to $22,499 | 12 (16.9%) | 0 (0.0%) |
| $22,500 to $24,999 | 0 (0.0%) | 0 (0.0%) |
| $25,000 to $29,999 | 0 (0.0%) | 6 (100.0%) |
| $30,000 to $34,999 | 0 (0.0%) | 0 (0.0%) |
| $35,000 to $39,999 | 0 (0.0%) | 0 (0.0%) |
| $40,000 to $44,999 | 0 (0.0%) | 0 (0.0%) |
| $45,000 to $49,999 | 0 (0.0%) | 0 (0.0%) |
| $50,000 to $54,999 | 0 (0.0%) | 0 (0.0%) |
| $55,000 to $64,999 | 0 (0.0%) | 0 (0.0%) |
| $65,000 to $74,999 | 0 (0.0%) | 0 (0.0%) |
| $75,000 to $99,999 | 0 (0.0%) | 0 (0.0%) |
| $100,000+ | 0 (0.0%) | 0 (0.0%) |
| Total | 71 (100.0%) | 6 (100.0%) |
Earnings by Sex by Educational Attainment in Rockingham
| Educational Attainment | Male Income | Female Income |
| Less than High School | - | - |
| High School Diploma | - | - |
| College or Associate's Degree | - | - |
| Bachelor's Degree | - | - |
| Graduate Degree | - | - |
| Total | $18,870 | $0 |
Family Income in Rockingham
Family Income Brackets in Rockingham
According to the Rockingham family income data, there are 52 families falling into the $15,000 to $24,999 income range, which is the most common income bracket and makes up 71.2% of all families.
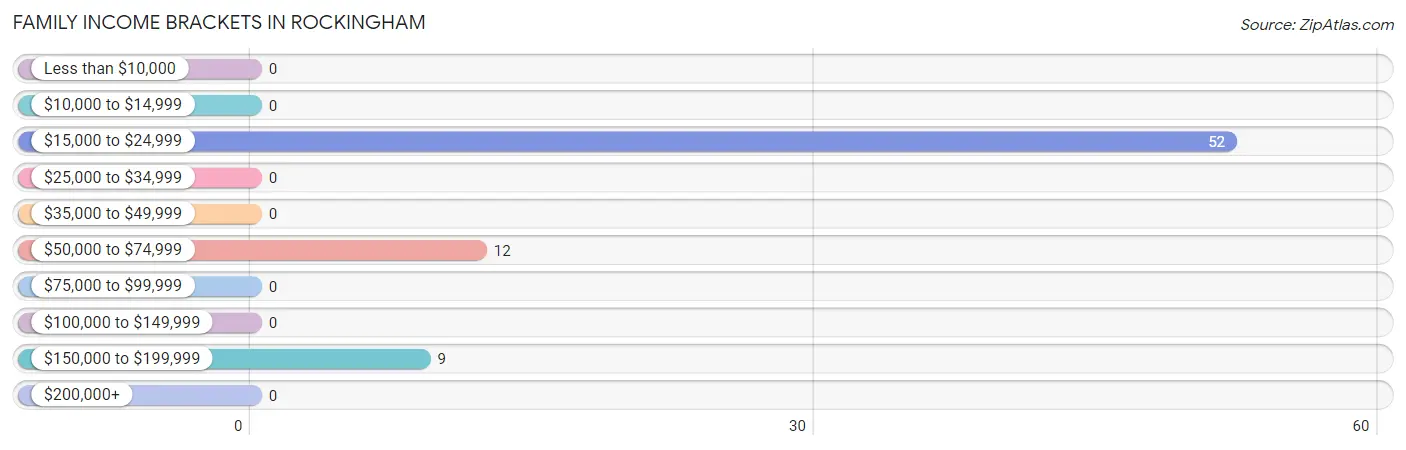
| Income Bracket | # Families | % Families |
| Less than $10,000 | 0 | 0.0% |
| $10,000 to $14,999 | 0 | 0.0% |
| $15,000 to $24,999 | 52 | 71.2% |
| $25,000 to $34,999 | 0 | 0.0% |
| $35,000 to $49,999 | 0 | 0.0% |
| $50,000 to $74,999 | 12 | 16.4% |
| $75,000 to $99,999 | 0 | 0.0% |
| $100,000 to $149,999 | 0 | 0.0% |
| $150,000 to $199,999 | 9 | 12.3% |
| $200,000+ | 0 | 0.0% |
Family Income by Famaliy Size in Rockingham
| Income Bracket | # Families | Median Income |
| 2-Person Families | 64 (87.7%) | $0 |
| 3-Person Families | 9 (12.3%) | $0 |
| 4-Person Families | 0 (0.0%) | $0 |
| 5-Person Families | 0 (0.0%) | $0 |
| 6-Person Families | 0 (0.0%) | $0 |
| 7+ Person Families | 0 (0.0%) | $0 |
| Total | 73 (100.0%) | $0 |
Family Income by Number of Earners in Rockingham
| Number of Earners | # Families | Median Income |
| No Earners | 9 (12.3%) | $0 |
| 1 Earner | 52 (71.2%) | $0 |
| 2 Earners | 12 (16.4%) | $0 |
| 3+ Earners | 0 (0.0%) | $0 |
| Total | 73 (100.0%) | $0 |
Household Income in Rockingham
Household Income Brackets in Rockingham
With 59 households falling in the category, the $15,000 to $24,999 income range is the most frequent in Rockingham, accounting for 59.6% of all households.
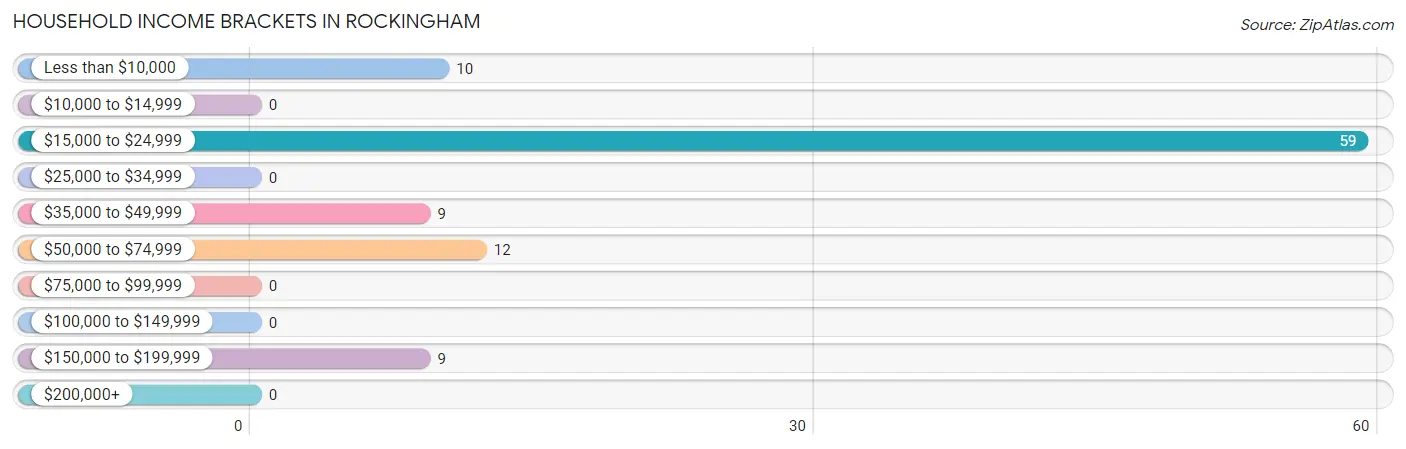
| Income Bracket | # Households | % Households |
| Less than $10,000 | 10 | 10.1% |
| $10,000 to $14,999 | 0 | 0.0% |
| $15,000 to $24,999 | 59 | 59.6% |
| $25,000 to $34,999 | 0 | 0.0% |
| $35,000 to $49,999 | 9 | 9.1% |
| $50,000 to $74,999 | 12 | 12.1% |
| $75,000 to $99,999 | 0 | 0.0% |
| $100,000 to $149,999 | 0 | 0.0% |
| $150,000 to $199,999 | 9 | 9.1% |
| $200,000+ | 0 | 0.0% |
Household Income by Householder Age in Rockingham
| Income Bracket | # Households | Median Income |
| 15 to 24 Years | 0 (0.0%) | $0 |
| 25 to 44 Years | 0 (0.0%) | $0 |
| 45 to 64 Years | 10 (10.1%) | $0 |
| 65+ Years | 89 (89.9%) | $0 |
| Total | 99 (100.0%) | $19,399 |
Poverty in Rockingham
Income Below Poverty by Sex and Age in Rockingham
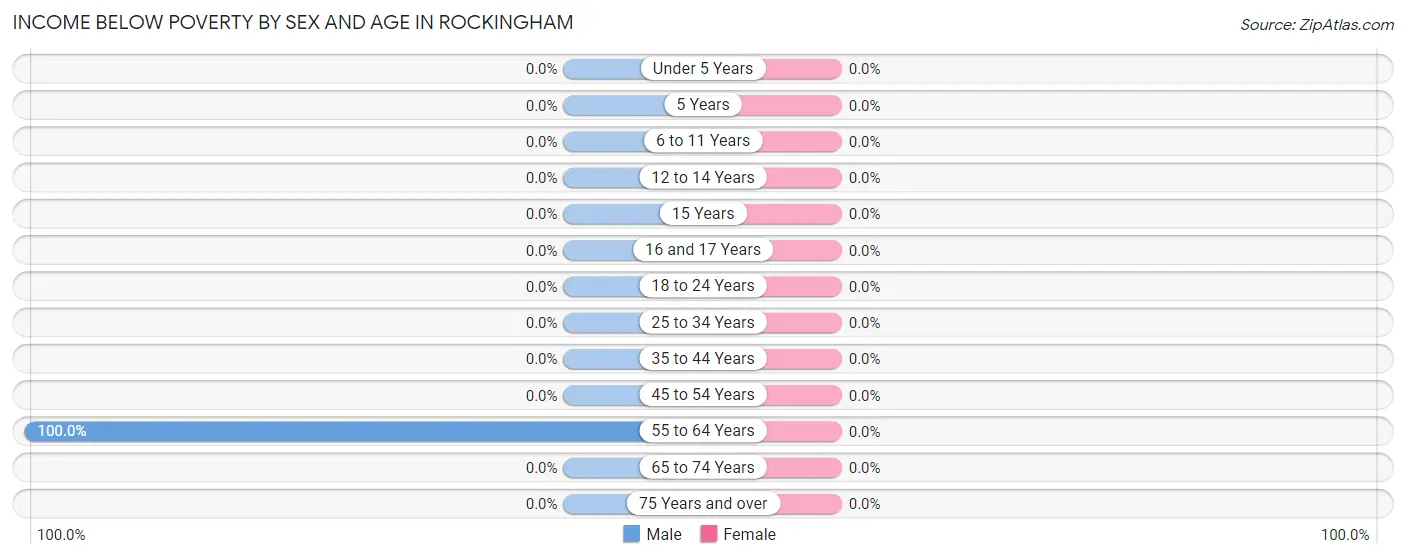
| Age Bracket | Male | Female |
| Under 5 Years | 0 (0.0%) | 0 (0.0%) |
| 5 Years | 0 (0.0%) | 0 (0.0%) |
| 6 to 11 Years | 0 (0.0%) | 0 (0.0%) |
| 12 to 14 Years | 0 (0.0%) | 0 (0.0%) |
| 15 Years | 0 (0.0%) | 0 (0.0%) |
| 16 and 17 Years | 0 (0.0%) | 0 (0.0%) |
| 18 to 24 Years | 0 (0.0%) | 0 (0.0%) |
| 25 to 34 Years | 0 (0.0%) | 0 (0.0%) |
| 35 to 44 Years | 0 (0.0%) | 0 (0.0%) |
| 45 to 54 Years | 0 (0.0%) | 0 (0.0%) |
| 55 to 64 Years | 10 (100.0%) | 0 (0.0%) |
| 65 to 74 Years | 0 (0.0%) | 0 (0.0%) |
| 75 Years and over | 0 (0.0%) | 0 (0.0%) |
| Total | 10 (11.1%) | 0 (0.0%) |
Income Above Poverty by Sex and Age in Rockingham
According to the poverty statistics in Rockingham, males aged 65 to 74 years and females aged 35 to 44 years are the age groups that are most secure financially, with 100.0% of males and 100.0% of females in these age groups living above the poverty line.
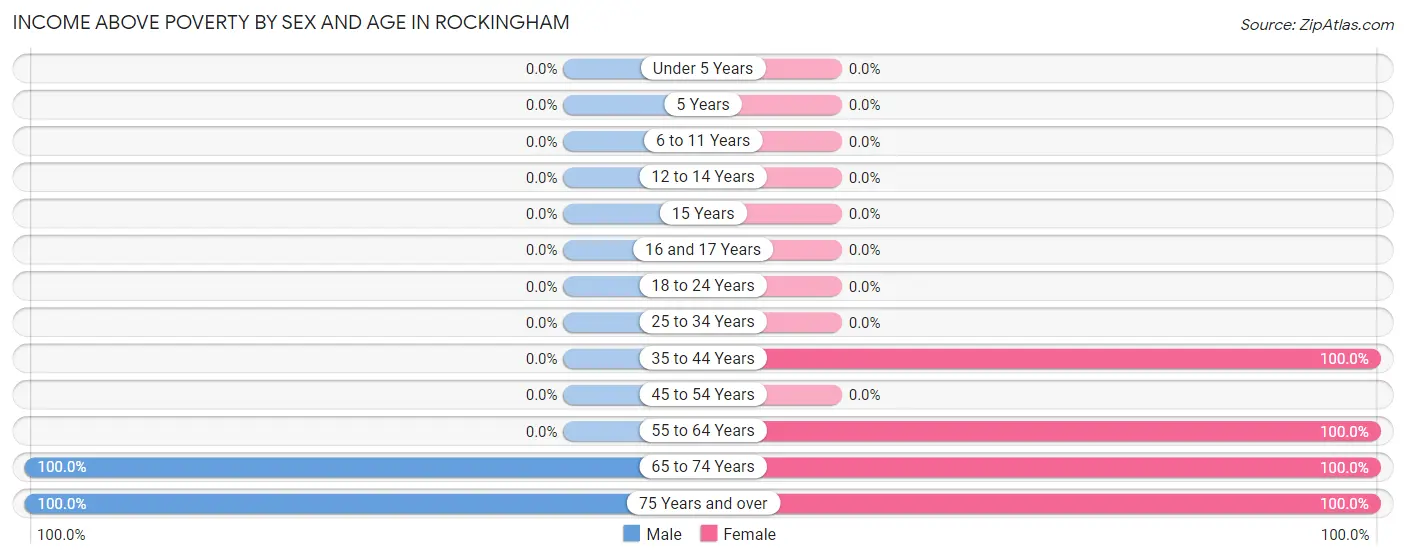
| Age Bracket | Male | Female |
| Under 5 Years | 0 (0.0%) | 0 (0.0%) |
| 5 Years | 0 (0.0%) | 0 (0.0%) |
| 6 to 11 Years | 0 (0.0%) | 0 (0.0%) |
| 12 to 14 Years | 0 (0.0%) | 0 (0.0%) |
| 15 Years | 0 (0.0%) | 0 (0.0%) |
| 16 and 17 Years | 0 (0.0%) | 0 (0.0%) |
| 18 to 24 Years | 0 (0.0%) | 0 (0.0%) |
| 25 to 34 Years | 0 (0.0%) | 0 (0.0%) |
| 35 to 44 Years | 0 (0.0%) | 10 (100.0%) |
| 45 to 54 Years | 0 (0.0%) | 0 (0.0%) |
| 55 to 64 Years | 0 (0.0%) | 34 (100.0%) |
| 65 to 74 Years | 73 (100.0%) | 8 (100.0%) |
| 75 Years and over | 7 (100.0%) | 9 (100.0%) |
| Total | 80 (88.9%) | 61 (100.0%) |
Income Below Poverty Among Married-Couple Families in Rockingham
| Children | Above Poverty | Below Poverty |
| No Children | 21 (100.0%) | 0 (0.0%) |
| 1 or 2 Children | 0 (0.0%) | 0 (0.0%) |
| 3 or 4 Children | 0 (0.0%) | 0 (0.0%) |
| 5 or more Children | 0 (0.0%) | 0 (0.0%) |
| Total | 21 (100.0%) | 0 (0.0%) |
Income Below Poverty Among Single-Parent Households in Rockingham
| Children | Single Father | Single Mother |
| No Children | 0 (0.0%) | 0 (0.0%) |
| 1 or 2 Children | 0 (0.0%) | 0 (0.0%) |
| 3 or 4 Children | 0 (0.0%) | 0 (0.0%) |
| 5 or more Children | 0 (0.0%) | 0 (0.0%) |
| Total | 0 (0.0%) | 0 (0.0%) |
Income Below Poverty Among Married-Couple vs Single-Parent Households in Rockingham
| Children | Married-Couple Families | Single-Parent Households |
| No Children | 0 (0.0%) | 0 (0.0%) |
| 1 or 2 Children | 0 (0.0%) | 0 (0.0%) |
| 3 or 4 Children | 0 (0.0%) | 0 (0.0%) |
| 5 or more Children | 0 (0.0%) | 0 (0.0%) |
| Total | 0 (0.0%) | 0 (0.0%) |
Race in Rockingham
The most populous races in Rockingham are White / Caucasian (99 | 65.6%), Hispanic or Latino (52 | 34.4%), and Two or more Races (52 | 34.4%).
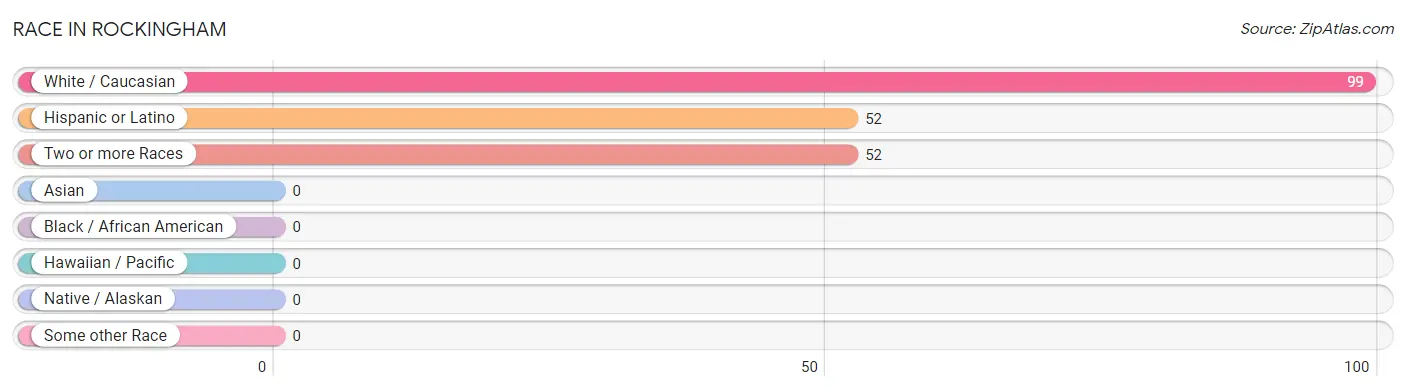
| Race | # Population | % Population |
| Asian | 0 | 0.0% |
| Black / African American | 0 | 0.0% |
| Hawaiian / Pacific | 0 | 0.0% |
| Hispanic or Latino | 52 | 34.4% |
| Native / Alaskan | 0 | 0.0% |
| White / Caucasian | 99 | 65.6% |
| Two or more Races | 52 | 34.4% |
| Some other Race | 0 | 0.0% |
| Total | 151 | 100.0% |
Ancestry in Rockingham
The most populous ancestries reported in Rockingham are Mexican (52 | 34.4%), Irish (28 | 18.5%), and English (18 | 11.9%), together accounting for 64.9% of all Rockingham residents.
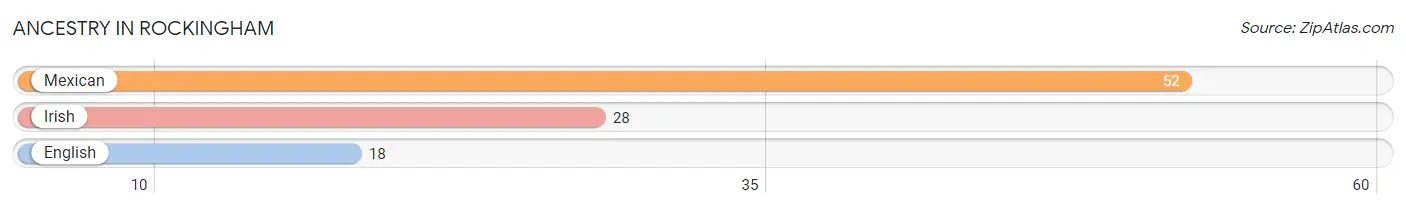
| Ancestry | # Population | % Population |
| English | 18 | 11.9% |
| Irish | 28 | 18.5% |
| Mexican | 52 | 34.4% | View All 3 Rows |
Immigrants in Rockingham
The most numerous immigrant groups reported in Rockingham came from Central America (52 | 34.4%), Latin America (52 | 34.4%), and Mexico (52 | 34.4%), together accounting for 103.3% of all Rockingham residents.
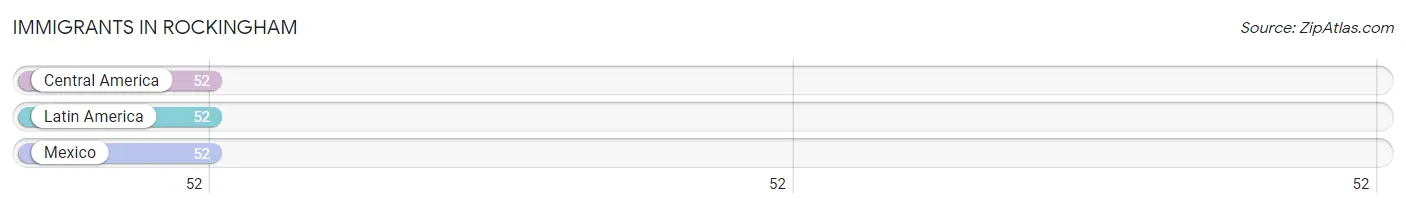
| Immigration Origin | # Population | % Population |
| Central America | 52 | 34.4% |
| Latin America | 52 | 34.4% |
| Mexico | 52 | 34.4% | View All 3 Rows |
Sex and Age in Rockingham
Sex and Age in Rockingham
The most populous age groups in Rockingham are 65 to 69 Years (52 | 57.8%) for men and 60 to 64 Years (28 | 45.9%) for women.
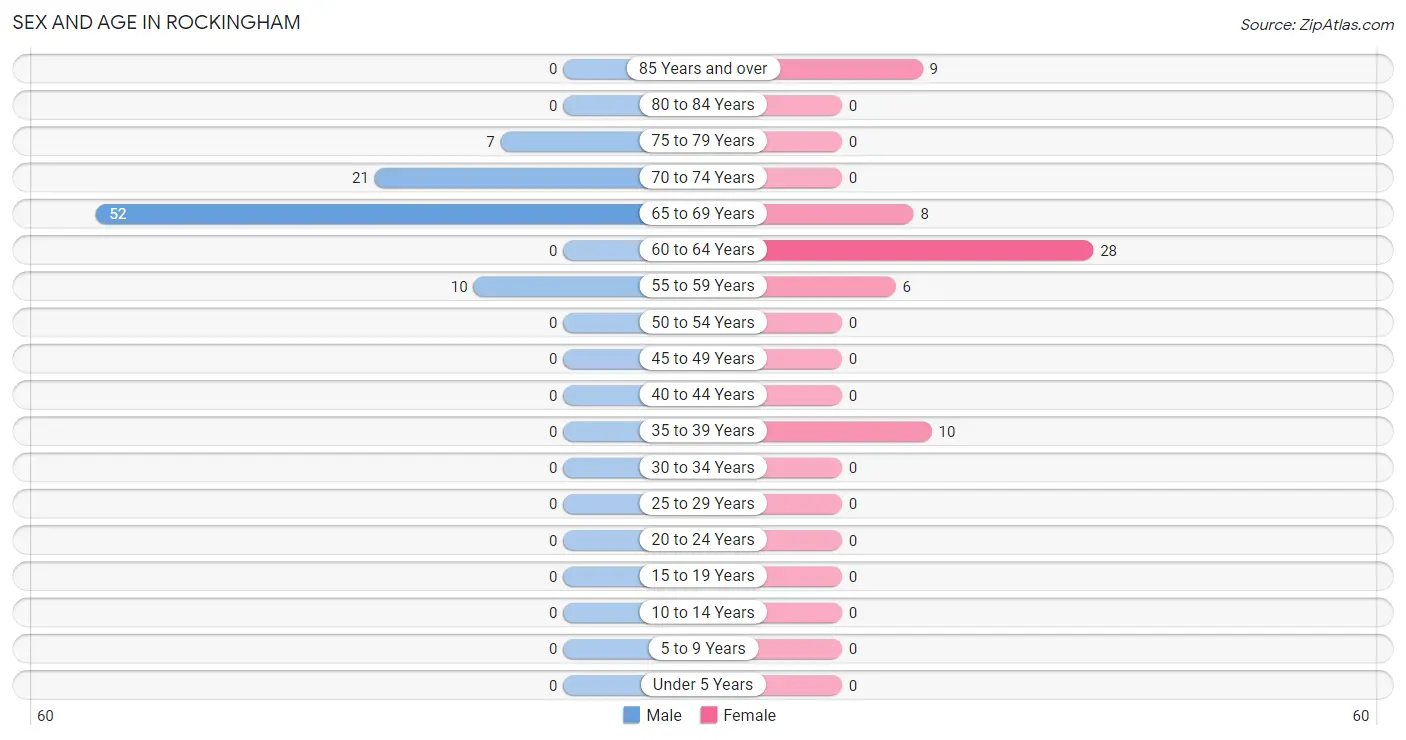
| Age Bracket | Male | Female |
| Under 5 Years | 0 (0.0%) | 0 (0.0%) |
| 5 to 9 Years | 0 (0.0%) | 0 (0.0%) |
| 10 to 14 Years | 0 (0.0%) | 0 (0.0%) |
| 15 to 19 Years | 0 (0.0%) | 0 (0.0%) |
| 20 to 24 Years | 0 (0.0%) | 0 (0.0%) |
| 25 to 29 Years | 0 (0.0%) | 0 (0.0%) |
| 30 to 34 Years | 0 (0.0%) | 0 (0.0%) |
| 35 to 39 Years | 0 (0.0%) | 10 (16.4%) |
| 40 to 44 Years | 0 (0.0%) | 0 (0.0%) |
| 45 to 49 Years | 0 (0.0%) | 0 (0.0%) |
| 50 to 54 Years | 0 (0.0%) | 0 (0.0%) |
| 55 to 59 Years | 10 (11.1%) | 6 (9.8%) |
| 60 to 64 Years | 0 (0.0%) | 28 (45.9%) |
| 65 to 69 Years | 52 (57.8%) | 8 (13.1%) |
| 70 to 74 Years | 21 (23.3%) | 0 (0.0%) |
| 75 to 79 Years | 7 (7.8%) | 0 (0.0%) |
| 80 to 84 Years | 0 (0.0%) | 0 (0.0%) |
| 85 Years and over | 0 (0.0%) | 9 (14.7%) |
| Total | 90 (100.0%) | 61 (100.0%) |
Families and Households in Rockingham
Median Family Size in Rockingham
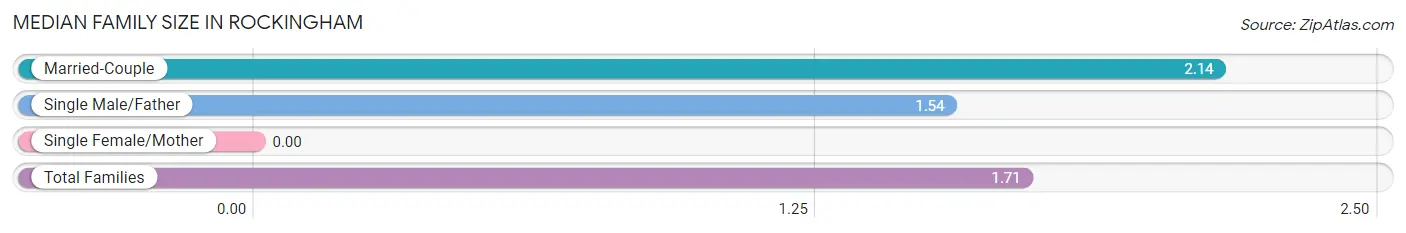
| Family Type | # Families | Family Size |
| Married-Couple | 21 (28.8%) | 2.14 |
| Single Male/Father | 52 (71.2%) | 1.54 |
| Single Female/Mother | 0 (0.0%) | - |
| Total Families | 73 (100.0%) | 1.71 |
Median Household Size in Rockingham
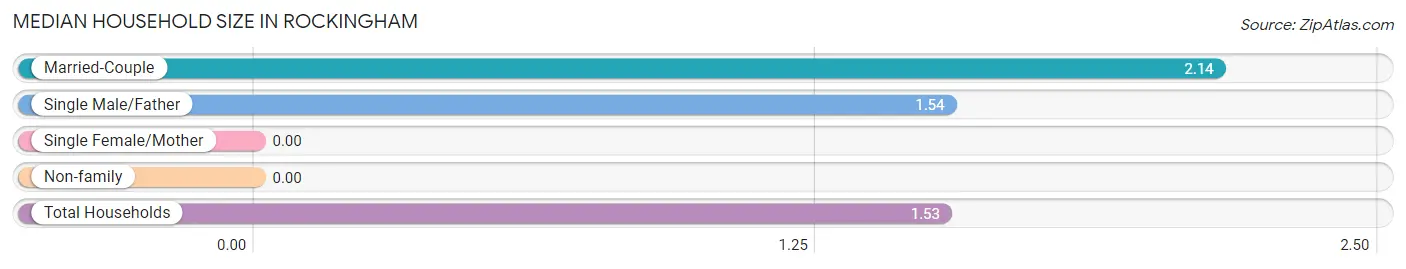
| Household Type | # Households | Household Size |
| Married-Couple | 21 (21.2%) | 2.14 |
| Single Male/Father | 52 (52.5%) | 1.54 |
| Single Female/Mother | 0 (0.0%) | - |
| Non-family | 26 (26.3%) | - |
| Total Households | 99 (100.0%) | 1.53 |
Household Size by Marriage Status in Rockingham
Out of a total of 99 households in Rockingham, 73 (73.7%) are family households, while 26 (26.3%) are nonfamily households. The most numerous type of family households are 2-person households, comprising 64, and the most common type of nonfamily households are 1-person households, comprising 26.
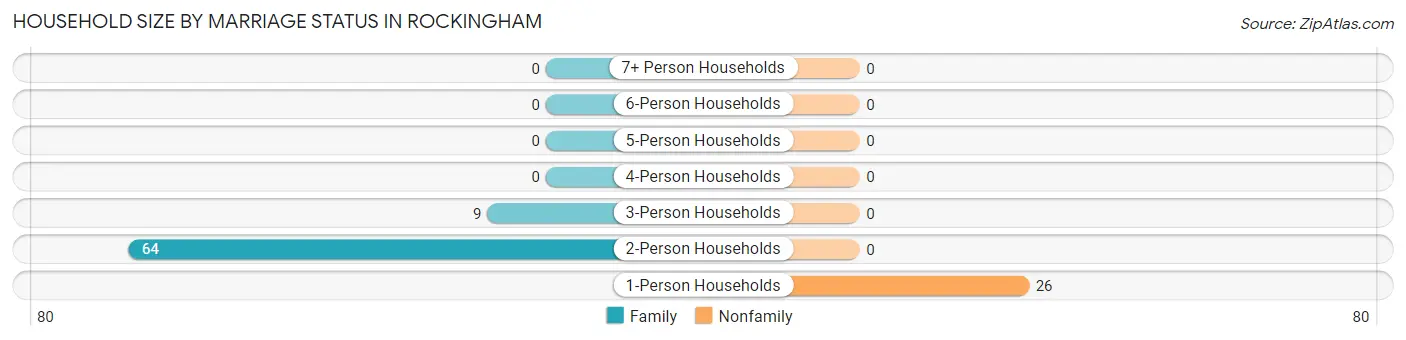
| Household Size | Family Households | Nonfamily Households |
| 1-Person Households | - | 26 (26.3%) |
| 2-Person Households | 64 (64.6%) | 0 (0.0%) |
| 3-Person Households | 9 (9.1%) | 0 (0.0%) |
| 4-Person Households | 0 (0.0%) | 0 (0.0%) |
| 5-Person Households | 0 (0.0%) | 0 (0.0%) |
| 6-Person Households | 0 (0.0%) | 0 (0.0%) |
| 7+ Person Households | 0 (0.0%) | 0 (0.0%) |
| Total | 73 (73.7%) | 26 (26.3%) |
Female Fertility in Rockingham
Fertility by Age in Rockingham
| Age Bracket | Women with Births | Births / 1,000 Women |
| 15 to 19 years | 0 (0.0%) | 0.0 |
| 20 to 34 years | 0 (0.0%) | 0.0 |
| 35 to 50 years | 0 (0.0%) | 0.0 |
| Total | 0 (0.0%) | 0.0 |
Fertility by Age by Marriage Status in Rockingham
| Age Bracket | Married | Unmarried |
| 15 to 19 years | 0 (0.0%) | 0 (0.0%) |
| 20 to 34 years | 0 (0.0%) | 0 (0.0%) |
| 35 to 50 years | 0 (0.0%) | 0 (0.0%) |
| Total | 0 (0.0%) | 0 (0.0%) |
Fertility by Education in Rockingham
| Educational Attainment | Women with Births | Births / 1,000 Women |
| Less than High School | 0 (0.0%) | 0.0 |
| High School Diploma | 0 (0.0%) | 0.0 |
| College or Associate's Degree | 0 (0.0%) | 0.0 |
| Bachelor's Degree | 0 (0.0%) | 0.0 |
| Graduate Degree | 0 (0.0%) | 0.0 |
| Total | 0 (0.0%) | 0.0 |
Fertility by Education by Marriage Status in Rockingham
| Educational Attainment | Married | Unmarried |
| Less than High School | 0 (0.0%) | 0 (0.0%) |
| High School Diploma | 0 (0.0%) | 0 (0.0%) |
| College or Associate's Degree | 0 (0.0%) | 0 (0.0%) |
| Bachelor's Degree | 0 (0.0%) | 0 (0.0%) |
| Graduate Degree | 0 (0.0%) | 0 (0.0%) |
| Total | 0 (0.0%) | 0 (0.0%) |
Employment Characteristics in Rockingham
Employment by Class of Employer in Rockingham
Among the 77 employed individuals in Rockingham, private company employees (65 | 84.4%), and local government employees (12 | 15.6%) make up the most common classes of employment.
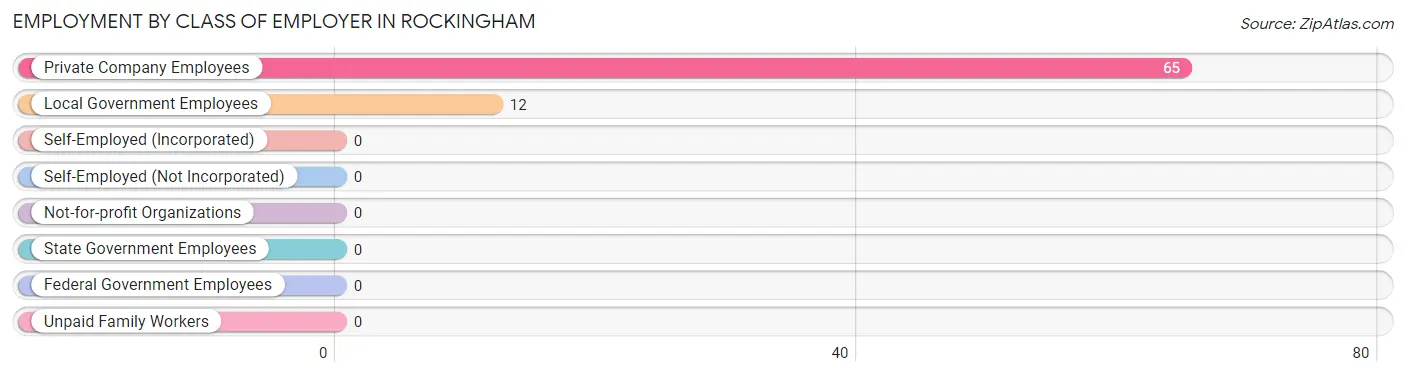
| Employer Class | # Employees | % Employees |
| Private Company Employees | 65 | 84.4% |
| Self-Employed (Incorporated) | 0 | 0.0% |
| Self-Employed (Not Incorporated) | 0 | 0.0% |
| Not-for-profit Organizations | 0 | 0.0% |
| Local Government Employees | 12 | 15.6% |
| State Government Employees | 0 | 0.0% |
| Federal Government Employees | 0 | 0.0% |
| Unpaid Family Workers | 0 | 0.0% |
| Total | 77 | 100.0% |
Employment Status by Age in Rockingham
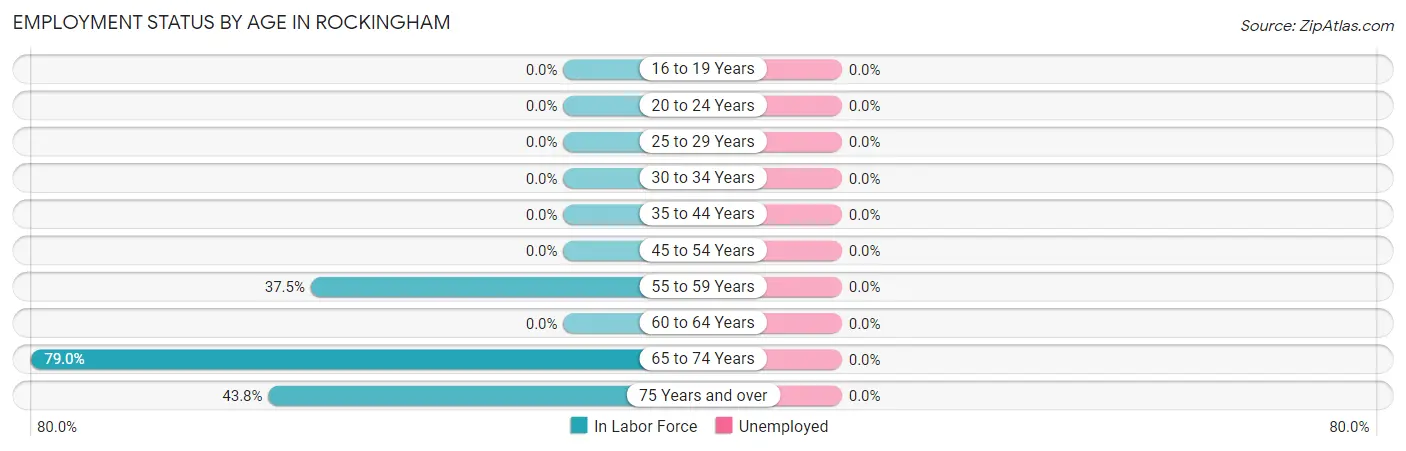
| Age Bracket | In Labor Force | Unemployed |
| 16 to 19 Years | 0 (0.0%) | 0 (0.0%) |
| 20 to 24 Years | 0 (0.0%) | 0 (0.0%) |
| 25 to 29 Years | 0 (0.0%) | 0 (0.0%) |
| 30 to 34 Years | 0 (0.0%) | 0 (0.0%) |
| 35 to 44 Years | 0 (0.0%) | 0 (0.0%) |
| 45 to 54 Years | 0 (0.0%) | 0 (0.0%) |
| 55 to 59 Years | 6 (37.5%) | 0 (0.0%) |
| 60 to 64 Years | 0 (0.0%) | 0 (0.0%) |
| 65 to 74 Years | 64 (79.0%) | 0 (0.0%) |
| 75 Years and over | 7 (43.8%) | 0 (0.0%) |
| Total | 77 (51.0%) | 0 (0.0%) |
Employment Status by Educational Attainment in Rockingham
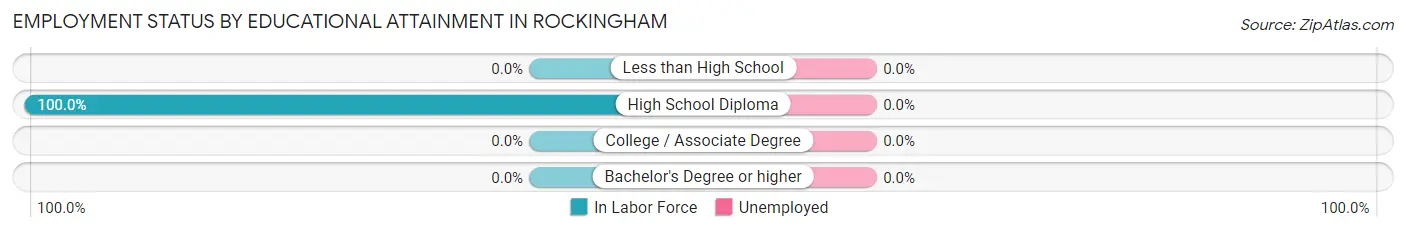
| Educational Attainment | In Labor Force | Unemployed |
| Less than High School | 0 (0.0%) | 0 (0.0%) |
| High School Diploma | 6 (100.0%) | 0 (0.0%) |
| College / Associate Degree | 0 (0.0%) | 0 (0.0%) |
| Bachelor's Degree or higher | 0 (0.0%) | 0 (0.0%) |
| Total | 6 (11.1%) | 0 (0.0%) |
Employment Occupations by Sex in Rockingham
Management, Business, Science and Arts Occupations
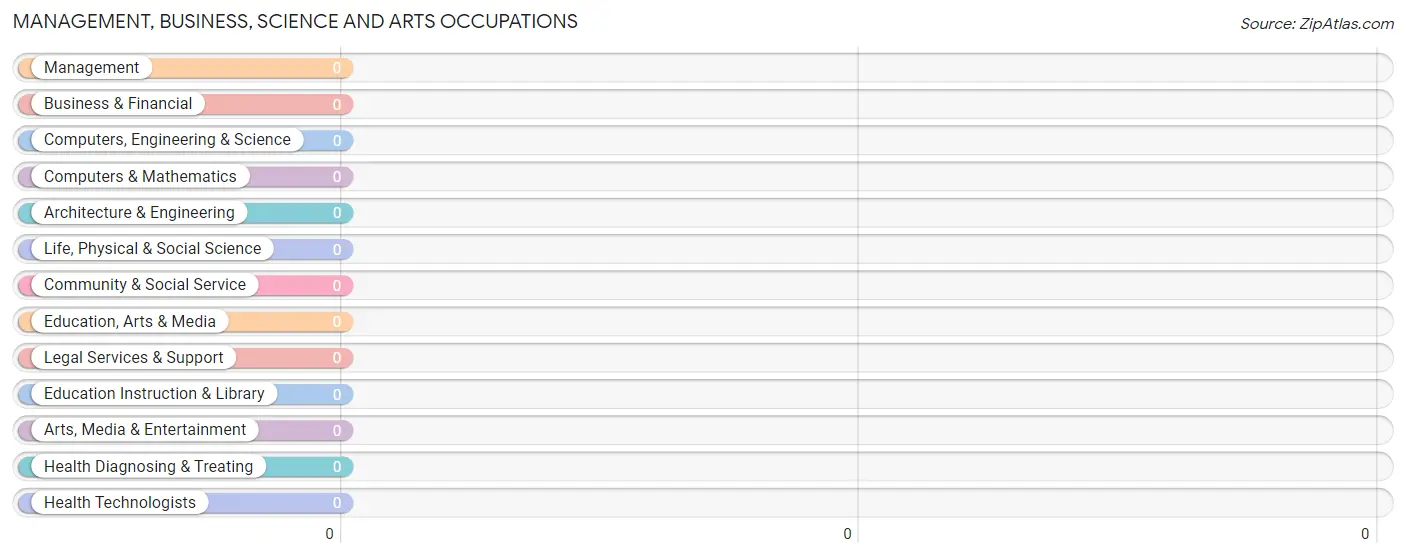
Management, Business, Science and Arts Occupations by Sex
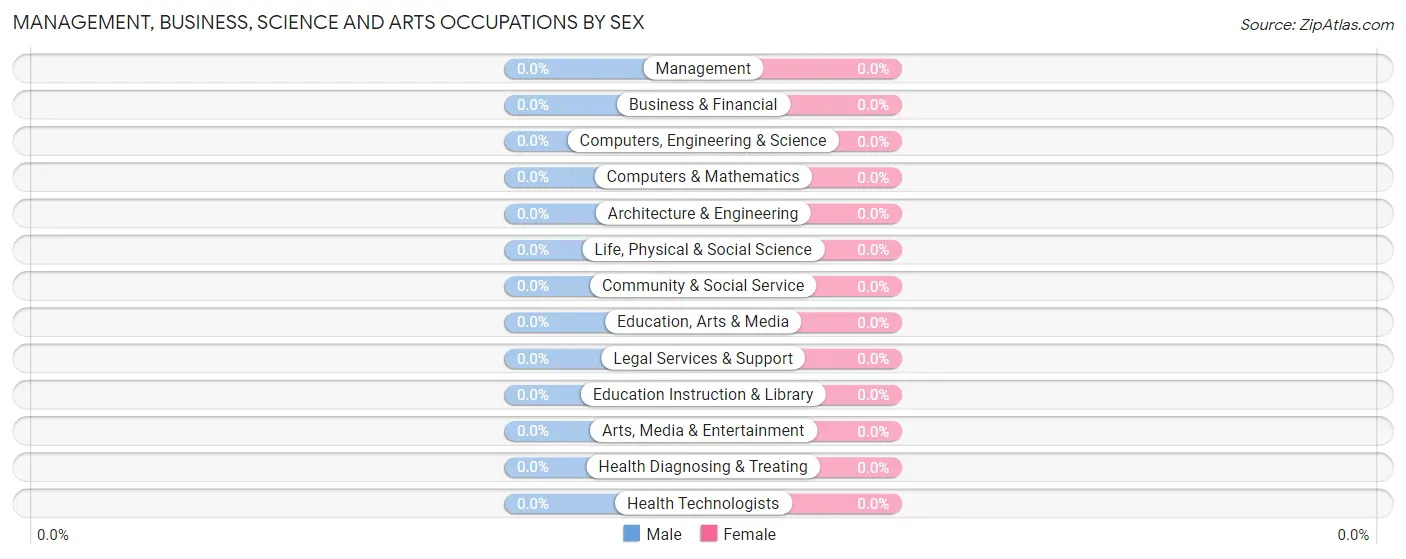
| Occupation | Male | Female |
| Management | 0 (0.0%) | 0 (0.0%) |
| Business & Financial | 0 (0.0%) | 0 (0.0%) |
| Computers, Engineering & Science | 0 (0.0%) | 0 (0.0%) |
| Computers & Mathematics | 0 (0.0%) | 0 (0.0%) |
| Architecture & Engineering | 0 (0.0%) | 0 (0.0%) |
| Life, Physical & Social Science | 0 (0.0%) | 0 (0.0%) |
| Community & Social Service | 0 (0.0%) | 0 (0.0%) |
| Education, Arts & Media | 0 (0.0%) | 0 (0.0%) |
| Legal Services & Support | 0 (0.0%) | 0 (0.0%) |
| Education Instruction & Library | 0 (0.0%) | 0 (0.0%) |
| Arts, Media & Entertainment | 0 (0.0%) | 0 (0.0%) |
| Health Diagnosing & Treating | 0 (0.0%) | 0 (0.0%) |
| Health Technologists | 0 (0.0%) | 0 (0.0%) |
| Total (Category) | 0 (0.0%) | 0 (0.0%) |
| Total (Overall) | 71 (92.2%) | 6 (7.8%) |
Services Occupations
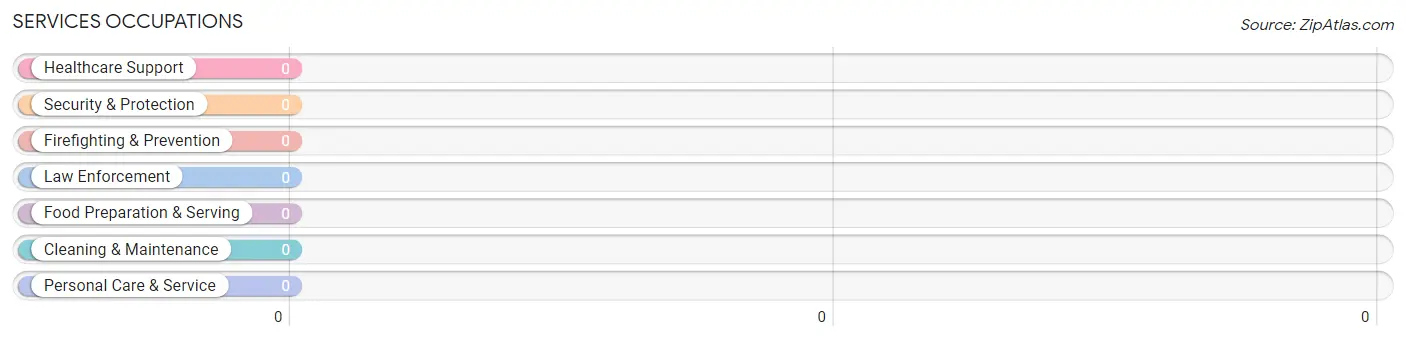
Services Occupations by Sex
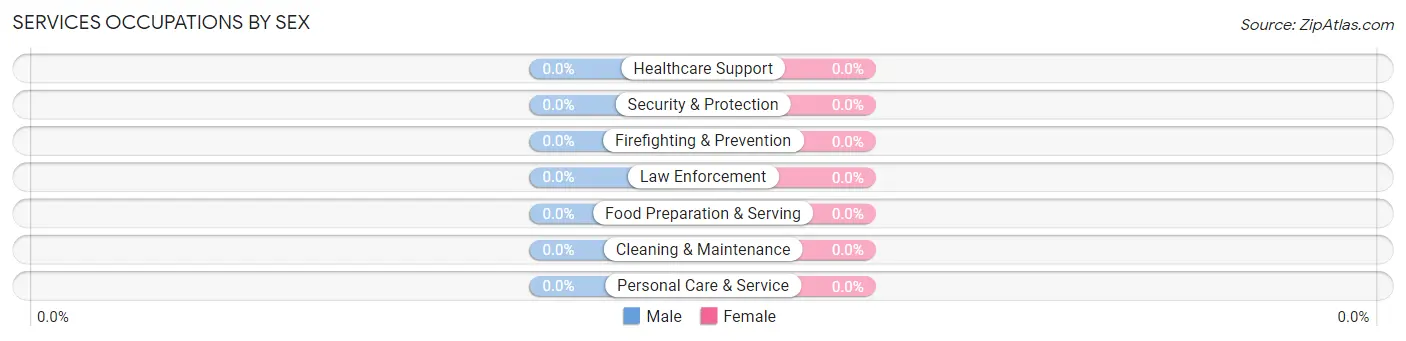
| Occupation | Male | Female |
| Healthcare Support | 0 (0.0%) | 0 (0.0%) |
| Security & Protection | 0 (0.0%) | 0 (0.0%) |
| Firefighting & Prevention | 0 (0.0%) | 0 (0.0%) |
| Law Enforcement | 0 (0.0%) | 0 (0.0%) |
| Food Preparation & Serving | 0 (0.0%) | 0 (0.0%) |
| Cleaning & Maintenance | 0 (0.0%) | 0 (0.0%) |
| Personal Care & Service | 0 (0.0%) | 0 (0.0%) |
| Total (Category) | 0 (0.0%) | 0 (0.0%) |
| Total (Overall) | 71 (92.2%) | 6 (7.8%) |
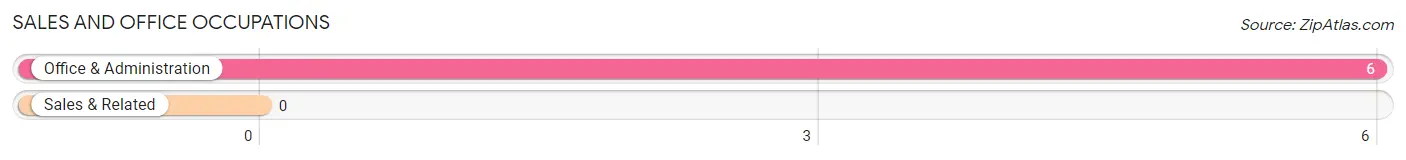
Sales and Office Occupations
The most common Sales and Office occupations in Rockingham are , and Office & Administration (6 | 7.8%).
Sales and Office Occupations by Sex
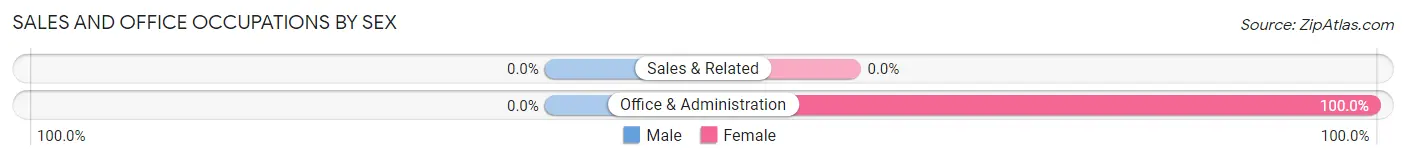
| Occupation | Male | Female |
| Sales & Related | 0 (0.0%) | 0 (0.0%) |
| Office & Administration | 0 (0.0%) | 6 (100.0%) |
| Total (Category) | 0 (0.0%) | 6 (100.0%) |
| Total (Overall) | 71 (92.2%) | 6 (7.8%) |
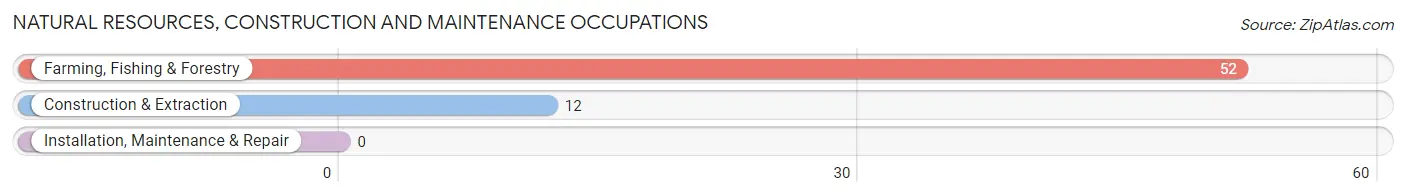
Natural Resources, Construction and Maintenance Occupations
The most common Natural Resources, Construction and Maintenance occupations in Rockingham are Farming, Fishing & Forestry (52 | 67.5%), and Construction & Extraction (12 | 15.6%).
Natural Resources, Construction and Maintenance Occupations by Sex
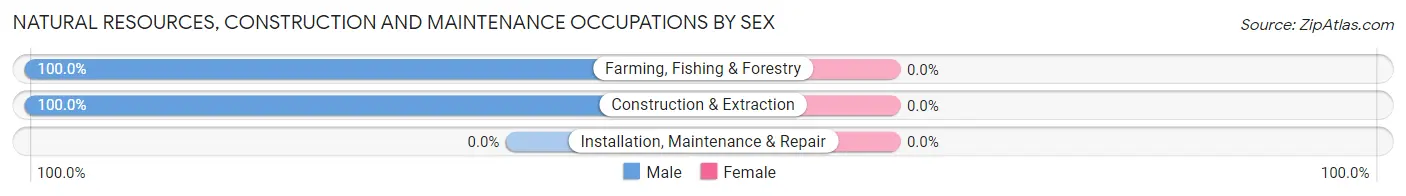
| Occupation | Male | Female |
| Farming, Fishing & Forestry | 52 (100.0%) | 0 (0.0%) |
| Construction & Extraction | 12 (100.0%) | 0 (0.0%) |
| Installation, Maintenance & Repair | 0 (0.0%) | 0 (0.0%) |
| Total (Category) | 64 (100.0%) | 0 (0.0%) |
| Total (Overall) | 71 (92.2%) | 6 (7.8%) |
Production, Transportation and Moving Occupations
The most common Production, Transportation and Moving occupations in Rockingham are , and Transportation (7 | 9.1%).
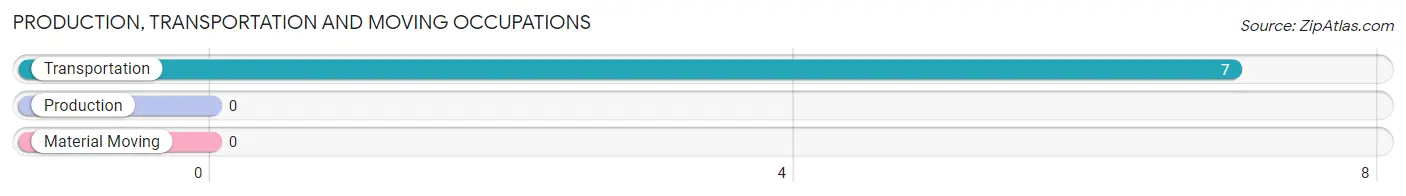
Production, Transportation and Moving Occupations by Sex
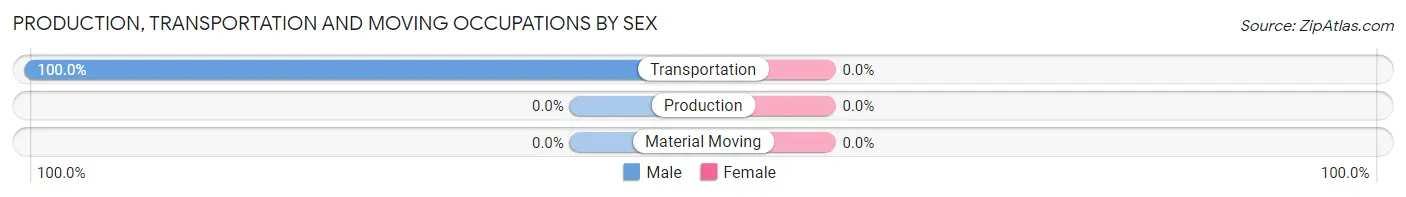
| Occupation | Male | Female |
| Production | 0 (0.0%) | 0 (0.0%) |
| Transportation | 7 (100.0%) | 0 (0.0%) |
| Material Moving | 0 (0.0%) | 0 (0.0%) |
| Total (Category) | 7 (100.0%) | 0 (0.0%) |
| Total (Overall) | 71 (92.2%) | 6 (7.8%) |
Employment Industries by Sex in Rockingham
Employment Industries in Rockingham
The major employment industries in Rockingham include Agriculture, Fishing & Hunting (52 | 67.5%), Construction (12 | 15.6%), Wholesale Trade (7 | 9.1%), and Retail Trade (6 | 7.8%).
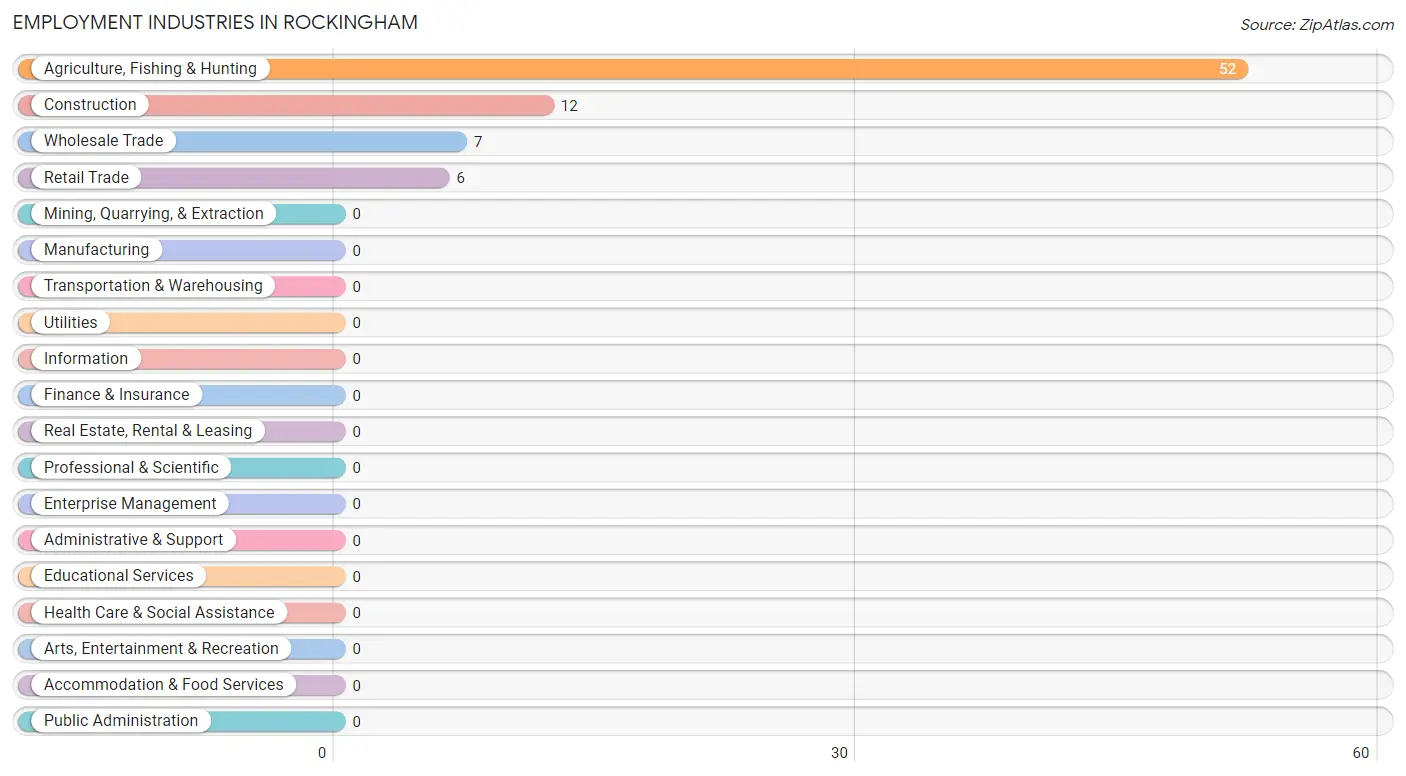
Employment Industries by Sex in Rockingham
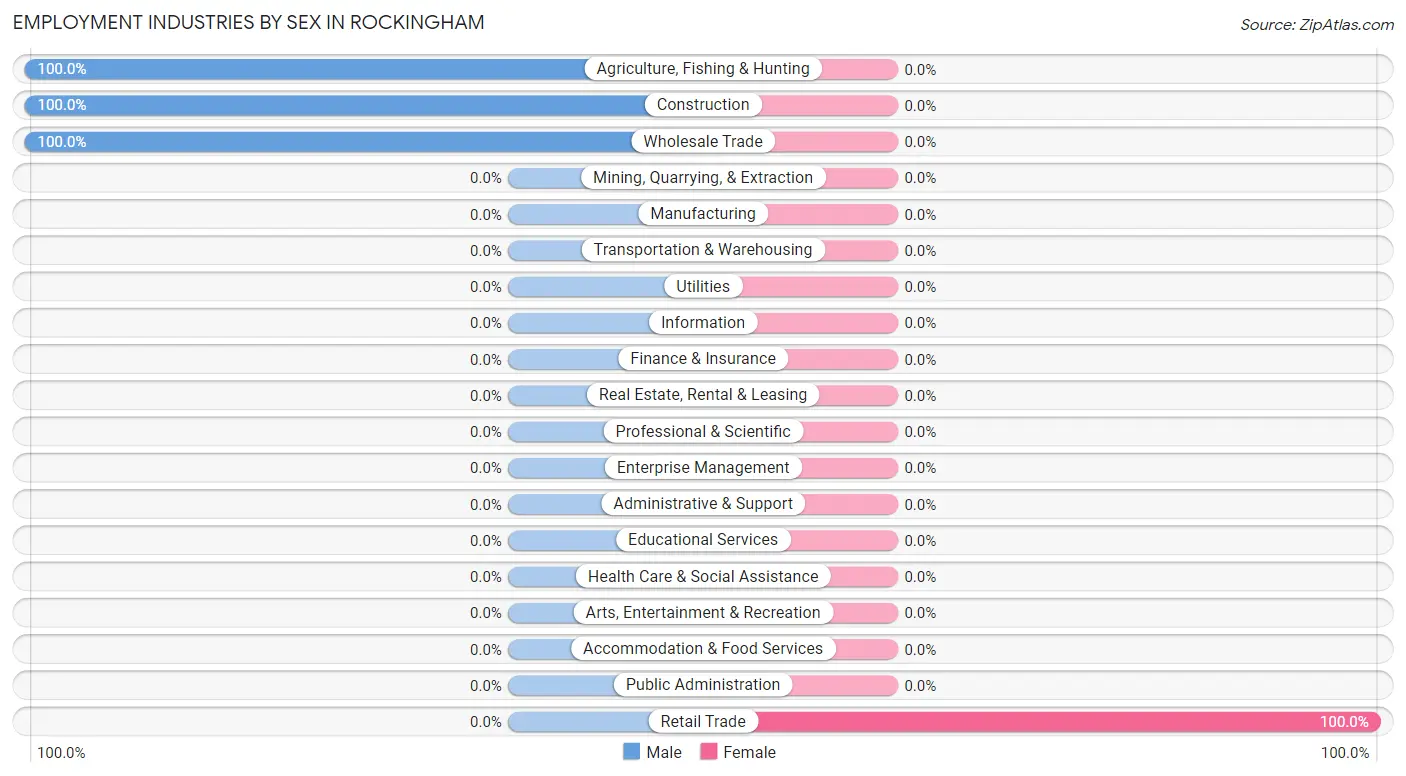
| Industry | Male | Female |
| Agriculture, Fishing & Hunting | 52 (100.0%) | 0 (0.0%) |
| Mining, Quarrying, & Extraction | 0 (0.0%) | 0 (0.0%) |
| Construction | 12 (100.0%) | 0 (0.0%) |
| Manufacturing | 0 (0.0%) | 0 (0.0%) |
| Wholesale Trade | 7 (100.0%) | 0 (0.0%) |
| Retail Trade | 0 (0.0%) | 6 (100.0%) |
| Transportation & Warehousing | 0 (0.0%) | 0 (0.0%) |
| Utilities | 0 (0.0%) | 0 (0.0%) |
| Information | 0 (0.0%) | 0 (0.0%) |
| Finance & Insurance | 0 (0.0%) | 0 (0.0%) |
| Real Estate, Rental & Leasing | 0 (0.0%) | 0 (0.0%) |
| Professional & Scientific | 0 (0.0%) | 0 (0.0%) |
| Enterprise Management | 0 (0.0%) | 0 (0.0%) |
| Administrative & Support | 0 (0.0%) | 0 (0.0%) |
| Educational Services | 0 (0.0%) | 0 (0.0%) |
| Health Care & Social Assistance | 0 (0.0%) | 0 (0.0%) |
| Arts, Entertainment & Recreation | 0 (0.0%) | 0 (0.0%) |
| Accommodation & Food Services | 0 (0.0%) | 0 (0.0%) |
| Public Administration | 0 (0.0%) | 0 (0.0%) |
| Total | 71 (92.2%) | 6 (7.8%) |
Education in Rockingham
School Enrollment in Rockingham
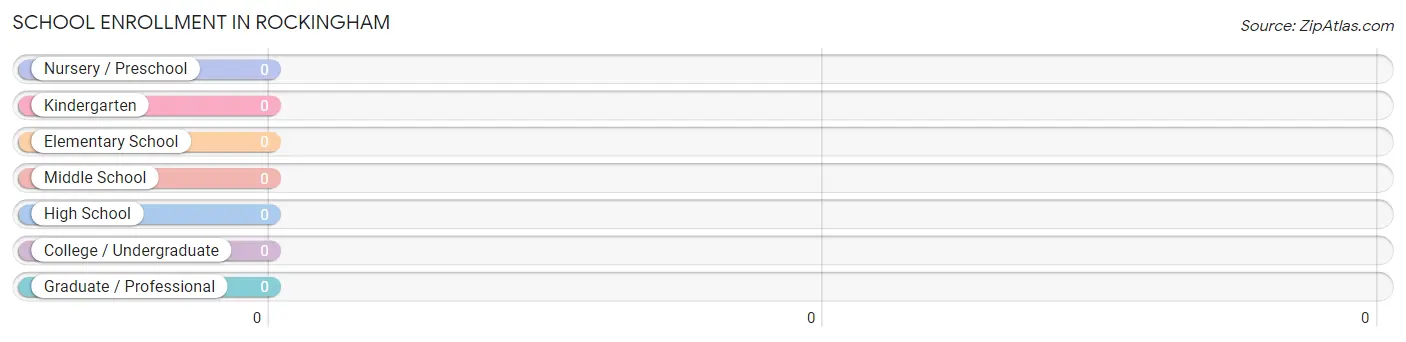
| School Level | # Students | % Students |
| Nursery / Preschool | 0 | 0.0% |
| Kindergarten | 0 | 0.0% |
| Elementary School | 0 | 0.0% |
| Middle School | 0 | 0.0% |
| High School | 0 | 0.0% |
| College / Undergraduate | 0 | 0.0% |
| Graduate / Professional | 0 | 0.0% |
| Total | 0 | 0.0% |
School Enrollment by Age by Funding Source in Rockingham
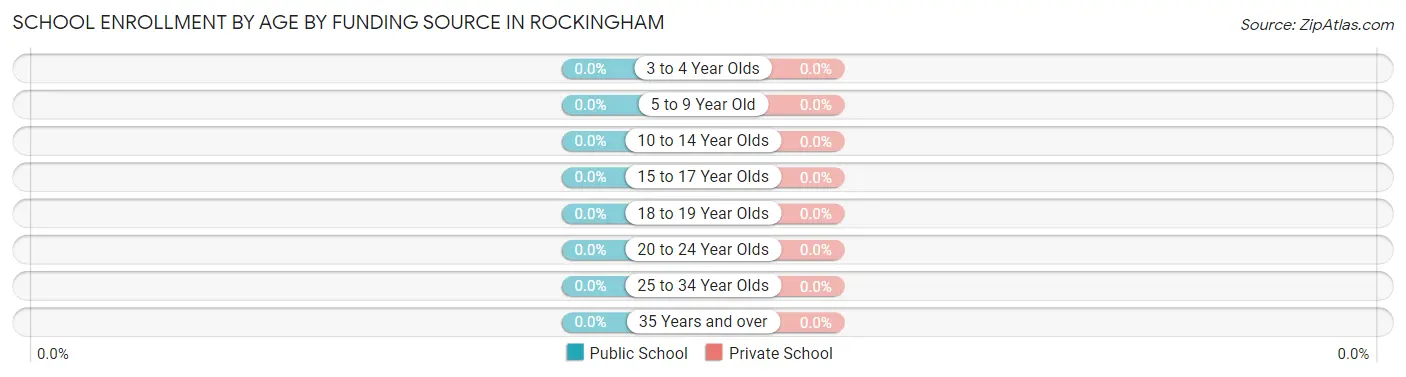
| Age Bracket | Public School | Private School |
| 3 to 4 Year Olds | 0 (0.0%) | 0 (0.0%) |
| 5 to 9 Year Old | 0 (0.0%) | 0 (0.0%) |
| 10 to 14 Year Olds | 0 (0.0%) | 0 (0.0%) |
| 15 to 17 Year Olds | 0 (0.0%) | 0 (0.0%) |
| 18 to 19 Year Olds | 0 (0.0%) | 0 (0.0%) |
| 20 to 24 Year Olds | 0 (0.0%) | 0 (0.0%) |
| 25 to 34 Year Olds | 0 (0.0%) | 0 (0.0%) |
| 35 Years and over | 0 (0.0%) | 0 (0.0%) |
| Total | 0 (0.0%) | 0 (0.0%) |
Educational Attainment by Field of Study in Rockingham
Bio, nature & agricultural (52 | 75.4%), and education (17 | 24.6%) are the most common fields of study among 69 individuals in Rockingham who have obtained a bachelor's degree or higher.
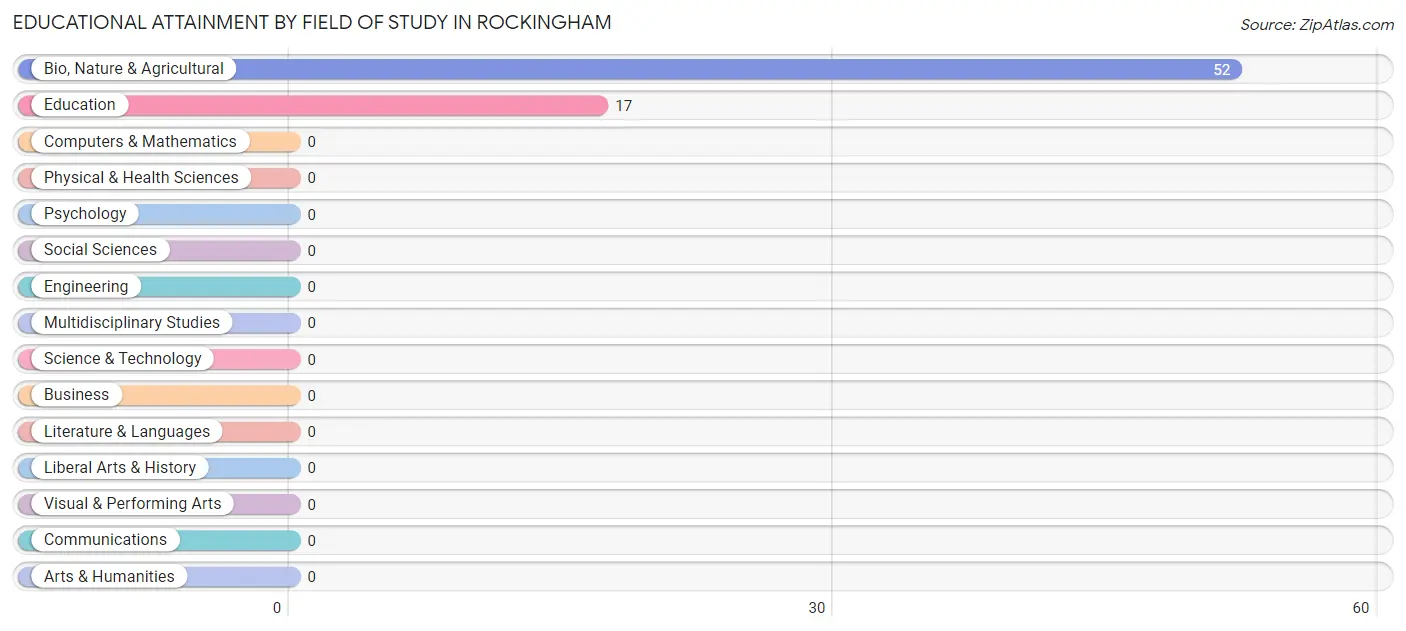
| Field of Study | # Graduates | % Graduates |
| Computers & Mathematics | 0 | 0.0% |
| Bio, Nature & Agricultural | 52 | 75.4% |
| Physical & Health Sciences | 0 | 0.0% |
| Psychology | 0 | 0.0% |
| Social Sciences | 0 | 0.0% |
| Engineering | 0 | 0.0% |
| Multidisciplinary Studies | 0 | 0.0% |
| Science & Technology | 0 | 0.0% |
| Business | 0 | 0.0% |
| Education | 17 | 24.6% |
| Literature & Languages | 0 | 0.0% |
| Liberal Arts & History | 0 | 0.0% |
| Visual & Performing Arts | 0 | 0.0% |
| Communications | 0 | 0.0% |
| Arts & Humanities | 0 | 0.0% |
| Total | 69 | 100.0% |
Transportation & Commute in Rockingham
Vehicle Availability by Sex in Rockingham
The most prevalent vehicle ownership categories in Rockingham are males with 2 vehicles (64, accounting for 90.1%) and females with 2 vehicles (6, making up 1,066.7%).
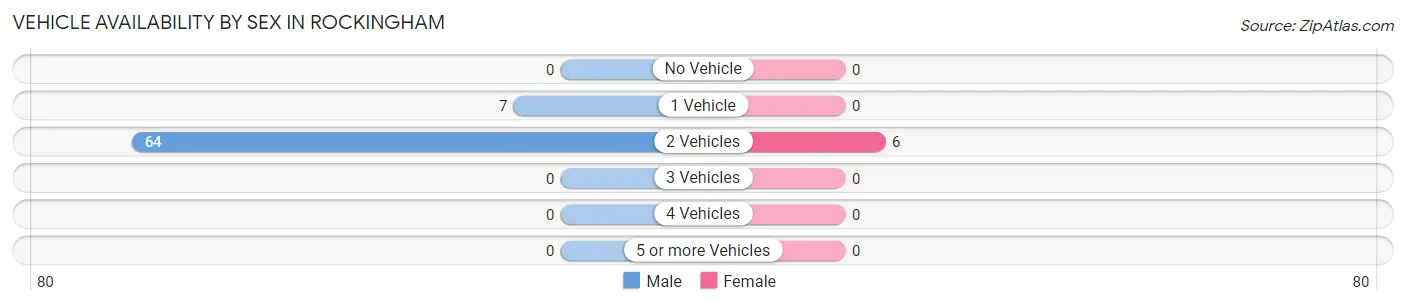
| Vehicles Available | Male | Female |
| No Vehicle | 0 (0.0%) | 0 (0.0%) |
| 1 Vehicle | 7 (9.9%) | 0 (0.0%) |
| 2 Vehicles | 64 (90.1%) | 6 (100.0%) |
| 3 Vehicles | 0 (0.0%) | 0 (0.0%) |
| 4 Vehicles | 0 (0.0%) | 0 (0.0%) |
| 5 or more Vehicles | 0 (0.0%) | 0 (0.0%) |
| Total | 71 (100.0%) | 6 (100.0%) |
Commute Time in Rockingham
The most frequently occuring commute durations in Rockingham are 10 to 14 minutes (64 commuters, 83.1%), 25 to 29 minutes (7 commuters, 9.1%), and 15 to 19 minutes (6 commuters, 7.8%).
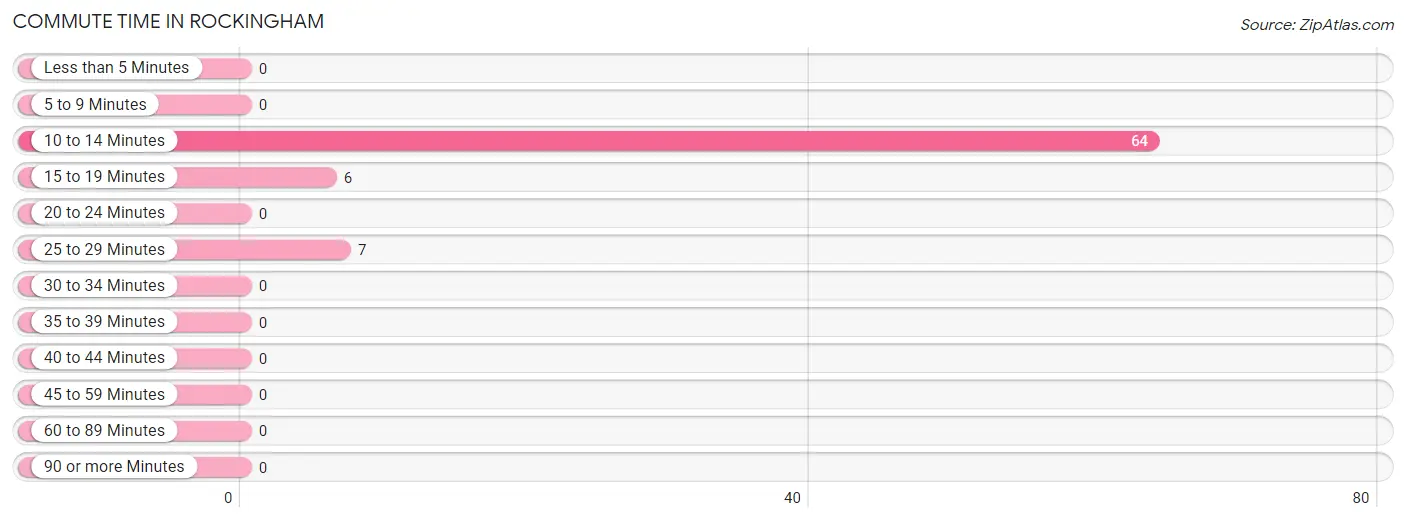
| Commute Time | # Commuters | % Commuters |
| Less than 5 Minutes | 0 | 0.0% |
| 5 to 9 Minutes | 0 | 0.0% |
| 10 to 14 Minutes | 64 | 83.1% |
| 15 to 19 Minutes | 6 | 7.8% |
| 20 to 24 Minutes | 0 | 0.0% |
| 25 to 29 Minutes | 7 | 9.1% |
| 30 to 34 Minutes | 0 | 0.0% |
| 35 to 39 Minutes | 0 | 0.0% |
| 40 to 44 Minutes | 0 | 0.0% |
| 45 to 59 Minutes | 0 | 0.0% |
| 60 to 89 Minutes | 0 | 0.0% |
| 90 or more Minutes | 0 | 0.0% |
Commute Time by Sex in Rockingham
The most common commute times in Rockingham are 10 to 14 minutes (64 commuters, 90.1%) for males and 15 to 19 minutes (6 commuters, 100.0%) for females.
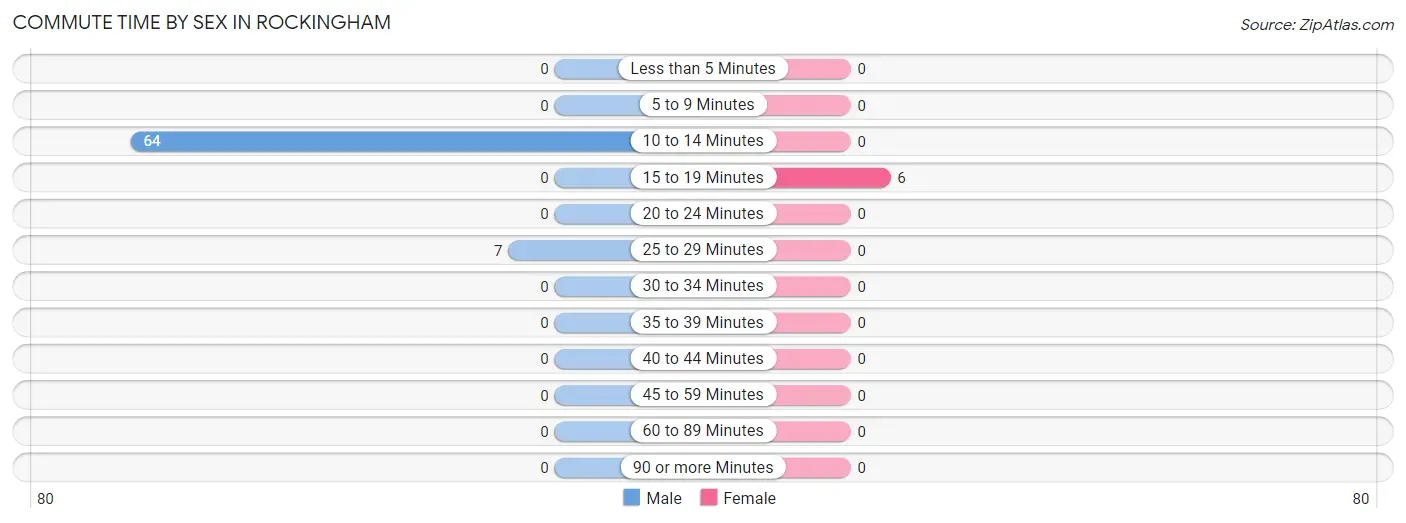
| Commute Time | Male | Female |
| Less than 5 Minutes | 0 (0.0%) | 0 (0.0%) |
| 5 to 9 Minutes | 0 (0.0%) | 0 (0.0%) |
| 10 to 14 Minutes | 64 (90.1%) | 0 (0.0%) |
| 15 to 19 Minutes | 0 (0.0%) | 6 (100.0%) |
| 20 to 24 Minutes | 0 (0.0%) | 0 (0.0%) |
| 25 to 29 Minutes | 7 (9.9%) | 0 (0.0%) |
| 30 to 34 Minutes | 0 (0.0%) | 0 (0.0%) |
| 35 to 39 Minutes | 0 (0.0%) | 0 (0.0%) |
| 40 to 44 Minutes | 0 (0.0%) | 0 (0.0%) |
| 45 to 59 Minutes | 0 (0.0%) | 0 (0.0%) |
| 60 to 89 Minutes | 0 (0.0%) | 0 (0.0%) |
| 90 or more Minutes | 0 (0.0%) | 0 (0.0%) |
Time of Departure to Work by Sex in Rockingham
The most frequent times of departure to work in Rockingham are 8:00 AM to 8:29 AM (59, 83.1%) for males and 7:30 AM to 7:59 AM (6, 100.0%) for females.
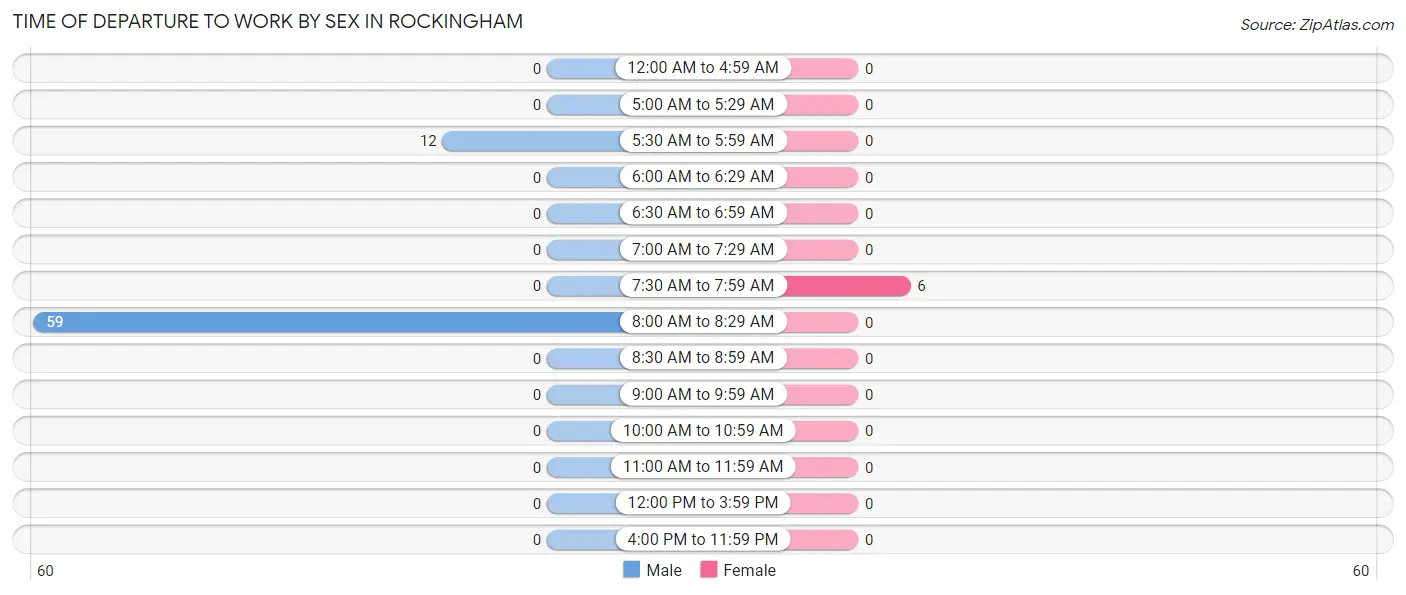
| Time of Departure | Male | Female |
| 12:00 AM to 4:59 AM | 0 (0.0%) | 0 (0.0%) |
| 5:00 AM to 5:29 AM | 0 (0.0%) | 0 (0.0%) |
| 5:30 AM to 5:59 AM | 12 (16.9%) | 0 (0.0%) |
| 6:00 AM to 6:29 AM | 0 (0.0%) | 0 (0.0%) |
| 6:30 AM to 6:59 AM | 0 (0.0%) | 0 (0.0%) |
| 7:00 AM to 7:29 AM | 0 (0.0%) | 0 (0.0%) |
| 7:30 AM to 7:59 AM | 0 (0.0%) | 6 (100.0%) |
| 8:00 AM to 8:29 AM | 59 (83.1%) | 0 (0.0%) |
| 8:30 AM to 8:59 AM | 0 (0.0%) | 0 (0.0%) |
| 9:00 AM to 9:59 AM | 0 (0.0%) | 0 (0.0%) |
| 10:00 AM to 10:59 AM | 0 (0.0%) | 0 (0.0%) |
| 11:00 AM to 11:59 AM | 0 (0.0%) | 0 (0.0%) |
| 12:00 PM to 3:59 PM | 0 (0.0%) | 0 (0.0%) |
| 4:00 PM to 11:59 PM | 0 (0.0%) | 0 (0.0%) |
| Total | 71 (100.0%) | 6 (100.0%) |
Housing Occupancy in Rockingham
Occupancy by Ownership in Rockingham
Of the total 99 dwellings in Rockingham, owner-occupied units account for 47 (47.5%), while renter-occupied units make up 52 (52.5%).
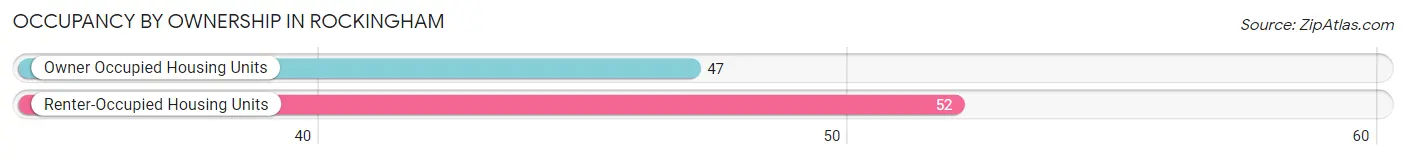
| Occupancy | # Housing Units | % Housing Units |
| Owner Occupied Housing Units | 47 | 47.5% |
| Renter-Occupied Housing Units | 52 | 52.5% |
| Total Occupied Housing Units | 99 | 100.0% |
Occupancy by Household Size in Rockingham
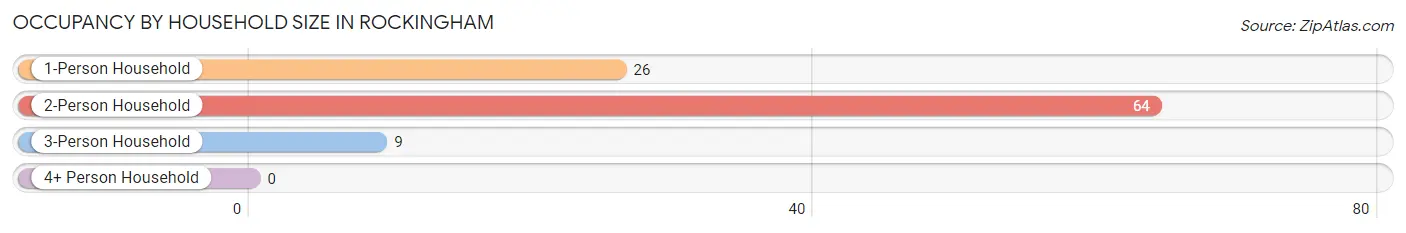
| Household Size | # Housing Units | % Housing Units |
| 1-Person Household | 26 | 26.3% |
| 2-Person Household | 64 | 64.6% |
| 3-Person Household | 9 | 9.1% |
| 4+ Person Household | 0 | 0.0% |
| Total Housing Units | 99 | 100.0% |
Occupancy by Ownership by Household Size in Rockingham
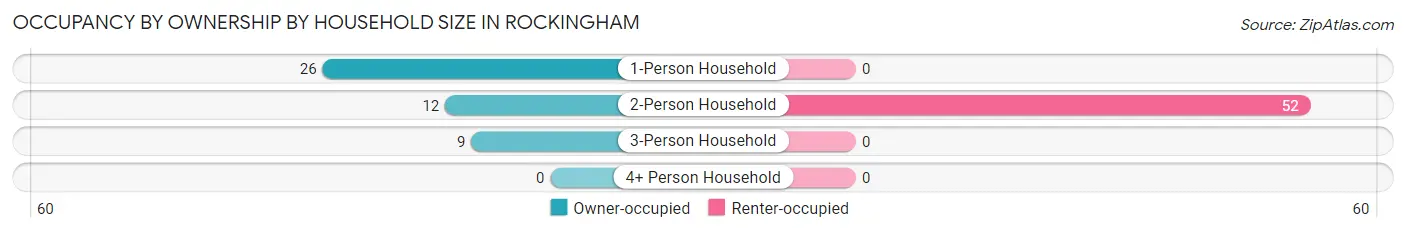
| Household Size | Owner-occupied | Renter-occupied |
| 1-Person Household | 26 (100.0%) | 0 (0.0%) |
| 2-Person Household | 12 (18.8%) | 52 (81.2%) |
| 3-Person Household | 9 (100.0%) | 0 (0.0%) |
| 4+ Person Household | 0 (0.0%) | 0 (0.0%) |
| Total Housing Units | 47 (47.5%) | 52 (52.5%) |
Occupancy by Educational Attainment in Rockingham
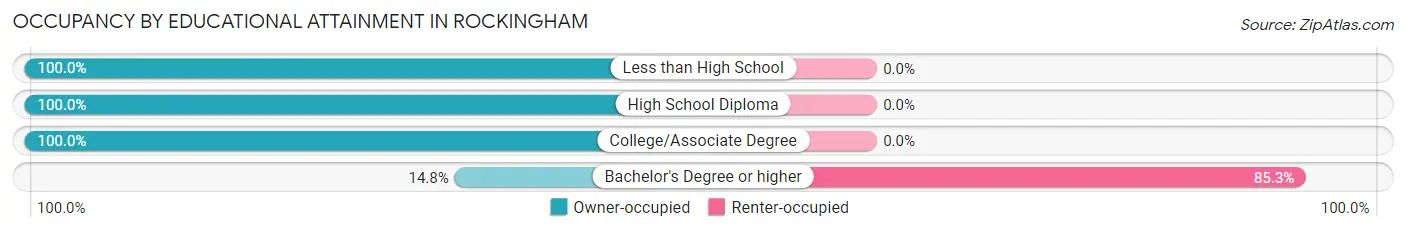
| Household Size | Owner-occupied | Renter-occupied |
| Less than High School | 10 (100.0%) | 0 (0.0%) |
| High School Diploma | 16 (100.0%) | 0 (0.0%) |
| College/Associate Degree | 12 (100.0%) | 0 (0.0%) |
| Bachelor's Degree or higher | 9 (14.7%) | 52 (85.3%) |
Occupancy by Age of Householder in Rockingham
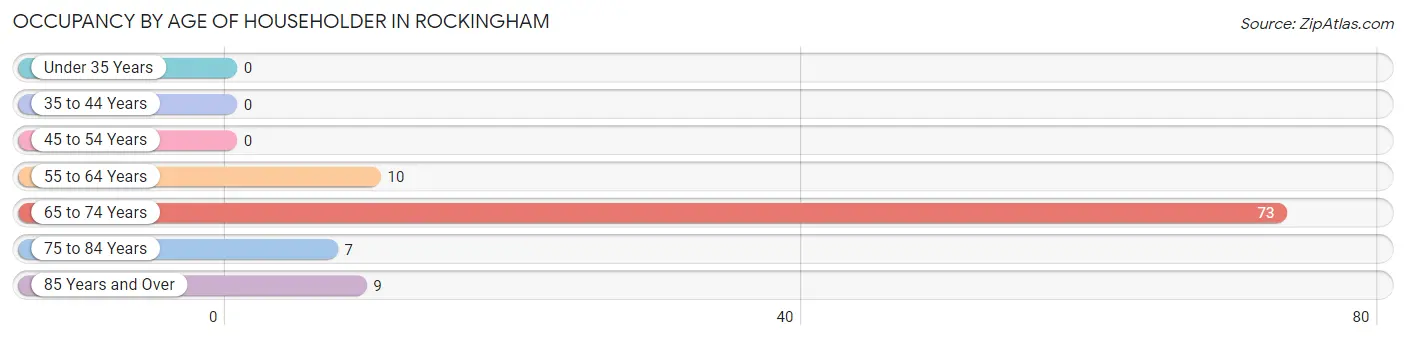
| Age Bracket | # Households | % Households |
| Under 35 Years | 0 | 0.0% |
| 35 to 44 Years | 0 | 0.0% |
| 45 to 54 Years | 0 | 0.0% |
| 55 to 64 Years | 10 | 10.1% |
| 65 to 74 Years | 73 | 73.7% |
| 75 to 84 Years | 7 | 7.1% |
| 85 Years and Over | 9 | 9.1% |
| Total | 99 | 100.0% |
Housing Finances in Rockingham
Median Income by Occupancy in Rockingham
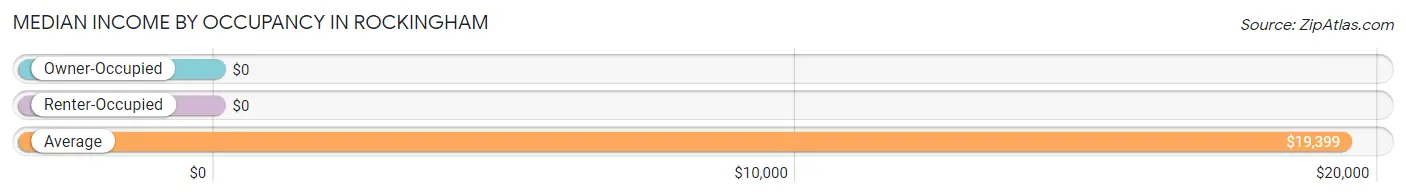
| Occupancy Type | # Households | Median Income |
| Owner-Occupied | 47 (47.5%) | $0 |
| Renter-Occupied | 52 (52.5%) | $0 |
| Average | 99 (100.0%) | $19,399 |
Occupancy by Householder Income Bracket in Rockingham
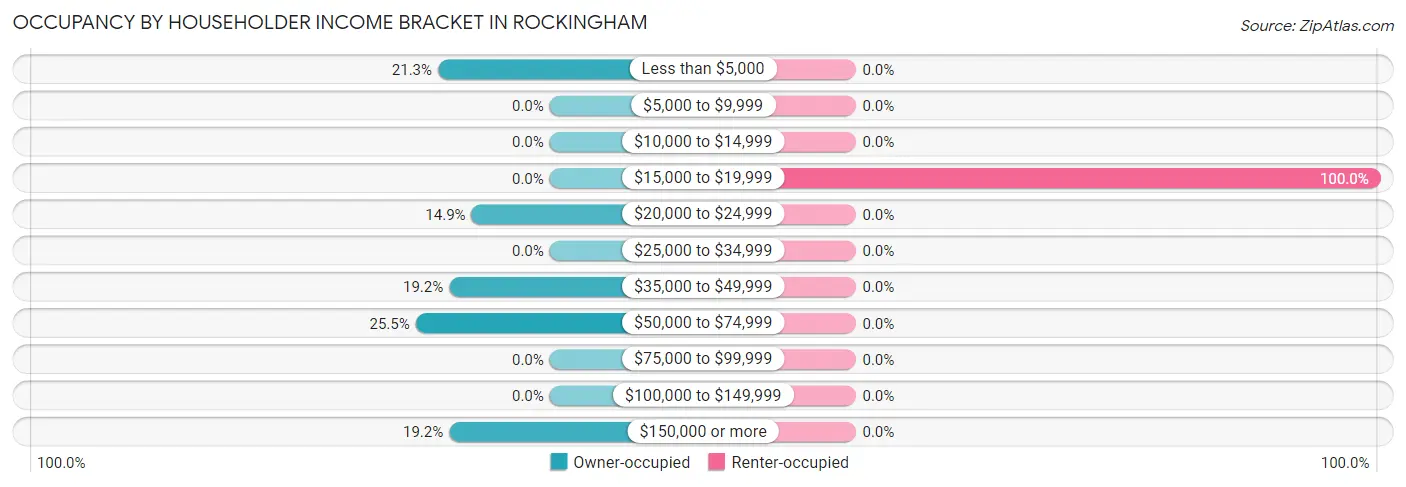
| Income Bracket | Owner-occupied | Renter-occupied |
| Less than $5,000 | 10 (21.3%) | 0 (0.0%) |
| $5,000 to $9,999 | 0 (0.0%) | 0 (0.0%) |
| $10,000 to $14,999 | 0 (0.0%) | 0 (0.0%) |
| $15,000 to $19,999 | 0 (0.0%) | 52 (100.0%) |
| $20,000 to $24,999 | 7 (14.9%) | 0 (0.0%) |
| $25,000 to $34,999 | 0 (0.0%) | 0 (0.0%) |
| $35,000 to $49,999 | 9 (19.2%) | 0 (0.0%) |
| $50,000 to $74,999 | 12 (25.5%) | 0 (0.0%) |
| $75,000 to $99,999 | 0 (0.0%) | 0 (0.0%) |
| $100,000 to $149,999 | 0 (0.0%) | 0 (0.0%) |
| $150,000 or more | 9 (19.2%) | 0 (0.0%) |
| Total | 47 (100.0%) | 52 (100.0%) |
Monthly Housing Cost Tiers in Rockingham
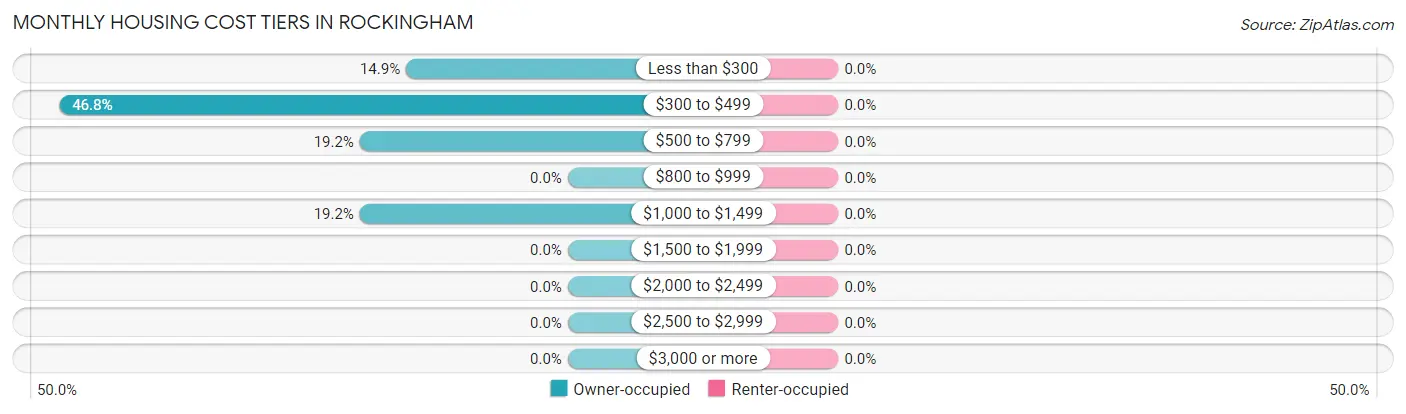
| Monthly Cost | Owner-occupied | Renter-occupied |
| Less than $300 | 7 (14.9%) | 0 (0.0%) |
| $300 to $499 | 22 (46.8%) | 0 (0.0%) |
| $500 to $799 | 9 (19.2%) | 0 (0.0%) |
| $800 to $999 | 0 (0.0%) | 0 (0.0%) |
| $1,000 to $1,499 | 9 (19.2%) | 0 (0.0%) |
| $1,500 to $1,999 | 0 (0.0%) | 0 (0.0%) |
| $2,000 to $2,499 | 0 (0.0%) | 0 (0.0%) |
| $2,500 to $2,999 | 0 (0.0%) | 0 (0.0%) |
| $3,000 or more | 0 (0.0%) | 0 (0.0%) |
| Total | 47 (100.0%) | 52 (100.0%) |
Physical Housing Characteristics in Rockingham
Housing Structures in Rockingham
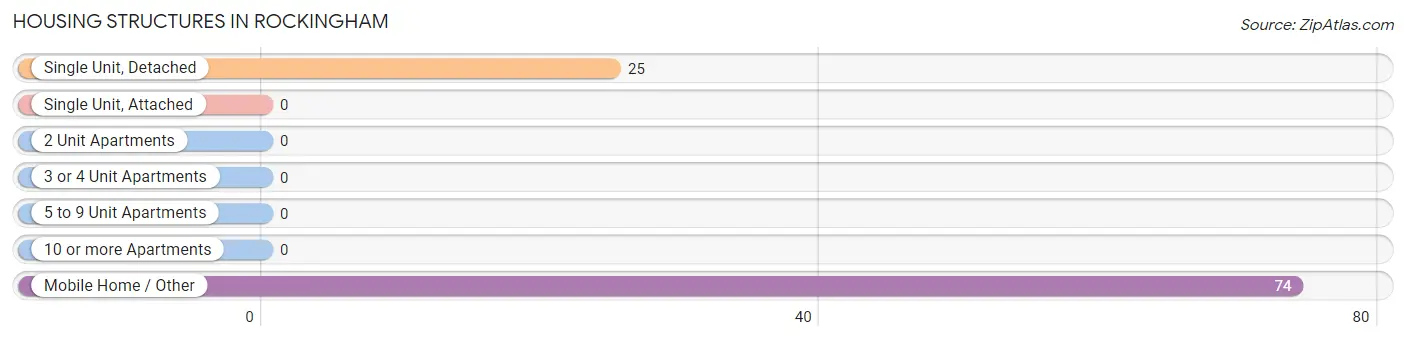
| Structure Type | # Housing Units | % Housing Units |
| Single Unit, Detached | 25 | 25.3% |
| Single Unit, Attached | 0 | 0.0% |
| 2 Unit Apartments | 0 | 0.0% |
| 3 or 4 Unit Apartments | 0 | 0.0% |
| 5 to 9 Unit Apartments | 0 | 0.0% |
| 10 or more Apartments | 0 | 0.0% |
| Mobile Home / Other | 74 | 74.8% |
| Total | 99 | 100.0% |
Housing Structures by Occupancy in Rockingham
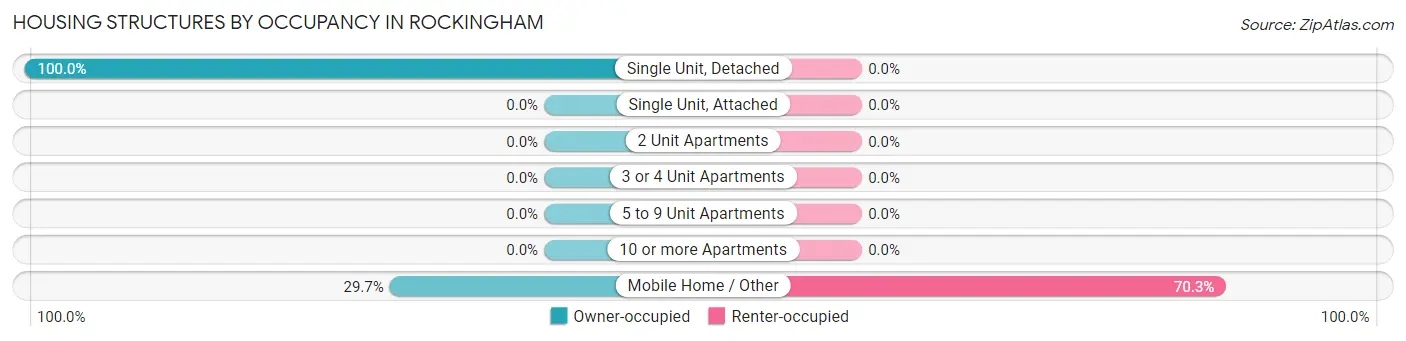
| Structure Type | Owner-occupied | Renter-occupied |
| Single Unit, Detached | 25 (100.0%) | 0 (0.0%) |
| Single Unit, Attached | 0 (0.0%) | 0 (0.0%) |
| 2 Unit Apartments | 0 (0.0%) | 0 (0.0%) |
| 3 or 4 Unit Apartments | 0 (0.0%) | 0 (0.0%) |
| 5 to 9 Unit Apartments | 0 (0.0%) | 0 (0.0%) |
| 10 or more Apartments | 0 (0.0%) | 0 (0.0%) |
| Mobile Home / Other | 22 (29.7%) | 52 (70.3%) |
| Total | 47 (47.5%) | 52 (52.5%) |
Housing Structures by Number of Rooms in Rockingham
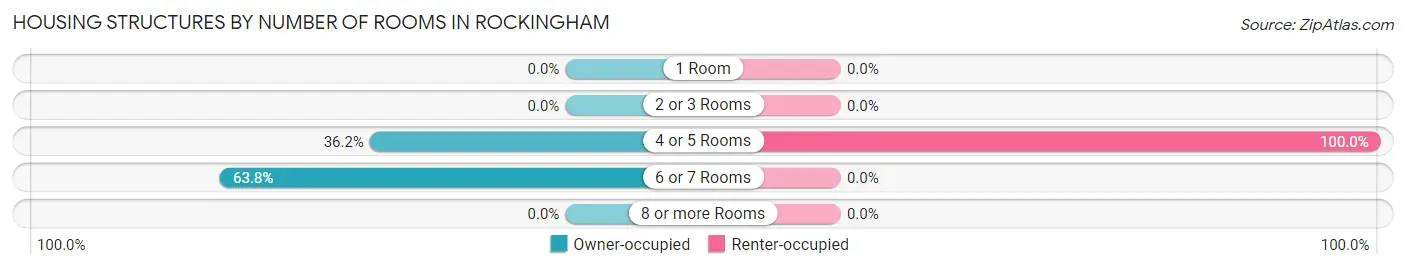
| Number of Rooms | Owner-occupied | Renter-occupied |
| 1 Room | 0 (0.0%) | 0 (0.0%) |
| 2 or 3 Rooms | 0 (0.0%) | 0 (0.0%) |
| 4 or 5 Rooms | 17 (36.2%) | 52 (100.0%) |
| 6 or 7 Rooms | 30 (63.8%) | 0 (0.0%) |
| 8 or more Rooms | 0 (0.0%) | 0 (0.0%) |
| Total | 47 (100.0%) | 52 (100.0%) |
Housing Structure by Heating Type in Rockingham
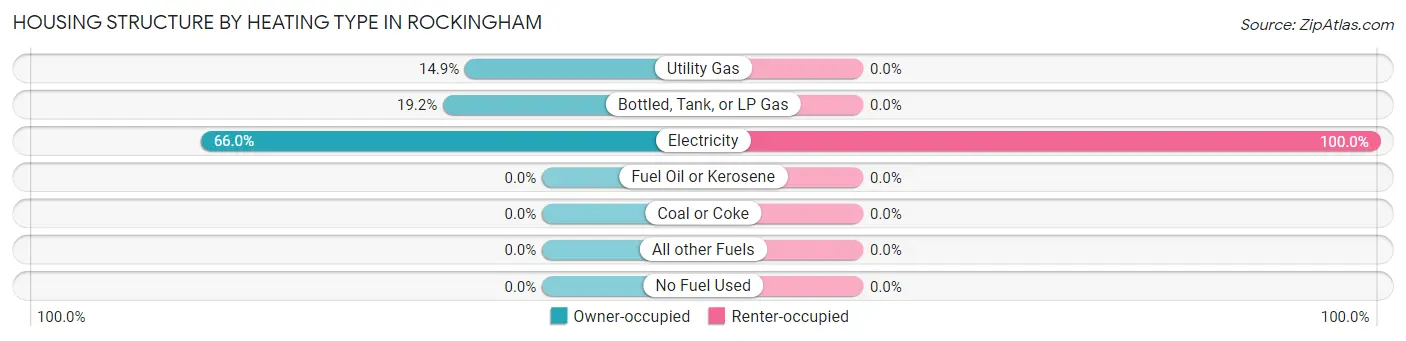
| Heating Type | Owner-occupied | Renter-occupied |
| Utility Gas | 7 (14.9%) | 0 (0.0%) |
| Bottled, Tank, or LP Gas | 9 (19.2%) | 0 (0.0%) |
| Electricity | 31 (66.0%) | 52 (100.0%) |
| Fuel Oil or Kerosene | 0 (0.0%) | 0 (0.0%) |
| Coal or Coke | 0 (0.0%) | 0 (0.0%) |
| All other Fuels | 0 (0.0%) | 0 (0.0%) |
| No Fuel Used | 0 (0.0%) | 0 (0.0%) |
| Total | 47 (100.0%) | 52 (100.0%) |
Household Vehicle Usage in Rockingham
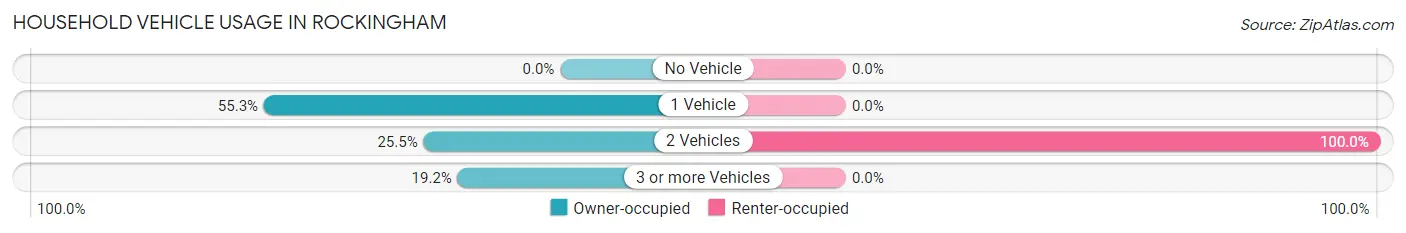
| Vehicles per Household | Owner-occupied | Renter-occupied |
| No Vehicle | 0 (0.0%) | 0 (0.0%) |
| 1 Vehicle | 26 (55.3%) | 0 (0.0%) |
| 2 Vehicles | 12 (25.5%) | 52 (100.0%) |
| 3 or more Vehicles | 9 (19.2%) | 0 (0.0%) |
| Total | 47 (100.0%) | 52 (100.0%) |
Real Estate & Mortgages in Rockingham
Real Estate and Mortgage Overview in Rockingham
| Characteristic | Without Mortgage | With Mortgage |
| Housing Units | 47 | 0 |
| Median Property Value | - | - |
| Median Household Income | - | - |
| Monthly Housing Costs | $454 | $0 |
| Real Estate Taxes | - | - |
Property Value by Mortgage Status in Rockingham
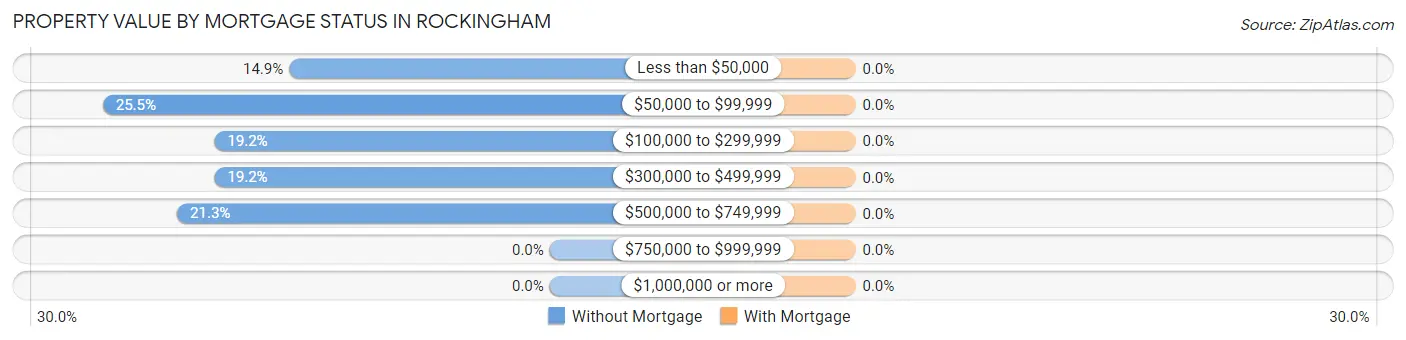
| Property Value | Without Mortgage | With Mortgage |
| Less than $50,000 | 7 (14.9%) | 0 (0.0%) |
| $50,000 to $99,999 | 12 (25.5%) | 0 (0.0%) |
| $100,000 to $299,999 | 9 (19.2%) | 0 (0.0%) |
| $300,000 to $499,999 | 9 (19.2%) | 0 (0.0%) |
| $500,000 to $749,999 | 10 (21.3%) | 0 (0.0%) |
| $750,000 to $999,999 | 0 (0.0%) | 0 (0.0%) |
| $1,000,000 or more | 0 (0.0%) | 0 (0.0%) |
| Total | 47 (100.0%) | 0 (0.0%) |
Household Income by Mortgage Status in Rockingham
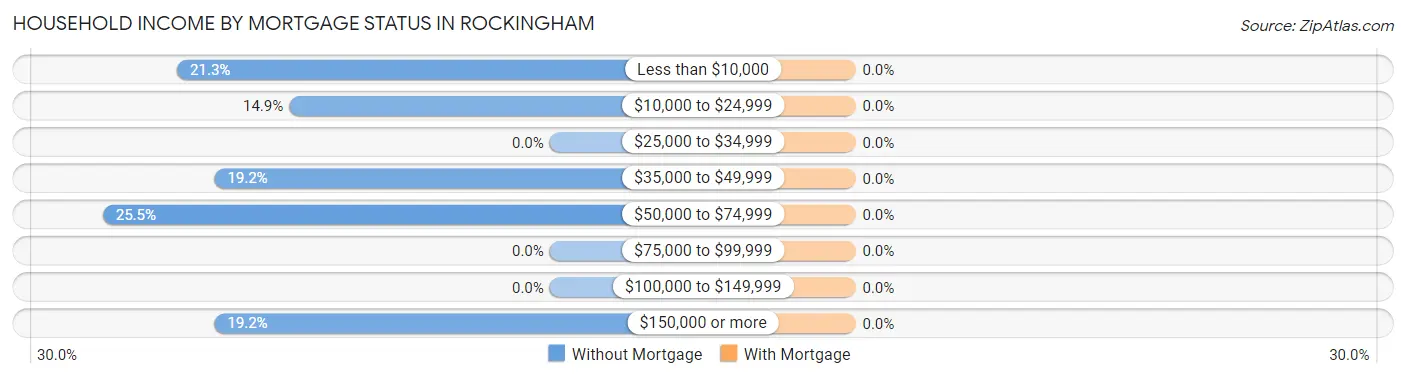
| Household Income | Without Mortgage | With Mortgage |
| Less than $10,000 | 10 (21.3%) | 0 (0.0%) |
| $10,000 to $24,999 | 7 (14.9%) | 0 (0.0%) |
| $25,000 to $34,999 | 0 (0.0%) | 0 (0.0%) |
| $35,000 to $49,999 | 9 (19.2%) | 0 (0.0%) |
| $50,000 to $74,999 | 12 (25.5%) | 0 (0.0%) |
| $75,000 to $99,999 | 0 (0.0%) | 0 (0.0%) |
| $100,000 to $149,999 | 0 (0.0%) | 0 (0.0%) |
| $150,000 or more | 9 (19.2%) | 0 (0.0%) |
| Total | 47 (100.0%) | 0 (0.0%) |
Property Value to Household Income Ratio in Rockingham
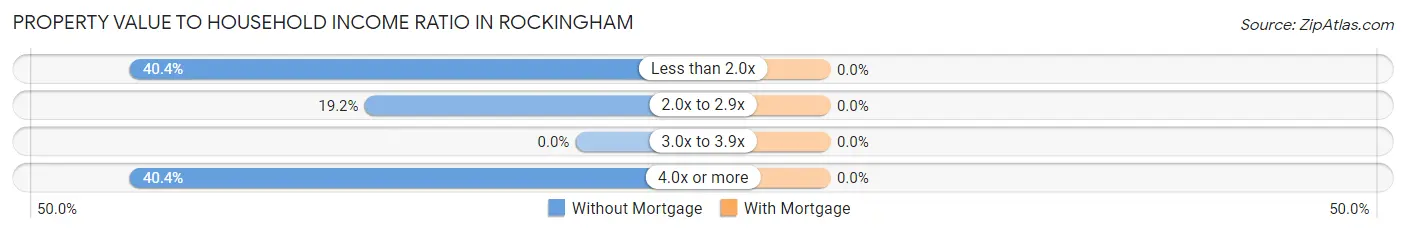
| Value-to-Income Ratio | Without Mortgage | With Mortgage |
| Less than 2.0x | 19 (40.4%) | 0 (0.0%) |
| 2.0x to 2.9x | 9 (19.2%) | 0 (0.0%) |
| 3.0x to 3.9x | 0 (0.0%) | 0 (0.0%) |
| 4.0x or more | 19 (40.4%) | 0 (0.0%) |
| Total | 47 (100.0%) | 0 (0.0%) |
Real Estate Taxes by Mortgage Status in Rockingham
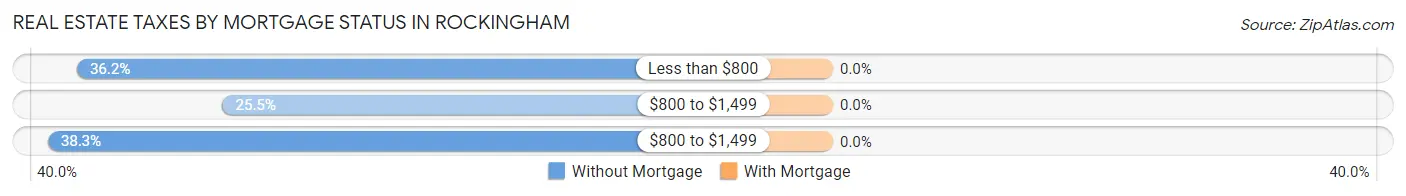
| Property Taxes | Without Mortgage | With Mortgage |
| Less than $800 | 17 (36.2%) | 0 (0.0%) |
| $800 to $1,499 | 12 (25.5%) | 0 (0.0%) |
| $800 to $1,499 | 18 (38.3%) | 0 (0.0%) |
| Total | 47 (100.0%) | 0 (0.0%) |
Health & Disability in Rockingham
Health Insurance Coverage by Age in Rockingham
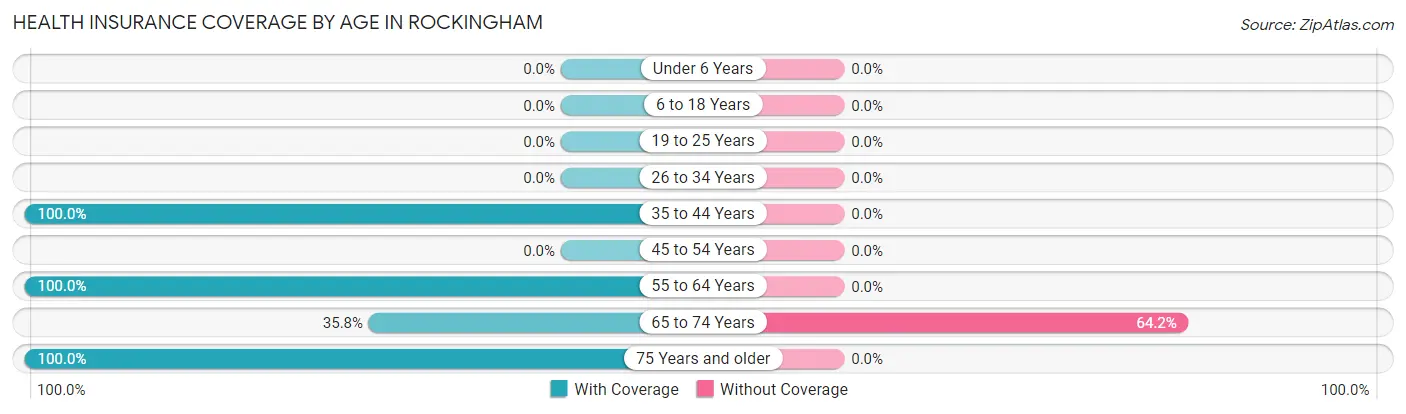
| Age Bracket | With Coverage | Without Coverage |
| Under 6 Years | 0 (0.0%) | 0 (0.0%) |
| 6 to 18 Years | 0 (0.0%) | 0 (0.0%) |
| 19 to 25 Years | 0 (0.0%) | 0 (0.0%) |
| 26 to 34 Years | 0 (0.0%) | 0 (0.0%) |
| 35 to 44 Years | 10 (100.0%) | 0 (0.0%) |
| 45 to 54 Years | 0 (0.0%) | 0 (0.0%) |
| 55 to 64 Years | 44 (100.0%) | 0 (0.0%) |
| 65 to 74 Years | 29 (35.8%) | 52 (64.2%) |
| 75 Years and older | 16 (100.0%) | 0 (0.0%) |
| Total | 99 (65.6%) | 52 (34.4%) |
Health Insurance Coverage by Citizenship Status in Rockingham
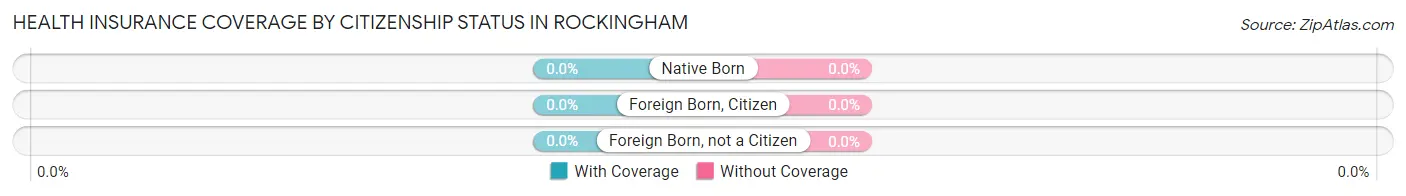
| Citizenship Status | With Coverage | Without Coverage |
| Native Born | 0 (0.0%) | 0 (0.0%) |
| Foreign Born, Citizen | 0 (0.0%) | 0 (0.0%) |
| Foreign Born, not a Citizen | 0 (0.0%) | 0 (0.0%) |
Health Insurance Coverage by Household Income in Rockingham
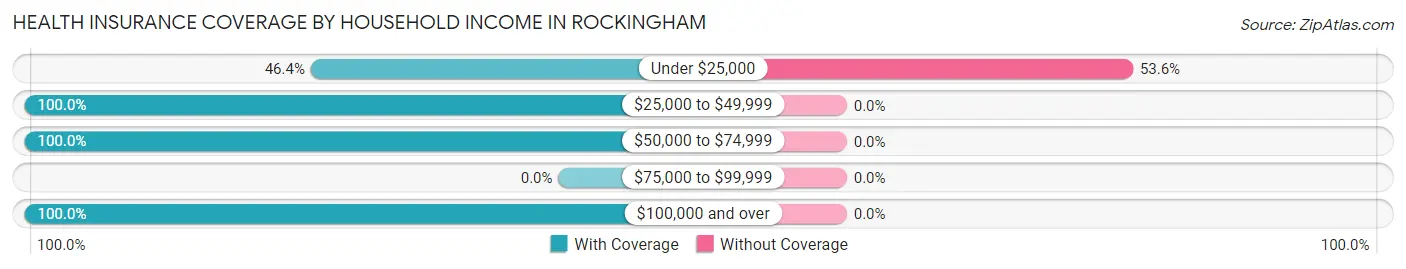
| Household Income | With Coverage | Without Coverage |
| Under $25,000 | 45 (46.4%) | 52 (53.6%) |
| $25,000 to $49,999 | 9 (100.0%) | 0 (0.0%) |
| $50,000 to $74,999 | 18 (100.0%) | 0 (0.0%) |
| $75,000 to $99,999 | 0 (0.0%) | 0 (0.0%) |
| $100,000 and over | 27 (100.0%) | 0 (0.0%) |
Public vs Private Health Insurance Coverage by Age in Rockingham
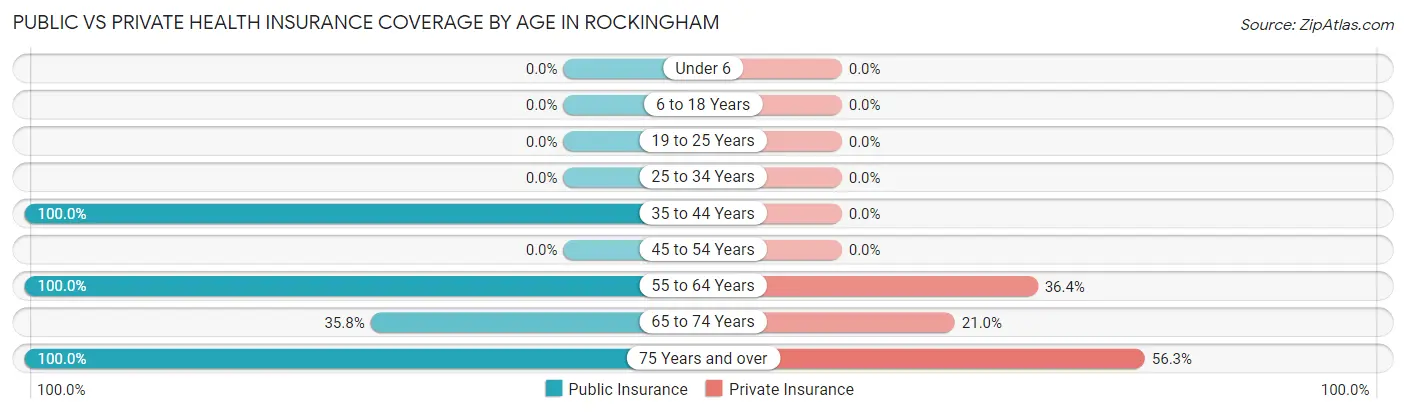
| Age Bracket | Public Insurance | Private Insurance |
| Under 6 | 0 (0.0%) | 0 (0.0%) |
| 6 to 18 Years | 0 (0.0%) | 0 (0.0%) |
| 19 to 25 Years | 0 (0.0%) | 0 (0.0%) |
| 25 to 34 Years | 0 (0.0%) | 0 (0.0%) |
| 35 to 44 Years | 10 (100.0%) | 0 (0.0%) |
| 45 to 54 Years | 0 (0.0%) | 0 (0.0%) |
| 55 to 64 Years | 44 (100.0%) | 16 (36.4%) |
| 65 to 74 Years | 29 (35.8%) | 17 (21.0%) |
| 75 Years and over | 16 (100.0%) | 9 (56.2%) |
| Total | 99 (65.6%) | 42 (27.8%) |
Disability Status by Sex by Age in Rockingham
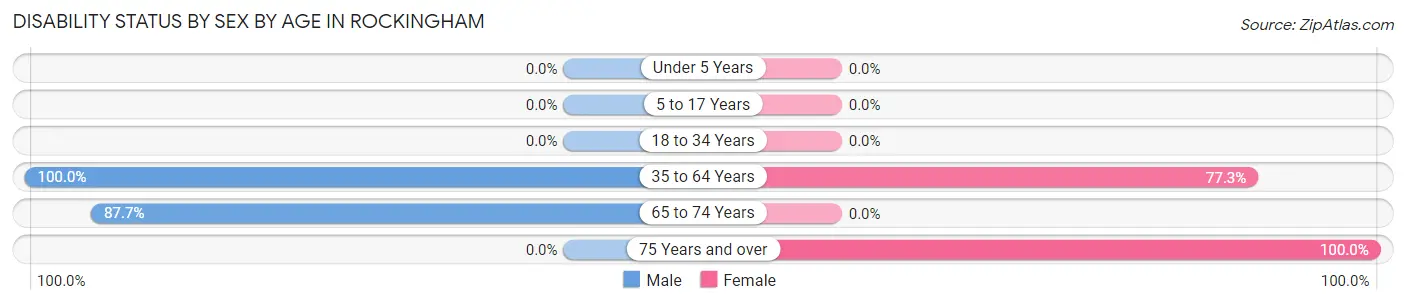
| Age Bracket | Male | Female |
| Under 5 Years | 0 (0.0%) | 0 (0.0%) |
| 5 to 17 Years | 0 (0.0%) | 0 (0.0%) |
| 18 to 34 Years | 0 (0.0%) | 0 (0.0%) |
| 35 to 64 Years | 10 (100.0%) | 34 (77.3%) |
| 65 to 74 Years | 64 (87.7%) | 0 (0.0%) |
| 75 Years and over | 0 (0.0%) | 9 (100.0%) |
Disability Class by Sex by Age in Rockingham
Disability Class: Hearing Difficulty
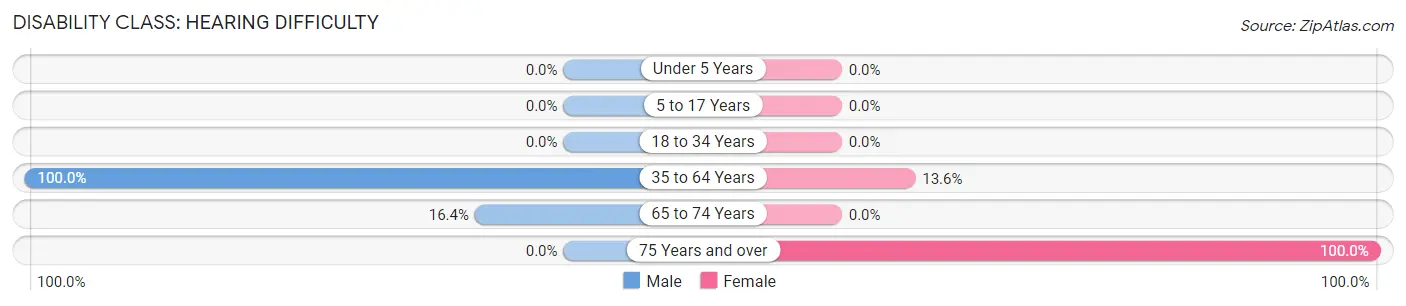
| Age Bracket | Male | Female |
| Under 5 Years | 0 (0.0%) | 0 (0.0%) |
| 5 to 17 Years | 0 (0.0%) | 0 (0.0%) |
| 18 to 34 Years | 0 (0.0%) | 0 (0.0%) |
| 35 to 64 Years | 10 (100.0%) | 6 (13.6%) |
| 65 to 74 Years | 12 (16.4%) | 0 (0.0%) |
| 75 Years and over | 0 (0.0%) | 9 (100.0%) |
Disability Class: Vision Difficulty
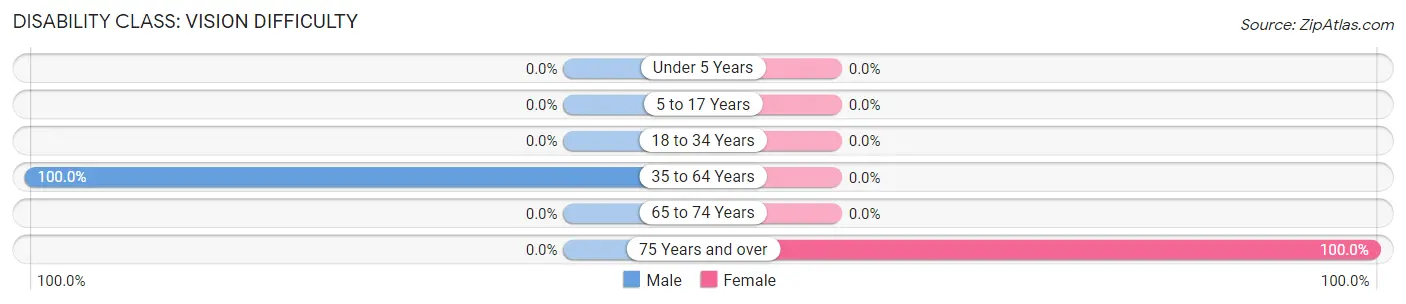
| Age Bracket | Male | Female |
| Under 5 Years | 0 (0.0%) | 0 (0.0%) |
| 5 to 17 Years | 0 (0.0%) | 0 (0.0%) |
| 18 to 34 Years | 0 (0.0%) | 0 (0.0%) |
| 35 to 64 Years | 10 (100.0%) | 0 (0.0%) |
| 65 to 74 Years | 0 (0.0%) | 0 (0.0%) |
| 75 Years and over | 0 (0.0%) | 9 (100.0%) |
Disability Class: Cognitive Difficulty
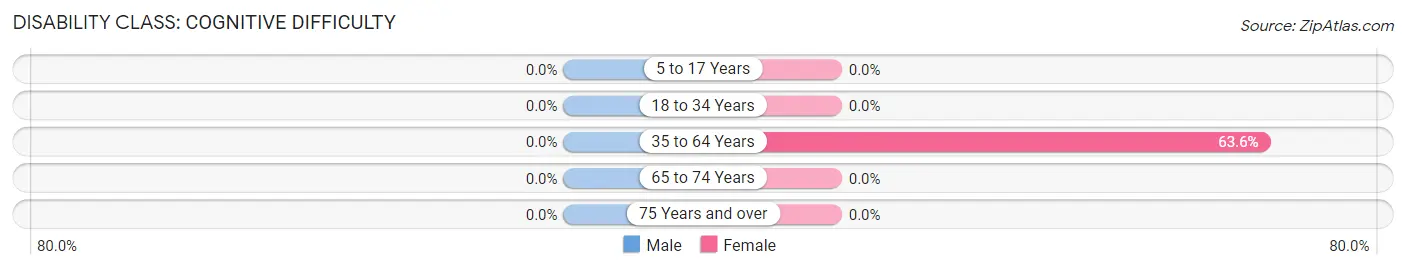
| Age Bracket | Male | Female |
| 5 to 17 Years | 0 (0.0%) | 0 (0.0%) |
| 18 to 34 Years | 0 (0.0%) | 0 (0.0%) |
| 35 to 64 Years | 0 (0.0%) | 28 (63.6%) |
| 65 to 74 Years | 0 (0.0%) | 0 (0.0%) |
| 75 Years and over | 0 (0.0%) | 0 (0.0%) |
Disability Class: Ambulatory Difficulty
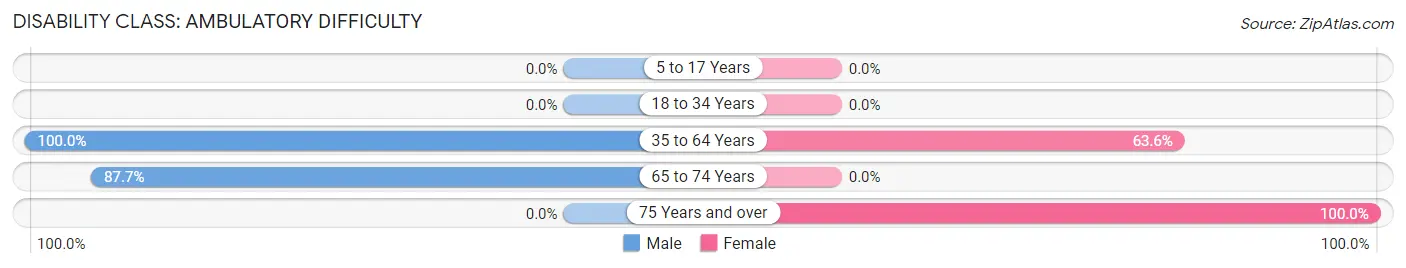
| Age Bracket | Male | Female |
| 5 to 17 Years | 0 (0.0%) | 0 (0.0%) |
| 18 to 34 Years | 0 (0.0%) | 0 (0.0%) |
| 35 to 64 Years | 10 (100.0%) | 28 (63.6%) |
| 65 to 74 Years | 64 (87.7%) | 0 (0.0%) |
| 75 Years and over | 0 (0.0%) | 9 (100.0%) |
Disability Class: Self-Care Difficulty
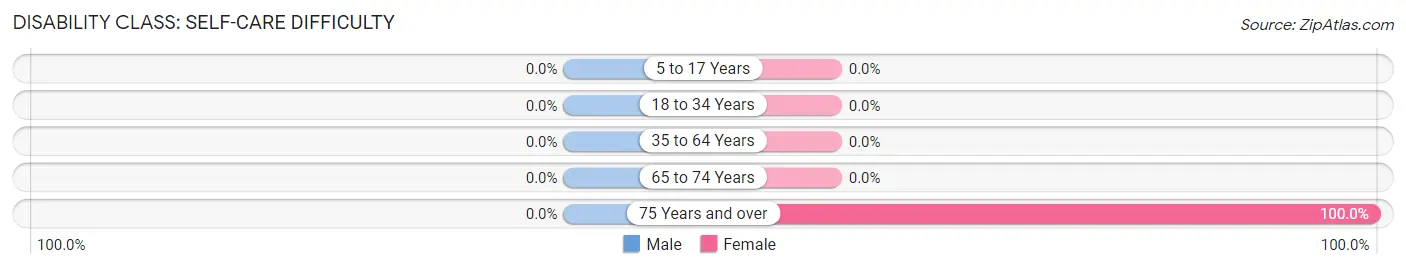
| Age Bracket | Male | Female |
| 5 to 17 Years | 0 (0.0%) | 0 (0.0%) |
| 18 to 34 Years | 0 (0.0%) | 0 (0.0%) |
| 35 to 64 Years | 0 (0.0%) | 0 (0.0%) |
| 65 to 74 Years | 0 (0.0%) | 0 (0.0%) |
| 75 Years and over | 0 (0.0%) | 9 (100.0%) |
Technology Access in Rockingham
Computing Device Access in Rockingham
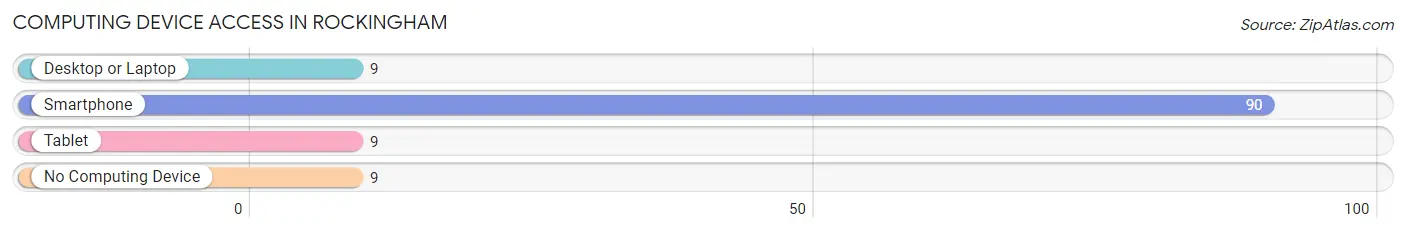
| Device Type | # Households | % Households |
| Desktop or Laptop | 9 | 9.1% |
| Smartphone | 90 | 90.9% |
| Tablet | 9 | 9.1% |
| No Computing Device | 9 | 9.1% |
| Total | 99 | 100.0% |
Internet Access in Rockingham
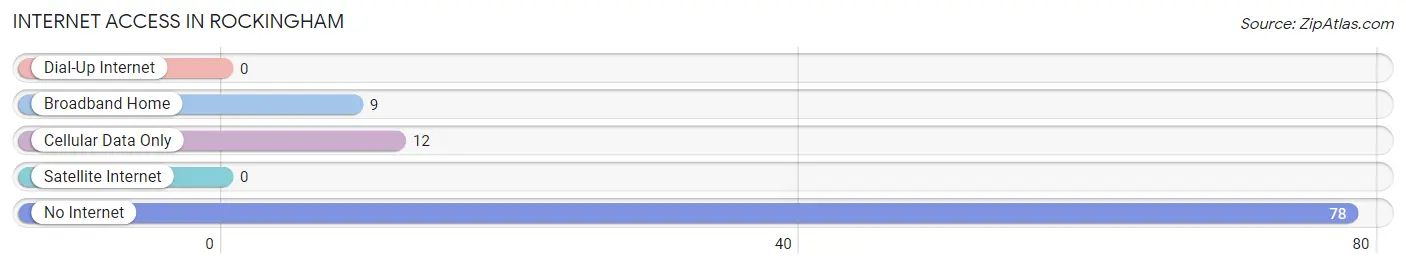
| Internet Type | # Households | % Households |
| Dial-Up Internet | 0 | 0.0% |
| Broadband Home | 9 | 9.1% |
| Cellular Data Only | 12 | 12.1% |
| Satellite Internet | 0 | 0.0% |
| No Internet | 78 | 78.8% |
| Total | 99 | 100.0% |
Rockingham Summary
Rockingham, Georgia is a small town located in Richmond County, Georgia. It is situated on the banks of the Ogeechee River, about 20 miles south of Augusta. The town was founded in 1820 and was named after the Rockingham plantation, which was owned by the prominent local family of the same name. The town has a population of approximately 1,500 people and is part of the Augusta-Richmond County Metropolitan Statistical Area.
Geography
Rockingham is located in the Piedmont region of Georgia, which is characterized by rolling hills and flat plains. The town is situated on the banks of the Ogeechee River, which is a major tributary of the Savannah River. The town is located in the heart of the Georgia Piedmont, which is known for its fertile soil and abundant wildlife. The town is surrounded by a number of small towns and rural communities, including Hephzibah, Blythe, and Waynesboro.
Climate
Rockingham has a humid subtropical climate, with hot, humid summers and mild winters. The average annual temperature is around 70 degrees Fahrenheit, with temperatures reaching as high as 95 degrees in the summer and as low as 40 degrees in the winter. The town receives an average of 48 inches of precipitation per year, with most of it falling in the summer months.
Demographics
As of the 2010 census, the population of Rockingham was 1,521. The racial makeup of the town was 79.2% White, 17.3% African American, 0.3% Native American, 0.7% Asian, 0.1% Pacific Islander, and 2.4% from other races. The median household income was $30,938, and the median family income was $37,813.
Economy
Rockingham’s economy is largely based on agriculture and manufacturing. The town is home to several large farms, which produce a variety of crops, including cotton, corn, soybeans, and peanuts. The town is also home to several manufacturing plants, which produce a variety of products, including furniture, textiles, and automotive parts.
History
Rockingham was founded in 1820 by the prominent local family of the same name. The town was named after the Rockingham plantation, which was owned by the family. The town quickly grew and became a center of commerce and industry in the area. In the late 19th century, the town was home to several cotton mills and other manufacturing plants. The town was also home to a number of prominent families, including the Rockinghams, who were influential in the local economy and politics.
In the early 20th century, the town experienced a period of decline as the local economy shifted away from agriculture and manufacturing. The town was hit hard by the Great Depression and World War II, and many of the town’s businesses closed. In the late 20th century, the town experienced a resurgence as new businesses opened and the local economy began to diversify. Today, Rockingham is a small but vibrant town, with a strong sense of community and a bright future.
Common Questions
What is Per Capita Income in Rockingham?
Per Capita income in Rockingham is $23,313.
What is the Median Household income in Rockingham?
Median Household Income in Rockingham is $19,399.
What is Inequality or Gini Index in Rockingham?
Inequality or Gini Index in Rockingham is 0.49.
What is the Total Population of Rockingham?
Total Population of Rockingham is 151.
What is the Total Male Population of Rockingham?
Total Male Population of Rockingham is 90.
What is the Total Female Population of Rockingham?
Total Female Population of Rockingham is 61.
What is the Ratio of Males per 100 Females in Rockingham?
There are 147.54 Males per 100 Females in Rockingham.
What is the Ratio of Females per 100 Males in Rockingham?
There are 67.78 Females per 100 Males in Rockingham.
What is the Median Population Age in Rockingham?
Median Population Age in Rockingham is 68.4 Years.
What is the Average Family Size in Rockingham
Average Family Size in Rockingham is 1.7 People.
What is the Average Household Size in Rockingham
Average Household Size in Rockingham is 1.5 People.
How Large is the Labor Force in Rockingham?
There are 77 People in the Labor Forcein in Rockingham.
What is the Percentage of People in the Labor Force in Rockingham?
51.0% of People are in the Labor Force in Rockingham.