Dewy Rose, GA Map & Demographics
Dewy Rose Map
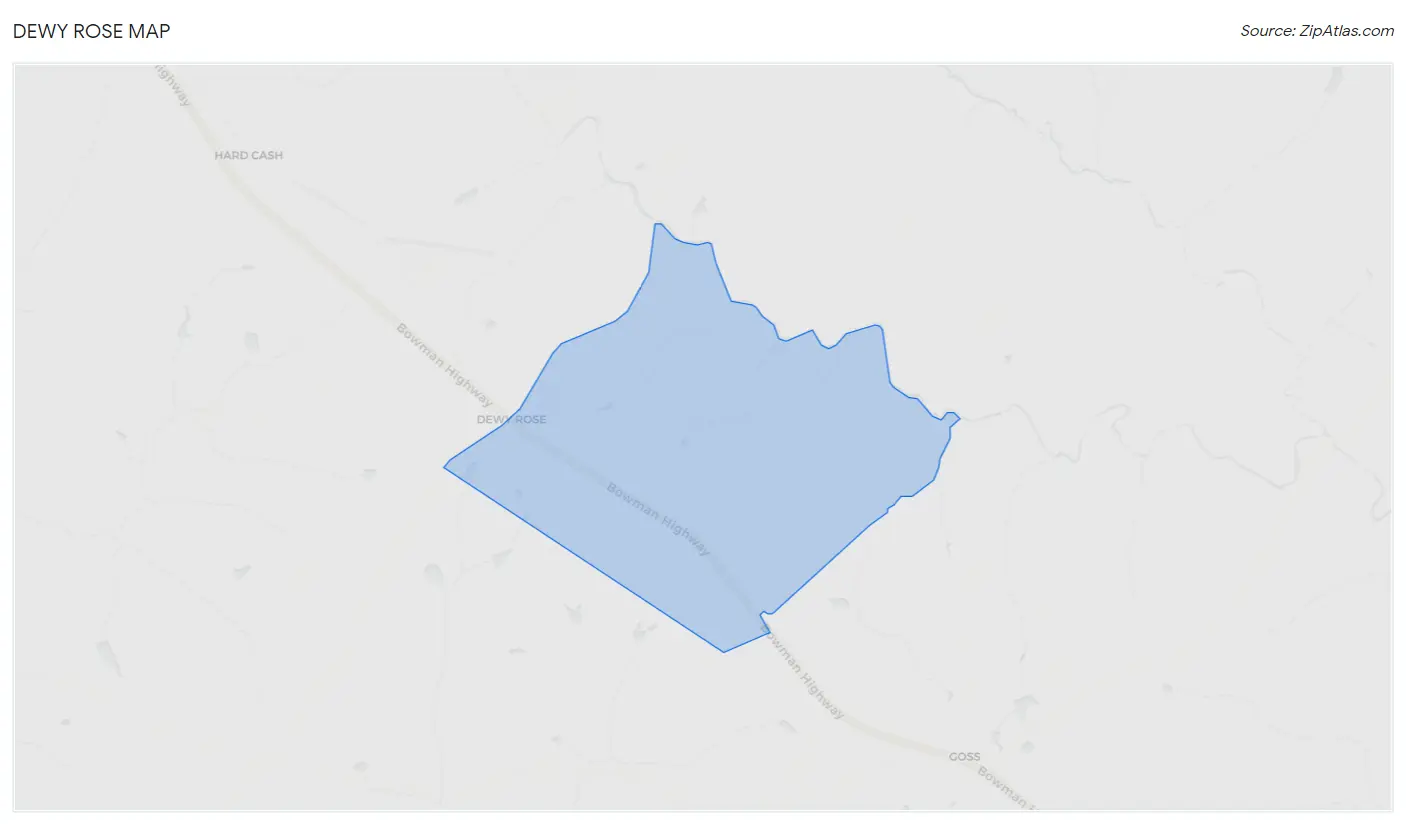
Dewy Rose Overview
$18,207
PER CAPITA INCOME
$48,828
AVG FAMILY INCOME
$48,516
AVG HOUSEHOLD INCOME
2.0%
WAGE / INCOME GAP [ % ]
98.0¢/ $1
WAGE / INCOME GAP [ $ ]
0.14
INEQUALITY / GINI INDEX
269
TOTAL POPULATION
140
MALE POPULATION
129
FEMALE POPULATION
108.53
MALES / 100 FEMALES
92.14
FEMALES / 100 MALES
46.2
MEDIAN AGE
3.4
AVG FAMILY SIZE
3.4
AVG HOUSEHOLD SIZE
165
LABOR FORCE [ PEOPLE ]
67.9%
PERCENT IN LABOR FORCE
Dewy Rose Zip Codes
Dewy Rose Area Codes
Income in Dewy Rose
Income Overview in Dewy Rose
Per Capita Income in Dewy Rose is $18,207, while median incomes of families and households are $48,828 and $48,516 respectively.
| Characteristic | Number | Measure |
| Per Capita Income | 269 | $18,207 |
| Median Family Income | 72 | $48,828 |
| Mean Family Income | 72 | $47,636 |
| Median Household Income | 80 | $48,516 |
| Mean Household Income | 80 | $50,376 |
| Income Deficit | 72 | $0 |
| Wage / Income Gap (%) | 269 | 2.01% |
| Wage / Income Gap ($) | 269 | 97.99¢ per $1 |
| Gini / Inequality Index | 269 | 0.14 |
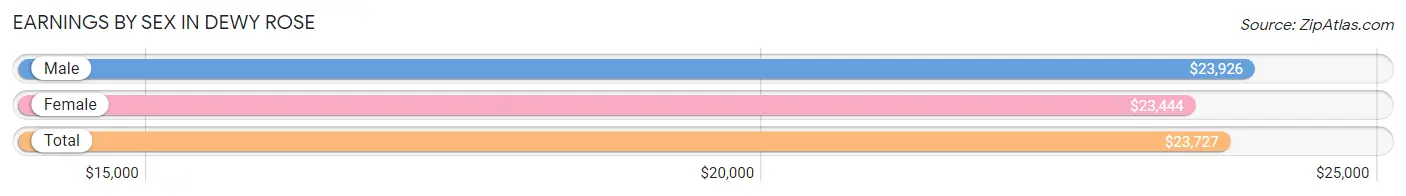
Earnings by Sex in Dewy Rose
Average Earnings in Dewy Rose are $23,727, $23,926 for men and $23,444 for women, a difference of 2.0%.
| Sex | Number | Average Earnings |
| Male | 91 (55.1%) | $23,926 |
| Female | 74 (44.9%) | $23,444 |
| Total | 165 (100.0%) | $23,727 |
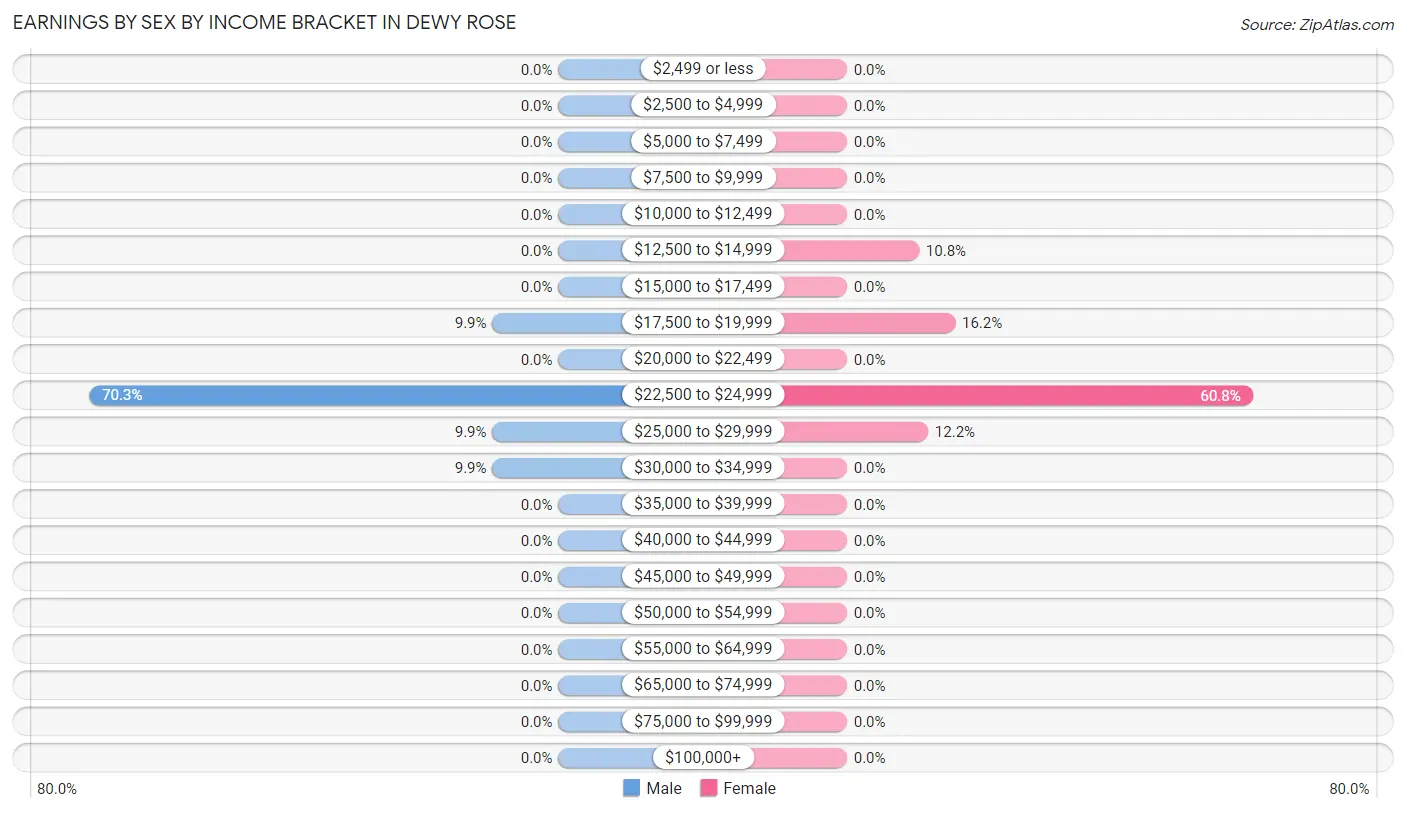
Earnings by Sex by Income Bracket in Dewy Rose
The most common earnings brackets in Dewy Rose are $22,500 to $24,999 for men (64 | 70.3%) and $22,500 to $24,999 for women (45 | 60.8%).
| Income | Male | Female |
| $2,499 or less | 0 (0.0%) | 0 (0.0%) |
| $2,500 to $4,999 | 0 (0.0%) | 0 (0.0%) |
| $5,000 to $7,499 | 0 (0.0%) | 0 (0.0%) |
| $7,500 to $9,999 | 0 (0.0%) | 0 (0.0%) |
| $10,000 to $12,499 | 0 (0.0%) | 0 (0.0%) |
| $12,500 to $14,999 | 0 (0.0%) | 8 (10.8%) |
| $15,000 to $17,499 | 0 (0.0%) | 0 (0.0%) |
| $17,500 to $19,999 | 9 (9.9%) | 12 (16.2%) |
| $20,000 to $22,499 | 0 (0.0%) | 0 (0.0%) |
| $22,500 to $24,999 | 64 (70.3%) | 45 (60.8%) |
| $25,000 to $29,999 | 9 (9.9%) | 9 (12.2%) |
| $30,000 to $34,999 | 9 (9.9%) | 0 (0.0%) |
| $35,000 to $39,999 | 0 (0.0%) | 0 (0.0%) |
| $40,000 to $44,999 | 0 (0.0%) | 0 (0.0%) |
| $45,000 to $49,999 | 0 (0.0%) | 0 (0.0%) |
| $50,000 to $54,999 | 0 (0.0%) | 0 (0.0%) |
| $55,000 to $64,999 | 0 (0.0%) | 0 (0.0%) |
| $65,000 to $74,999 | 0 (0.0%) | 0 (0.0%) |
| $75,000 to $99,999 | 0 (0.0%) | 0 (0.0%) |
| $100,000+ | 0 (0.0%) | 0 (0.0%) |
| Total | 91 (100.0%) | 74 (100.0%) |
Earnings by Sex by Educational Attainment in Dewy Rose
| Educational Attainment | Male Income | Female Income |
| Less than High School | - | - |
| High School Diploma | - | - |
| College or Associate's Degree | - | - |
| Bachelor's Degree | - | - |
| Graduate Degree | - | - |
| Total | $23,926 | $23,194 |
Family Income in Dewy Rose
Family Income Brackets in Dewy Rose
According to the Dewy Rose family income data, there are 32 families falling into the $35,000 to $49,999 income range, which is the most common income bracket and makes up 44.4% of all families.
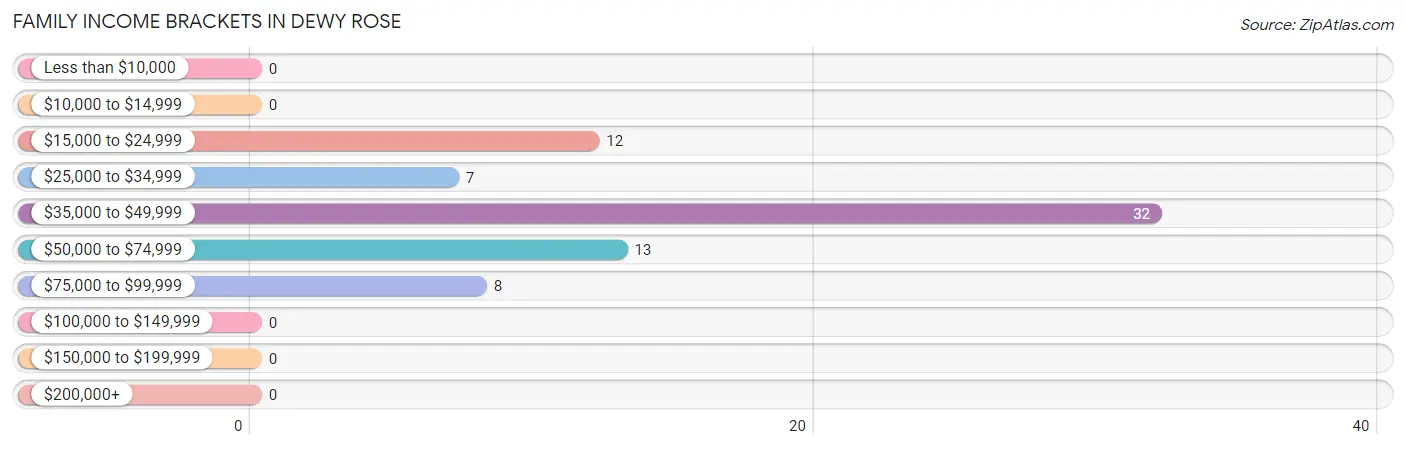
| Income Bracket | # Families | % Families |
| Less than $10,000 | 0 | 0.0% |
| $10,000 to $14,999 | 0 | 0.0% |
| $15,000 to $24,999 | 12 | 16.7% |
| $25,000 to $34,999 | 7 | 9.7% |
| $35,000 to $49,999 | 32 | 44.4% |
| $50,000 to $74,999 | 13 | 18.1% |
| $75,000 to $99,999 | 8 | 11.1% |
| $100,000 to $149,999 | 0 | 0.0% |
| $150,000 to $199,999 | 0 | 0.0% |
| $200,000+ | 0 | 0.0% |
Family Income by Famaliy Size in Dewy Rose
2-person families (51 | 70.8%) account for the highest median family income in Dewy Rose with $48,008 per family, while 2-person families (51 | 70.8%) have the highest median income of $24,004 per family member.
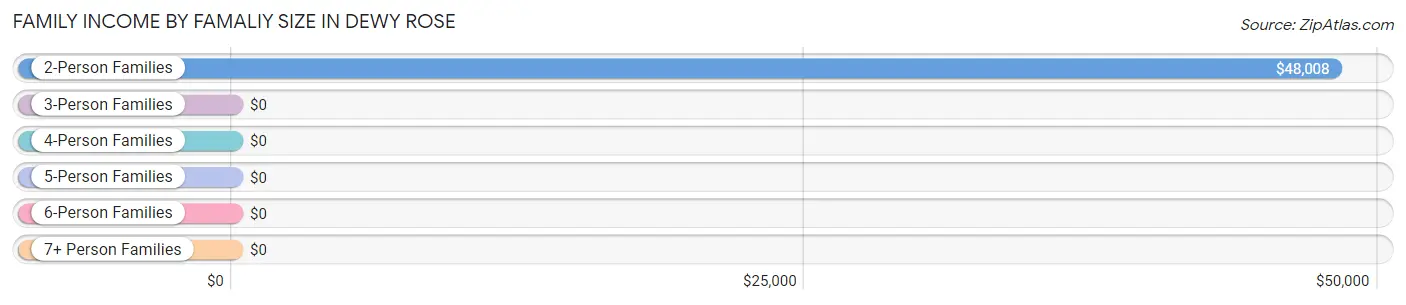
| Income Bracket | # Families | Median Income |
| 2-Person Families | 51 (70.8%) | $48,008 |
| 3-Person Families | 0 (0.0%) | $0 |
| 4-Person Families | 13 (18.1%) | $0 |
| 5-Person Families | 0 (0.0%) | $0 |
| 6-Person Families | 8 (11.1%) | $0 |
| 7+ Person Families | 0 (0.0%) | $0 |
| Total | 72 (100.0%) | $48,828 |
Family Income by Number of Earners in Dewy Rose
| Number of Earners | # Families | Median Income |
| No Earners | 7 (9.7%) | $0 |
| 1 Earner | 12 (16.7%) | $0 |
| 2 Earners | 45 (62.5%) | $0 |
| 3+ Earners | 8 (11.1%) | $0 |
| Total | 72 (100.0%) | $48,828 |
Household Income in Dewy Rose
Household Income Brackets in Dewy Rose
With 52 households falling in the category, the $35,000 to $49,999 income range is the most frequent in Dewy Rose, accounting for 65.0% of all households.
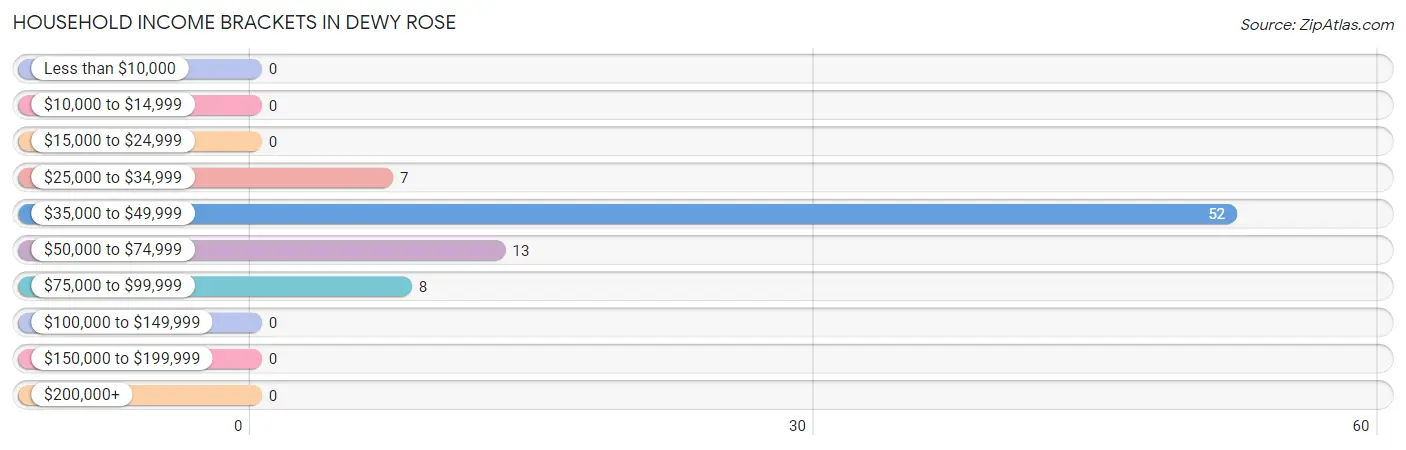
| Income Bracket | # Households | % Households |
| Less than $10,000 | 0 | 0.0% |
| $10,000 to $14,999 | 0 | 0.0% |
| $15,000 to $24,999 | 0 | 0.0% |
| $25,000 to $34,999 | 7 | 8.8% |
| $35,000 to $49,999 | 52 | 65.0% |
| $50,000 to $74,999 | 13 | 16.3% |
| $75,000 to $99,999 | 8 | 10.0% |
| $100,000 to $149,999 | 0 | 0.0% |
| $150,000 to $199,999 | 0 | 0.0% |
| $200,000+ | 0 | 0.0% |
Household Income by Householder Age in Dewy Rose
The median household income in Dewy Rose is $48,516, with the highest median household income of $50,865 found in the 25 to 44 years age bracket for the primary householder. A total of 33 households (41.2%) fall into this category.
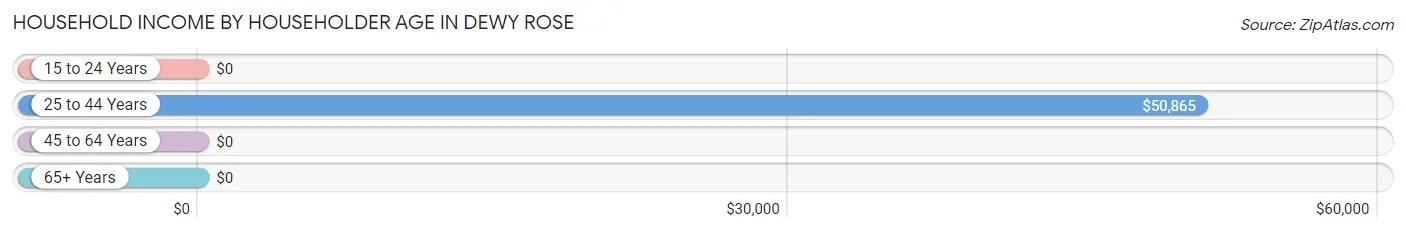
| Income Bracket | # Households | Median Income |
| 15 to 24 Years | 0 (0.0%) | $0 |
| 25 to 44 Years | 33 (41.2%) | $50,865 |
| 45 to 64 Years | 32 (40.0%) | $0 |
| 65+ Years | 15 (18.8%) | $0 |
| Total | 80 (100.0%) | $48,516 |
Poverty in Dewy Rose
Income Below Poverty by Sex and Age in Dewy Rose
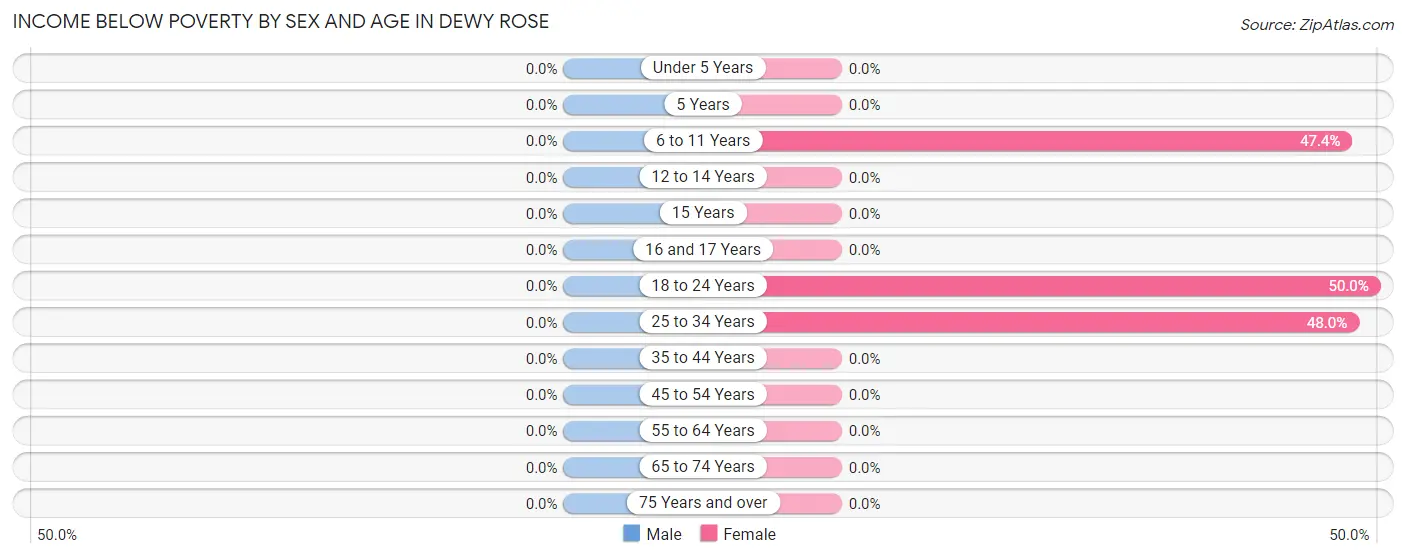
| Age Bracket | Male | Female |
| Under 5 Years | 0 (0.0%) | 0 (0.0%) |
| 5 Years | 0 (0.0%) | 0 (0.0%) |
| 6 to 11 Years | 0 (0.0%) | 9 (47.4%) |
| 12 to 14 Years | 0 (0.0%) | 0 (0.0%) |
| 15 Years | 0 (0.0%) | 0 (0.0%) |
| 16 and 17 Years | 0 (0.0%) | 0 (0.0%) |
| 18 to 24 Years | 0 (0.0%) | 9 (50.0%) |
| 25 to 34 Years | 0 (0.0%) | 12 (48.0%) |
| 35 to 44 Years | 0 (0.0%) | 0 (0.0%) |
| 45 to 54 Years | 0 (0.0%) | 0 (0.0%) |
| 55 to 64 Years | 0 (0.0%) | 0 (0.0%) |
| 65 to 74 Years | 0 (0.0%) | 0 (0.0%) |
| 75 Years and over | 0 (0.0%) | 0 (0.0%) |
| Total | 0 (0.0%) | 30 (23.3%) |
Income Above Poverty by Sex and Age in Dewy Rose
According to the poverty statistics in Dewy Rose, males aged 6 to 11 years and females aged 35 to 44 years are the age groups that are most secure financially, with 100.0% of males and 100.0% of females in these age groups living above the poverty line.
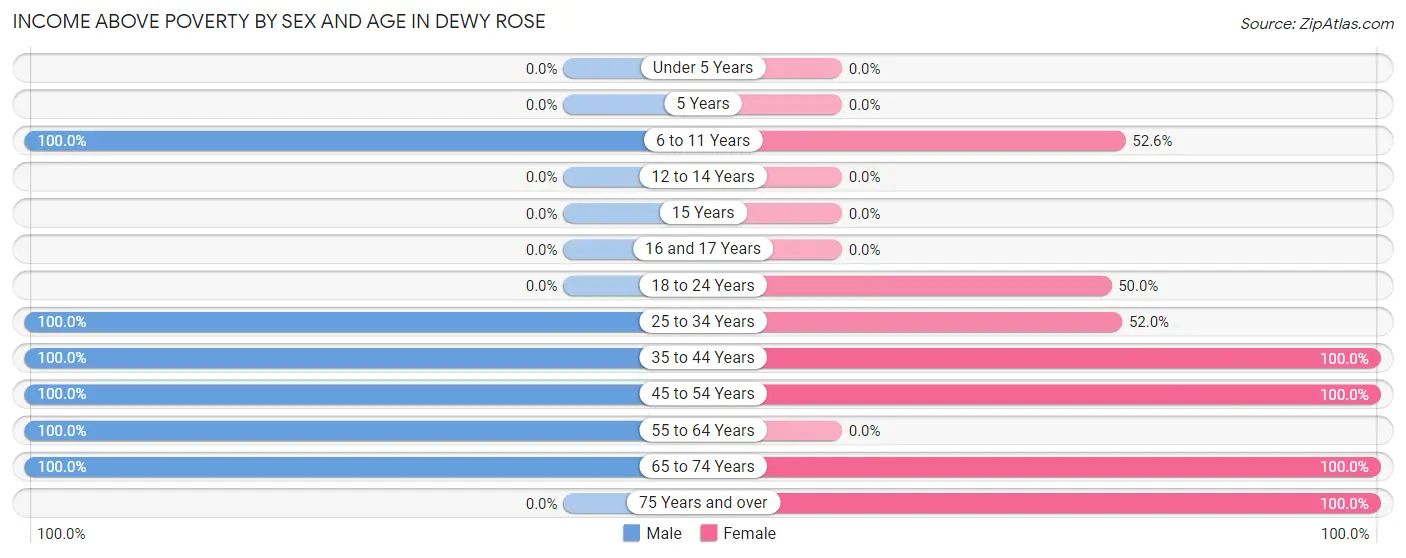
| Age Bracket | Male | Female |
| Under 5 Years | 0 (0.0%) | 0 (0.0%) |
| 5 Years | 0 (0.0%) | 0 (0.0%) |
| 6 to 11 Years | 7 (100.0%) | 10 (52.6%) |
| 12 to 14 Years | 0 (0.0%) | 0 (0.0%) |
| 15 Years | 0 (0.0%) | 0 (0.0%) |
| 16 and 17 Years | 0 (0.0%) | 0 (0.0%) |
| 18 to 24 Years | 0 (0.0%) | 9 (50.0%) |
| 25 to 34 Years | 38 (100.0%) | 13 (52.0%) |
| 35 to 44 Years | 12 (100.0%) | 8 (100.0%) |
| 45 to 54 Years | 9 (100.0%) | 32 (100.0%) |
| 55 to 64 Years | 64 (100.0%) | 0 (0.0%) |
| 65 to 74 Years | 10 (100.0%) | 19 (100.0%) |
| 75 Years and over | 0 (0.0%) | 8 (100.0%) |
| Total | 140 (100.0%) | 99 (76.7%) |
Income Below Poverty Among Married-Couple Families in Dewy Rose
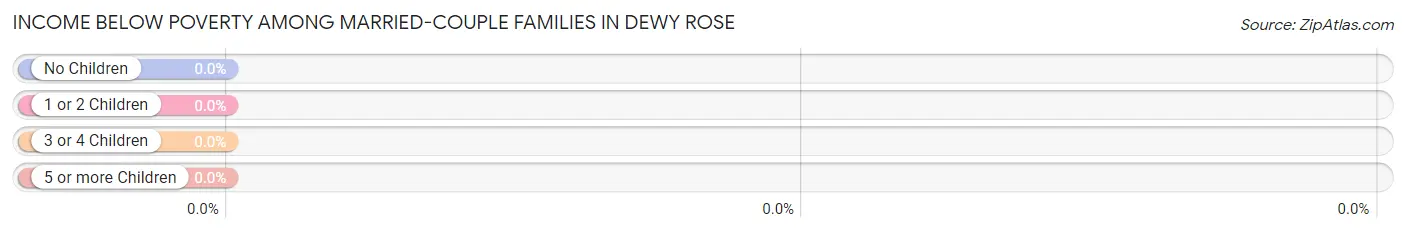
| Children | Above Poverty | Below Poverty |
| No Children | 15 (100.0%) | 0 (0.0%) |
| 1 or 2 Children | 13 (100.0%) | 0 (0.0%) |
| 3 or 4 Children | 0 (0.0%) | 0 (0.0%) |
| 5 or more Children | 0 (0.0%) | 0 (0.0%) |
| Total | 28 (100.0%) | 0 (0.0%) |
Income Below Poverty Among Single-Parent Households in Dewy Rose
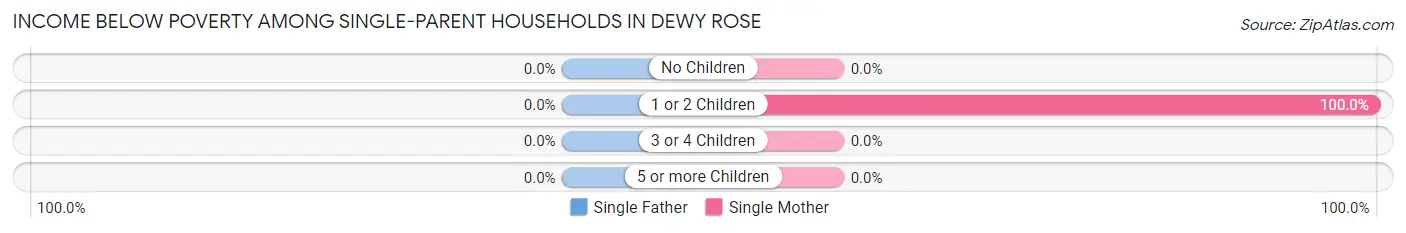
| Children | Single Father | Single Mother |
| No Children | 0 (0.0%) | 0 (0.0%) |
| 1 or 2 Children | 0 (0.0%) | 12 (100.0%) |
| 3 or 4 Children | 0 (0.0%) | 0 (0.0%) |
| 5 or more Children | 0 (0.0%) | 0 (0.0%) |
| Total | 0 (0.0%) | 12 (27.3%) |
Income Below Poverty Among Married-Couple vs Single-Parent Households in Dewy Rose
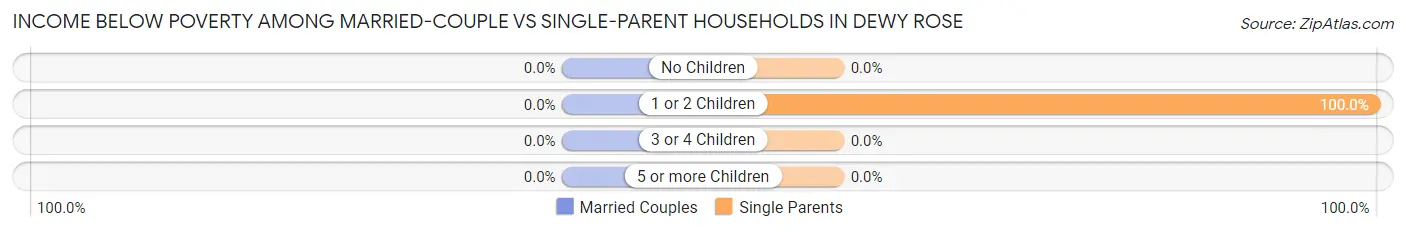
| Children | Married-Couple Families | Single-Parent Households |
| No Children | 0 (0.0%) | 0 (0.0%) |
| 1 or 2 Children | 0 (0.0%) | 12 (100.0%) |
| 3 or 4 Children | 0 (0.0%) | 0 (0.0%) |
| 5 or more Children | 0 (0.0%) | 0 (0.0%) |
| Total | 0 (0.0%) | 12 (27.3%) |
Race in Dewy Rose
The most populous races in Dewy Rose are White / Caucasian (269 | 100.0%), and Hispanic or Latino (96 | 35.7%).
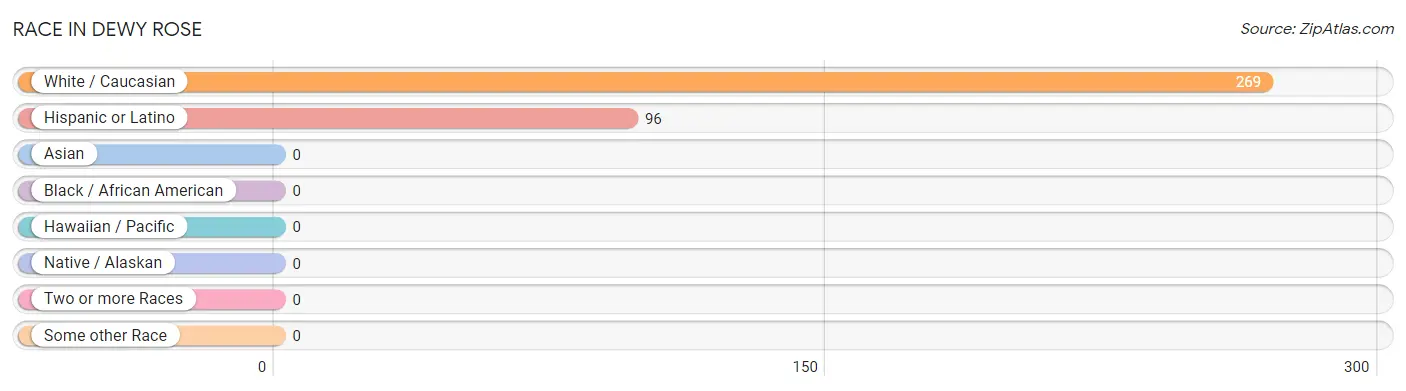
| Race | # Population | % Population |
| Asian | 0 | 0.0% |
| Black / African American | 0 | 0.0% |
| Hawaiian / Pacific | 0 | 0.0% |
| Hispanic or Latino | 96 | 35.7% |
| Native / Alaskan | 0 | 0.0% |
| White / Caucasian | 269 | 100.0% |
| Two or more Races | 0 | 0.0% |
| Some other Race | 0 | 0.0% |
| Total | 269 | 100.0% |
Ancestry in Dewy Rose
The most populous ancestries reported in Dewy Rose are Mexican (96 | 35.7%), American (68 | 25.3%), English (25 | 9.3%), Scottish (10 | 3.7%), and Danish (7 | 2.6%), together accounting for 76.6% of all Dewy Rose residents.
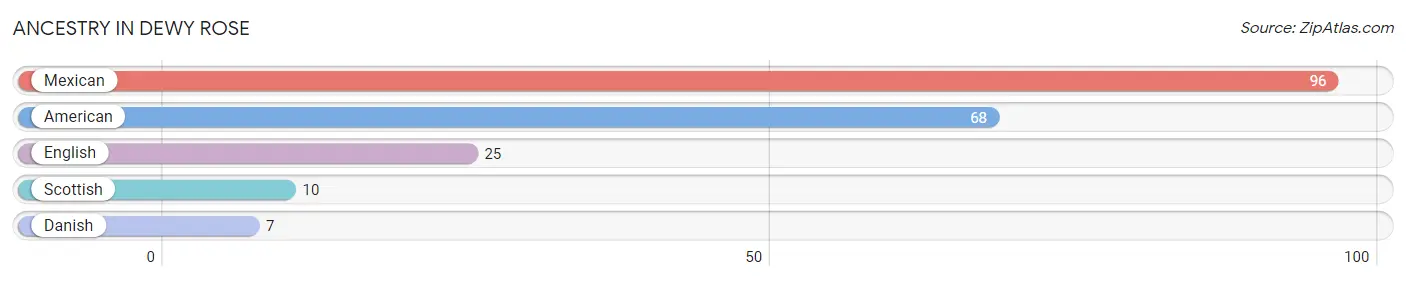
| Ancestry | # Population | % Population |
| American | 68 | 25.3% |
| Danish | 7 | 2.6% |
| English | 25 | 9.3% |
| Mexican | 96 | 35.7% |
| Scottish | 10 | 3.7% | View All 5 Rows |
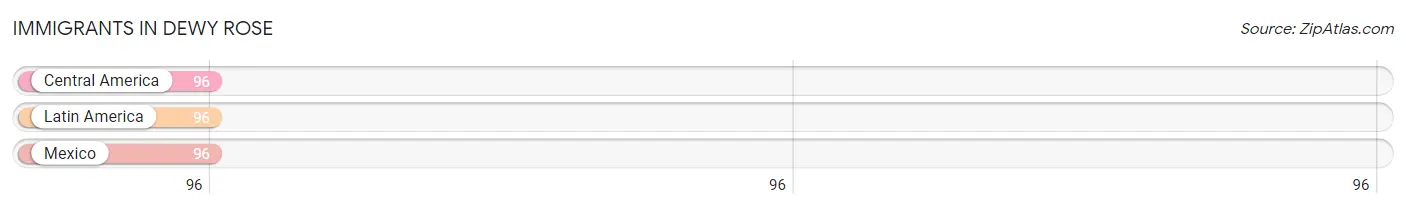
Immigrants in Dewy Rose
The most numerous immigrant groups reported in Dewy Rose came from Central America (96 | 35.7%), Latin America (96 | 35.7%), and Mexico (96 | 35.7%), together accounting for 107.1% of all Dewy Rose residents.
| Immigration Origin | # Population | % Population |
| Central America | 96 | 35.7% |
| Latin America | 96 | 35.7% |
| Mexico | 96 | 35.7% | View All 3 Rows |
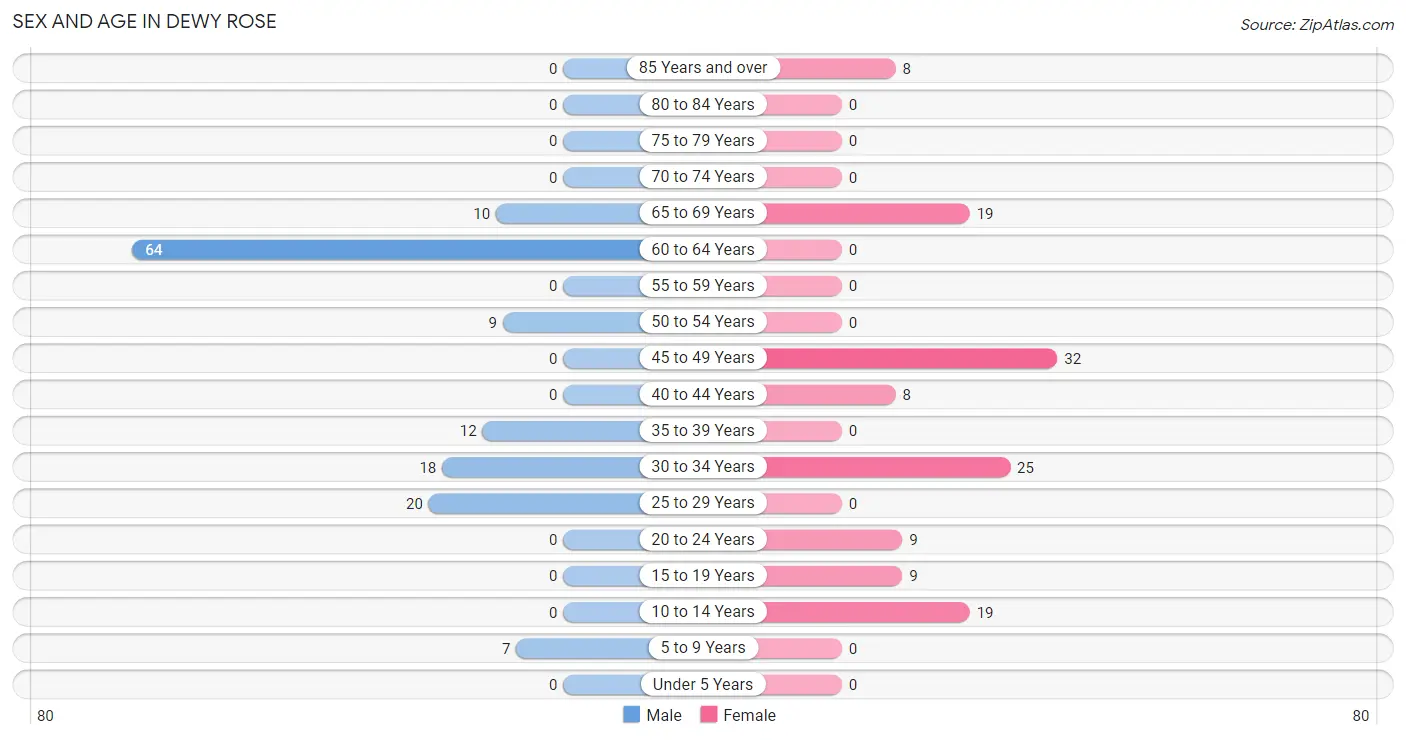
Sex and Age in Dewy Rose
Sex and Age in Dewy Rose
The most populous age groups in Dewy Rose are 60 to 64 Years (64 | 45.7%) for men and 45 to 49 Years (32 | 24.8%) for women.
| Age Bracket | Male | Female |
| Under 5 Years | 0 (0.0%) | 0 (0.0%) |
| 5 to 9 Years | 7 (5.0%) | 0 (0.0%) |
| 10 to 14 Years | 0 (0.0%) | 19 (14.7%) |
| 15 to 19 Years | 0 (0.0%) | 9 (7.0%) |
| 20 to 24 Years | 0 (0.0%) | 9 (7.0%) |
| 25 to 29 Years | 20 (14.3%) | 0 (0.0%) |
| 30 to 34 Years | 18 (12.9%) | 25 (19.4%) |
| 35 to 39 Years | 12 (8.6%) | 0 (0.0%) |
| 40 to 44 Years | 0 (0.0%) | 8 (6.2%) |
| 45 to 49 Years | 0 (0.0%) | 32 (24.8%) |
| 50 to 54 Years | 9 (6.4%) | 0 (0.0%) |
| 55 to 59 Years | 0 (0.0%) | 0 (0.0%) |
| 60 to 64 Years | 64 (45.7%) | 0 (0.0%) |
| 65 to 69 Years | 10 (7.1%) | 19 (14.7%) |
| 70 to 74 Years | 0 (0.0%) | 0 (0.0%) |
| 75 to 79 Years | 0 (0.0%) | 0 (0.0%) |
| 80 to 84 Years | 0 (0.0%) | 0 (0.0%) |
| 85 Years and over | 0 (0.0%) | 8 (6.2%) |
| Total | 140 (100.0%) | 129 (100.0%) |
Families and Households in Dewy Rose
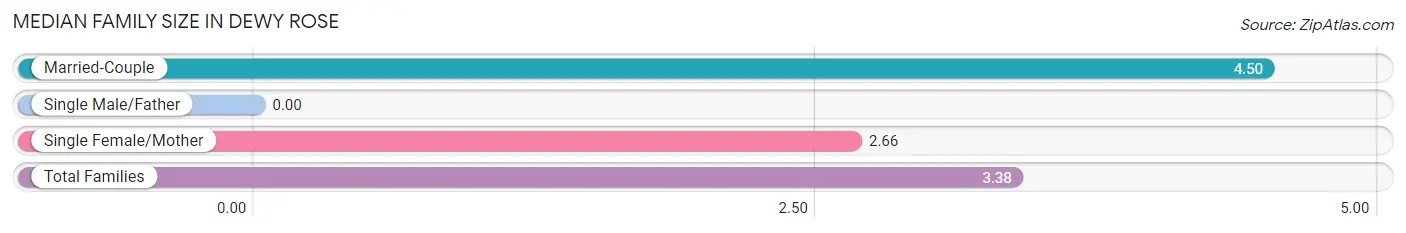
Median Family Size in Dewy Rose
| Family Type | # Families | Family Size |
| Married-Couple | 28 (38.9%) | 4.50 |
| Single Male/Father | 0 (0.0%) | - |
| Single Female/Mother | 44 (61.1%) | 2.66 |
| Total Families | 72 (100.0%) | 3.38 |
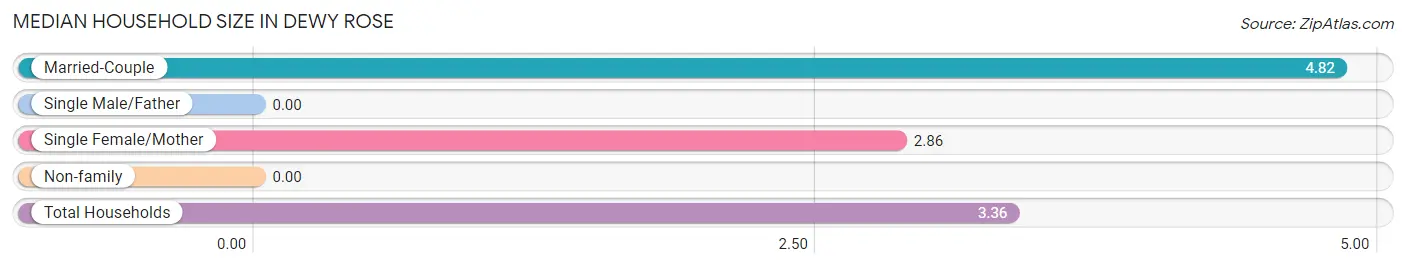
Median Household Size in Dewy Rose
| Household Type | # Households | Household Size |
| Married-Couple | 28 (35.0%) | 4.82 |
| Single Male/Father | 0 (0.0%) | - |
| Single Female/Mother | 44 (55.0%) | 2.86 |
| Non-family | 8 (10.0%) | - |
| Total Households | 80 (100.0%) | 3.36 |
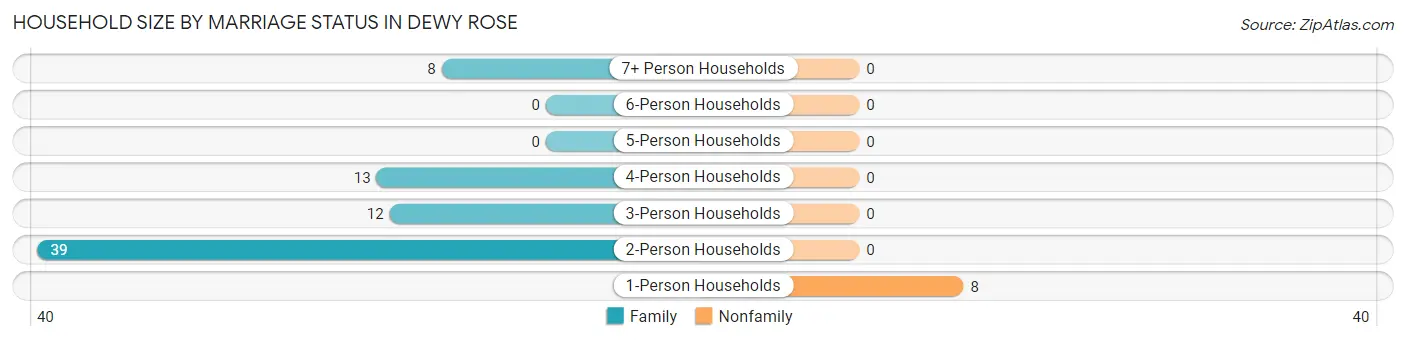
Household Size by Marriage Status in Dewy Rose
Out of a total of 80 households in Dewy Rose, 72 (90.0%) are family households, while 8 (10.0%) are nonfamily households. The most numerous type of family households are 2-person households, comprising 39, and the most common type of nonfamily households are 1-person households, comprising 8.
| Household Size | Family Households | Nonfamily Households |
| 1-Person Households | - | 8 (10.0%) |
| 2-Person Households | 39 (48.7%) | 0 (0.0%) |
| 3-Person Households | 12 (15.0%) | 0 (0.0%) |
| 4-Person Households | 13 (16.3%) | 0 (0.0%) |
| 5-Person Households | 0 (0.0%) | 0 (0.0%) |
| 6-Person Households | 0 (0.0%) | 0 (0.0%) |
| 7+ Person Households | 8 (10.0%) | 0 (0.0%) |
| Total | 72 (90.0%) | 8 (10.0%) |
Female Fertility in Dewy Rose
Fertility by Age in Dewy Rose
| Age Bracket | Women with Births | Births / 1,000 Women |
| 15 to 19 years | 0 (0.0%) | 0.0 |
| 20 to 34 years | 0 (0.0%) | 0.0 |
| 35 to 50 years | 0 (0.0%) | 0.0 |
| Total | 0 (0.0%) | 0.0 |
Fertility by Age by Marriage Status in Dewy Rose
| Age Bracket | Married | Unmarried |
| 15 to 19 years | 0 (0.0%) | 0 (0.0%) |
| 20 to 34 years | 0 (0.0%) | 0 (0.0%) |
| 35 to 50 years | 0 (0.0%) | 0 (0.0%) |
| Total | 0 (0.0%) | 0 (0.0%) |
Fertility by Education in Dewy Rose
| Educational Attainment | Women with Births | Births / 1,000 Women |
| Less than High School | 0 (0.0%) | 0.0 |
| High School Diploma | 0 (0.0%) | 0.0 |
| College or Associate's Degree | 0 (0.0%) | 0.0 |
| Bachelor's Degree | 0 (0.0%) | 0.0 |
| Graduate Degree | 0 (0.0%) | 0.0 |
| Total | 0 (0.0%) | 0.0 |
Fertility by Education by Marriage Status in Dewy Rose
| Educational Attainment | Married | Unmarried |
| Less than High School | 0 (0.0%) | 0 (0.0%) |
| High School Diploma | 0 (0.0%) | 0 (0.0%) |
| College or Associate's Degree | 0 (0.0%) | 0 (0.0%) |
| Bachelor's Degree | 0 (0.0%) | 0 (0.0%) |
| Graduate Degree | 0 (0.0%) | 0 (0.0%) |
| Total | 0 (0.0%) | 0 (0.0%) |
Employment Characteristics in Dewy Rose
Employment by Class of Employer in Dewy Rose
Among the 165 employed individuals in Dewy Rose, private company employees (153 | 92.7%), and local government employees (12 | 7.3%) make up the most common classes of employment.
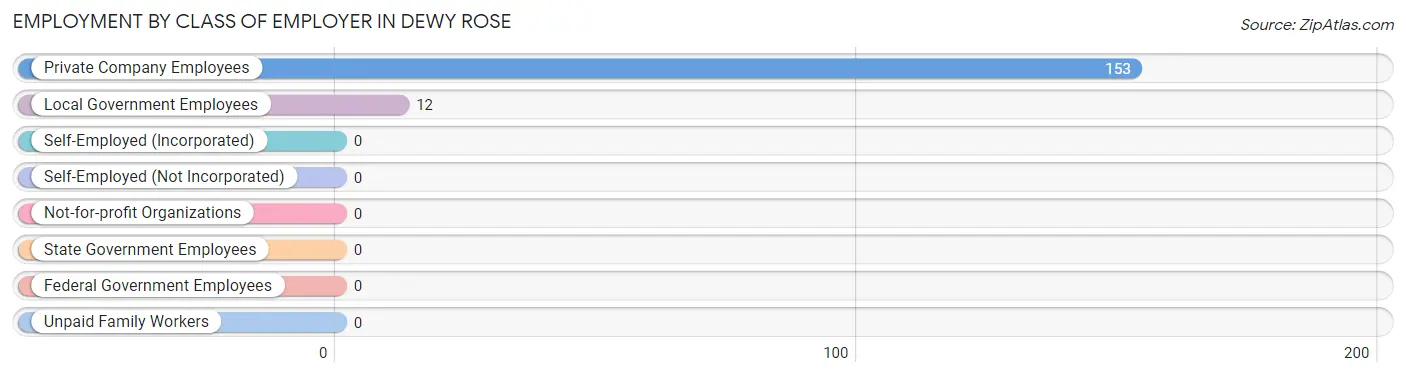
| Employer Class | # Employees | % Employees |
| Private Company Employees | 153 | 92.7% |
| Self-Employed (Incorporated) | 0 | 0.0% |
| Self-Employed (Not Incorporated) | 0 | 0.0% |
| Not-for-profit Organizations | 0 | 0.0% |
| Local Government Employees | 12 | 7.3% |
| State Government Employees | 0 | 0.0% |
| Federal Government Employees | 0 | 0.0% |
| Unpaid Family Workers | 0 | 0.0% |
| Total | 165 | 100.0% |
Employment Status by Age in Dewy Rose
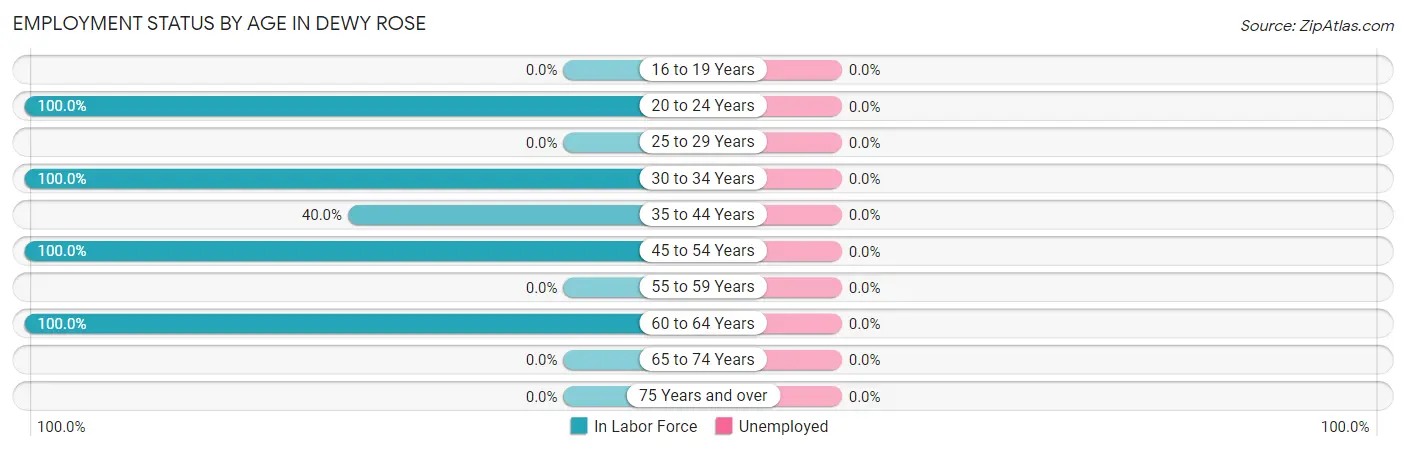
| Age Bracket | In Labor Force | Unemployed |
| 16 to 19 Years | 0 (0.0%) | 0 (0.0%) |
| 20 to 24 Years | 9 (100.0%) | 0 (0.0%) |
| 25 to 29 Years | 0 (0.0%) | 0 (0.0%) |
| 30 to 34 Years | 43 (100.0%) | 0 (0.0%) |
| 35 to 44 Years | 8 (40.0%) | 0 (0.0%) |
| 45 to 54 Years | 41 (100.0%) | 0 (0.0%) |
| 55 to 59 Years | 0 (0.0%) | 0 (0.0%) |
| 60 to 64 Years | 64 (100.0%) | 0 (0.0%) |
| 65 to 74 Years | 0 (0.0%) | 0 (0.0%) |
| 75 Years and over | 0 (0.0%) | 0 (0.0%) |
| Total | 165 (67.9%) | 0 (0.0%) |
Employment Status by Educational Attainment in Dewy Rose
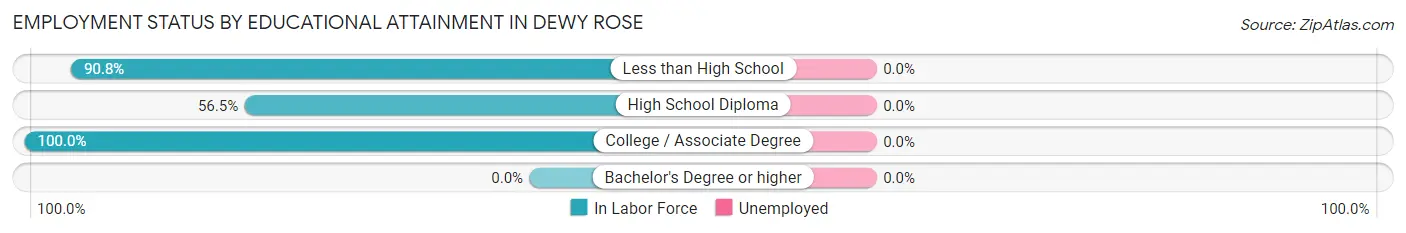
| Educational Attainment | In Labor Force | Unemployed |
| Less than High School | 118 (90.8%) | 0 (0.0%) |
| High School Diploma | 26 (56.5%) | 0 (0.0%) |
| College / Associate Degree | 12 (100.0%) | 0 (0.0%) |
| Bachelor's Degree or higher | 0 (0.0%) | 0 (0.0%) |
| Total | 156 (83.0%) | 0 (0.0%) |
Employment Occupations by Sex in Dewy Rose
Management, Business, Science and Arts Occupations
The most common Management, Business, Science and Arts occupations in Dewy Rose are Community & Social Service (12 | 7.3%), and Education Instruction & Library (12 | 7.3%).
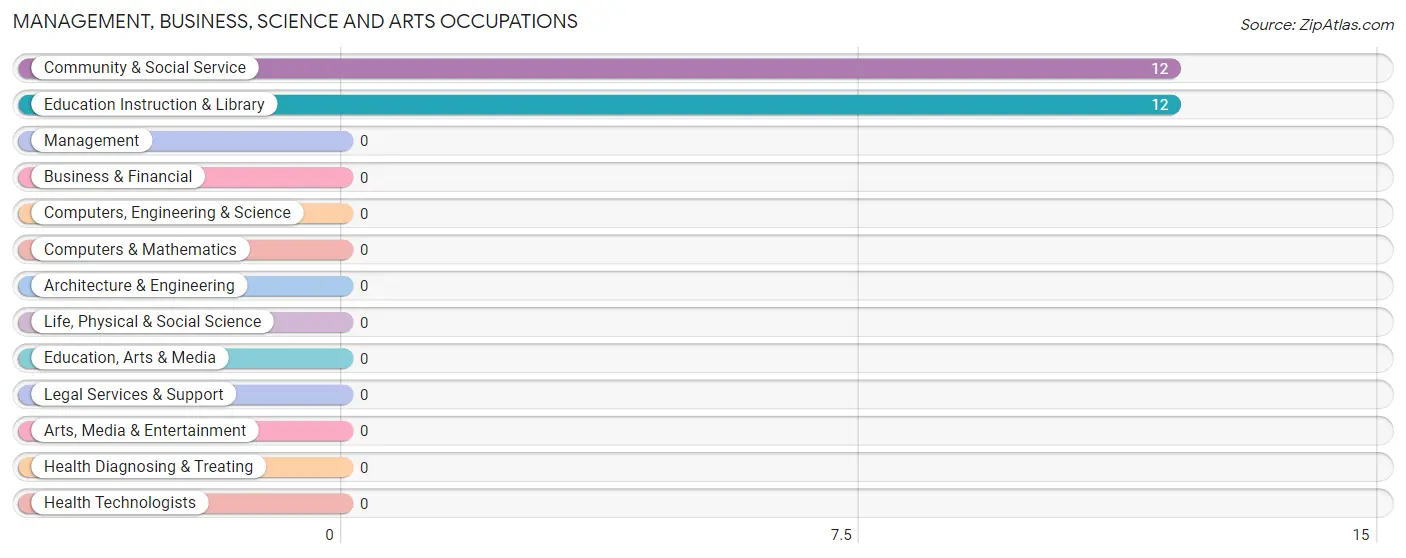
Management, Business, Science and Arts Occupations by Sex
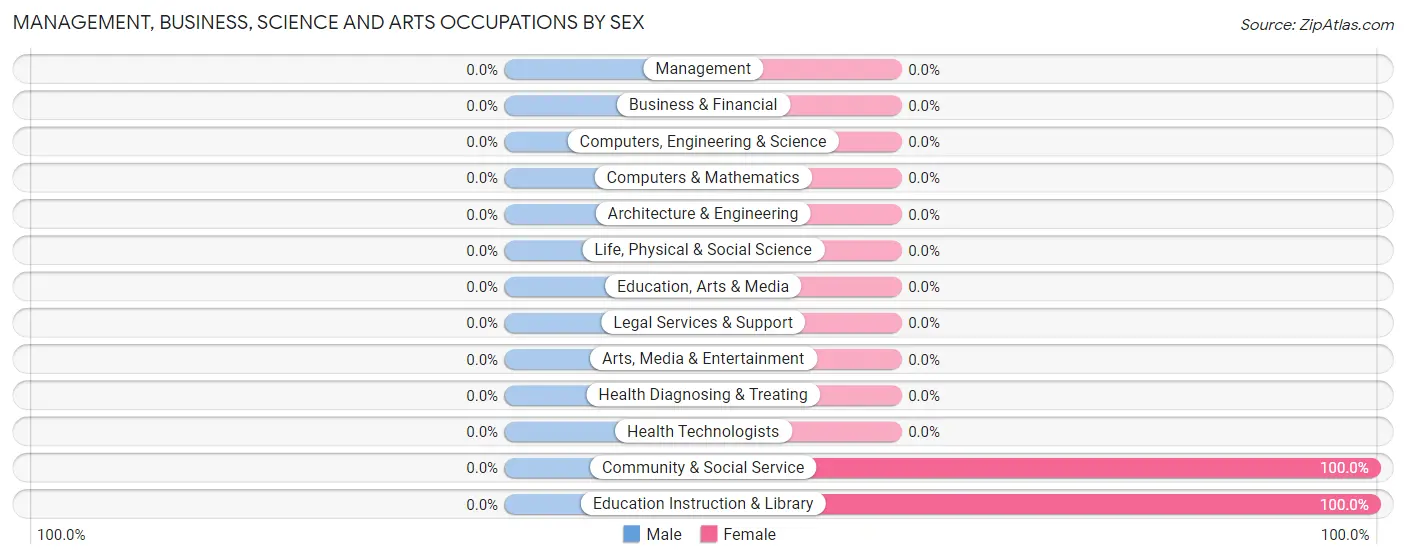
| Occupation | Male | Female |
| Management | 0 (0.0%) | 0 (0.0%) |
| Business & Financial | 0 (0.0%) | 0 (0.0%) |
| Computers, Engineering & Science | 0 (0.0%) | 0 (0.0%) |
| Computers & Mathematics | 0 (0.0%) | 0 (0.0%) |
| Architecture & Engineering | 0 (0.0%) | 0 (0.0%) |
| Life, Physical & Social Science | 0 (0.0%) | 0 (0.0%) |
| Community & Social Service | 0 (0.0%) | 12 (100.0%) |
| Education, Arts & Media | 0 (0.0%) | 0 (0.0%) |
| Legal Services & Support | 0 (0.0%) | 0 (0.0%) |
| Education Instruction & Library | 0 (0.0%) | 12 (100.0%) |
| Arts, Media & Entertainment | 0 (0.0%) | 0 (0.0%) |
| Health Diagnosing & Treating | 0 (0.0%) | 0 (0.0%) |
| Health Technologists | 0 (0.0%) | 0 (0.0%) |
| Total (Category) | 0 (0.0%) | 12 (100.0%) |
| Total (Overall) | 91 (55.1%) | 74 (44.9%) |
Services Occupations
The most common Services occupations in Dewy Rose are Personal Care & Service (13 | 7.9%), and Food Preparation & Serving (9 | 5.4%).
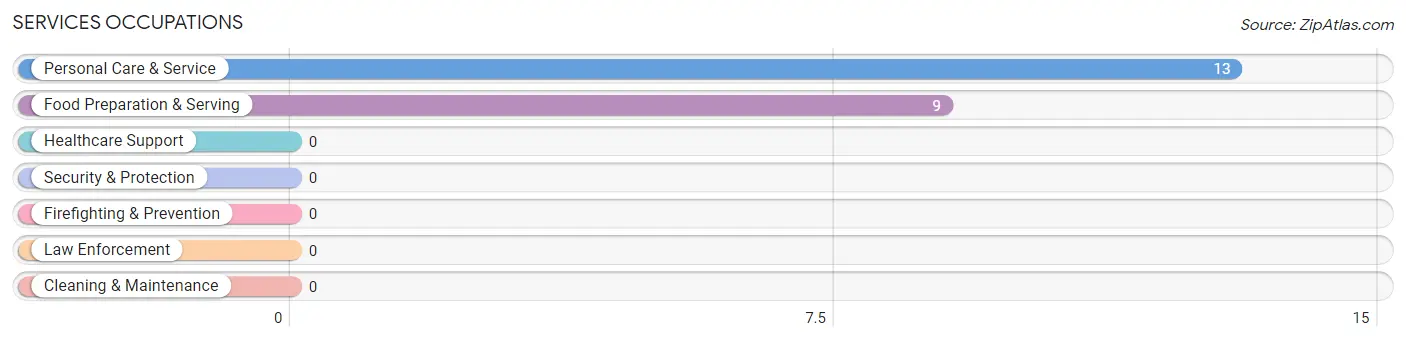
Services Occupations by Sex
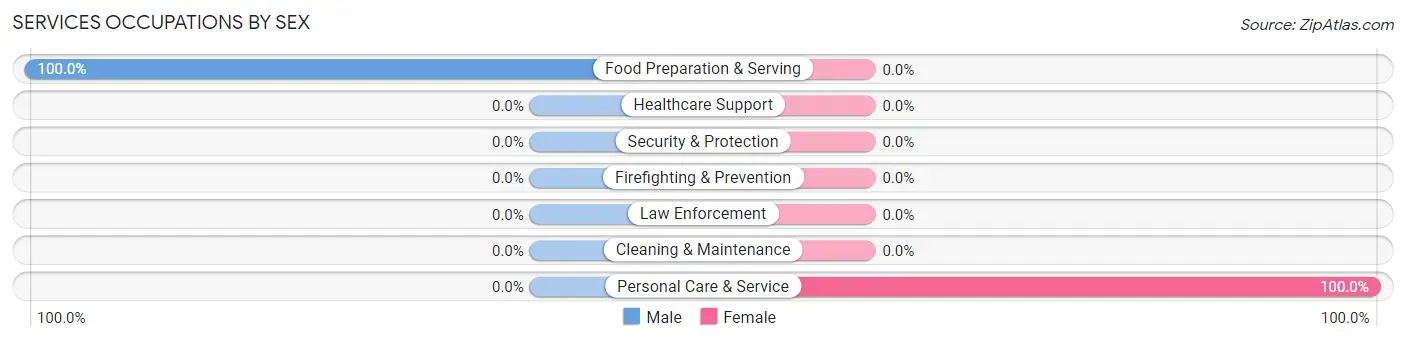
| Occupation | Male | Female |
| Healthcare Support | 0 (0.0%) | 0 (0.0%) |
| Security & Protection | 0 (0.0%) | 0 (0.0%) |
| Firefighting & Prevention | 0 (0.0%) | 0 (0.0%) |
| Law Enforcement | 0 (0.0%) | 0 (0.0%) |
| Food Preparation & Serving | 9 (100.0%) | 0 (0.0%) |
| Cleaning & Maintenance | 0 (0.0%) | 0 (0.0%) |
| Personal Care & Service | 0 (0.0%) | 13 (100.0%) |
| Total (Category) | 9 (40.9%) | 13 (59.1%) |
| Total (Overall) | 91 (55.1%) | 74 (44.9%) |
Sales and Office Occupations
The most common Sales and Office occupations in Dewy Rose are , and Sales & Related (17 | 10.3%).
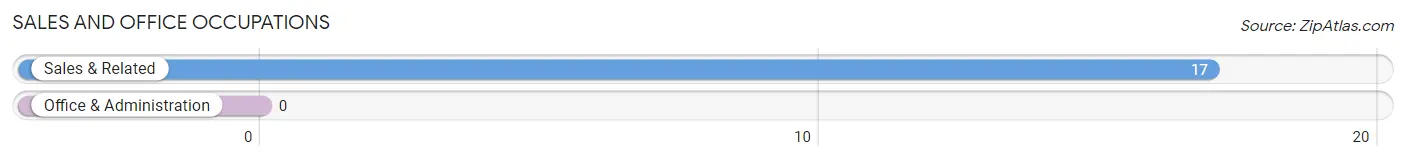
Sales and Office Occupations by Sex

| Occupation | Male | Female |
| Sales & Related | 0 (0.0%) | 17 (100.0%) |
| Office & Administration | 0 (0.0%) | 0 (0.0%) |
| Total (Category) | 0 (0.0%) | 17 (100.0%) |
| Total (Overall) | 91 (55.1%) | 74 (44.9%) |
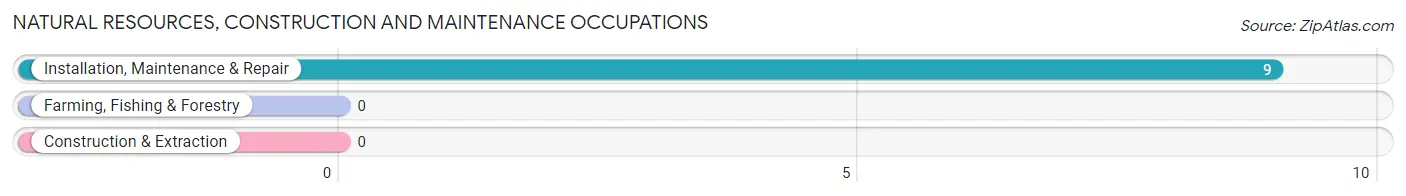
Natural Resources, Construction and Maintenance Occupations
The most common Natural Resources, Construction and Maintenance occupations in Dewy Rose are , and Installation, Maintenance & Repair (9 | 5.4%).
Natural Resources, Construction and Maintenance Occupations by Sex
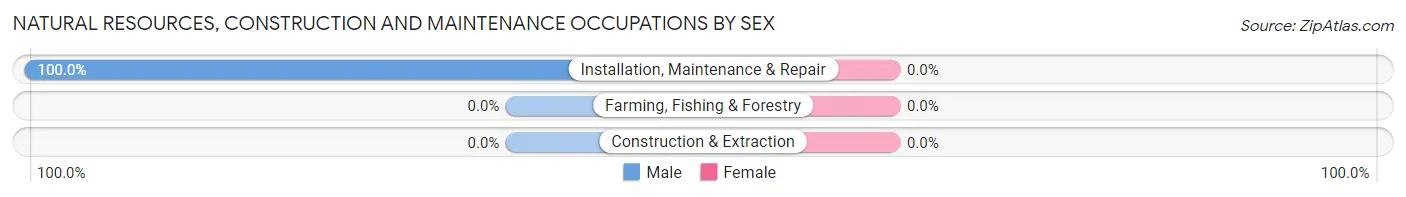
| Occupation | Male | Female |
| Farming, Fishing & Forestry | 0 (0.0%) | 0 (0.0%) |
| Construction & Extraction | 0 (0.0%) | 0 (0.0%) |
| Installation, Maintenance & Repair | 9 (100.0%) | 0 (0.0%) |
| Total (Category) | 9 (100.0%) | 0 (0.0%) |
| Total (Overall) | 91 (55.1%) | 74 (44.9%) |
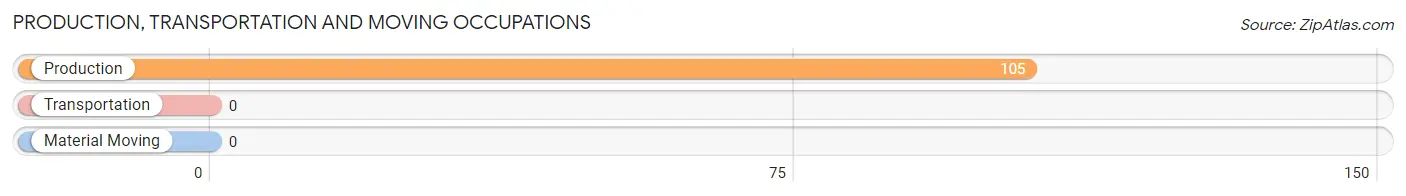
Production, Transportation and Moving Occupations
The most common Production, Transportation and Moving occupations in Dewy Rose are , and Production (105 | 63.6%).
Production, Transportation and Moving Occupations by Sex
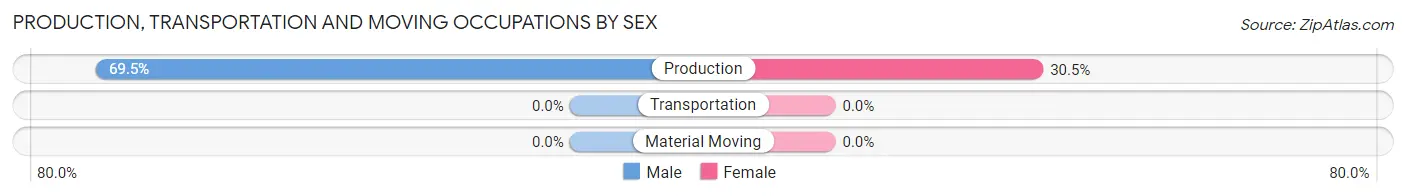
| Occupation | Male | Female |
| Production | 73 (69.5%) | 32 (30.5%) |
| Transportation | 0 (0.0%) | 0 (0.0%) |
| Material Moving | 0 (0.0%) | 0 (0.0%) |
| Total (Category) | 73 (69.5%) | 32 (30.5%) |
| Total (Overall) | 91 (55.1%) | 74 (44.9%) |
Employment Industries by Sex in Dewy Rose
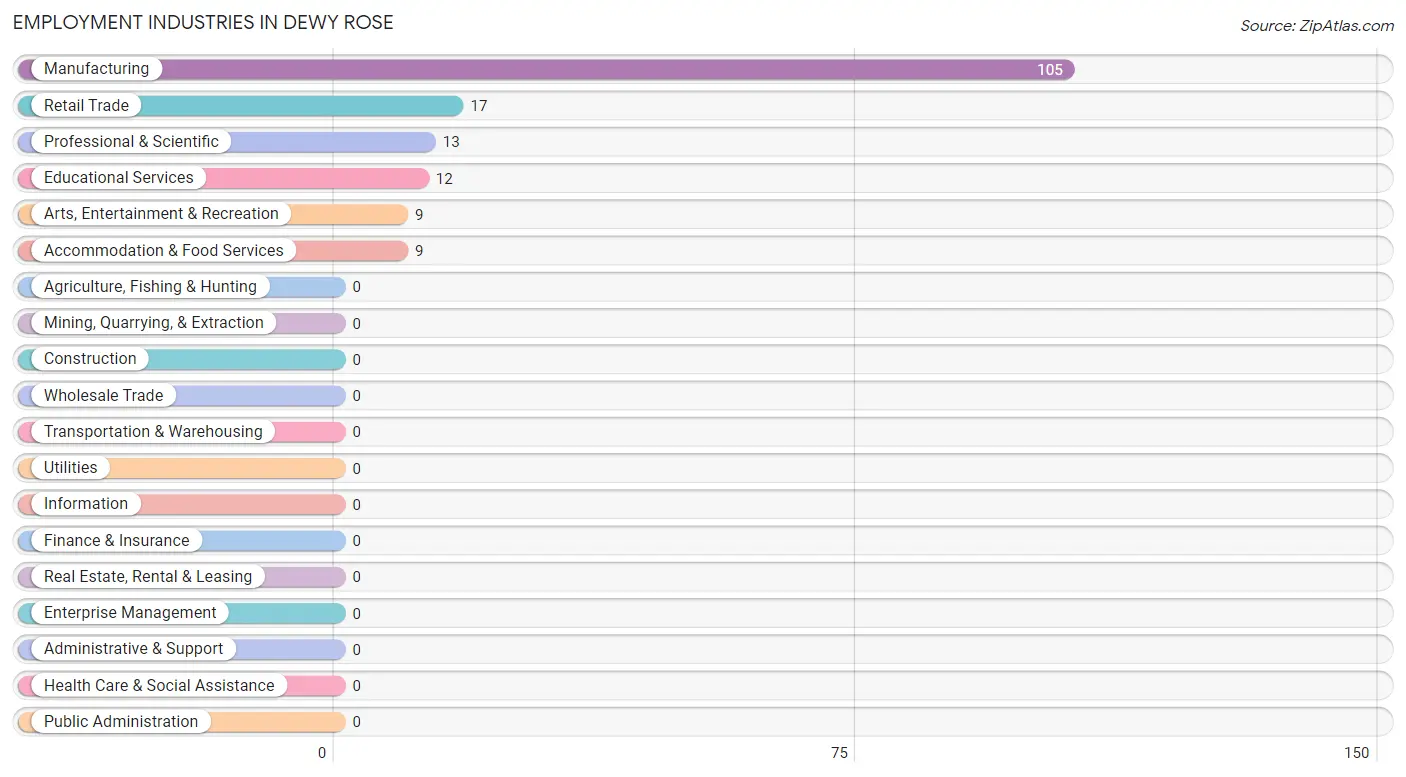
Employment Industries in Dewy Rose
The major employment industries in Dewy Rose include Manufacturing (105 | 63.6%), Retail Trade (17 | 10.3%), Professional & Scientific (13 | 7.9%), Educational Services (12 | 7.3%), and Arts, Entertainment & Recreation (9 | 5.4%).
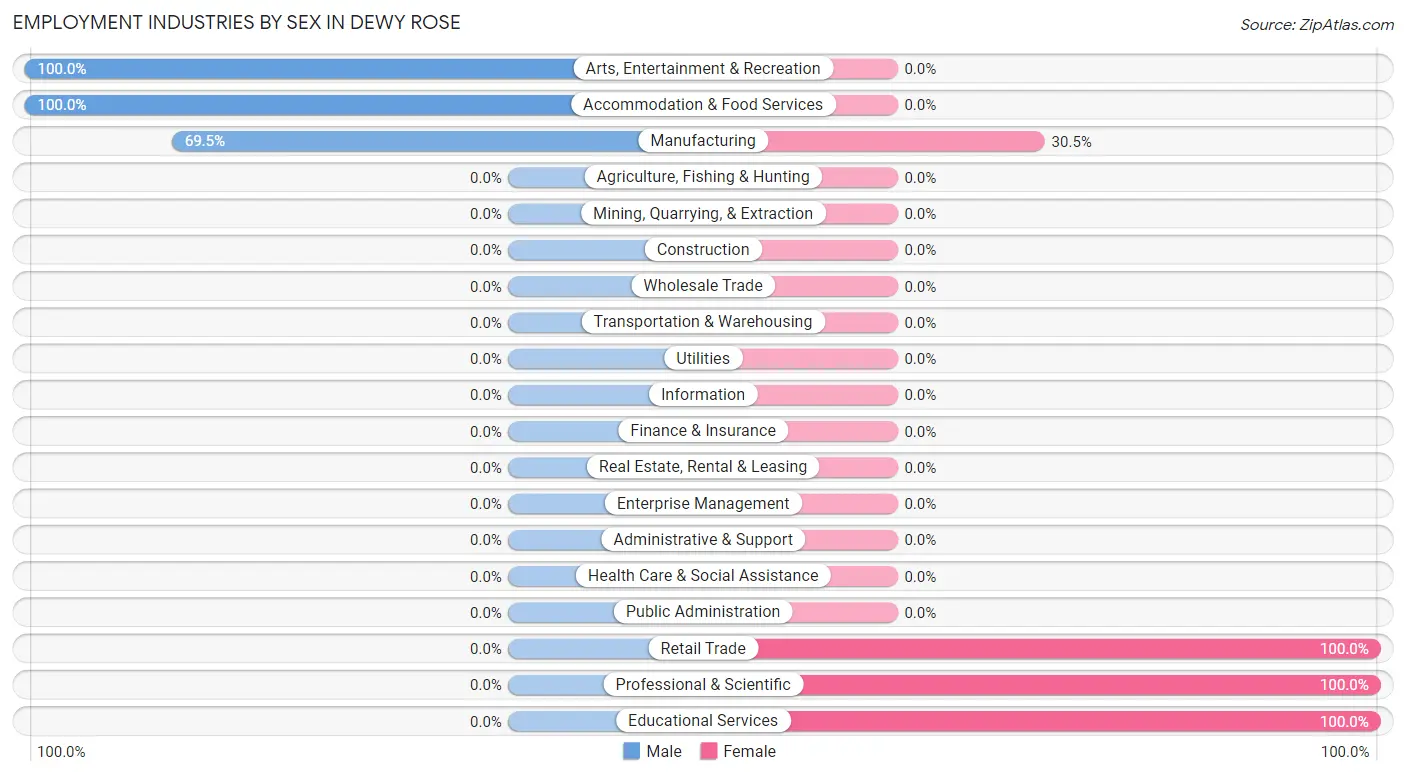
Employment Industries by Sex in Dewy Rose
The Dewy Rose industries that see more men than women are Arts, Entertainment & Recreation (100.0%), Accommodation & Food Services (100.0%), and Manufacturing (69.5%), whereas the industries that tend to have a higher number of women are Retail Trade (100.0%), Professional & Scientific (100.0%), and Educational Services (100.0%).
| Industry | Male | Female |
| Agriculture, Fishing & Hunting | 0 (0.0%) | 0 (0.0%) |
| Mining, Quarrying, & Extraction | 0 (0.0%) | 0 (0.0%) |
| Construction | 0 (0.0%) | 0 (0.0%) |
| Manufacturing | 73 (69.5%) | 32 (30.5%) |
| Wholesale Trade | 0 (0.0%) | 0 (0.0%) |
| Retail Trade | 0 (0.0%) | 17 (100.0%) |
| Transportation & Warehousing | 0 (0.0%) | 0 (0.0%) |
| Utilities | 0 (0.0%) | 0 (0.0%) |
| Information | 0 (0.0%) | 0 (0.0%) |
| Finance & Insurance | 0 (0.0%) | 0 (0.0%) |
| Real Estate, Rental & Leasing | 0 (0.0%) | 0 (0.0%) |
| Professional & Scientific | 0 (0.0%) | 13 (100.0%) |
| Enterprise Management | 0 (0.0%) | 0 (0.0%) |
| Administrative & Support | 0 (0.0%) | 0 (0.0%) |
| Educational Services | 0 (0.0%) | 12 (100.0%) |
| Health Care & Social Assistance | 0 (0.0%) | 0 (0.0%) |
| Arts, Entertainment & Recreation | 9 (100.0%) | 0 (0.0%) |
| Accommodation & Food Services | 9 (100.0%) | 0 (0.0%) |
| Public Administration | 0 (0.0%) | 0 (0.0%) |
| Total | 91 (55.1%) | 74 (44.9%) |
Education in Dewy Rose
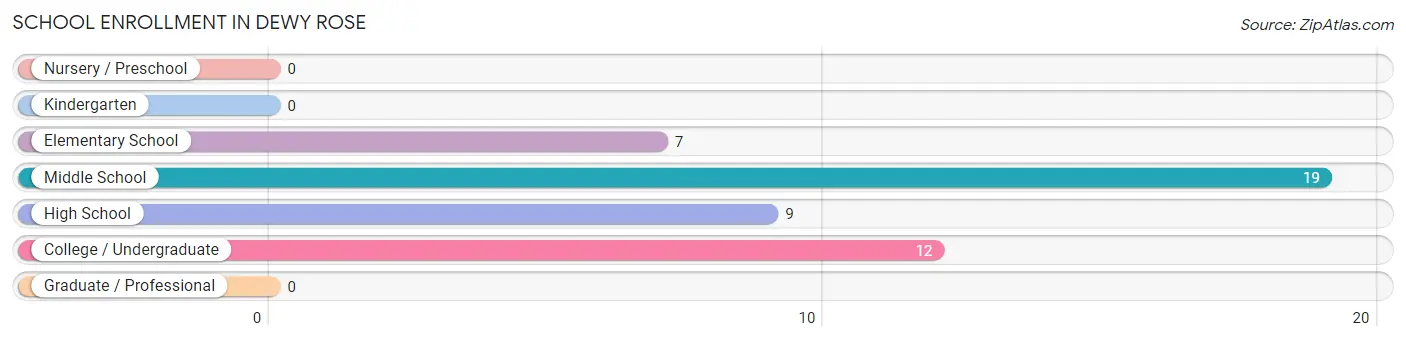
School Enrollment in Dewy Rose
The most common levels of schooling among the 47 students in Dewy Rose are middle school (19 | 40.4%), college / undergraduate (12 | 25.5%), and high school (9 | 19.2%).
| School Level | # Students | % Students |
| Nursery / Preschool | 0 | 0.0% |
| Kindergarten | 0 | 0.0% |
| Elementary School | 7 | 14.9% |
| Middle School | 19 | 40.4% |
| High School | 9 | 19.2% |
| College / Undergraduate | 12 | 25.5% |
| Graduate / Professional | 0 | 0.0% |
| Total | 47 | 100.0% |
School Enrollment by Age by Funding Source in Dewy Rose
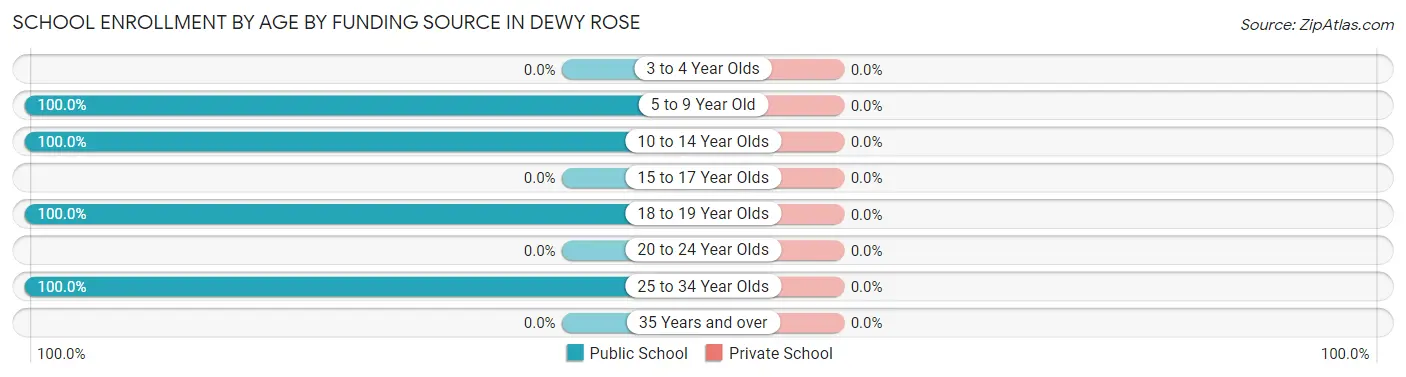
| Age Bracket | Public School | Private School |
| 3 to 4 Year Olds | 0 (0.0%) | 0 (0.0%) |
| 5 to 9 Year Old | 7 (100.0%) | 0 (0.0%) |
| 10 to 14 Year Olds | 19 (100.0%) | 0 (0.0%) |
| 15 to 17 Year Olds | 0 (0.0%) | 0 (0.0%) |
| 18 to 19 Year Olds | 9 (100.0%) | 0 (0.0%) |
| 20 to 24 Year Olds | 0 (0.0%) | 0 (0.0%) |
| 25 to 34 Year Olds | 12 (100.0%) | 0 (0.0%) |
| 35 Years and over | 0 (0.0%) | 0 (0.0%) |
| Total | 47 (100.0%) | 0 (0.0%) |
Educational Attainment by Field of Study in Dewy Rose
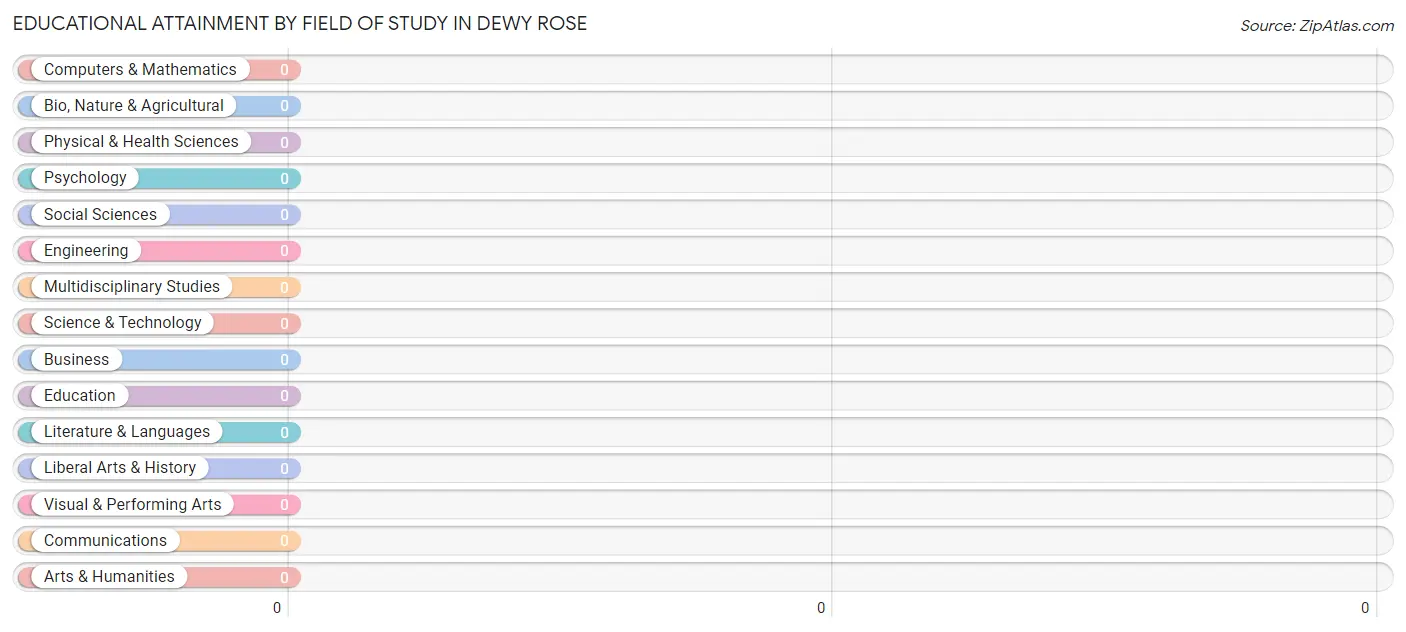
| Field of Study | # Graduates | % Graduates |
| Computers & Mathematics | 0 | 0.0% |
| Bio, Nature & Agricultural | 0 | 0.0% |
| Physical & Health Sciences | 0 | 0.0% |
| Psychology | 0 | 0.0% |
| Social Sciences | 0 | 0.0% |
| Engineering | 0 | 0.0% |
| Multidisciplinary Studies | 0 | 0.0% |
| Science & Technology | 0 | 0.0% |
| Business | 0 | 0.0% |
| Education | 0 | 0.0% |
| Literature & Languages | 0 | 0.0% |
| Liberal Arts & History | 0 | 0.0% |
| Visual & Performing Arts | 0 | 0.0% |
| Communications | 0 | 0.0% |
| Arts & Humanities | 0 | 0.0% |
| Total | 0 | 0.0% |
Transportation & Commute in Dewy Rose
Vehicle Availability by Sex in Dewy Rose
The most prevalent vehicle ownership categories in Dewy Rose are males with 1 vehicle (64, accounting for 70.3%) and females with 1 vehicle (32, making up 86.5%).

| Vehicles Available | Male | Female |
| No Vehicle | 0 (0.0%) | 0 (0.0%) |
| 1 Vehicle | 64 (70.3%) | 32 (43.2%) |
| 2 Vehicles | 18 (19.8%) | 25 (33.8%) |
| 3 Vehicles | 9 (9.9%) | 17 (23.0%) |
| 4 Vehicles | 0 (0.0%) | 0 (0.0%) |
| 5 or more Vehicles | 0 (0.0%) | 0 (0.0%) |
| Total | 91 (100.0%) | 74 (100.0%) |
Commute Time in Dewy Rose
The most frequently occuring commute durations in Dewy Rose are 5 to 9 minutes (96 commuters, 58.2%), 30 to 34 minutes (21 commuters, 12.7%), and 15 to 19 minutes (17 commuters, 10.3%).
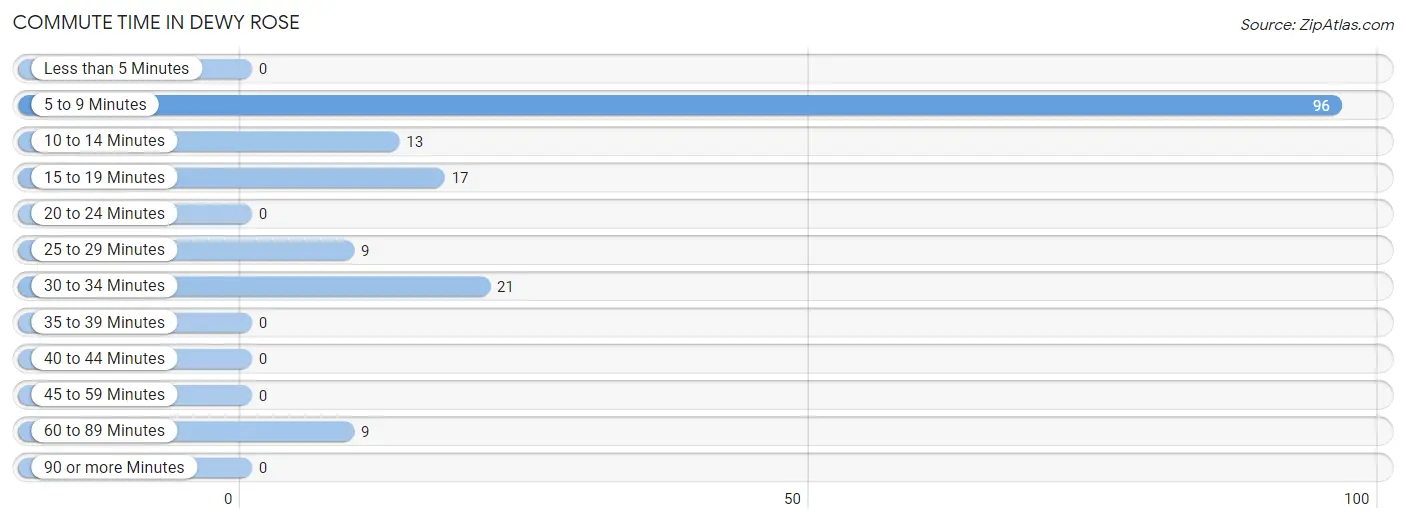
| Commute Time | # Commuters | % Commuters |
| Less than 5 Minutes | 0 | 0.0% |
| 5 to 9 Minutes | 96 | 58.2% |
| 10 to 14 Minutes | 13 | 7.9% |
| 15 to 19 Minutes | 17 | 10.3% |
| 20 to 24 Minutes | 0 | 0.0% |
| 25 to 29 Minutes | 9 | 5.4% |
| 30 to 34 Minutes | 21 | 12.7% |
| 35 to 39 Minutes | 0 | 0.0% |
| 40 to 44 Minutes | 0 | 0.0% |
| 45 to 59 Minutes | 0 | 0.0% |
| 60 to 89 Minutes | 9 | 5.4% |
| 90 or more Minutes | 0 | 0.0% |
Commute Time by Sex in Dewy Rose
The most common commute times in Dewy Rose are 5 to 9 minutes (64 commuters, 70.3%) for males and 5 to 9 minutes (32 commuters, 43.2%) for females.
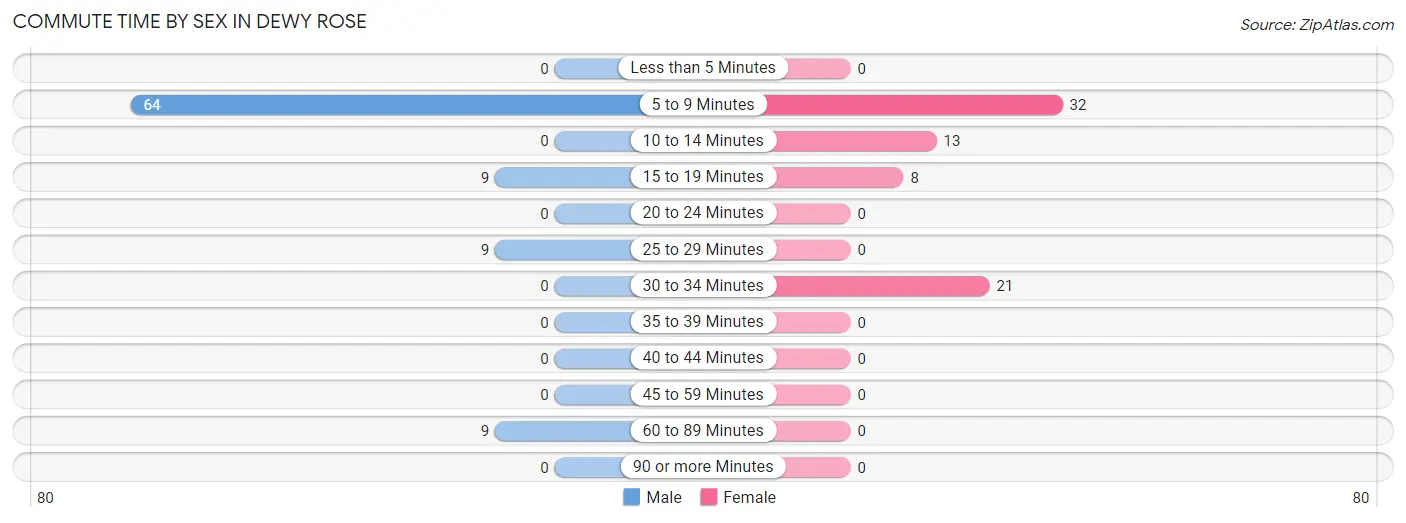
| Commute Time | Male | Female |
| Less than 5 Minutes | 0 (0.0%) | 0 (0.0%) |
| 5 to 9 Minutes | 64 (70.3%) | 32 (43.2%) |
| 10 to 14 Minutes | 0 (0.0%) | 13 (17.6%) |
| 15 to 19 Minutes | 9 (9.9%) | 8 (10.8%) |
| 20 to 24 Minutes | 0 (0.0%) | 0 (0.0%) |
| 25 to 29 Minutes | 9 (9.9%) | 0 (0.0%) |
| 30 to 34 Minutes | 0 (0.0%) | 21 (28.4%) |
| 35 to 39 Minutes | 0 (0.0%) | 0 (0.0%) |
| 40 to 44 Minutes | 0 (0.0%) | 0 (0.0%) |
| 45 to 59 Minutes | 0 (0.0%) | 0 (0.0%) |
| 60 to 89 Minutes | 9 (9.9%) | 0 (0.0%) |
| 90 or more Minutes | 0 (0.0%) | 0 (0.0%) |
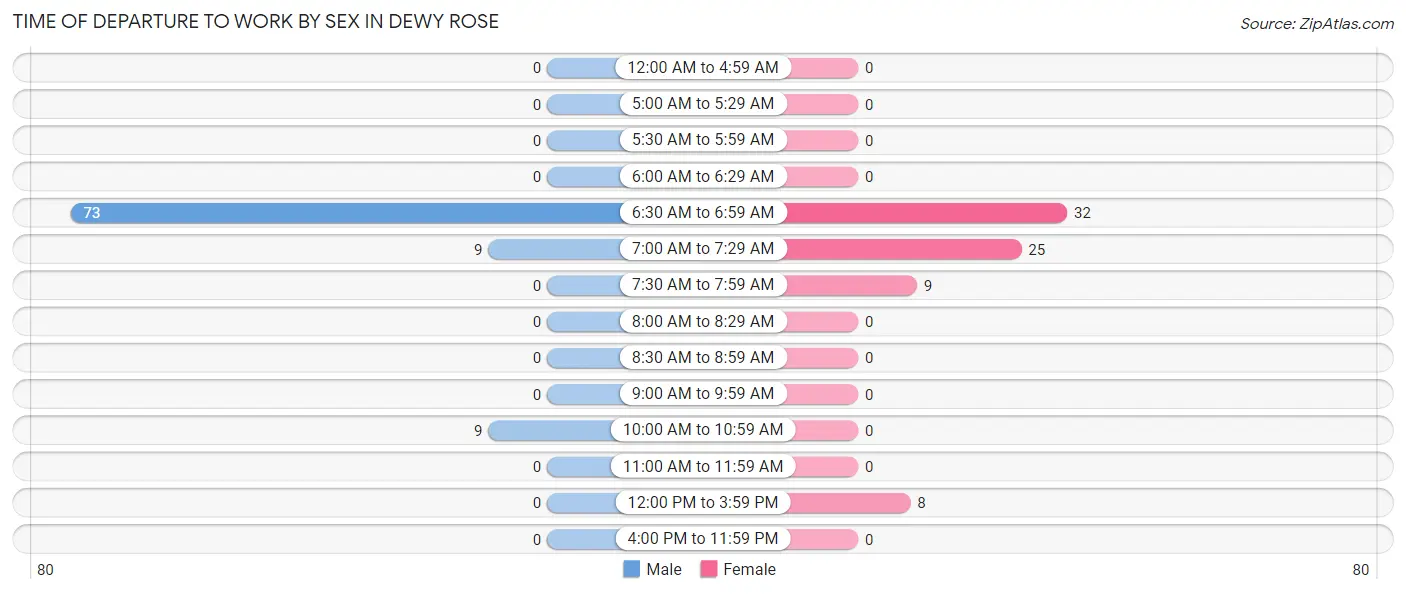
Time of Departure to Work by Sex in Dewy Rose
The most frequent times of departure to work in Dewy Rose are 6:30 AM to 6:59 AM (73, 80.2%) for males and 6:30 AM to 6:59 AM (32, 43.2%) for females.
| Time of Departure | Male | Female |
| 12:00 AM to 4:59 AM | 0 (0.0%) | 0 (0.0%) |
| 5:00 AM to 5:29 AM | 0 (0.0%) | 0 (0.0%) |
| 5:30 AM to 5:59 AM | 0 (0.0%) | 0 (0.0%) |
| 6:00 AM to 6:29 AM | 0 (0.0%) | 0 (0.0%) |
| 6:30 AM to 6:59 AM | 73 (80.2%) | 32 (43.2%) |
| 7:00 AM to 7:29 AM | 9 (9.9%) | 25 (33.8%) |
| 7:30 AM to 7:59 AM | 0 (0.0%) | 9 (12.2%) |
| 8:00 AM to 8:29 AM | 0 (0.0%) | 0 (0.0%) |
| 8:30 AM to 8:59 AM | 0 (0.0%) | 0 (0.0%) |
| 9:00 AM to 9:59 AM | 0 (0.0%) | 0 (0.0%) |
| 10:00 AM to 10:59 AM | 9 (9.9%) | 0 (0.0%) |
| 11:00 AM to 11:59 AM | 0 (0.0%) | 0 (0.0%) |
| 12:00 PM to 3:59 PM | 0 (0.0%) | 8 (10.8%) |
| 4:00 PM to 11:59 PM | 0 (0.0%) | 0 (0.0%) |
| Total | 91 (100.0%) | 74 (100.0%) |
Housing Occupancy in Dewy Rose
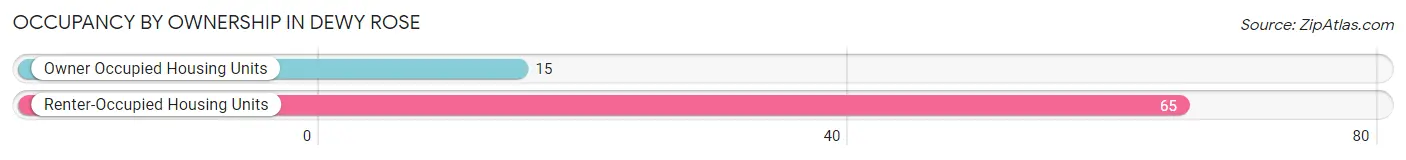
Occupancy by Ownership in Dewy Rose
Of the total 80 dwellings in Dewy Rose, owner-occupied units account for 15 (18.8%), while renter-occupied units make up 65 (81.2%).
| Occupancy | # Housing Units | % Housing Units |
| Owner Occupied Housing Units | 15 | 18.8% |
| Renter-Occupied Housing Units | 65 | 81.2% |
| Total Occupied Housing Units | 80 | 100.0% |
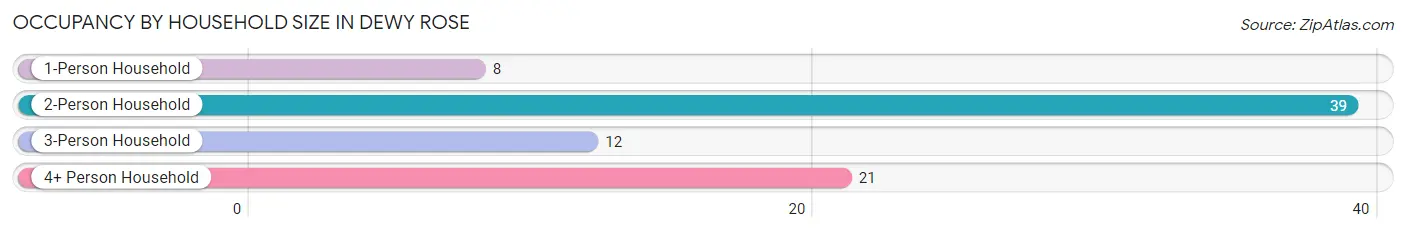
Occupancy by Household Size in Dewy Rose
| Household Size | # Housing Units | % Housing Units |
| 1-Person Household | 8 | 10.0% |
| 2-Person Household | 39 | 48.7% |
| 3-Person Household | 12 | 15.0% |
| 4+ Person Household | 21 | 26.3% |
| Total Housing Units | 80 | 100.0% |
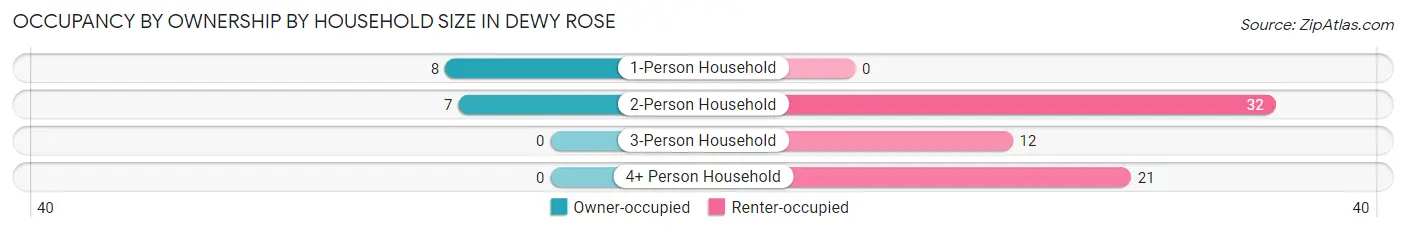
Occupancy by Ownership by Household Size in Dewy Rose
| Household Size | Owner-occupied | Renter-occupied |
| 1-Person Household | 8 (100.0%) | 0 (0.0%) |
| 2-Person Household | 7 (17.9%) | 32 (82.1%) |
| 3-Person Household | 0 (0.0%) | 12 (100.0%) |
| 4+ Person Household | 0 (0.0%) | 21 (100.0%) |
| Total Housing Units | 15 (18.8%) | 65 (81.2%) |
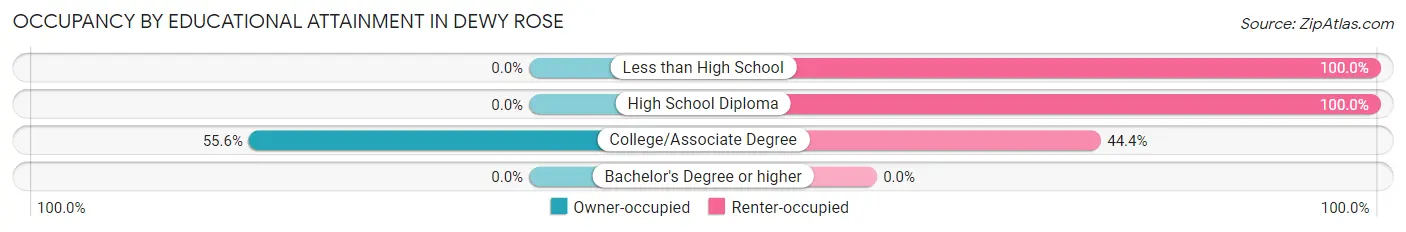
Occupancy by Educational Attainment in Dewy Rose
| Household Size | Owner-occupied | Renter-occupied |
| Less than High School | 0 (0.0%) | 45 (100.0%) |
| High School Diploma | 0 (0.0%) | 8 (100.0%) |
| College/Associate Degree | 15 (55.6%) | 12 (44.4%) |
| Bachelor's Degree or higher | 0 (0.0%) | 0 (0.0%) |
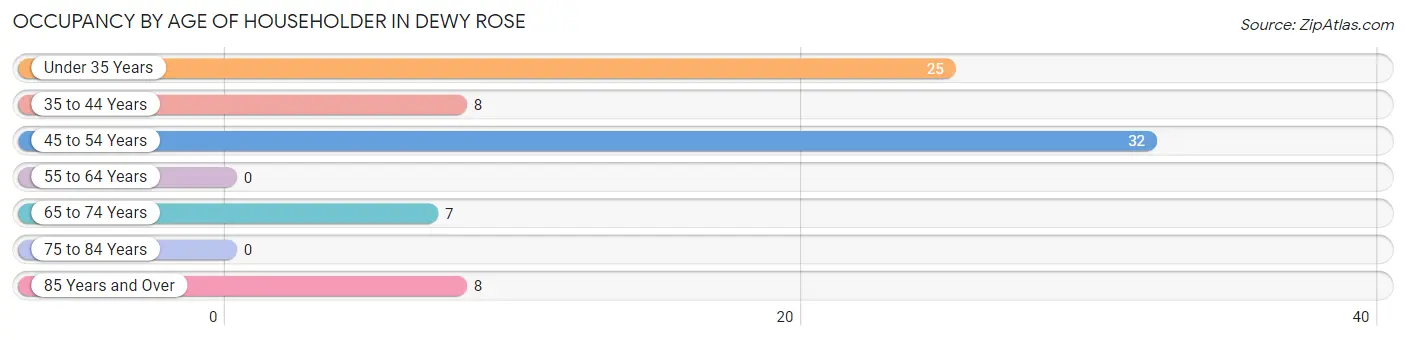
Occupancy by Age of Householder in Dewy Rose
| Age Bracket | # Households | % Households |
| Under 35 Years | 25 | 31.2% |
| 35 to 44 Years | 8 | 10.0% |
| 45 to 54 Years | 32 | 40.0% |
| 55 to 64 Years | 0 | 0.0% |
| 65 to 74 Years | 7 | 8.7% |
| 75 to 84 Years | 0 | 0.0% |
| 85 Years and Over | 8 | 10.0% |
| Total | 80 | 100.0% |
Housing Finances in Dewy Rose
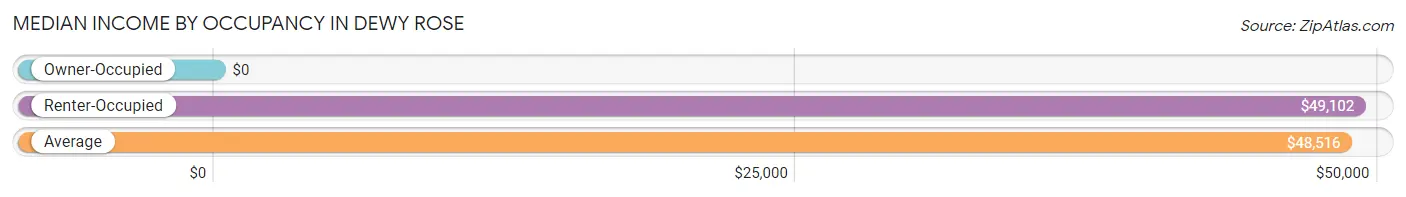
Median Income by Occupancy in Dewy Rose
| Occupancy Type | # Households | Median Income |
| Owner-Occupied | 15 (18.8%) | $0 |
| Renter-Occupied | 65 (81.2%) | $49,102 |
| Average | 80 (100.0%) | $48,516 |
Occupancy by Householder Income Bracket in Dewy Rose
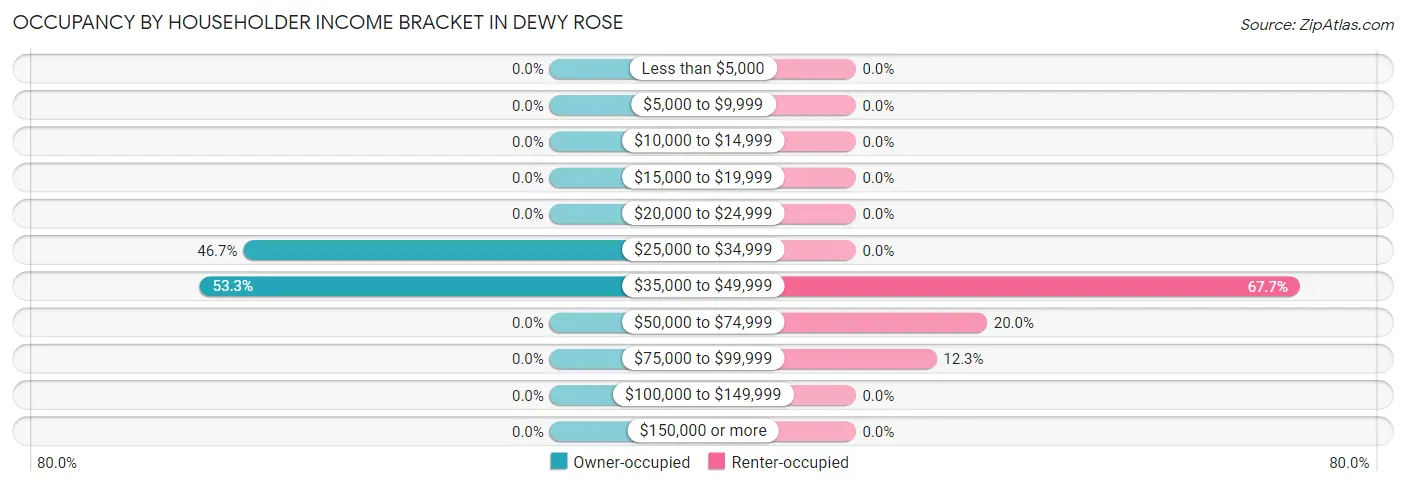
| Income Bracket | Owner-occupied | Renter-occupied |
| Less than $5,000 | 0 (0.0%) | 0 (0.0%) |
| $5,000 to $9,999 | 0 (0.0%) | 0 (0.0%) |
| $10,000 to $14,999 | 0 (0.0%) | 0 (0.0%) |
| $15,000 to $19,999 | 0 (0.0%) | 0 (0.0%) |
| $20,000 to $24,999 | 0 (0.0%) | 0 (0.0%) |
| $25,000 to $34,999 | 7 (46.7%) | 0 (0.0%) |
| $35,000 to $49,999 | 8 (53.3%) | 44 (67.7%) |
| $50,000 to $74,999 | 0 (0.0%) | 13 (20.0%) |
| $75,000 to $99,999 | 0 (0.0%) | 8 (12.3%) |
| $100,000 to $149,999 | 0 (0.0%) | 0 (0.0%) |
| $150,000 or more | 0 (0.0%) | 0 (0.0%) |
| Total | 15 (100.0%) | 65 (100.0%) |
Monthly Housing Cost Tiers in Dewy Rose
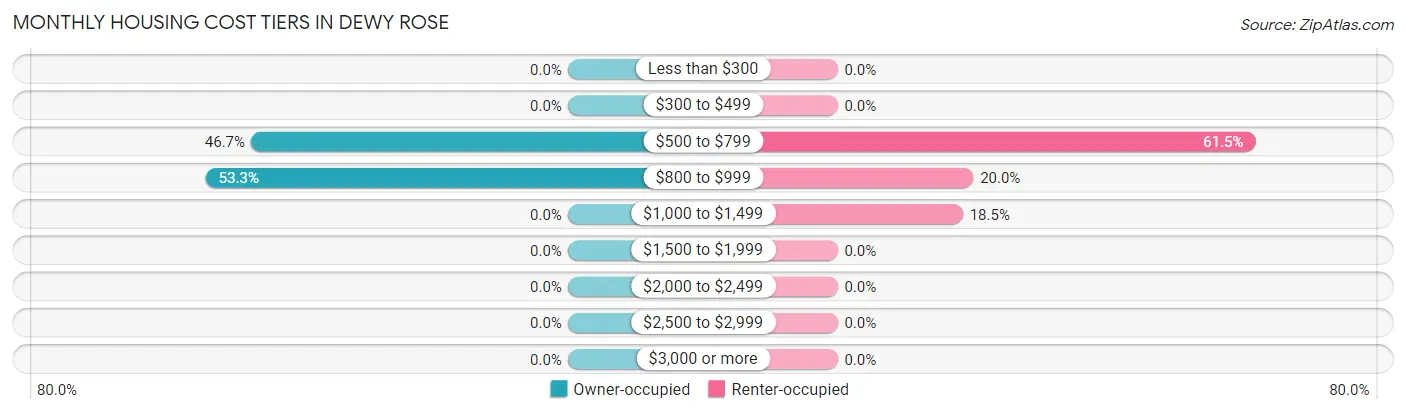
| Monthly Cost | Owner-occupied | Renter-occupied |
| Less than $300 | 0 (0.0%) | 0 (0.0%) |
| $300 to $499 | 0 (0.0%) | 0 (0.0%) |
| $500 to $799 | 7 (46.7%) | 40 (61.5%) |
| $800 to $999 | 8 (53.3%) | 13 (20.0%) |
| $1,000 to $1,499 | 0 (0.0%) | 12 (18.5%) |
| $1,500 to $1,999 | 0 (0.0%) | 0 (0.0%) |
| $2,000 to $2,499 | 0 (0.0%) | 0 (0.0%) |
| $2,500 to $2,999 | 0 (0.0%) | 0 (0.0%) |
| $3,000 or more | 0 (0.0%) | 0 (0.0%) |
| Total | 15 (100.0%) | 65 (100.0%) |
Physical Housing Characteristics in Dewy Rose
Housing Structures in Dewy Rose
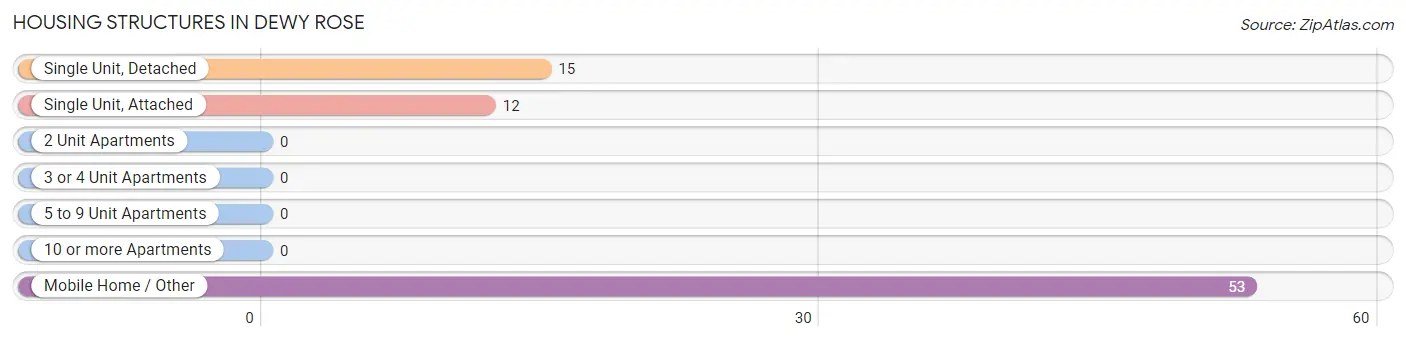
| Structure Type | # Housing Units | % Housing Units |
| Single Unit, Detached | 15 | 18.8% |
| Single Unit, Attached | 12 | 15.0% |
| 2 Unit Apartments | 0 | 0.0% |
| 3 or 4 Unit Apartments | 0 | 0.0% |
| 5 to 9 Unit Apartments | 0 | 0.0% |
| 10 or more Apartments | 0 | 0.0% |
| Mobile Home / Other | 53 | 66.2% |
| Total | 80 | 100.0% |
Housing Structures by Occupancy in Dewy Rose
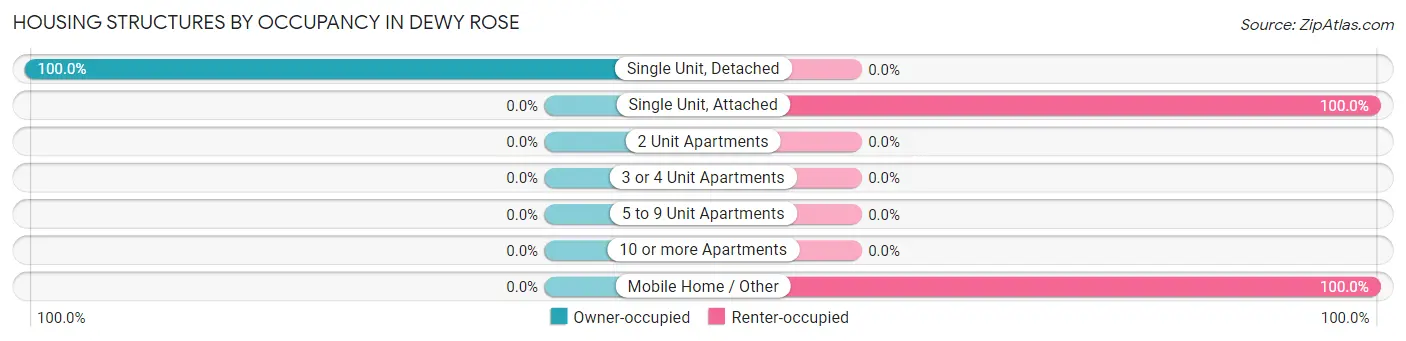
| Structure Type | Owner-occupied | Renter-occupied |
| Single Unit, Detached | 15 (100.0%) | 0 (0.0%) |
| Single Unit, Attached | 0 (0.0%) | 12 (100.0%) |
| 2 Unit Apartments | 0 (0.0%) | 0 (0.0%) |
| 3 or 4 Unit Apartments | 0 (0.0%) | 0 (0.0%) |
| 5 to 9 Unit Apartments | 0 (0.0%) | 0 (0.0%) |
| 10 or more Apartments | 0 (0.0%) | 0 (0.0%) |
| Mobile Home / Other | 0 (0.0%) | 53 (100.0%) |
| Total | 15 (18.8%) | 65 (81.2%) |
Housing Structures by Number of Rooms in Dewy Rose
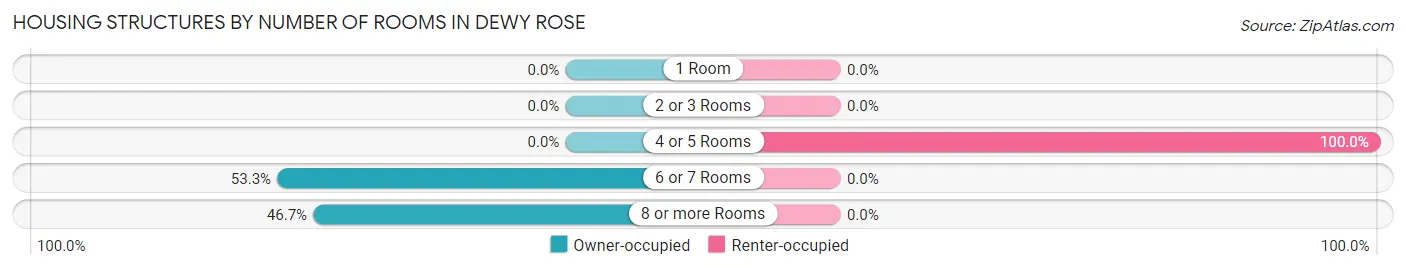
| Number of Rooms | Owner-occupied | Renter-occupied |
| 1 Room | 0 (0.0%) | 0 (0.0%) |
| 2 or 3 Rooms | 0 (0.0%) | 0 (0.0%) |
| 4 or 5 Rooms | 0 (0.0%) | 65 (100.0%) |
| 6 or 7 Rooms | 8 (53.3%) | 0 (0.0%) |
| 8 or more Rooms | 7 (46.7%) | 0 (0.0%) |
| Total | 15 (100.0%) | 65 (100.0%) |
Housing Structure by Heating Type in Dewy Rose
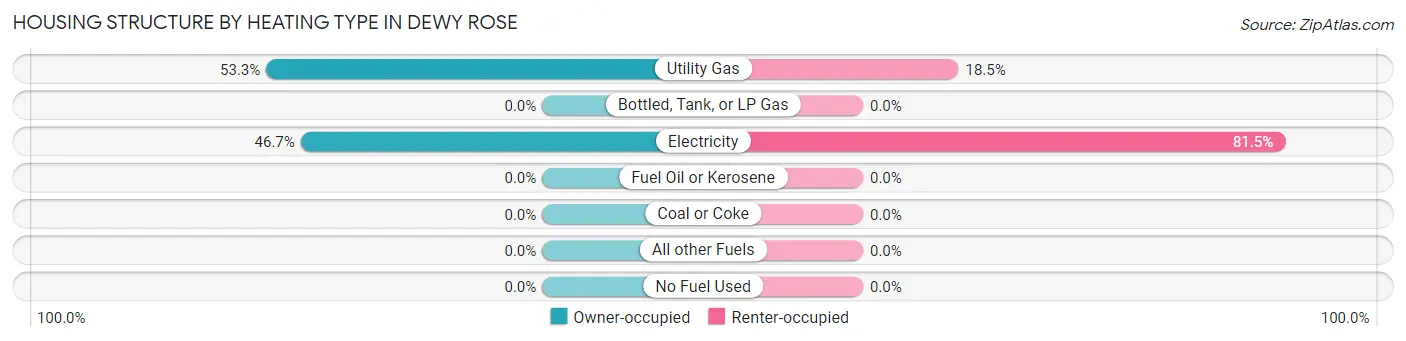
| Heating Type | Owner-occupied | Renter-occupied |
| Utility Gas | 8 (53.3%) | 12 (18.5%) |
| Bottled, Tank, or LP Gas | 0 (0.0%) | 0 (0.0%) |
| Electricity | 7 (46.7%) | 53 (81.5%) |
| Fuel Oil or Kerosene | 0 (0.0%) | 0 (0.0%) |
| Coal or Coke | 0 (0.0%) | 0 (0.0%) |
| All other Fuels | 0 (0.0%) | 0 (0.0%) |
| No Fuel Used | 0 (0.0%) | 0 (0.0%) |
| Total | 15 (100.0%) | 65 (100.0%) |
Household Vehicle Usage in Dewy Rose
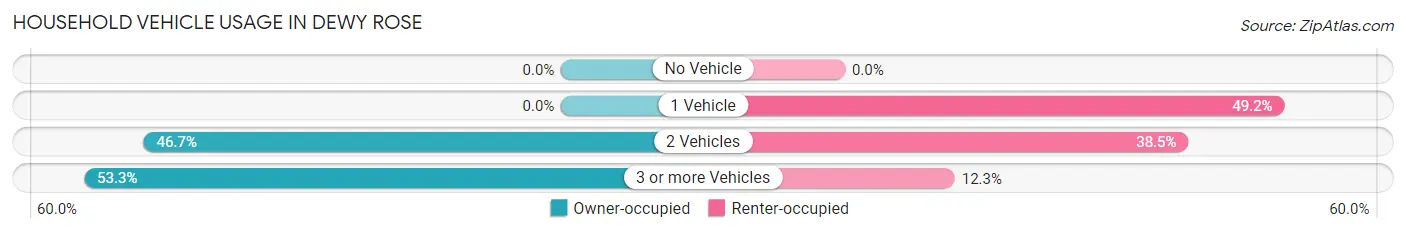
| Vehicles per Household | Owner-occupied | Renter-occupied |
| No Vehicle | 0 (0.0%) | 0 (0.0%) |
| 1 Vehicle | 0 (0.0%) | 32 (49.2%) |
| 2 Vehicles | 7 (46.7%) | 25 (38.5%) |
| 3 or more Vehicles | 8 (53.3%) | 8 (12.3%) |
| Total | 15 (100.0%) | 65 (100.0%) |
Real Estate & Mortgages in Dewy Rose
Real Estate and Mortgage Overview in Dewy Rose
| Characteristic | Without Mortgage | With Mortgage |
| Housing Units | 15 | 0 |
| Median Property Value | - | - |
| Median Household Income | - | - |
| Monthly Housing Costs | - | - |
| Real Estate Taxes | - | - |
Property Value by Mortgage Status in Dewy Rose
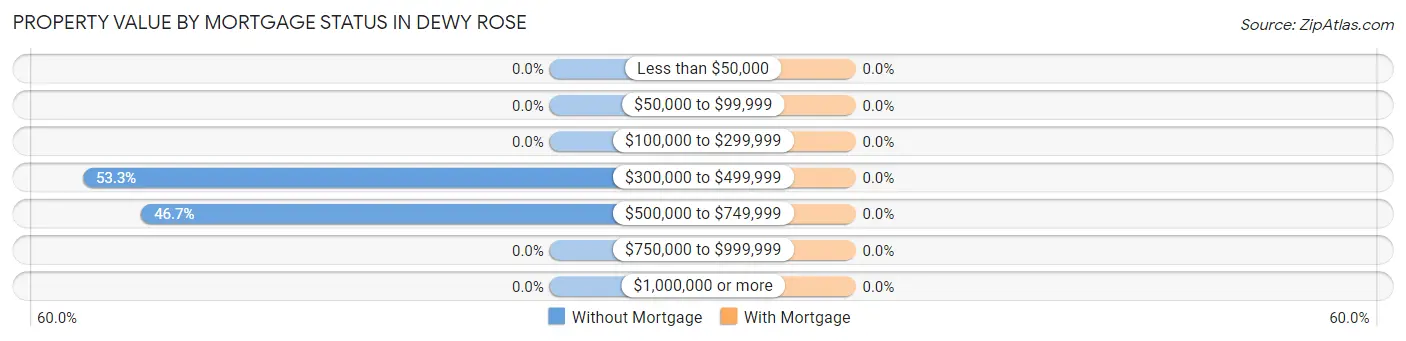
| Property Value | Without Mortgage | With Mortgage |
| Less than $50,000 | 0 (0.0%) | 0 (0.0%) |
| $50,000 to $99,999 | 0 (0.0%) | 0 (0.0%) |
| $100,000 to $299,999 | 0 (0.0%) | 0 (0.0%) |
| $300,000 to $499,999 | 8 (53.3%) | 0 (0.0%) |
| $500,000 to $749,999 | 7 (46.7%) | 0 (0.0%) |
| $750,000 to $999,999 | 0 (0.0%) | 0 (0.0%) |
| $1,000,000 or more | 0 (0.0%) | 0 (0.0%) |
| Total | 15 (100.0%) | 0 (0.0%) |
Household Income by Mortgage Status in Dewy Rose
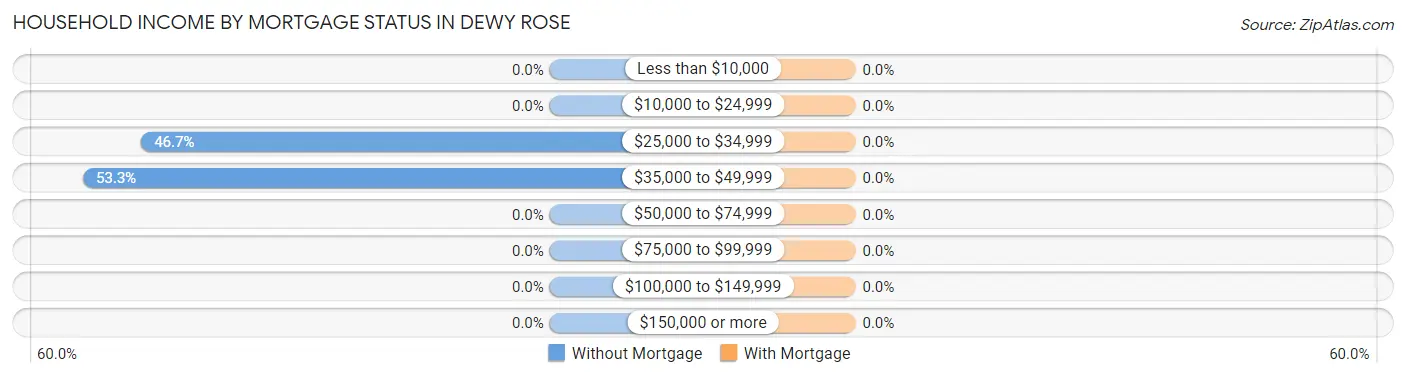
| Household Income | Without Mortgage | With Mortgage |
| Less than $10,000 | 0 (0.0%) | 0 (0.0%) |
| $10,000 to $24,999 | 0 (0.0%) | 0 (0.0%) |
| $25,000 to $34,999 | 7 (46.7%) | 0 (0.0%) |
| $35,000 to $49,999 | 8 (53.3%) | 0 (0.0%) |
| $50,000 to $74,999 | 0 (0.0%) | 0 (0.0%) |
| $75,000 to $99,999 | 0 (0.0%) | 0 (0.0%) |
| $100,000 to $149,999 | 0 (0.0%) | 0 (0.0%) |
| $150,000 or more | 0 (0.0%) | 0 (0.0%) |
| Total | 15 (100.0%) | 0 (0.0%) |
Property Value to Household Income Ratio in Dewy Rose
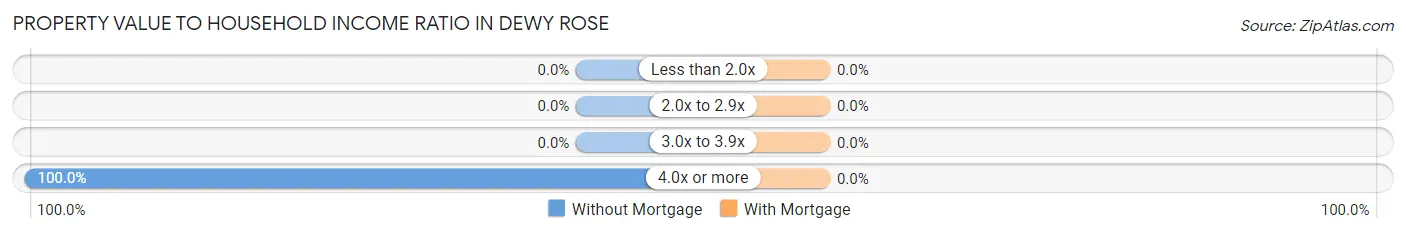
| Value-to-Income Ratio | Without Mortgage | With Mortgage |
| Less than 2.0x | 0 (0.0%) | 0 (0.0%) |
| 2.0x to 2.9x | 0 (0.0%) | 0 (0.0%) |
| 3.0x to 3.9x | 0 (0.0%) | 0 (0.0%) |
| 4.0x or more | 15 (100.0%) | 0 (0.0%) |
| Total | 15 (100.0%) | 0 (0.0%) |
Real Estate Taxes by Mortgage Status in Dewy Rose
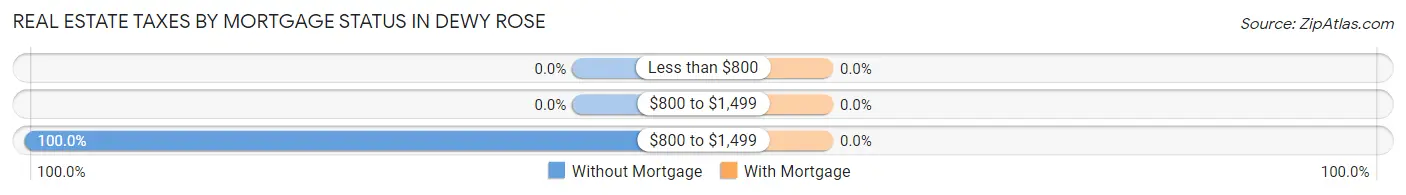
| Property Taxes | Without Mortgage | With Mortgage |
| Less than $800 | 0 (0.0%) | 0 (0.0%) |
| $800 to $1,499 | 0 (0.0%) | 0 (0.0%) |
| $800 to $1,499 | 15 (100.0%) | 0 (0.0%) |
| Total | 15 (100.0%) | 0 (0.0%) |
Health & Disability in Dewy Rose
Health Insurance Coverage by Age in Dewy Rose
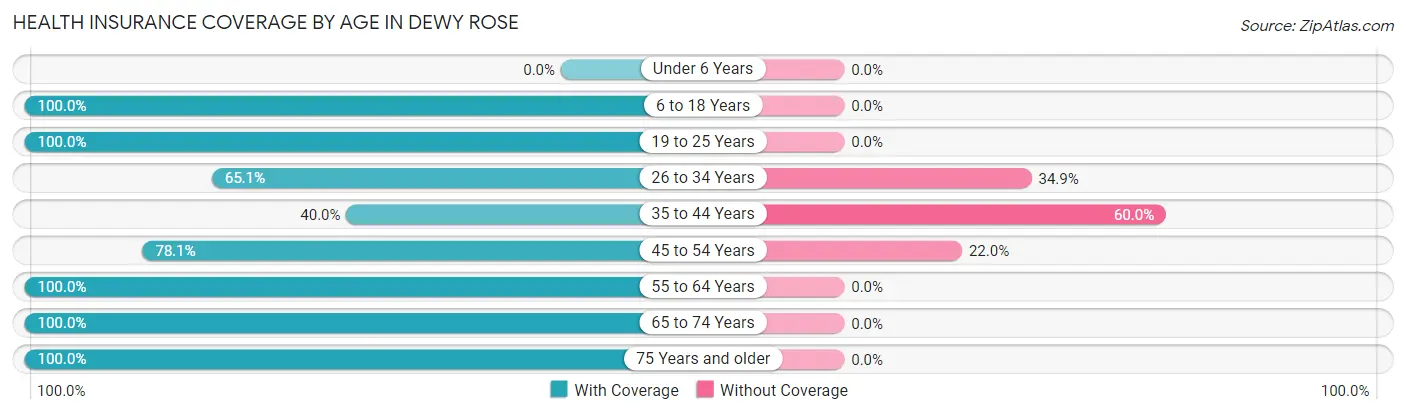
| Age Bracket | With Coverage | Without Coverage |
| Under 6 Years | 0 (0.0%) | 0 (0.0%) |
| 6 to 18 Years | 26 (100.0%) | 0 (0.0%) |
| 19 to 25 Years | 18 (100.0%) | 0 (0.0%) |
| 26 to 34 Years | 41 (65.1%) | 22 (34.9%) |
| 35 to 44 Years | 8 (40.0%) | 12 (60.0%) |
| 45 to 54 Years | 32 (78.0%) | 9 (22.0%) |
| 55 to 64 Years | 64 (100.0%) | 0 (0.0%) |
| 65 to 74 Years | 29 (100.0%) | 0 (0.0%) |
| 75 Years and older | 8 (100.0%) | 0 (0.0%) |
| Total | 226 (84.0%) | 43 (16.0%) |
Health Insurance Coverage by Citizenship Status in Dewy Rose
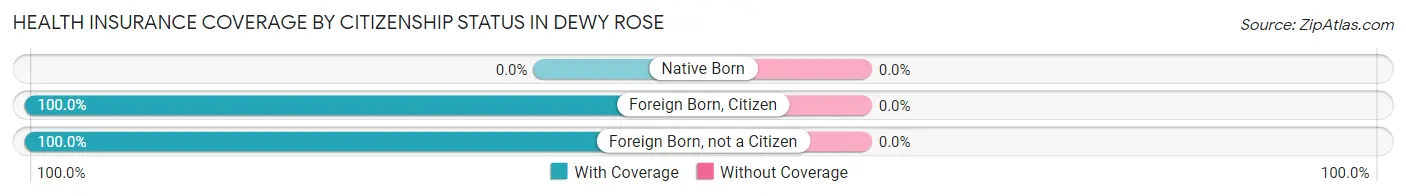
| Citizenship Status | With Coverage | Without Coverage |
| Native Born | 0 (0.0%) | 0 (0.0%) |
| Foreign Born, Citizen | 26 (100.0%) | 0 (0.0%) |
| Foreign Born, not a Citizen | 18 (100.0%) | 0 (0.0%) |
Health Insurance Coverage by Household Income in Dewy Rose
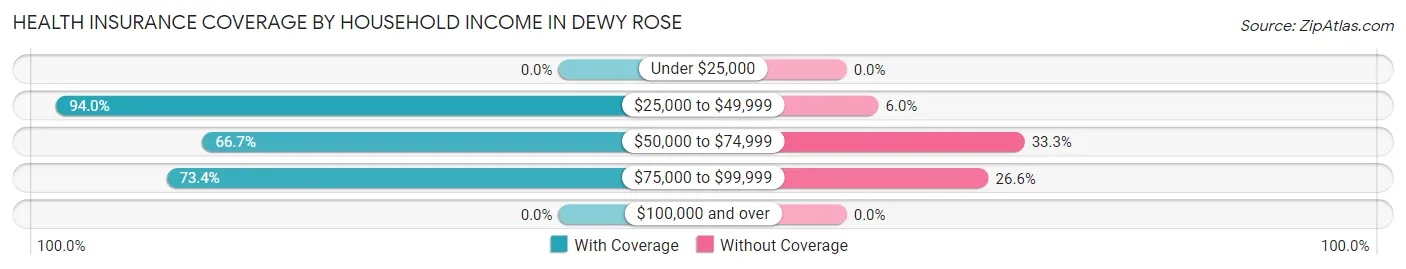
| Household Income | With Coverage | Without Coverage |
| Under $25,000 | 0 (0.0%) | 0 (0.0%) |
| $25,000 to $49,999 | 142 (94.0%) | 9 (6.0%) |
| $50,000 to $74,999 | 26 (66.7%) | 13 (33.3%) |
| $75,000 to $99,999 | 58 (73.4%) | 21 (26.6%) |
| $100,000 and over | 0 (0.0%) | 0 (0.0%) |
Public vs Private Health Insurance Coverage by Age in Dewy Rose
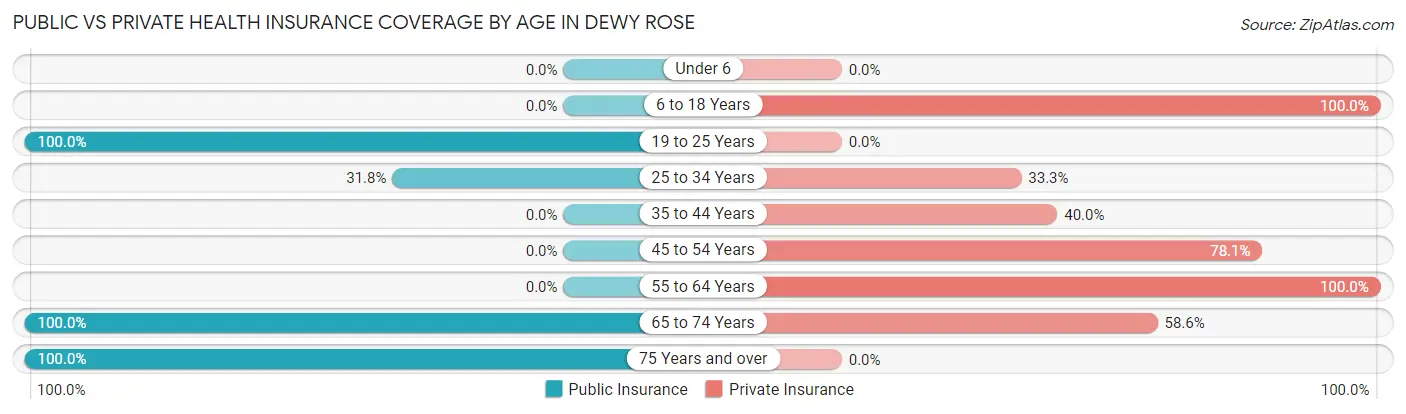
| Age Bracket | Public Insurance | Private Insurance |
| Under 6 | 0 (0.0%) | 0 (0.0%) |
| 6 to 18 Years | 0 (0.0%) | 26 (100.0%) |
| 19 to 25 Years | 18 (100.0%) | 0 (0.0%) |
| 25 to 34 Years | 20 (31.8%) | 21 (33.3%) |
| 35 to 44 Years | 0 (0.0%) | 8 (40.0%) |
| 45 to 54 Years | 0 (0.0%) | 32 (78.0%) |
| 55 to 64 Years | 0 (0.0%) | 64 (100.0%) |
| 65 to 74 Years | 29 (100.0%) | 17 (58.6%) |
| 75 Years and over | 8 (100.0%) | 0 (0.0%) |
| Total | 75 (27.9%) | 168 (62.5%) |
Disability Status by Sex by Age in Dewy Rose
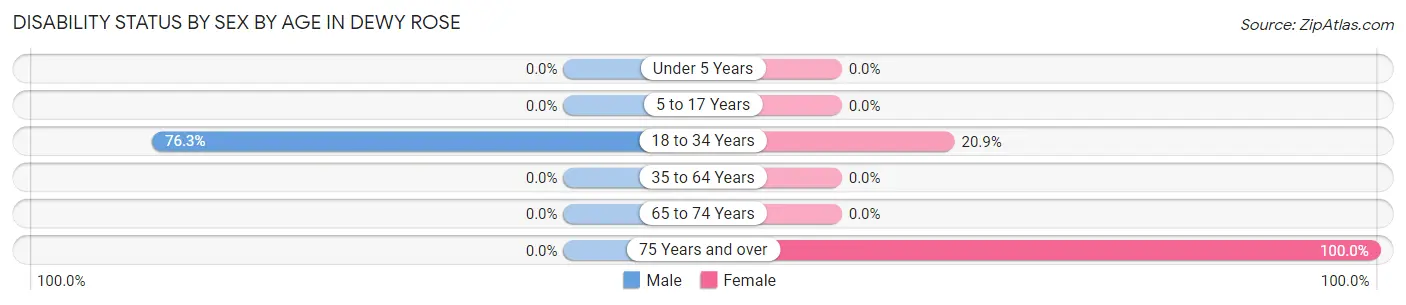
| Age Bracket | Male | Female |
| Under 5 Years | 0 (0.0%) | 0 (0.0%) |
| 5 to 17 Years | 0 (0.0%) | 0 (0.0%) |
| 18 to 34 Years | 29 (76.3%) | 9 (20.9%) |
| 35 to 64 Years | 0 (0.0%) | 0 (0.0%) |
| 65 to 74 Years | 0 (0.0%) | 0 (0.0%) |
| 75 Years and over | 0 (0.0%) | 8 (100.0%) |
Disability Class by Sex by Age in Dewy Rose
Disability Class: Hearing Difficulty
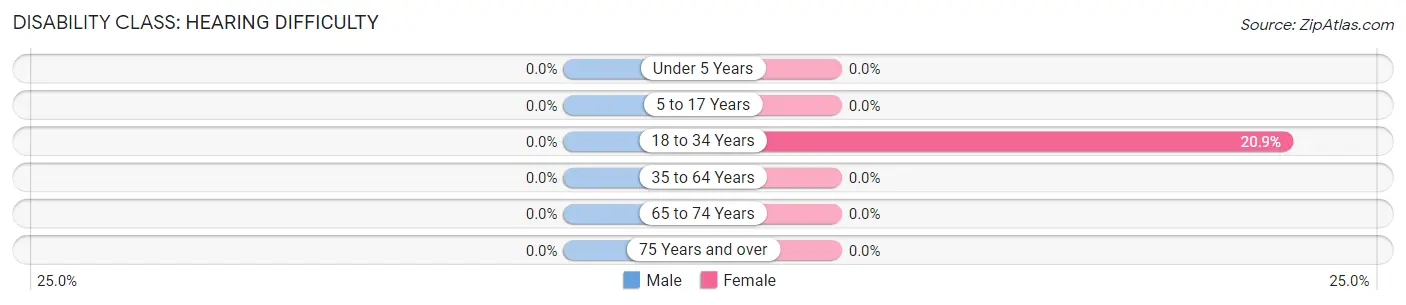
| Age Bracket | Male | Female |
| Under 5 Years | 0 (0.0%) | 0 (0.0%) |
| 5 to 17 Years | 0 (0.0%) | 0 (0.0%) |
| 18 to 34 Years | 0 (0.0%) | 9 (20.9%) |
| 35 to 64 Years | 0 (0.0%) | 0 (0.0%) |
| 65 to 74 Years | 0 (0.0%) | 0 (0.0%) |
| 75 Years and over | 0 (0.0%) | 0 (0.0%) |
Disability Class: Vision Difficulty
| Age Bracket | Male | Female |
| Under 5 Years | 0 (0.0%) | 0 (0.0%) |
| 5 to 17 Years | 0 (0.0%) | 0 (0.0%) |
| 18 to 34 Years | 0 (0.0%) | 0 (0.0%) |
| 35 to 64 Years | 0 (0.0%) | 0 (0.0%) |
| 65 to 74 Years | 0 (0.0%) | 0 (0.0%) |
| 75 Years and over | 0 (0.0%) | 0 (0.0%) |
Disability Class: Cognitive Difficulty
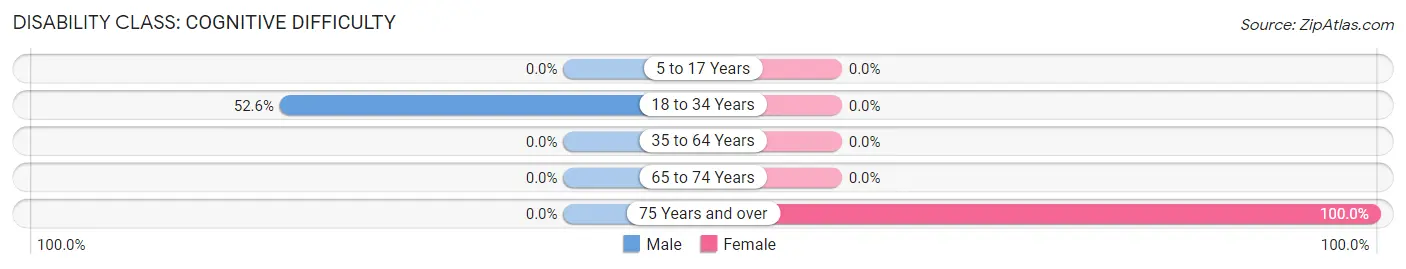
| Age Bracket | Male | Female |
| 5 to 17 Years | 0 (0.0%) | 0 (0.0%) |
| 18 to 34 Years | 20 (52.6%) | 0 (0.0%) |
| 35 to 64 Years | 0 (0.0%) | 0 (0.0%) |
| 65 to 74 Years | 0 (0.0%) | 0 (0.0%) |
| 75 Years and over | 0 (0.0%) | 8 (100.0%) |
Disability Class: Ambulatory Difficulty
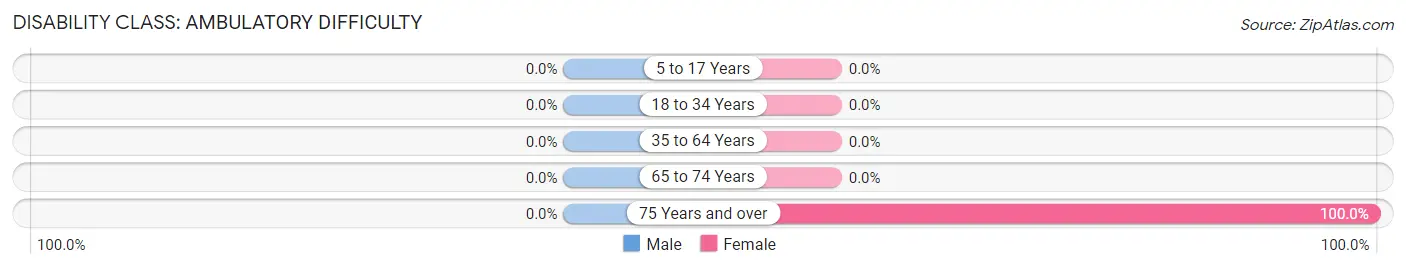
| Age Bracket | Male | Female |
| 5 to 17 Years | 0 (0.0%) | 0 (0.0%) |
| 18 to 34 Years | 0 (0.0%) | 0 (0.0%) |
| 35 to 64 Years | 0 (0.0%) | 0 (0.0%) |
| 65 to 74 Years | 0 (0.0%) | 0 (0.0%) |
| 75 Years and over | 0 (0.0%) | 8 (100.0%) |
Disability Class: Self-Care Difficulty
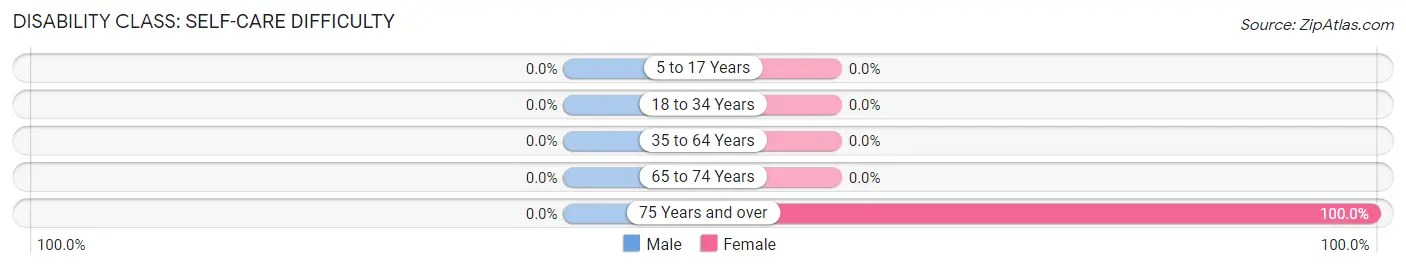
| Age Bracket | Male | Female |
| 5 to 17 Years | 0 (0.0%) | 0 (0.0%) |
| 18 to 34 Years | 0 (0.0%) | 0 (0.0%) |
| 35 to 64 Years | 0 (0.0%) | 0 (0.0%) |
| 65 to 74 Years | 0 (0.0%) | 0 (0.0%) |
| 75 Years and over | 0 (0.0%) | 8 (100.0%) |
Technology Access in Dewy Rose
Computing Device Access in Dewy Rose
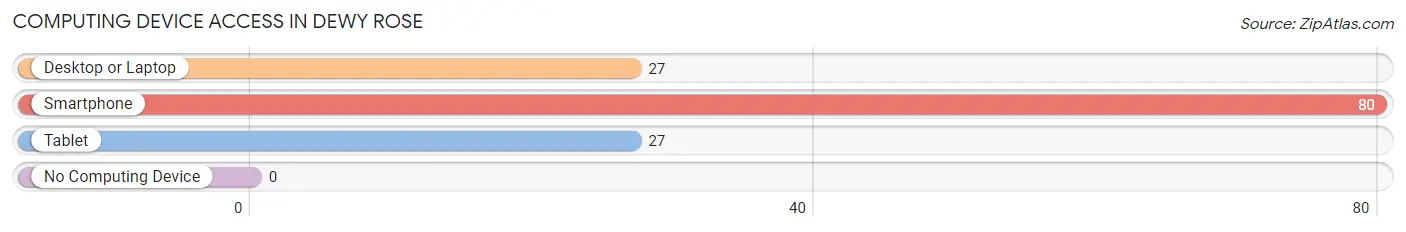
| Device Type | # Households | % Households |
| Desktop or Laptop | 27 | 33.8% |
| Smartphone | 80 | 100.0% |
| Tablet | 27 | 33.8% |
| No Computing Device | 0 | 0.0% |
| Total | 80 | 100.0% |
Internet Access in Dewy Rose
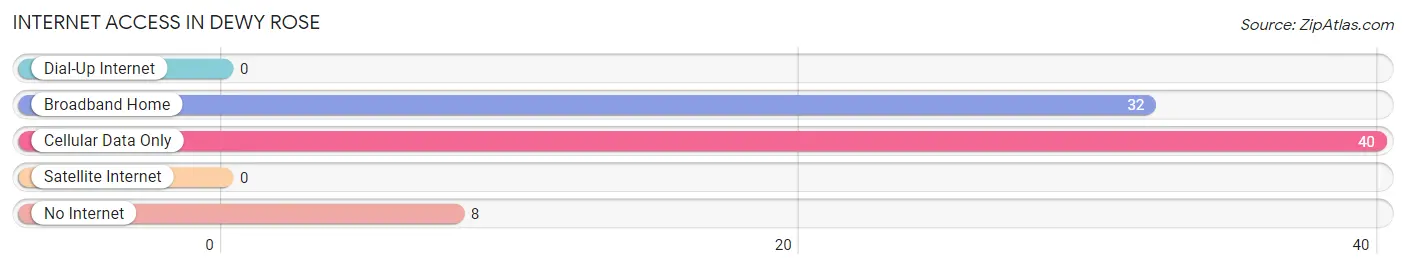
| Internet Type | # Households | % Households |
| Dial-Up Internet | 0 | 0.0% |
| Broadband Home | 32 | 40.0% |
| Cellular Data Only | 40 | 50.0% |
| Satellite Internet | 0 | 0.0% |
| No Internet | 8 | 10.0% |
| Total | 80 | 100.0% |
Dewy Rose Summary
Dewy Rose is a small unincorporated community located in Elbert County, Georgia. It is situated in the foothills of the Blue Ridge Mountains, approximately 25 miles northeast of Athens. The town is named after the Dewy Rose Creek, which flows through the area.
History
The area that is now Dewy Rose was first settled in the early 1800s by settlers from North Carolina. The town was officially established in 1820 and was named after the Dewy Rose Creek. The creek was named after a Cherokee chief named Dewy Rose.
In the late 1800s, the town was a thriving agricultural community. Cotton was the main crop grown in the area, and the town was home to several cotton gins. The town also had a sawmill, a gristmill, and a blacksmith shop.
In the early 1900s, the town began to decline as the cotton industry moved away from the area. The town was also affected by the Great Depression, and many of the businesses in the area closed.
Geography
Dewy Rose is located in the foothills of the Blue Ridge Mountains in Elbert County, Georgia. The town is situated at an elevation of 890 feet above sea level. The town is located approximately 25 miles northeast of Athens and is bordered by the towns of Bowman and Carlton.
The town is located in a rural area and is surrounded by rolling hills and farmland. The town is also home to several small lakes, including Lake Russell and Lake Hartwell.
Economy
The economy of Dewy Rose is largely based on agriculture. The town is home to several farms that grow a variety of crops, including cotton, corn, soybeans, and wheat. The town is also home to several small businesses, including a grocery store, a hardware store, and a gas station.
Demographics
As of the 2010 census, the population of Dewy Rose was 1,093. The town is predominantly white, with a small African American population. The median household income in the town is $31,250, and the median home value is $90,000.
Conclusion
Dewy Rose is a small unincorporated community located in Elbert County, Georgia. The town was established in 1820 and was named after the Dewy Rose Creek. The town is situated in the foothills of the Blue Ridge Mountains and is home to several small businesses and farms. The population of Dewy Rose is predominantly white, with a small African American population. The town's economy is largely based on agriculture, and the median household income is $31,250.
Common Questions
What is Per Capita Income in Dewy Rose?
Per Capita income in Dewy Rose is $18,207.
What is the Median Family Income in Dewy Rose?
Median Family Income in Dewy Rose is $48,828.
What is the Median Household income in Dewy Rose?
Median Household Income in Dewy Rose is $48,516.
What is Income or Wage Gap in Dewy Rose?
Income or Wage Gap in Dewy Rose is 2.0%.
Women in Dewy Rose earn 98.0 cents for every dollar earned by a man.
What is Inequality or Gini Index in Dewy Rose?
Inequality or Gini Index in Dewy Rose is 0.14.
What is the Total Population of Dewy Rose?
Total Population of Dewy Rose is 269.
What is the Total Male Population of Dewy Rose?
Total Male Population of Dewy Rose is 140.
What is the Total Female Population of Dewy Rose?
Total Female Population of Dewy Rose is 129.
What is the Ratio of Males per 100 Females in Dewy Rose?
There are 108.53 Males per 100 Females in Dewy Rose.
What is the Ratio of Females per 100 Males in Dewy Rose?
There are 92.14 Females per 100 Males in Dewy Rose.
What is the Median Population Age in Dewy Rose?
Median Population Age in Dewy Rose is 46.2 Years.
What is the Average Family Size in Dewy Rose
Average Family Size in Dewy Rose is 3.4 People.
What is the Average Household Size in Dewy Rose
Average Household Size in Dewy Rose is 3.4 People.
How Large is the Labor Force in Dewy Rose?
There are 165 People in the Labor Forcein in Dewy Rose.
What is the Percentage of People in the Labor Force in Dewy Rose?
67.9% of People are in the Labor Force in Dewy Rose.