Chatsworth, GA Map & Demographics
Chatsworth Map
Chatsworth Overview
$19,944
PER CAPITA INCOME
$77,862
AVG FAMILY INCOME
$59,028
AVG HOUSEHOLD INCOME
33.7%
WAGE / INCOME GAP [ % ]
66.3¢/ $1
WAGE / INCOME GAP [ $ ]
$15,454
FAMILY INCOME DEFICIT
0.40
INEQUALITY / GINI INDEX
4,840
TOTAL POPULATION
2,268
MALE POPULATION
2,572
FEMALE POPULATION
88.18
MALES / 100 FEMALES
113.40
FEMALES / 100 MALES
28.9
MEDIAN AGE
3.8
AVG FAMILY SIZE
3.2
AVG HOUSEHOLD SIZE
2,023
LABOR FORCE [ PEOPLE ]
59.2%
PERCENT IN LABOR FORCE
9.1%
UNEMPLOYMENT RATE
Chatsworth Zip Codes
Income in Chatsworth
Income Overview in Chatsworth
Per Capita Income in Chatsworth is $19,944, while median incomes of families and households are $77,862 and $59,028 respectively.
| Characteristic | Number | Measure |
| Per Capita Income | 4,840 | $19,944 |
| Median Family Income | 1,070 | $77,862 |
| Mean Family Income | 1,070 | $79,298 |
| Median Household Income | 1,442 | $59,028 |
| Mean Household Income | 1,442 | $66,500 |
| Income Deficit | 1,070 | $15,454 |
| Wage / Income Gap (%) | 4,840 | 33.65% |
| Wage / Income Gap ($) | 4,840 | 66.35¢ per $1 |
| Gini / Inequality Index | 4,840 | 0.40 |
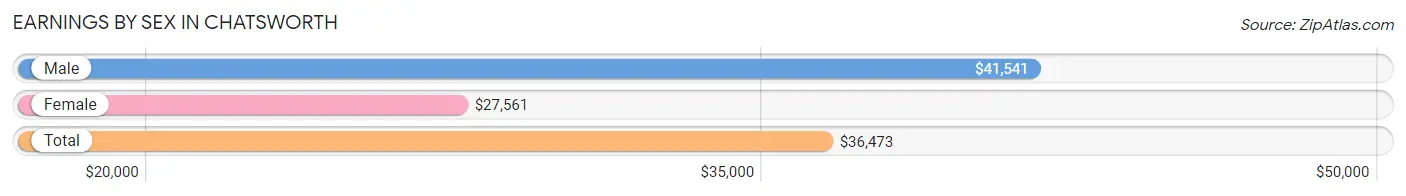
Earnings by Sex in Chatsworth
Average Earnings in Chatsworth are $36,473, $41,541 for men and $27,561 for women, a difference of 33.7%.
| Sex | Number | Average Earnings |
| Male | 1,259 (63.4%) | $41,541 |
| Female | 726 (36.6%) | $27,561 |
| Total | 1,985 (100.0%) | $36,473 |
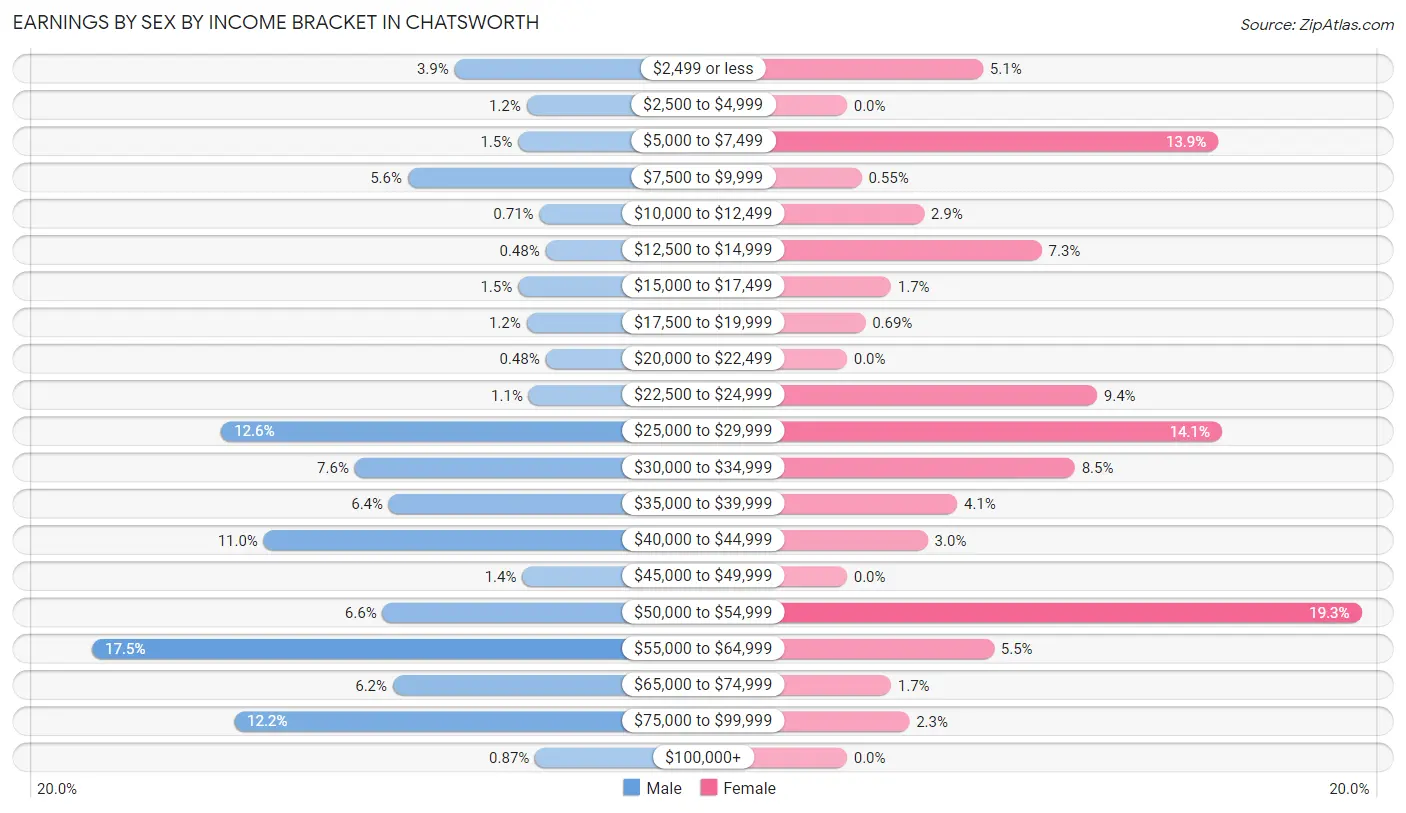
Earnings by Sex by Income Bracket in Chatsworth
The most common earnings brackets in Chatsworth are $55,000 to $64,999 for men (220 | 17.5%) and $50,000 to $54,999 for women (140 | 19.3%).
| Income | Male | Female |
| $2,499 or less | 49 (3.9%) | 37 (5.1%) |
| $2,500 to $4,999 | 15 (1.2%) | 0 (0.0%) |
| $5,000 to $7,499 | 19 (1.5%) | 101 (13.9%) |
| $7,500 to $9,999 | 71 (5.6%) | 4 (0.5%) |
| $10,000 to $12,499 | 9 (0.7%) | 21 (2.9%) |
| $12,500 to $14,999 | 6 (0.5%) | 53 (7.3%) |
| $15,000 to $17,499 | 19 (1.5%) | 12 (1.7%) |
| $17,500 to $19,999 | 15 (1.2%) | 5 (0.7%) |
| $20,000 to $22,499 | 6 (0.5%) | 0 (0.0%) |
| $22,500 to $24,999 | 14 (1.1%) | 68 (9.4%) |
| $25,000 to $29,999 | 159 (12.6%) | 102 (14.1%) |
| $30,000 to $34,999 | 96 (7.6%) | 62 (8.5%) |
| $35,000 to $39,999 | 80 (6.4%) | 30 (4.1%) |
| $40,000 to $44,999 | 139 (11.0%) | 22 (3.0%) |
| $45,000 to $49,999 | 17 (1.3%) | 0 (0.0%) |
| $50,000 to $54,999 | 83 (6.6%) | 140 (19.3%) |
| $55,000 to $64,999 | 220 (17.5%) | 40 (5.5%) |
| $65,000 to $74,999 | 78 (6.2%) | 12 (1.7%) |
| $75,000 to $99,999 | 153 (12.1%) | 17 (2.3%) |
| $100,000+ | 11 (0.9%) | 0 (0.0%) |
| Total | 1,259 (100.0%) | 726 (100.0%) |
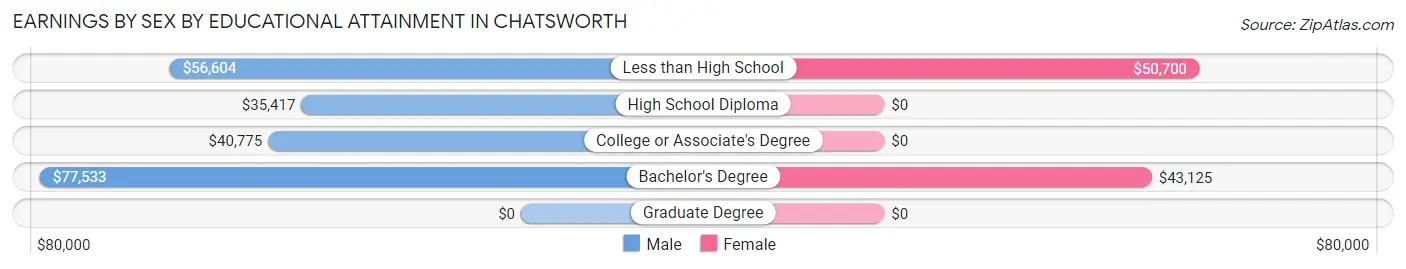
Earnings by Sex by Educational Attainment in Chatsworth
Average earnings in Chatsworth are $46,838 for men and $30,370 for women, a difference of 35.2%. Men with an educational attainment of bachelor's degree enjoy the highest average annual earnings of $77,533, while those with high school diploma education earn the least with $35,417. Women with an educational attainment of less than high school earn the most with the average annual earnings of $50,700, while those with bachelor's degree education have the smallest earnings of $43,125.
| Educational Attainment | Male Income | Female Income |
| Less than High School | $56,604 | $50,700 |
| High School Diploma | $35,417 | $0 |
| College or Associate's Degree | $40,775 | $0 |
| Bachelor's Degree | $77,533 | $43,125 |
| Graduate Degree | - | - |
| Total | $46,838 | $30,370 |
Family Income in Chatsworth
Family Income Brackets in Chatsworth
According to the Chatsworth family income data, there are 247 families falling into the $100,000 to $149,999 income range, which is the most common income bracket and makes up 23.1% of all families.
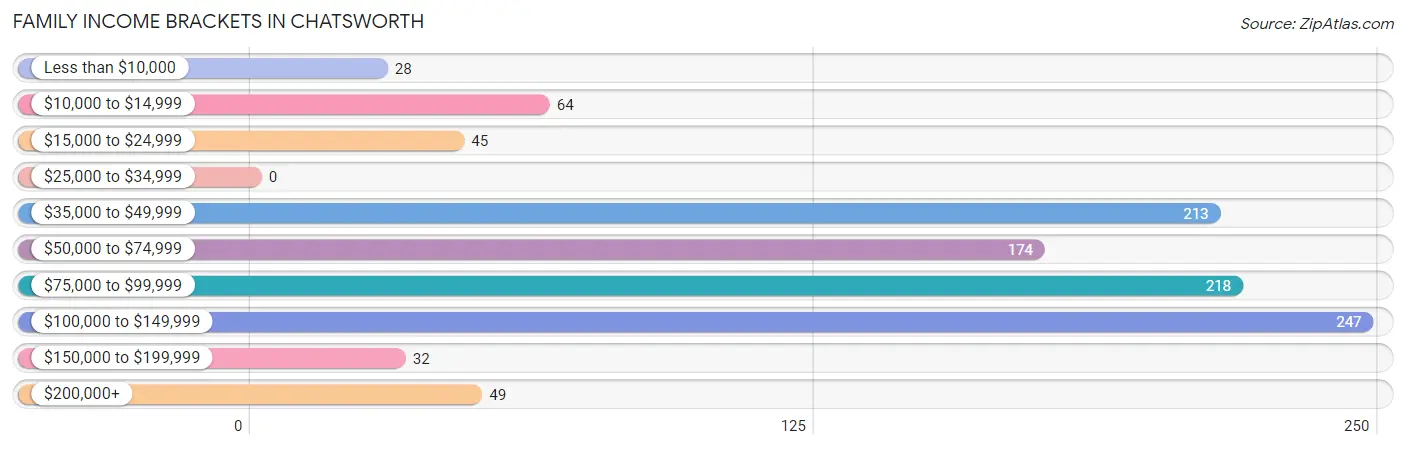
| Income Bracket | # Families | % Families |
| Less than $10,000 | 28 | 2.6% |
| $10,000 to $14,999 | 64 | 6.0% |
| $15,000 to $24,999 | 45 | 4.2% |
| $25,000 to $34,999 | 0 | 0.0% |
| $35,000 to $49,999 | 213 | 19.9% |
| $50,000 to $74,999 | 174 | 16.3% |
| $75,000 to $99,999 | 218 | 20.4% |
| $100,000 to $149,999 | 247 | 23.1% |
| $150,000 to $199,999 | 32 | 3.0% |
| $200,000+ | 49 | 4.6% |
Family Income by Famaliy Size in Chatsworth
2-person families (297 | 27.8%) account for the highest median family income in Chatsworth with $80,838 per family, while 2-person families (297 | 27.8%) have the highest median income of $40,419 per family member.
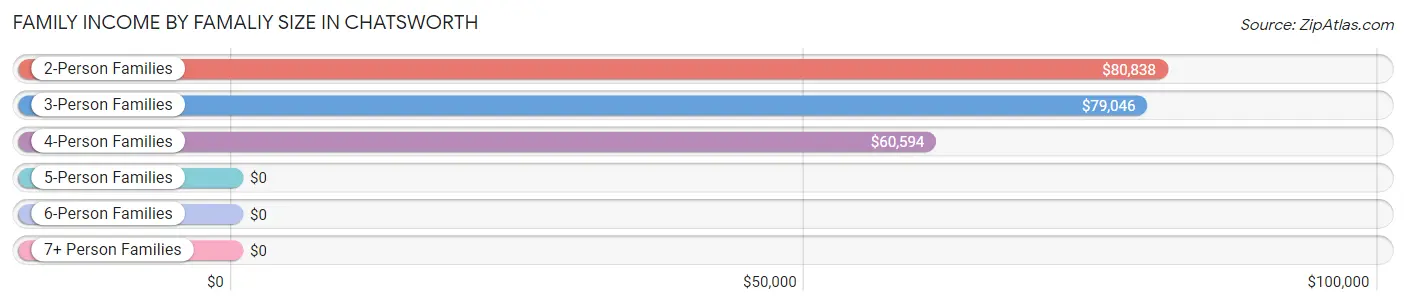
| Income Bracket | # Families | Median Income |
| 2-Person Families | 297 (27.8%) | $80,838 |
| 3-Person Families | 218 (20.4%) | $79,046 |
| 4-Person Families | 367 (34.3%) | $60,594 |
| 5-Person Families | 106 (9.9%) | $0 |
| 6-Person Families | 33 (3.1%) | $0 |
| 7+ Person Families | 49 (4.6%) | $0 |
| Total | 1,070 (100.0%) | $77,862 |
Family Income by Number of Earners in Chatsworth
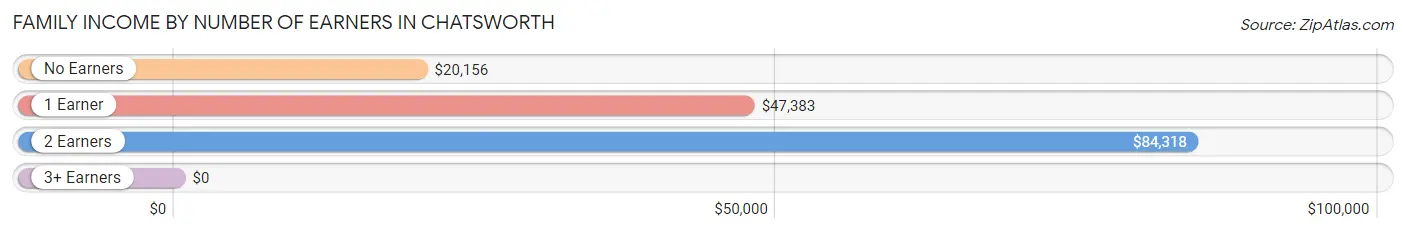
| Number of Earners | # Families | Median Income |
| No Earners | 107 (10.0%) | $20,156 |
| 1 Earner | 391 (36.5%) | $47,383 |
| 2 Earners | 444 (41.5%) | $84,318 |
| 3+ Earners | 128 (12.0%) | $0 |
| Total | 1,070 (100.0%) | $77,862 |
Household Income in Chatsworth
Household Income Brackets in Chatsworth
With 260 households falling in the category, the $100,000 to $149,999 income range is the most frequent in Chatsworth, accounting for 18.0% of all households. In contrast, only 22 households (1.5%) fall into the $25,000 to $34,999 income bracket, making it the least populous group.
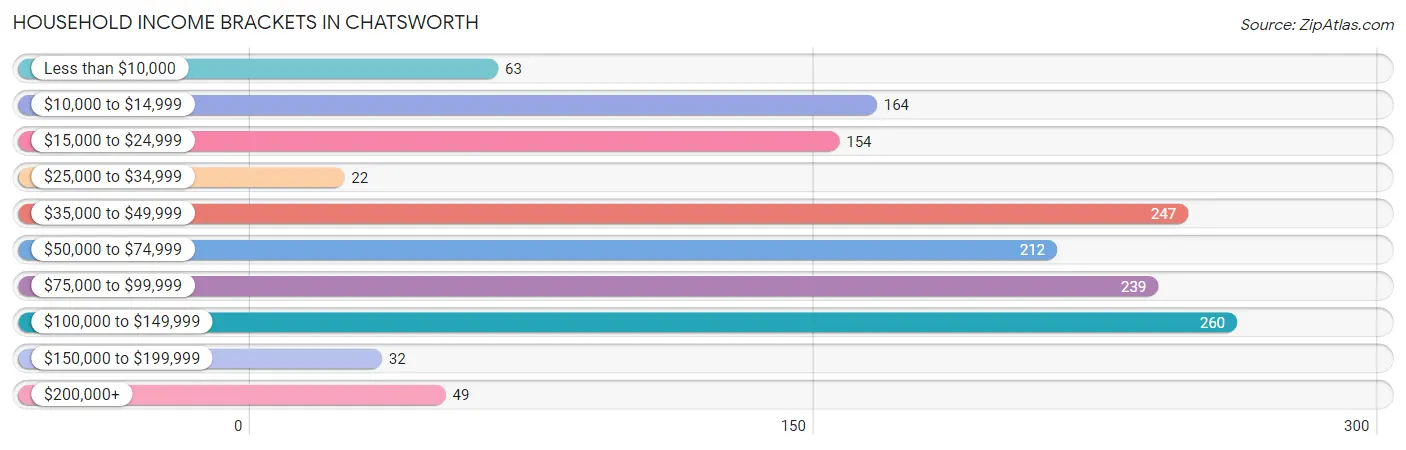
| Income Bracket | # Households | % Households |
| Less than $10,000 | 63 | 4.4% |
| $10,000 to $14,999 | 164 | 11.4% |
| $15,000 to $24,999 | 154 | 10.7% |
| $25,000 to $34,999 | 22 | 1.5% |
| $35,000 to $49,999 | 247 | 17.1% |
| $50,000 to $74,999 | 212 | 14.7% |
| $75,000 to $99,999 | 239 | 16.6% |
| $100,000 to $149,999 | 260 | 18.0% |
| $150,000 to $199,999 | 32 | 2.2% |
| $200,000+ | 49 | 3.4% |
Household Income by Householder Age in Chatsworth
The median household income in Chatsworth is $59,028, with the highest median household income of $80,265 found in the 45 to 64 years age bracket for the primary householder. A total of 434 households (30.1%) fall into this category. Meanwhile, the 15 to 24 years age bracket for the primary householder has the lowest median household income of $0, with 53 households (3.7%) in this group.
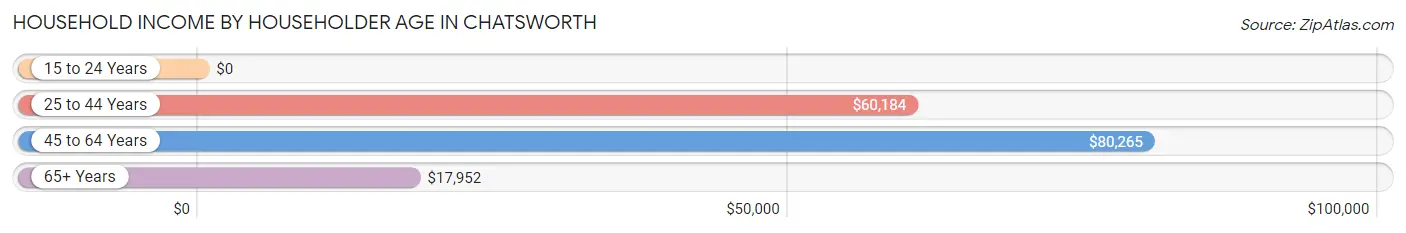
| Income Bracket | # Households | Median Income |
| 15 to 24 Years | 53 (3.7%) | $0 |
| 25 to 44 Years | 629 (43.6%) | $60,184 |
| 45 to 64 Years | 434 (30.1%) | $80,265 |
| 65+ Years | 326 (22.6%) | $17,952 |
| Total | 1,442 (100.0%) | $59,028 |
Poverty in Chatsworth
Income Below Poverty by Sex and Age in Chatsworth
With 12.1% poverty level for males and 17.6% for females among the residents of Chatsworth, 12 to 14 year old males and 75 year old and over females are the most vulnerable to poverty, with 126 males (67.0%) and 66 females (58.4%) in their respective age groups living below the poverty level.
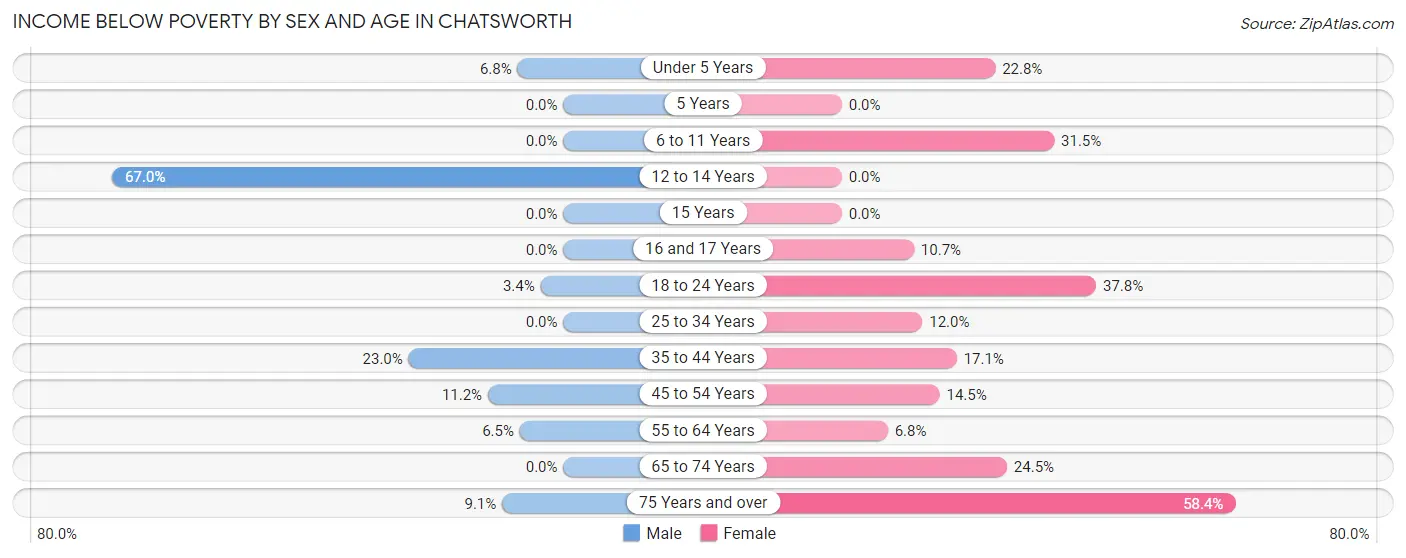
| Age Bracket | Male | Female |
| Under 5 Years | 10 (6.8%) | 41 (22.8%) |
| 5 Years | 0 (0.0%) | 0 (0.0%) |
| 6 to 11 Years | 0 (0.0%) | 64 (31.5%) |
| 12 to 14 Years | 126 (67.0%) | 0 (0.0%) |
| 15 Years | 0 (0.0%) | 0 (0.0%) |
| 16 and 17 Years | 0 (0.0%) | 6 (10.7%) |
| 18 to 24 Years | 5 (3.4%) | 54 (37.8%) |
| 25 to 34 Years | 0 (0.0%) | 68 (11.9%) |
| 35 to 44 Years | 74 (23.0%) | 43 (17.1%) |
| 45 to 54 Years | 29 (11.2%) | 28 (14.5%) |
| 55 to 64 Years | 9 (6.5%) | 9 (6.8%) |
| 65 to 74 Years | 0 (0.0%) | 51 (24.5%) |
| 75 Years and over | 1 (9.1%) | 66 (58.4%) |
| Total | 254 (12.1%) | 430 (17.6%) |
Income Above Poverty by Sex and Age in Chatsworth
According to the poverty statistics in Chatsworth, males aged 5 years and females aged 5 years are the age groups that are most secure financially, with 100.0% of males and 100.0% of females in these age groups living above the poverty line.
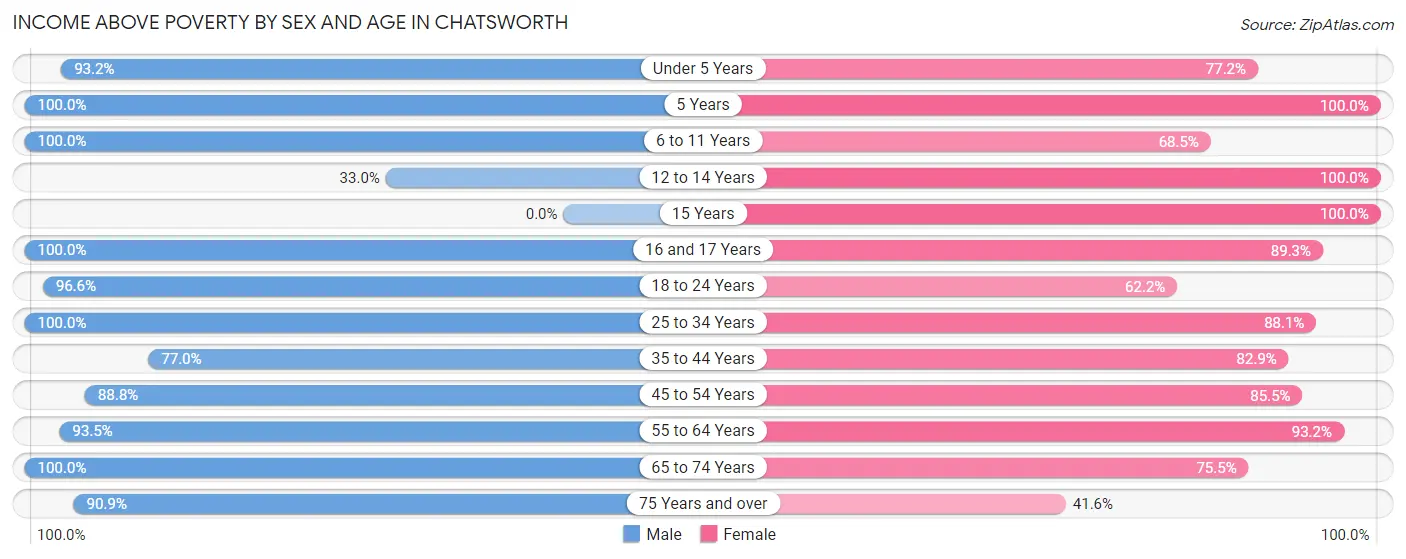
| Age Bracket | Male | Female |
| Under 5 Years | 137 (93.2%) | 139 (77.2%) |
| 5 Years | 13 (100.0%) | 304 (100.0%) |
| 6 to 11 Years | 268 (100.0%) | 139 (68.5%) |
| 12 to 14 Years | 62 (33.0%) | 79 (100.0%) |
| 15 Years | 0 (0.0%) | 8 (100.0%) |
| 16 and 17 Years | 143 (100.0%) | 50 (89.3%) |
| 18 to 24 Years | 143 (96.6%) | 89 (62.2%) |
| 25 to 34 Years | 397 (100.0%) | 501 (88.0%) |
| 35 to 44 Years | 248 (77.0%) | 209 (82.9%) |
| 45 to 54 Years | 230 (88.8%) | 165 (85.5%) |
| 55 to 64 Years | 130 (93.5%) | 123 (93.2%) |
| 65 to 74 Years | 66 (100.0%) | 157 (75.5%) |
| 75 Years and over | 10 (90.9%) | 47 (41.6%) |
| Total | 1,847 (87.9%) | 2,010 (82.4%) |
Income Below Poverty Among Married-Couple Families in Chatsworth
The poverty statistics for married-couple families in Chatsworth show that 5.4% or 50 of the total 932 families live below the poverty line. Families with 3 or 4 children have the highest poverty rate of 40.3%, comprising of 29 families. On the other hand, families with 1 or 2 children have the lowest poverty rate of 1.7%, which includes 9 families.
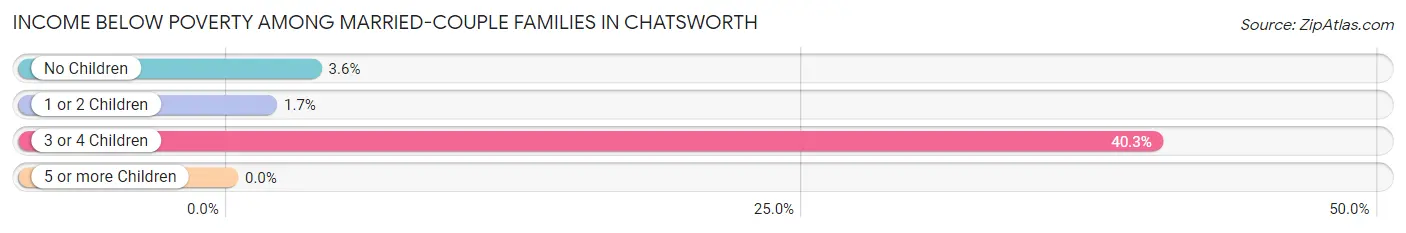
| Children | Above Poverty | Below Poverty |
| No Children | 318 (96.4%) | 12 (3.6%) |
| 1 or 2 Children | 521 (98.3%) | 9 (1.7%) |
| 3 or 4 Children | 43 (59.7%) | 29 (40.3%) |
| 5 or more Children | 0 (0.0%) | 0 (0.0%) |
| Total | 882 (94.6%) | 50 (5.4%) |
Income Below Poverty Among Single-Parent Households in Chatsworth
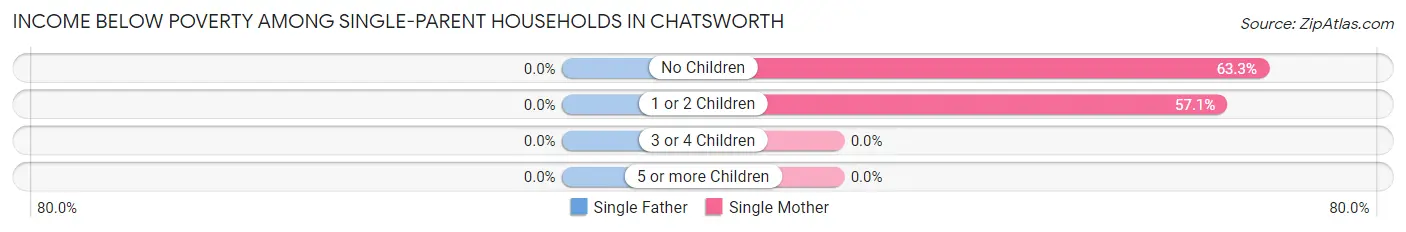
| Children | Single Father | Single Mother |
| No Children | 0 (0.0%) | 19 (63.3%) |
| 1 or 2 Children | 0 (0.0%) | 52 (57.1%) |
| 3 or 4 Children | 0 (0.0%) | 0 (0.0%) |
| 5 or more Children | 0 (0.0%) | 0 (0.0%) |
| Total | 0 (0.0%) | 71 (58.7%) |
Income Below Poverty Among Married-Couple vs Single-Parent Households in Chatsworth
The poverty data for Chatsworth shows that 50 of the married-couple family households (5.4%) and 71 of the single-parent households (51.4%) are living below the poverty level. Within the married-couple family households, those with 3 or 4 children have the highest poverty rate, with 29 households (40.3%) falling below the poverty line. Among the single-parent households, those with no children have the highest poverty rate, with 19 household (63.3%) living below poverty.
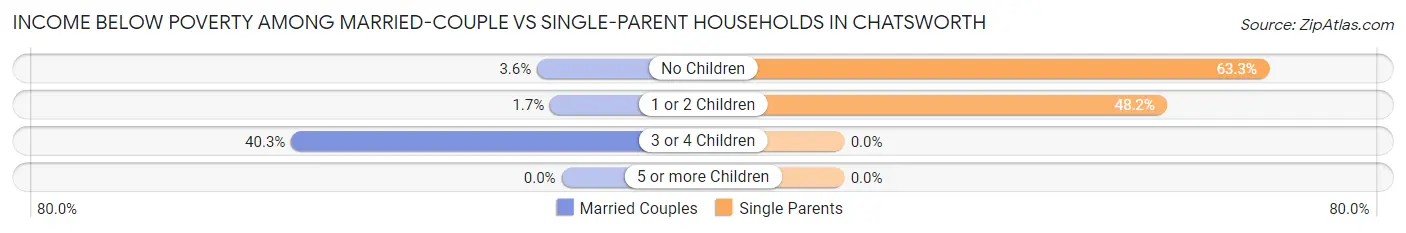
| Children | Married-Couple Families | Single-Parent Households |
| No Children | 12 (3.6%) | 19 (63.3%) |
| 1 or 2 Children | 9 (1.7%) | 52 (48.1%) |
| 3 or 4 Children | 29 (40.3%) | 0 (0.0%) |
| 5 or more Children | 0 (0.0%) | 0 (0.0%) |
| Total | 50 (5.4%) | 71 (51.4%) |
Race in Chatsworth
The most populous races in Chatsworth are White / Caucasian (4,628 | 95.6%), Hispanic or Latino (1,387 | 28.7%), and Two or more Races (142 | 2.9%).
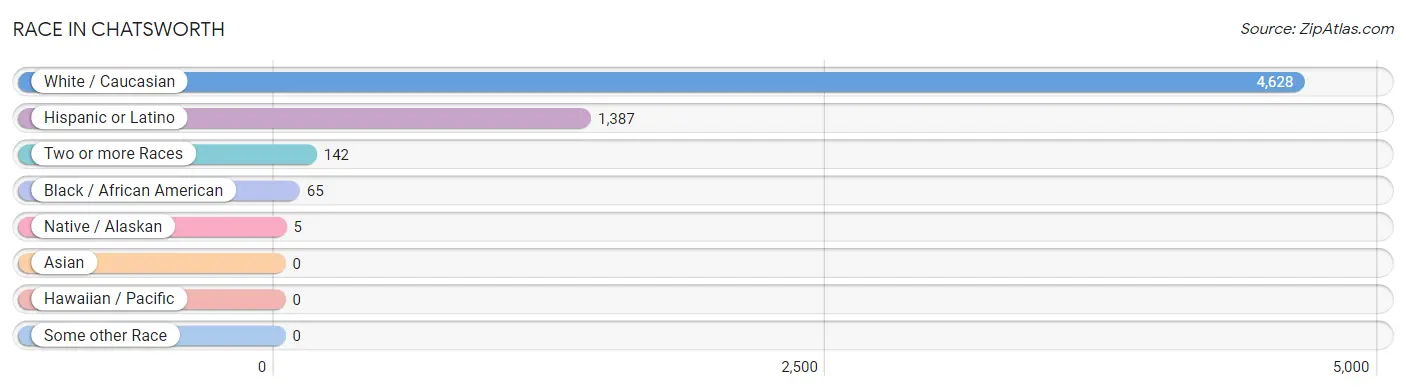
| Race | # Population | % Population |
| Asian | 0 | 0.0% |
| Black / African American | 65 | 1.3% |
| Hawaiian / Pacific | 0 | 0.0% |
| Hispanic or Latino | 1,387 | 28.7% |
| Native / Alaskan | 5 | 0.1% |
| White / Caucasian | 4,628 | 95.6% |
| Two or more Races | 142 | 2.9% |
| Some other Race | 0 | 0.0% |
| Total | 4,840 | 100.0% |
Ancestry in Chatsworth
The most populous ancestries reported in Chatsworth are English (1,316 | 27.2%), Mexican (1,227 | 25.4%), American (966 | 20.0%), Irish (259 | 5.3%), and German (183 | 3.8%), together accounting for 81.6% of all Chatsworth residents.
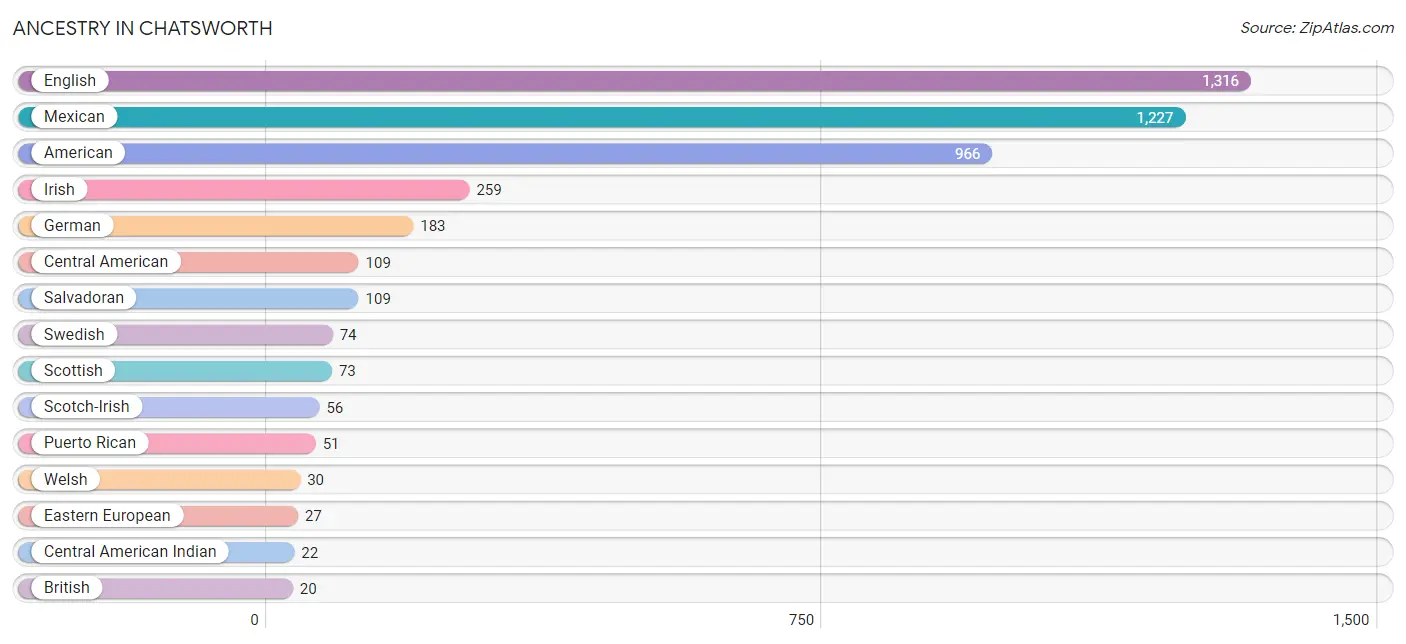
| Ancestry | # Population | % Population |
| African | 6 | 0.1% |
| American | 966 | 20.0% |
| British | 20 | 0.4% |
| Central American | 109 | 2.2% |
| Central American Indian | 22 | 0.4% |
| Cherokee | 12 | 0.3% |
| Dutch | 13 | 0.3% |
| Eastern European | 27 | 0.6% |
| English | 1,316 | 27.2% |
| French | 17 | 0.4% |
| German | 183 | 3.8% |
| Irish | 259 | 5.3% |
| Italian | 12 | 0.3% |
| Mexican | 1,227 | 25.4% |
| Nigerian | 6 | 0.1% |
| Puerto Rican | 51 | 1.1% |
| Salvadoran | 109 | 2.2% |
| Scotch-Irish | 56 | 1.2% |
| Scottish | 73 | 1.5% |
| Subsaharan African | 6 | 0.1% |
| Swedish | 74 | 1.5% |
| Welsh | 30 | 0.6% | View All 22 Rows |
Immigrants in Chatsworth
The most numerous immigrant groups reported in Chatsworth came from Central America (330 | 6.8%), Latin America (330 | 6.8%), Mexico (221 | 4.6%), and El Salvador (109 | 2.2%), together accounting for 20.5% of all Chatsworth residents.
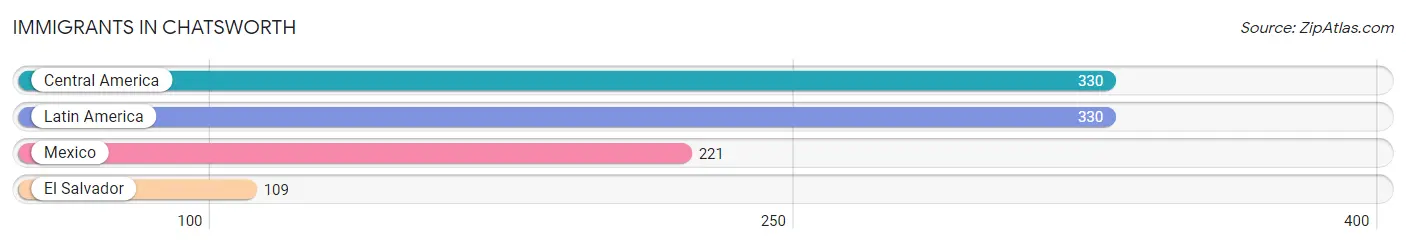
| Immigration Origin | # Population | % Population |
| Central America | 330 | 6.8% |
| El Salvador | 109 | 2.2% |
| Latin America | 330 | 6.8% |
| Mexico | 221 | 4.6% | View All 4 Rows |
Sex and Age in Chatsworth
Sex and Age in Chatsworth
The most populous age groups in Chatsworth are 5 to 9 Years (271 | 11.9%) for men and 5 to 9 Years (462 | 18.0%) for women.
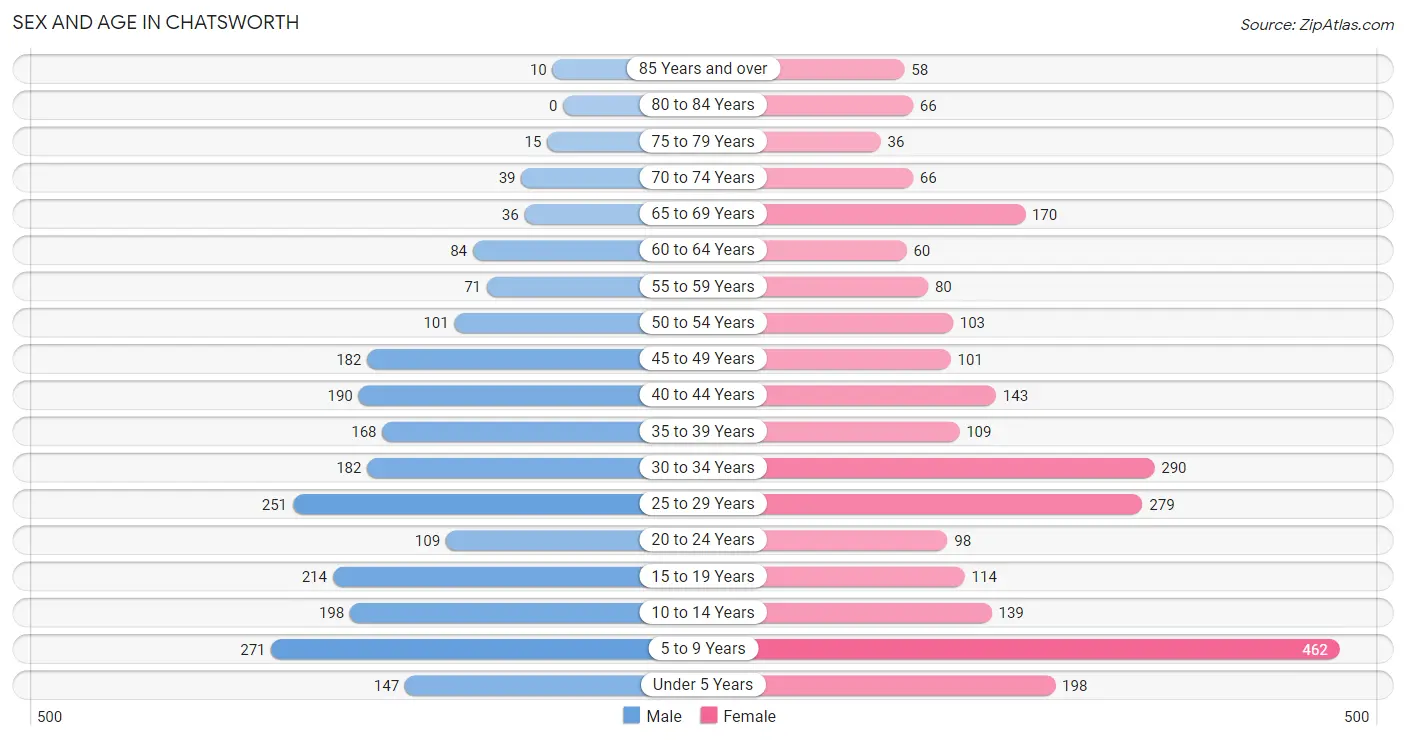
| Age Bracket | Male | Female |
| Under 5 Years | 147 (6.5%) | 198 (7.7%) |
| 5 to 9 Years | 271 (11.9%) | 462 (18.0%) |
| 10 to 14 Years | 198 (8.7%) | 139 (5.4%) |
| 15 to 19 Years | 214 (9.4%) | 114 (4.4%) |
| 20 to 24 Years | 109 (4.8%) | 98 (3.8%) |
| 25 to 29 Years | 251 (11.1%) | 279 (10.8%) |
| 30 to 34 Years | 182 (8.0%) | 290 (11.3%) |
| 35 to 39 Years | 168 (7.4%) | 109 (4.2%) |
| 40 to 44 Years | 190 (8.4%) | 143 (5.6%) |
| 45 to 49 Years | 182 (8.0%) | 101 (3.9%) |
| 50 to 54 Years | 101 (4.4%) | 103 (4.0%) |
| 55 to 59 Years | 71 (3.1%) | 80 (3.1%) |
| 60 to 64 Years | 84 (3.7%) | 60 (2.3%) |
| 65 to 69 Years | 36 (1.6%) | 170 (6.6%) |
| 70 to 74 Years | 39 (1.7%) | 66 (2.6%) |
| 75 to 79 Years | 15 (0.7%) | 36 (1.4%) |
| 80 to 84 Years | 0 (0.0%) | 66 (2.6%) |
| 85 Years and over | 10 (0.4%) | 58 (2.3%) |
| Total | 2,268 (100.0%) | 2,572 (100.0%) |
Families and Households in Chatsworth
Median Family Size in Chatsworth
The median family size in Chatsworth is 3.84 persons per family, with married-couple families (932 | 87.1%) accounting for the largest median family size of 3.87 persons per family. On the other hand, single male/father families (17 | 1.6%) represent the smallest median family size with 2.12 persons per family.
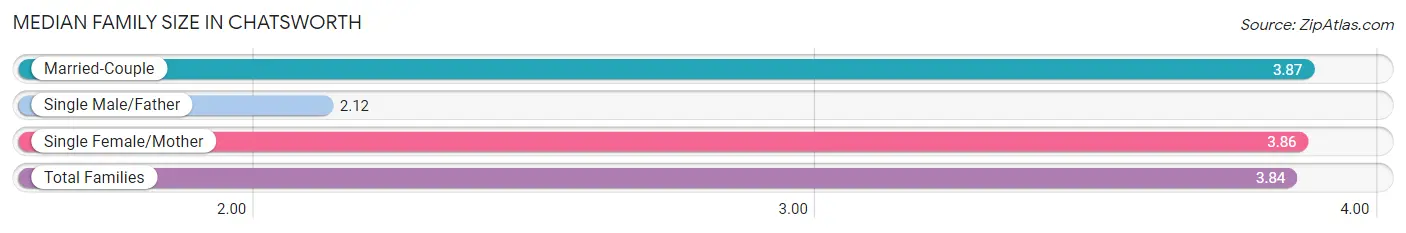
| Family Type | # Families | Family Size |
| Married-Couple | 932 (87.1%) | 3.87 |
| Single Male/Father | 17 (1.6%) | 2.12 |
| Single Female/Mother | 121 (11.3%) | 3.86 |
| Total Families | 1,070 (100.0%) | 3.84 |
Median Household Size in Chatsworth
The median household size in Chatsworth is 3.17 persons per household, with single female/mother households (121 | 8.4%) accounting for the largest median household size of 4.05 persons per household. non-family households (372 | 25.8%) represent the smallest median household size with 1.09 persons per household.
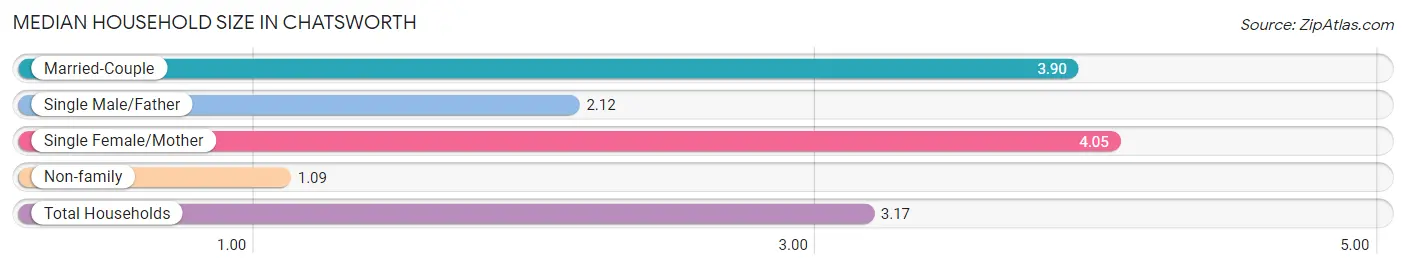
| Household Type | # Households | Household Size |
| Married-Couple | 932 (64.6%) | 3.90 |
| Single Male/Father | 17 (1.2%) | 2.12 |
| Single Female/Mother | 121 (8.4%) | 4.05 |
| Non-family | 372 (25.8%) | 1.09 |
| Total Households | 1,442 (100.0%) | 3.17 |
Household Size by Marriage Status in Chatsworth
Out of a total of 1,442 households in Chatsworth, 1,070 (74.2%) are family households, while 372 (25.8%) are nonfamily households. The most numerous type of family households are 4-person households, comprising 388, and the most common type of nonfamily households are 1-person households, comprising 348.
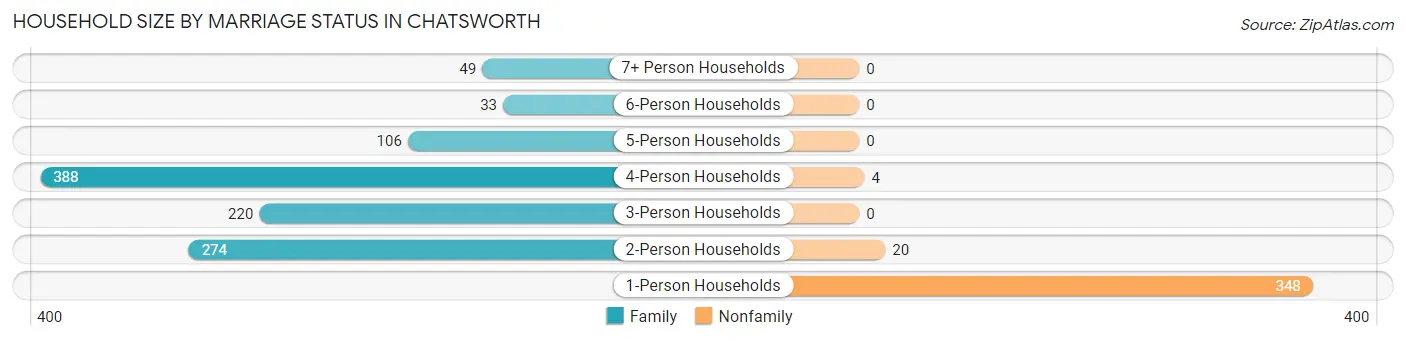
| Household Size | Family Households | Nonfamily Households |
| 1-Person Households | - | 348 (24.1%) |
| 2-Person Households | 274 (19.0%) | 20 (1.4%) |
| 3-Person Households | 220 (15.3%) | 0 (0.0%) |
| 4-Person Households | 388 (26.9%) | 4 (0.3%) |
| 5-Person Households | 106 (7.3%) | 0 (0.0%) |
| 6-Person Households | 33 (2.3%) | 0 (0.0%) |
| 7+ Person Households | 49 (3.4%) | 0 (0.0%) |
| Total | 1,070 (74.2%) | 372 (25.8%) |
Female Fertility in Chatsworth
Fertility by Age in Chatsworth
Average fertility rate in Chatsworth is 53.0 births per 1,000 women. Women in the age bracket of 20 to 34 years have the highest fertility rate with 90.0 births per 1,000 women. Women in the age bracket of 20 to 34 years acount for 100.0% of all women with births.
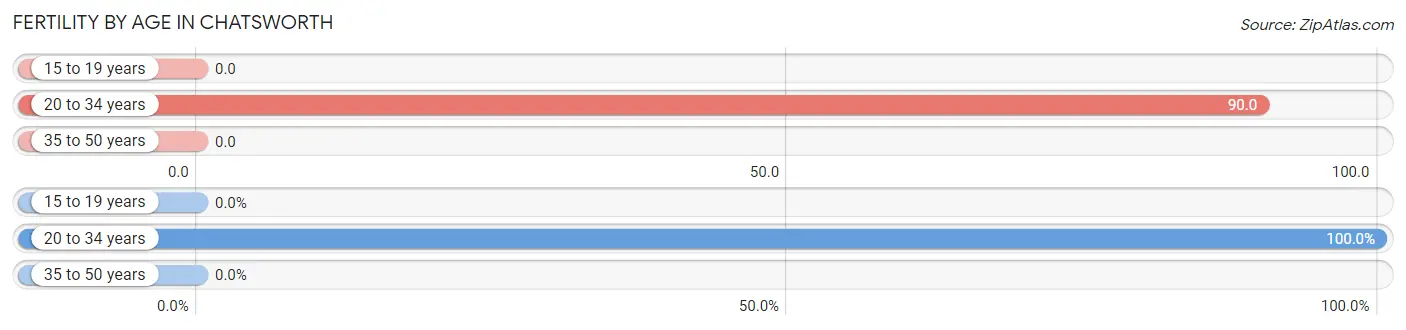
| Age Bracket | Women with Births | Births / 1,000 Women |
| 15 to 19 years | 0 (0.0%) | 0.0 |
| 20 to 34 years | 60 (100.0%) | 90.0 |
| 35 to 50 years | 0 (0.0%) | 0.0 |
| Total | 60 (100.0%) | 53.0 |
Fertility by Age by Marriage Status in Chatsworth
71.7% of women with births (60) in Chatsworth are married. The highest percentage of unmarried women with births falls into 20 to 34 years age bracket with 28.3% of them unmarried at the time of birth, while the lowest percentage of unmarried women with births belong to 20 to 34 years age bracket with 28.3% of them unmarried.
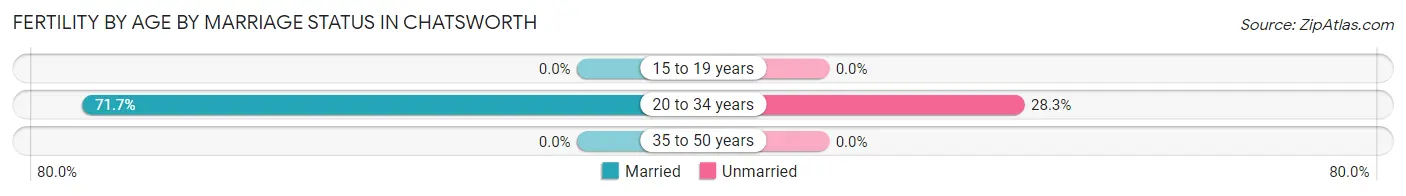
| Age Bracket | Married | Unmarried |
| 15 to 19 years | 0 (0.0%) | 0 (0.0%) |
| 20 to 34 years | 43 (71.7%) | 17 (28.3%) |
| 35 to 50 years | 0 (0.0%) | 0 (0.0%) |
| Total | 43 (71.7%) | 17 (28.3%) |
Fertility by Education in Chatsworth
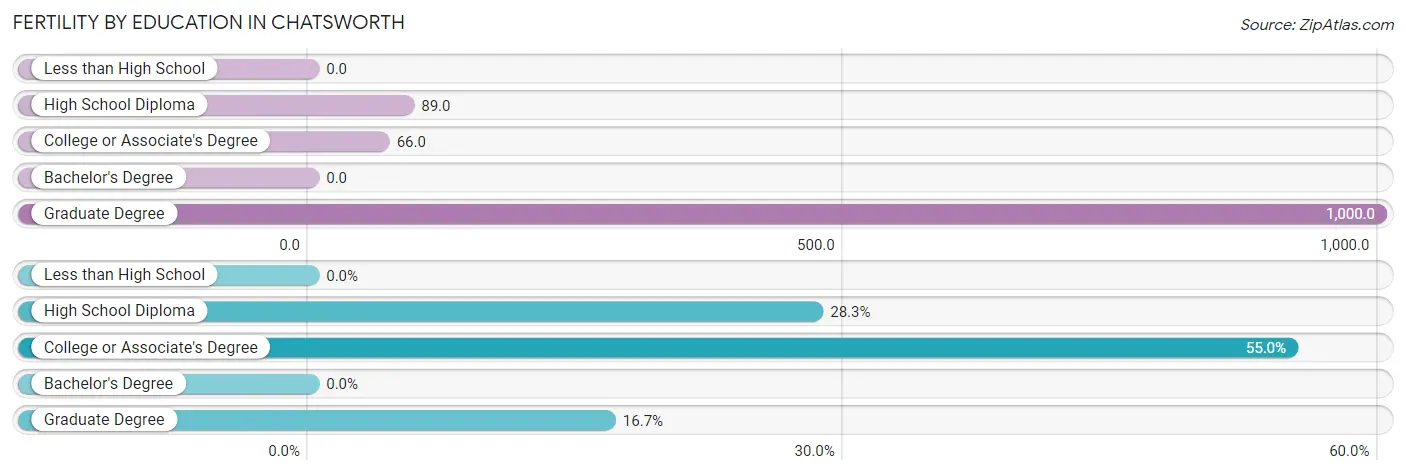
| Educational Attainment | Women with Births | Births / 1,000 Women |
| Less than High School | 0 (0.0%) | 0.0 |
| High School Diploma | 17 (28.3%) | 89.0 |
| College or Associate's Degree | 33 (55.0%) | 66.0 |
| Bachelor's Degree | 0 (0.0%) | 0.0 |
| Graduate Degree | 10 (16.7%) | 1,000.0 |
| Total | 60 (100.0%) | 53.0 |
Fertility by Education by Marriage Status in Chatsworth
28.3% of women with births in Chatsworth are unmarried. Women with the educational attainment of college or associate's degree are most likely to be married with 100.0% of them married at childbirth, while women with the educational attainment of high school diploma are least likely to be married with 100.0% of them unmarried at childbirth.
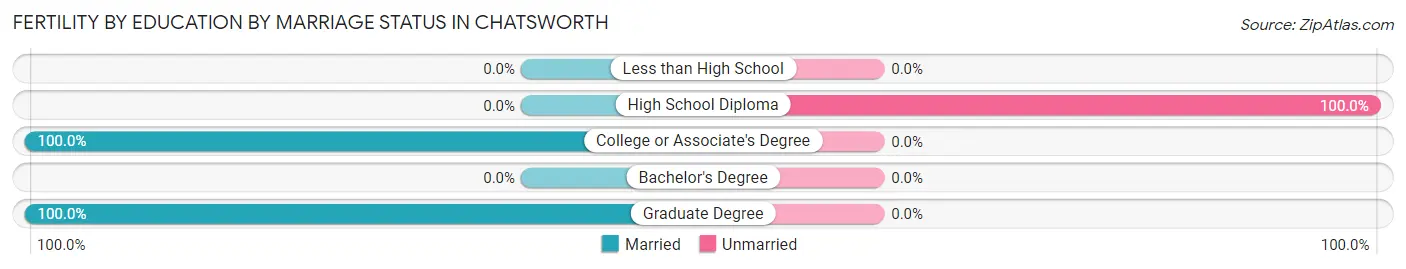
| Educational Attainment | Married | Unmarried |
| Less than High School | 0 (0.0%) | 0 (0.0%) |
| High School Diploma | 0 (0.0%) | 17 (100.0%) |
| College or Associate's Degree | 33 (100.0%) | 0 (0.0%) |
| Bachelor's Degree | 0 (0.0%) | 0 (0.0%) |
| Graduate Degree | 10 (100.0%) | 0 (0.0%) |
| Total | 43 (71.7%) | 17 (28.3%) |
Employment Characteristics in Chatsworth
Employment by Class of Employer in Chatsworth
Among the 1,827 employed individuals in Chatsworth, private company employees (1,594 | 87.3%), local government employees (118 | 6.5%), and not-for-profit organizations (59 | 3.2%) make up the most common classes of employment.
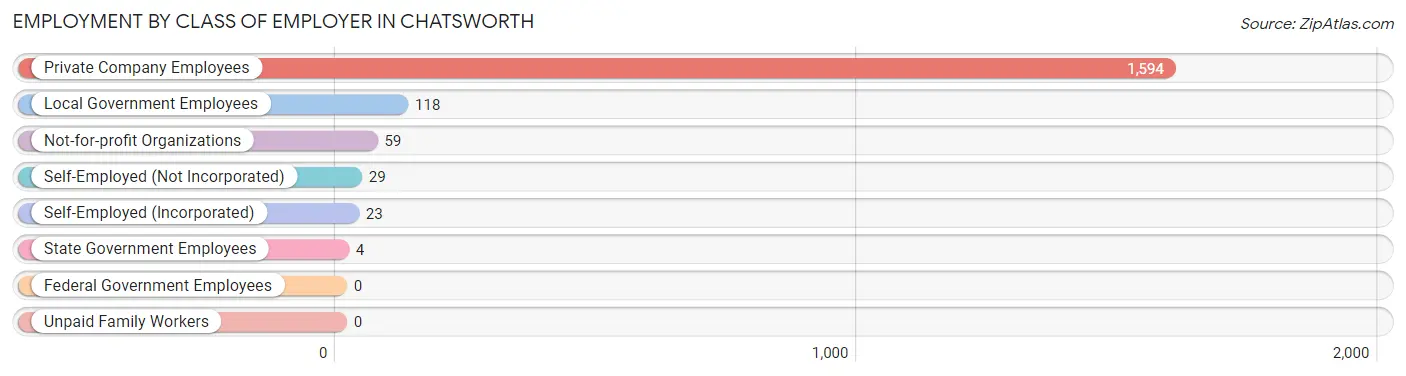
| Employer Class | # Employees | % Employees |
| Private Company Employees | 1,594 | 87.3% |
| Self-Employed (Incorporated) | 23 | 1.3% |
| Self-Employed (Not Incorporated) | 29 | 1.6% |
| Not-for-profit Organizations | 59 | 3.2% |
| Local Government Employees | 118 | 6.5% |
| State Government Employees | 4 | 0.2% |
| Federal Government Employees | 0 | 0.0% |
| Unpaid Family Workers | 0 | 0.0% |
| Total | 1,827 | 100.0% |
Employment Status by Age in Chatsworth
According to the labor force statistics for Chatsworth, out of the total population over 16 years of age (3,417), 59.2% or 2,023 individuals are in the labor force, with 9.1% or 184 of them unemployed. The age group with the highest labor force participation rate is 45 to 54 years, with 83.2% or 405 individuals in the labor force. Within the labor force, the 25 to 29 years age range has the highest percentage of unemployed individuals, with 42.1% or 185 of them being unemployed.
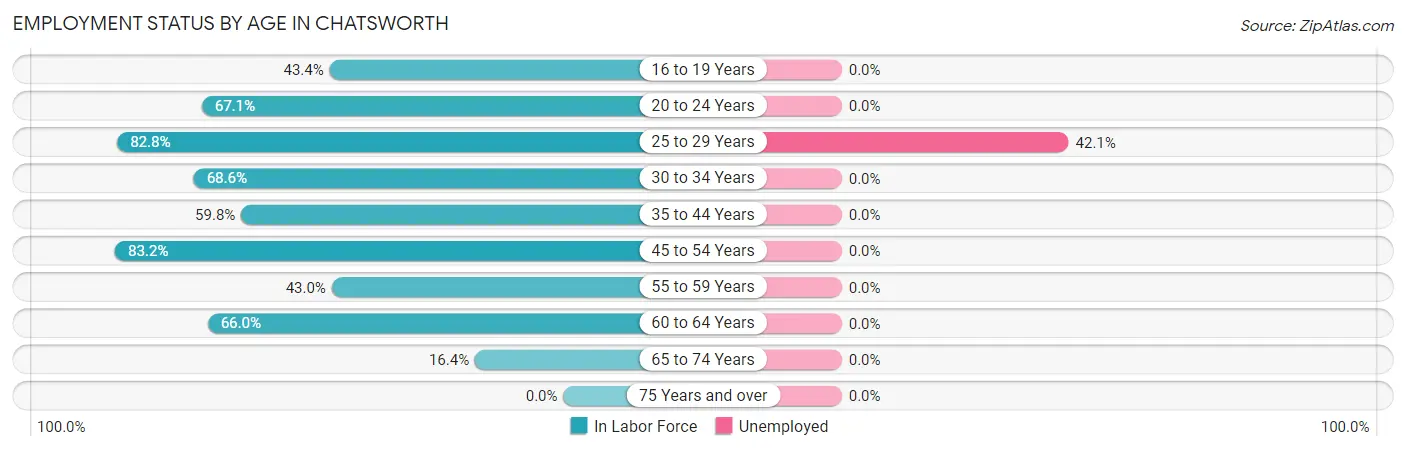
| Age Bracket | In Labor Force | Unemployed |
| 16 to 19 Years | 139 (43.4%) | 0 (0.0%) |
| 20 to 24 Years | 139 (67.1%) | 0 (0.0%) |
| 25 to 29 Years | 439 (82.8%) | 185 (42.1%) |
| 30 to 34 Years | 324 (68.6%) | 0 (0.0%) |
| 35 to 44 Years | 365 (59.8%) | 0 (0.0%) |
| 45 to 54 Years | 405 (83.2%) | 0 (0.0%) |
| 55 to 59 Years | 65 (43.0%) | 0 (0.0%) |
| 60 to 64 Years | 95 (66.0%) | 0 (0.0%) |
| 65 to 74 Years | 51 (16.4%) | 0 (0.0%) |
| 75 Years and over | 0 (0.0%) | 0 (0.0%) |
| Total | 2,023 (59.2%) | 184 (9.1%) |
Employment Status by Educational Attainment in Chatsworth
According to labor force statistics for Chatsworth, 70.7% of individuals (1,693) out of the total population between 25 and 64 years of age (2,394) are in the labor force, with 10.9% or 185 of them being unemployed. The group with the highest labor force participation rate are those with the educational attainment of bachelor's degree or higher, with 76.5% or 322 individuals in the labor force. Within the labor force, individuals with college / associate degree education have the highest percentage of unemployment, with 32.0% or 185 of them being unemployed.
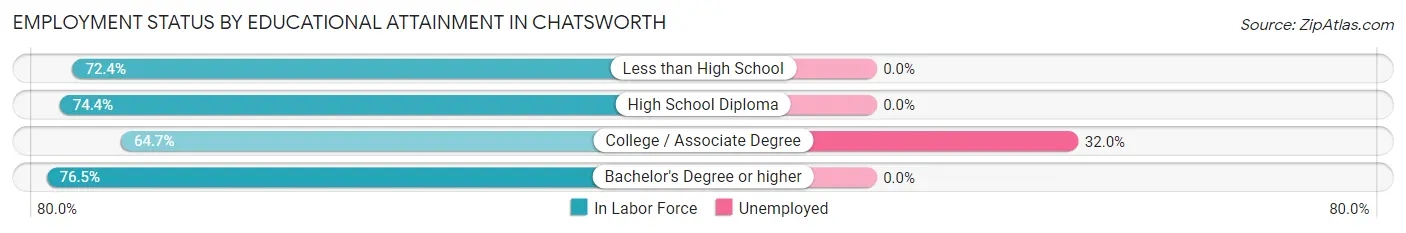
| Educational Attainment | In Labor Force | Unemployed |
| Less than High School | 383 (72.4%) | 0 (0.0%) |
| High School Diploma | 410 (74.4%) | 0 (0.0%) |
| College / Associate Degree | 578 (64.7%) | 286 (32.0%) |
| Bachelor's Degree or higher | 322 (76.5%) | 0 (0.0%) |
| Total | 1,693 (70.7%) | 261 (10.9%) |
Employment Occupations by Sex in Chatsworth
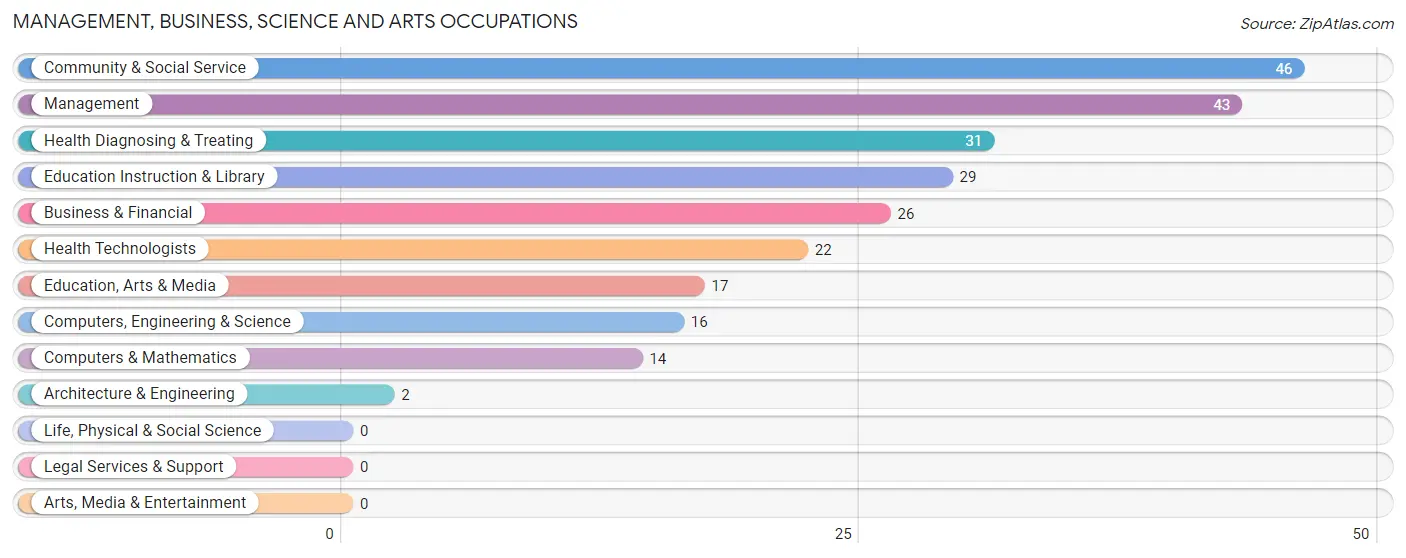
Management, Business, Science and Arts Occupations
The most common Management, Business, Science and Arts occupations in Chatsworth are Community & Social Service (46 | 2.5%), Management (43 | 2.3%), Health Diagnosing & Treating (31 | 1.7%), Education Instruction & Library (29 | 1.6%), and Business & Financial (26 | 1.4%).
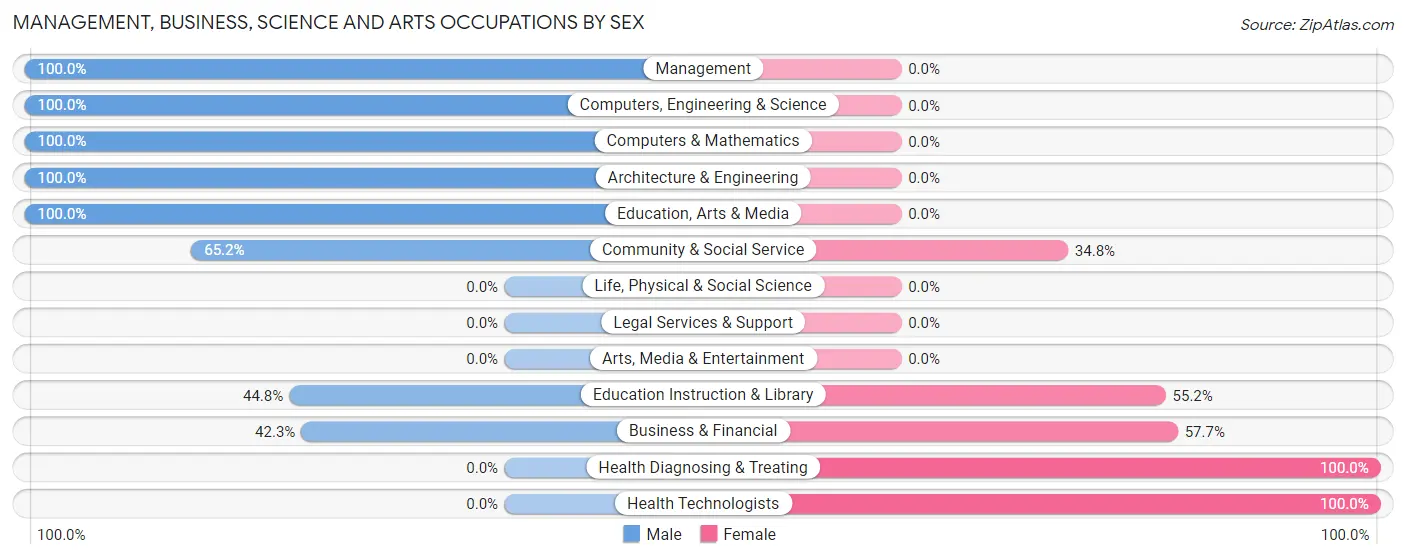
Management, Business, Science and Arts Occupations by Sex
Within the Management, Business, Science and Arts occupations in Chatsworth, the most male-oriented occupations are Management (100.0%), Computers, Engineering & Science (100.0%), and Computers & Mathematics (100.0%), while the most female-oriented occupations are Health Diagnosing & Treating (100.0%), Health Technologists (100.0%), and Business & Financial (57.7%).
| Occupation | Male | Female |
| Management | 43 (100.0%) | 0 (0.0%) |
| Business & Financial | 11 (42.3%) | 15 (57.7%) |
| Computers, Engineering & Science | 16 (100.0%) | 0 (0.0%) |
| Computers & Mathematics | 14 (100.0%) | 0 (0.0%) |
| Architecture & Engineering | 2 (100.0%) | 0 (0.0%) |
| Life, Physical & Social Science | 0 (0.0%) | 0 (0.0%) |
| Community & Social Service | 30 (65.2%) | 16 (34.8%) |
| Education, Arts & Media | 17 (100.0%) | 0 (0.0%) |
| Legal Services & Support | 0 (0.0%) | 0 (0.0%) |
| Education Instruction & Library | 13 (44.8%) | 16 (55.2%) |
| Arts, Media & Entertainment | 0 (0.0%) | 0 (0.0%) |
| Health Diagnosing & Treating | 0 (0.0%) | 31 (100.0%) |
| Health Technologists | 0 (0.0%) | 22 (100.0%) |
| Total (Category) | 100 (61.7%) | 62 (38.3%) |
| Total (Overall) | 1,161 (63.2%) | 676 (36.8%) |
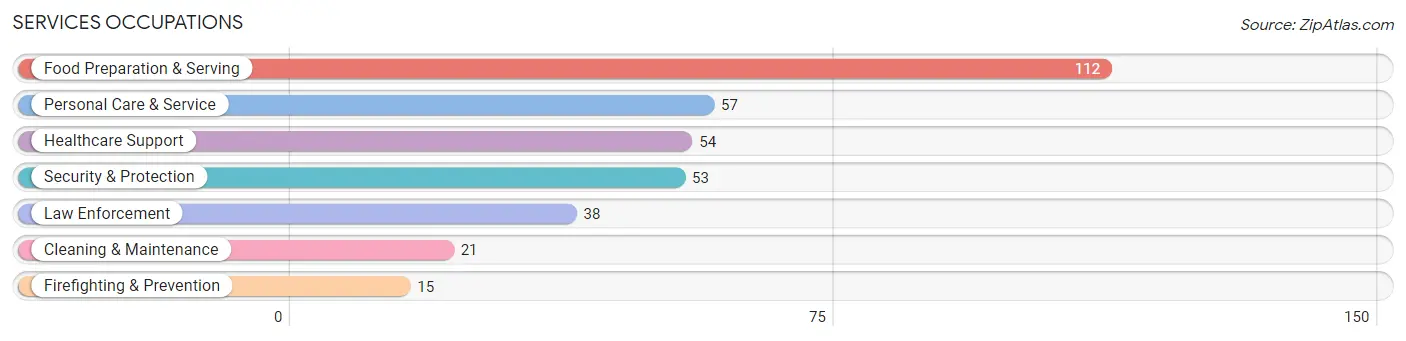
Services Occupations
The most common Services occupations in Chatsworth are Food Preparation & Serving (112 | 6.1%), Personal Care & Service (57 | 3.1%), Healthcare Support (54 | 2.9%), Security & Protection (53 | 2.9%), and Law Enforcement (38 | 2.1%).
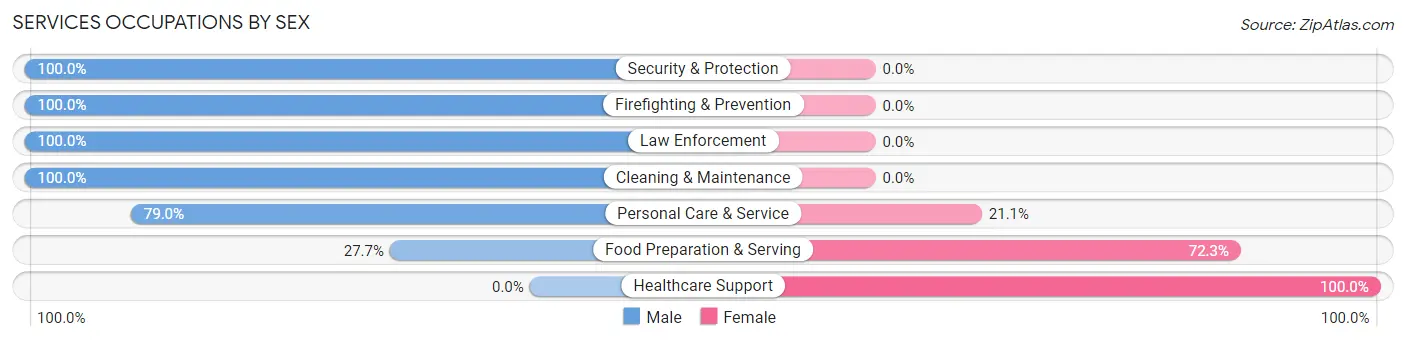
Services Occupations by Sex
Within the Services occupations in Chatsworth, the most male-oriented occupations are Security & Protection (100.0%), Firefighting & Prevention (100.0%), and Law Enforcement (100.0%), while the most female-oriented occupations are Healthcare Support (100.0%), Food Preparation & Serving (72.3%), and Personal Care & Service (21.0%).
| Occupation | Male | Female |
| Healthcare Support | 0 (0.0%) | 54 (100.0%) |
| Security & Protection | 53 (100.0%) | 0 (0.0%) |
| Firefighting & Prevention | 15 (100.0%) | 0 (0.0%) |
| Law Enforcement | 38 (100.0%) | 0 (0.0%) |
| Food Preparation & Serving | 31 (27.7%) | 81 (72.3%) |
| Cleaning & Maintenance | 21 (100.0%) | 0 (0.0%) |
| Personal Care & Service | 45 (78.9%) | 12 (21.0%) |
| Total (Category) | 150 (50.5%) | 147 (49.5%) |
| Total (Overall) | 1,161 (63.2%) | 676 (36.8%) |
Sales and Office Occupations
The most common Sales and Office occupations in Chatsworth are Sales & Related (273 | 14.9%), and Office & Administration (169 | 9.2%).
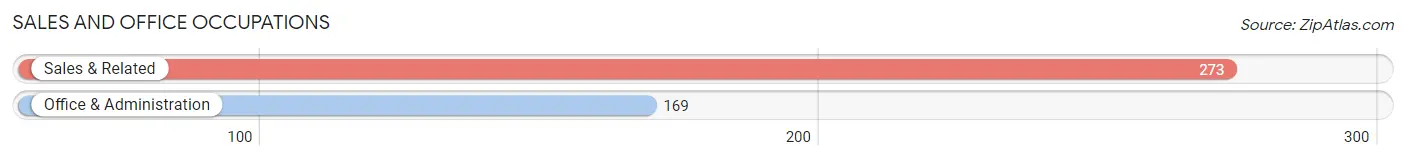
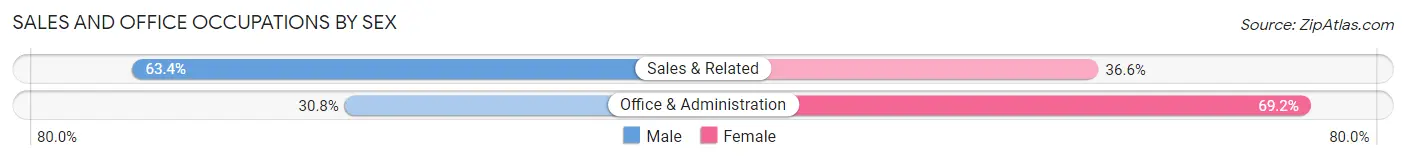
Sales and Office Occupations by Sex
| Occupation | Male | Female |
| Sales & Related | 173 (63.4%) | 100 (36.6%) |
| Office & Administration | 52 (30.8%) | 117 (69.2%) |
| Total (Category) | 225 (50.9%) | 217 (49.1%) |
| Total (Overall) | 1,161 (63.2%) | 676 (36.8%) |
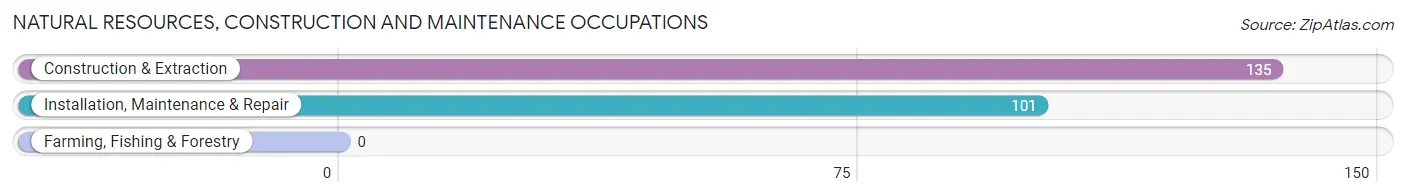
Natural Resources, Construction and Maintenance Occupations
The most common Natural Resources, Construction and Maintenance occupations in Chatsworth are Construction & Extraction (135 | 7.3%), and Installation, Maintenance & Repair (101 | 5.5%).
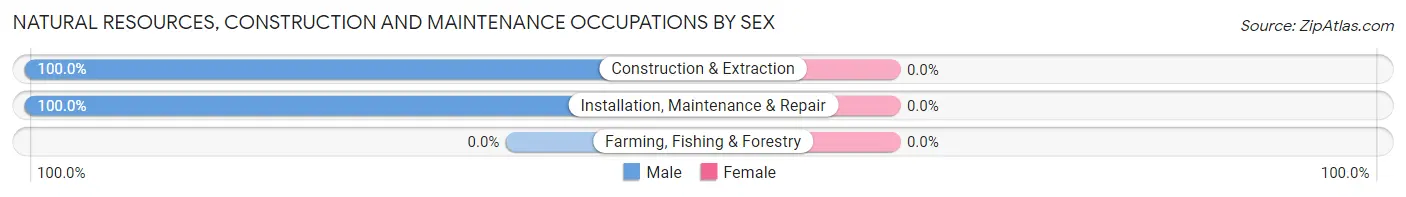
Natural Resources, Construction and Maintenance Occupations by Sex
| Occupation | Male | Female |
| Farming, Fishing & Forestry | 0 (0.0%) | 0 (0.0%) |
| Construction & Extraction | 135 (100.0%) | 0 (0.0%) |
| Installation, Maintenance & Repair | 101 (100.0%) | 0 (0.0%) |
| Total (Category) | 236 (100.0%) | 0 (0.0%) |
| Total (Overall) | 1,161 (63.2%) | 676 (36.8%) |
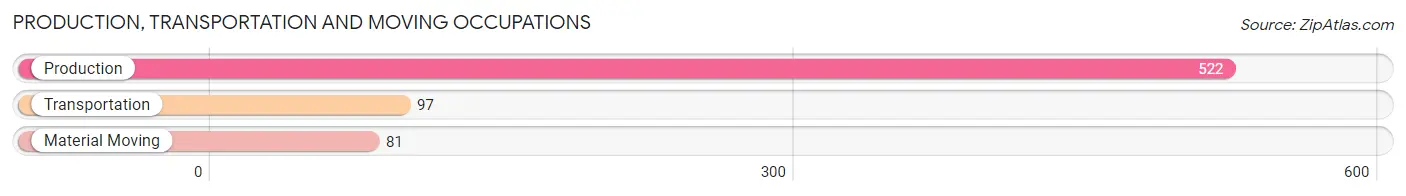
Production, Transportation and Moving Occupations
The most common Production, Transportation and Moving occupations in Chatsworth are Production (522 | 28.4%), Transportation (97 | 5.3%), and Material Moving (81 | 4.4%).
Production, Transportation and Moving Occupations by Sex
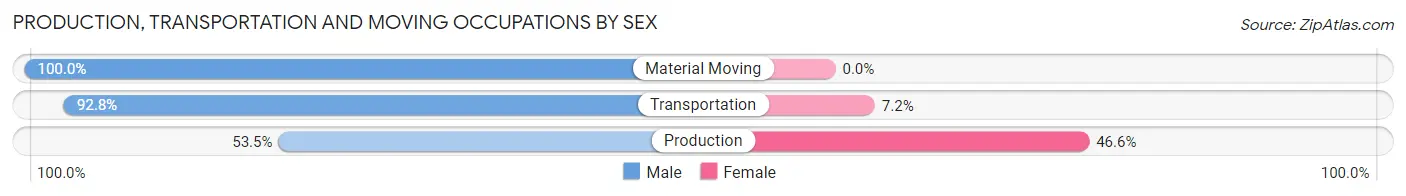
| Occupation | Male | Female |
| Production | 279 (53.4%) | 243 (46.6%) |
| Transportation | 90 (92.8%) | 7 (7.2%) |
| Material Moving | 81 (100.0%) | 0 (0.0%) |
| Total (Category) | 450 (64.3%) | 250 (35.7%) |
| Total (Overall) | 1,161 (63.2%) | 676 (36.8%) |
Employment Industries by Sex in Chatsworth
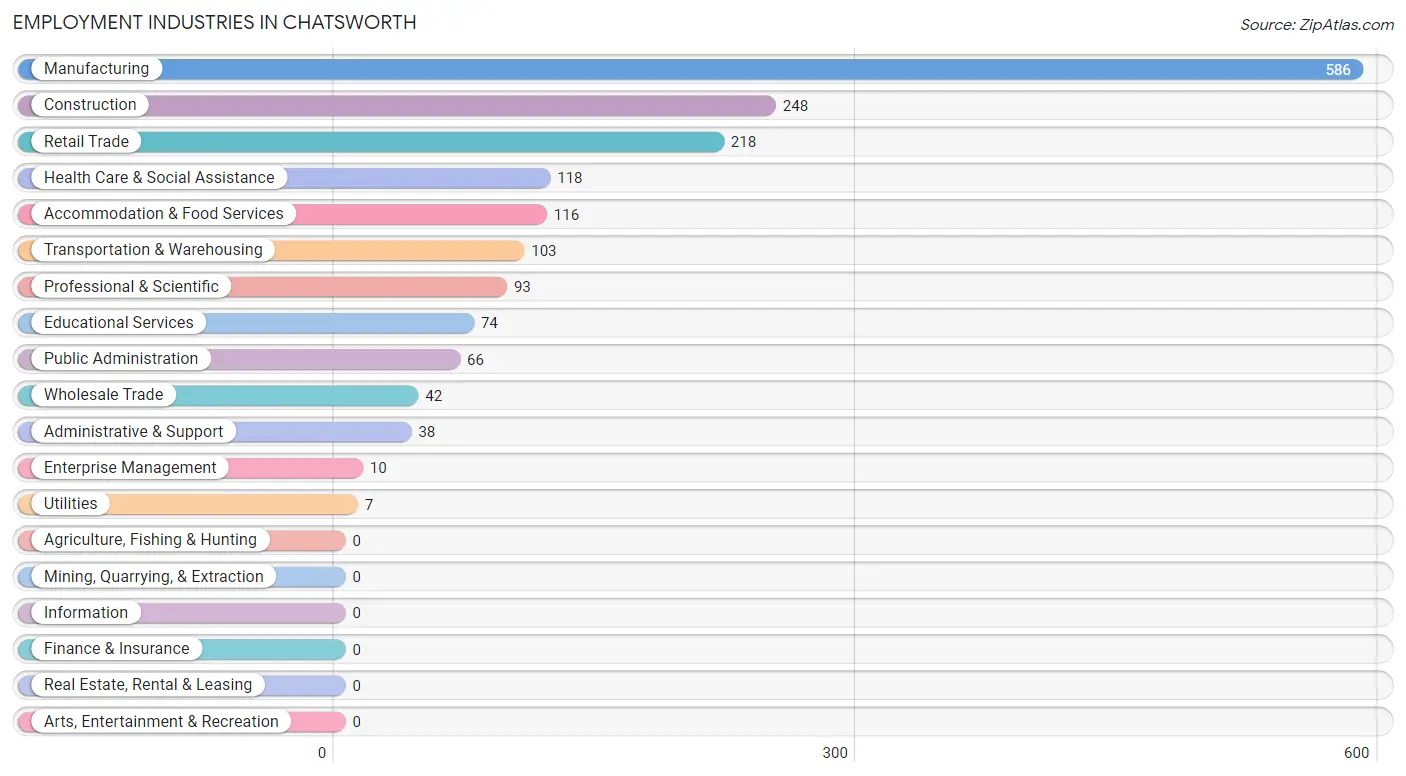
Employment Industries in Chatsworth
The major employment industries in Chatsworth include Manufacturing (586 | 31.9%), Construction (248 | 13.5%), Retail Trade (218 | 11.9%), Health Care & Social Assistance (118 | 6.4%), and Accommodation & Food Services (116 | 6.3%).
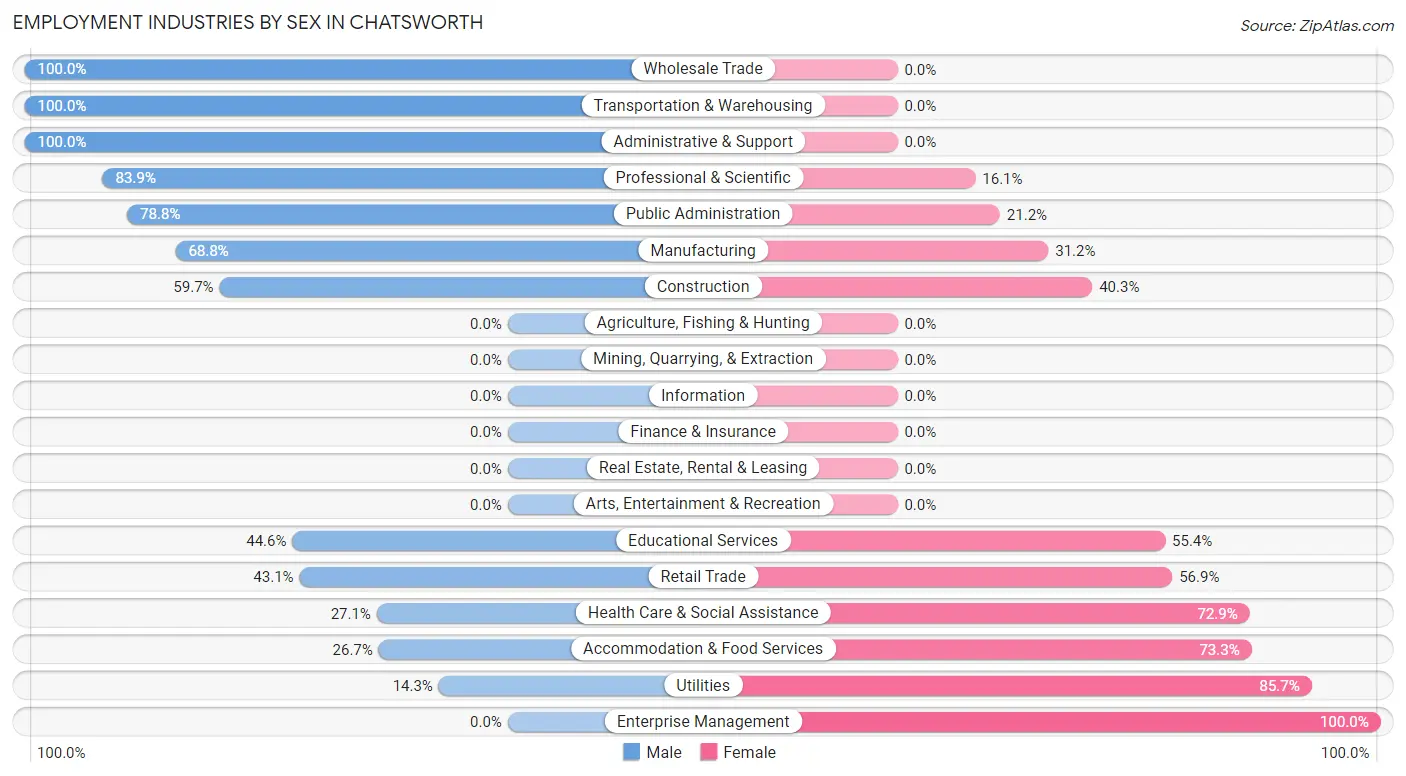
Employment Industries by Sex in Chatsworth
The Chatsworth industries that see more men than women are Wholesale Trade (100.0%), Transportation & Warehousing (100.0%), and Administrative & Support (100.0%), whereas the industries that tend to have a higher number of women are Enterprise Management (100.0%), Utilities (85.7%), and Accommodation & Food Services (73.3%).
| Industry | Male | Female |
| Agriculture, Fishing & Hunting | 0 (0.0%) | 0 (0.0%) |
| Mining, Quarrying, & Extraction | 0 (0.0%) | 0 (0.0%) |
| Construction | 148 (59.7%) | 100 (40.3%) |
| Manufacturing | 403 (68.8%) | 183 (31.2%) |
| Wholesale Trade | 42 (100.0%) | 0 (0.0%) |
| Retail Trade | 94 (43.1%) | 124 (56.9%) |
| Transportation & Warehousing | 103 (100.0%) | 0 (0.0%) |
| Utilities | 1 (14.3%) | 6 (85.7%) |
| Information | 0 (0.0%) | 0 (0.0%) |
| Finance & Insurance | 0 (0.0%) | 0 (0.0%) |
| Real Estate, Rental & Leasing | 0 (0.0%) | 0 (0.0%) |
| Professional & Scientific | 78 (83.9%) | 15 (16.1%) |
| Enterprise Management | 0 (0.0%) | 10 (100.0%) |
| Administrative & Support | 38 (100.0%) | 0 (0.0%) |
| Educational Services | 33 (44.6%) | 41 (55.4%) |
| Health Care & Social Assistance | 32 (27.1%) | 86 (72.9%) |
| Arts, Entertainment & Recreation | 0 (0.0%) | 0 (0.0%) |
| Accommodation & Food Services | 31 (26.7%) | 85 (73.3%) |
| Public Administration | 52 (78.8%) | 14 (21.2%) |
| Total | 1,161 (63.2%) | 676 (36.8%) |
Education in Chatsworth
School Enrollment in Chatsworth
The most common levels of schooling among the 1,676 students in Chatsworth are middle school (372 | 22.2%), elementary school (361 | 21.5%), and kindergarten (309 | 18.4%).
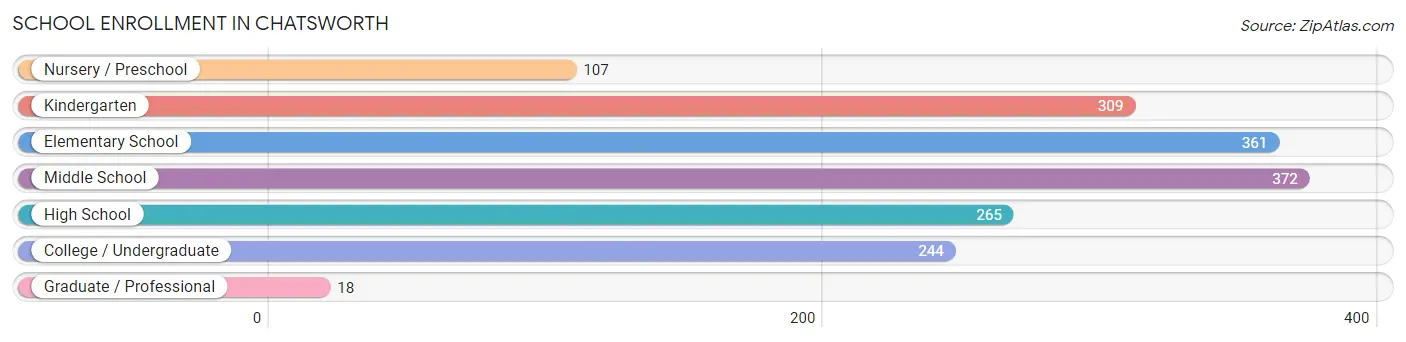
| School Level | # Students | % Students |
| Nursery / Preschool | 107 | 6.4% |
| Kindergarten | 309 | 18.4% |
| Elementary School | 361 | 21.5% |
| Middle School | 372 | 22.2% |
| High School | 265 | 15.8% |
| College / Undergraduate | 244 | 14.6% |
| Graduate / Professional | 18 | 1.1% |
| Total | 1,676 | 100.0% |
School Enrollment by Age by Funding Source in Chatsworth
Out of a total of 1,676 students who are enrolled in schools in Chatsworth, 208 (12.4%) attend a private institution, while the remaining 1,468 (87.6%) are enrolled in public schools. The age group of 25 to 34 year olds has the highest likelihood of being enrolled in private schools, with 185 (91.1% in the age bracket) enrolled. Conversely, the age group of 3 to 4 year olds has the lowest likelihood of being enrolled in a private school, with 94 (100.0% in the age bracket) attending a public institution.
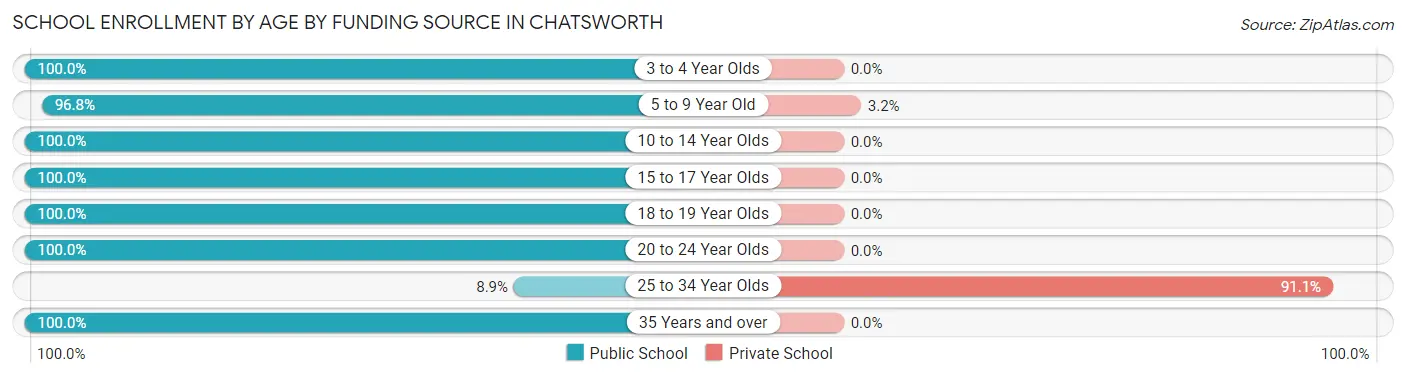
| Age Bracket | Public School | Private School |
| 3 to 4 Year Olds | 94 (100.0%) | 0 (0.0%) |
| 5 to 9 Year Old | 695 (96.8%) | 23 (3.2%) |
| 10 to 14 Year Olds | 337 (100.0%) | 0 (0.0%) |
| 15 to 17 Year Olds | 207 (100.0%) | 0 (0.0%) |
| 18 to 19 Year Olds | 69 (100.0%) | 0 (0.0%) |
| 20 to 24 Year Olds | 38 (100.0%) | 0 (0.0%) |
| 25 to 34 Year Olds | 18 (8.9%) | 185 (91.1%) |
| 35 Years and over | 10 (100.0%) | 0 (0.0%) |
| Total | 1,468 (87.6%) | 208 (12.4%) |
Educational Attainment by Field of Study in Chatsworth
Business (176 | 32.4%), education (107 | 19.7%), science & technology (91 | 16.7%), social sciences (71 | 13.1%), and arts & humanities (34 | 6.2%) are the most common fields of study among 544 individuals in Chatsworth who have obtained a bachelor's degree or higher.
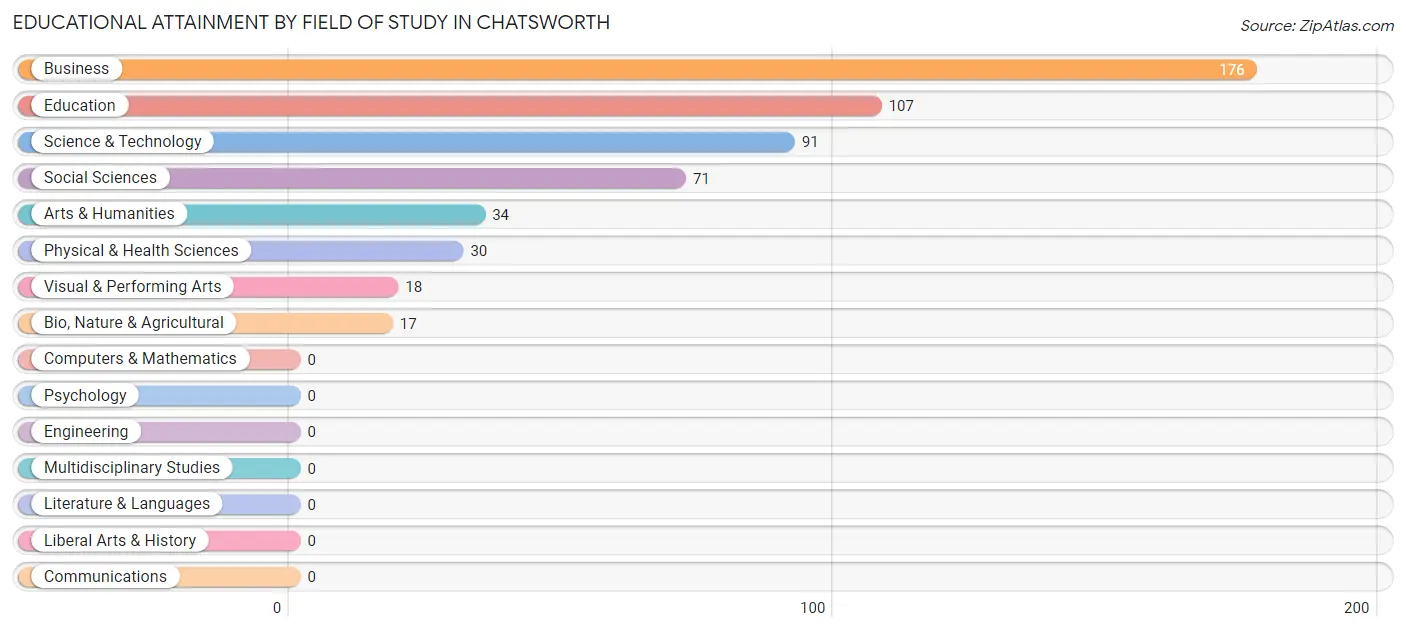
| Field of Study | # Graduates | % Graduates |
| Computers & Mathematics | 0 | 0.0% |
| Bio, Nature & Agricultural | 17 | 3.1% |
| Physical & Health Sciences | 30 | 5.5% |
| Psychology | 0 | 0.0% |
| Social Sciences | 71 | 13.1% |
| Engineering | 0 | 0.0% |
| Multidisciplinary Studies | 0 | 0.0% |
| Science & Technology | 91 | 16.7% |
| Business | 176 | 32.4% |
| Education | 107 | 19.7% |
| Literature & Languages | 0 | 0.0% |
| Liberal Arts & History | 0 | 0.0% |
| Visual & Performing Arts | 18 | 3.3% |
| Communications | 0 | 0.0% |
| Arts & Humanities | 34 | 6.2% |
| Total | 544 | 100.0% |
Transportation & Commute in Chatsworth
Vehicle Availability by Sex in Chatsworth
The most prevalent vehicle ownership categories in Chatsworth are males with 2 vehicles (629, accounting for 54.2%) and females with 2 vehicles (390, making up 94.4%).
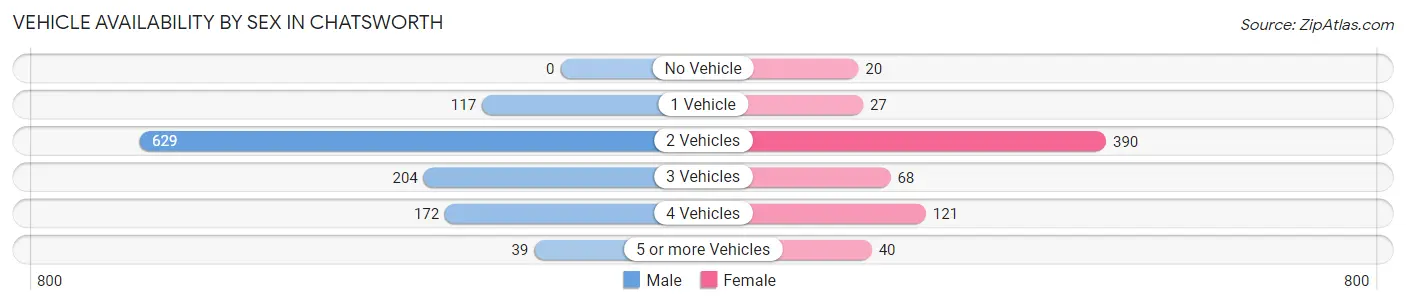
| Vehicles Available | Male | Female |
| No Vehicle | 0 (0.0%) | 20 (3.0%) |
| 1 Vehicle | 117 (10.1%) | 27 (4.1%) |
| 2 Vehicles | 629 (54.2%) | 390 (58.6%) |
| 3 Vehicles | 204 (17.6%) | 68 (10.2%) |
| 4 Vehicles | 172 (14.8%) | 121 (18.2%) |
| 5 or more Vehicles | 39 (3.4%) | 40 (6.0%) |
| Total | 1,161 (100.0%) | 666 (100.0%) |
Commute Time in Chatsworth
The most frequently occuring commute durations in Chatsworth are 30 to 34 minutes (444 commuters, 25.4%), 15 to 19 minutes (306 commuters, 17.5%), and 5 to 9 minutes (179 commuters, 10.2%).
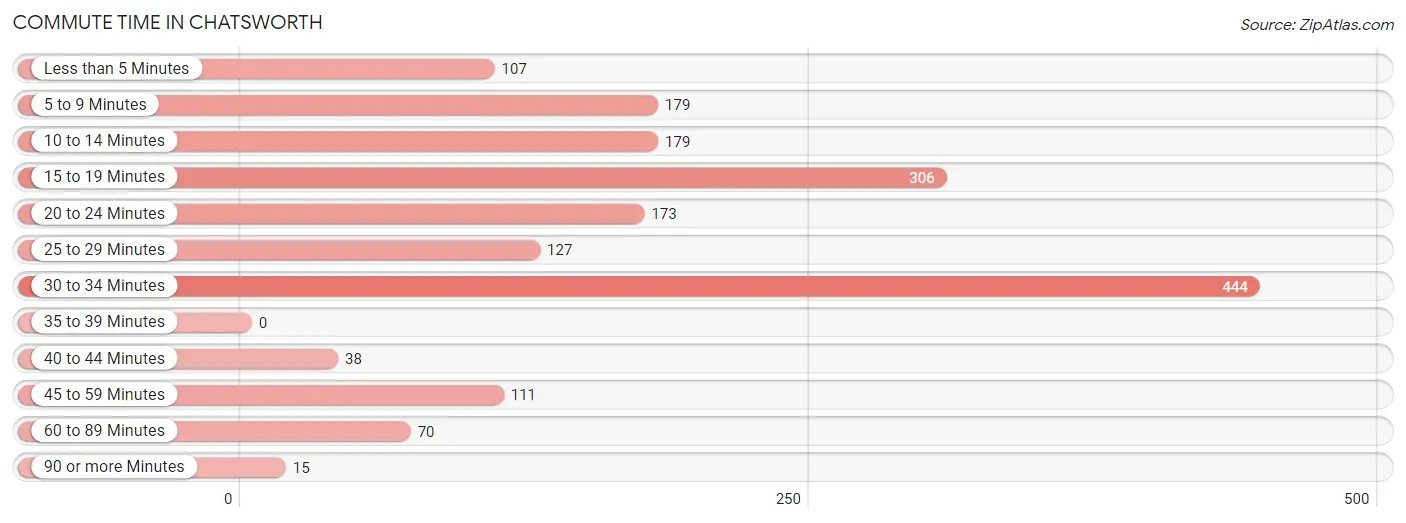
| Commute Time | # Commuters | % Commuters |
| Less than 5 Minutes | 107 | 6.1% |
| 5 to 9 Minutes | 179 | 10.2% |
| 10 to 14 Minutes | 179 | 10.2% |
| 15 to 19 Minutes | 306 | 17.5% |
| 20 to 24 Minutes | 173 | 9.9% |
| 25 to 29 Minutes | 127 | 7.3% |
| 30 to 34 Minutes | 444 | 25.4% |
| 35 to 39 Minutes | 0 | 0.0% |
| 40 to 44 Minutes | 38 | 2.2% |
| 45 to 59 Minutes | 111 | 6.4% |
| 60 to 89 Minutes | 70 | 4.0% |
| 90 or more Minutes | 15 | 0.9% |
Commute Time by Sex in Chatsworth
The most common commute times in Chatsworth are 30 to 34 minutes (307 commuters, 27.6%) for males and 30 to 34 minutes (137 commuters, 21.5%) for females.
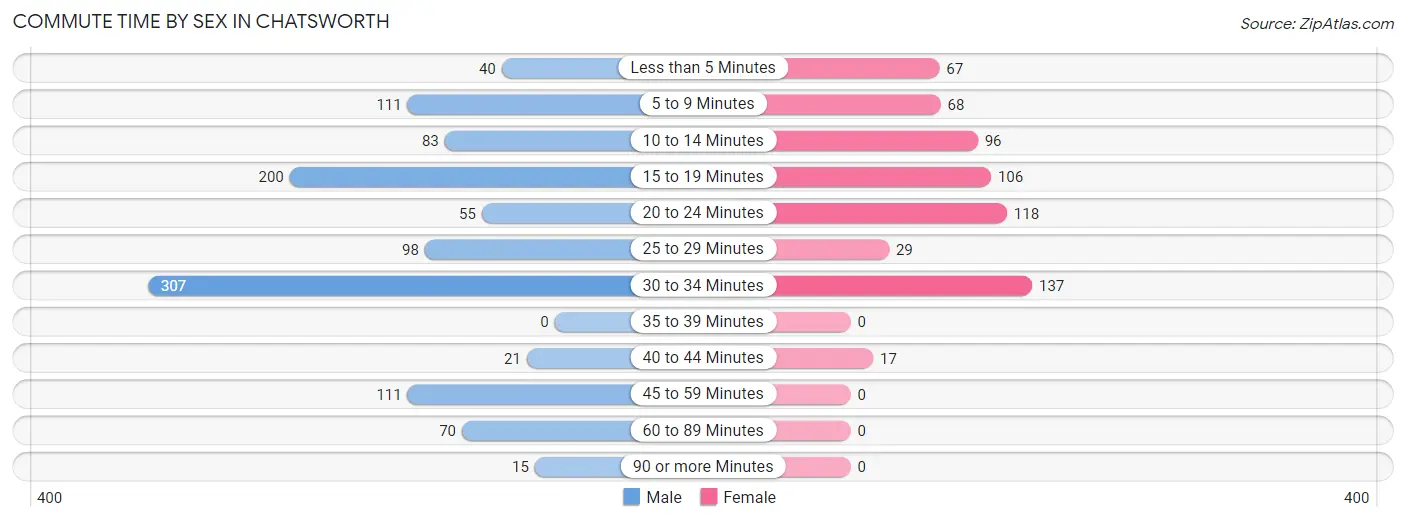
| Commute Time | Male | Female |
| Less than 5 Minutes | 40 (3.6%) | 67 (10.5%) |
| 5 to 9 Minutes | 111 (10.0%) | 68 (10.7%) |
| 10 to 14 Minutes | 83 (7.5%) | 96 (15.0%) |
| 15 to 19 Minutes | 200 (18.0%) | 106 (16.6%) |
| 20 to 24 Minutes | 55 (5.0%) | 118 (18.5%) |
| 25 to 29 Minutes | 98 (8.8%) | 29 (4.5%) |
| 30 to 34 Minutes | 307 (27.6%) | 137 (21.5%) |
| 35 to 39 Minutes | 0 (0.0%) | 0 (0.0%) |
| 40 to 44 Minutes | 21 (1.9%) | 17 (2.7%) |
| 45 to 59 Minutes | 111 (10.0%) | 0 (0.0%) |
| 60 to 89 Minutes | 70 (6.3%) | 0 (0.0%) |
| 90 or more Minutes | 15 (1.3%) | 0 (0.0%) |
Time of Departure to Work by Sex in Chatsworth
The most frequent times of departure to work in Chatsworth are 7:00 AM to 7:29 AM (196, 17.6%) for males and 4:00 PM to 11:59 PM (190, 29.8%) for females.
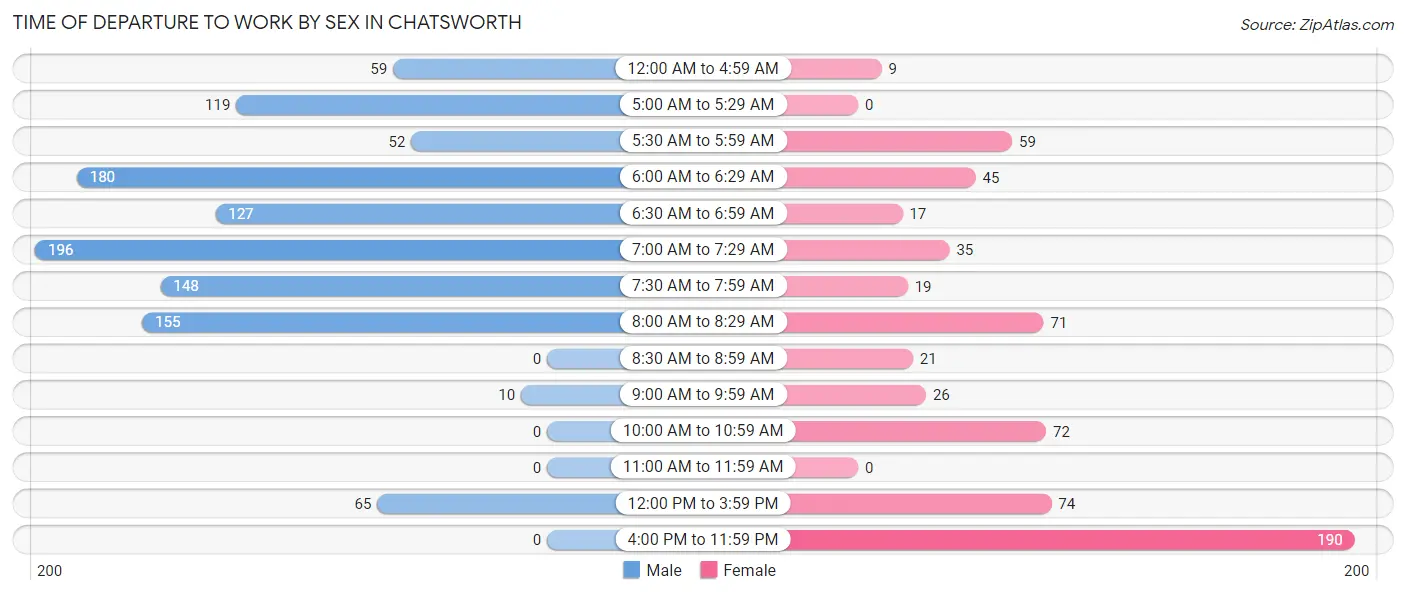
| Time of Departure | Male | Female |
| 12:00 AM to 4:59 AM | 59 (5.3%) | 9 (1.4%) |
| 5:00 AM to 5:29 AM | 119 (10.7%) | 0 (0.0%) |
| 5:30 AM to 5:59 AM | 52 (4.7%) | 59 (9.2%) |
| 6:00 AM to 6:29 AM | 180 (16.2%) | 45 (7.0%) |
| 6:30 AM to 6:59 AM | 127 (11.4%) | 17 (2.7%) |
| 7:00 AM to 7:29 AM | 196 (17.6%) | 35 (5.5%) |
| 7:30 AM to 7:59 AM | 148 (13.3%) | 19 (3.0%) |
| 8:00 AM to 8:29 AM | 155 (14.0%) | 71 (11.1%) |
| 8:30 AM to 8:59 AM | 0 (0.0%) | 21 (3.3%) |
| 9:00 AM to 9:59 AM | 10 (0.9%) | 26 (4.1%) |
| 10:00 AM to 10:59 AM | 0 (0.0%) | 72 (11.3%) |
| 11:00 AM to 11:59 AM | 0 (0.0%) | 0 (0.0%) |
| 12:00 PM to 3:59 PM | 65 (5.9%) | 74 (11.6%) |
| 4:00 PM to 11:59 PM | 0 (0.0%) | 190 (29.8%) |
| Total | 1,111 (100.0%) | 638 (100.0%) |
Housing Occupancy in Chatsworth
Occupancy by Ownership in Chatsworth
Of the total 1,442 dwellings in Chatsworth, owner-occupied units account for 726 (50.3%), while renter-occupied units make up 716 (49.6%).
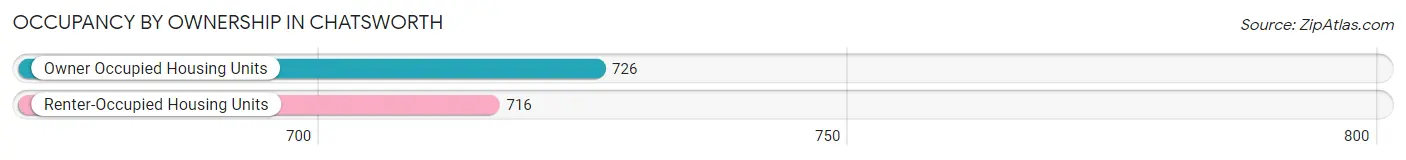
| Occupancy | # Housing Units | % Housing Units |
| Owner Occupied Housing Units | 726 | 50.3% |
| Renter-Occupied Housing Units | 716 | 49.6% |
| Total Occupied Housing Units | 1,442 | 100.0% |
Occupancy by Household Size in Chatsworth
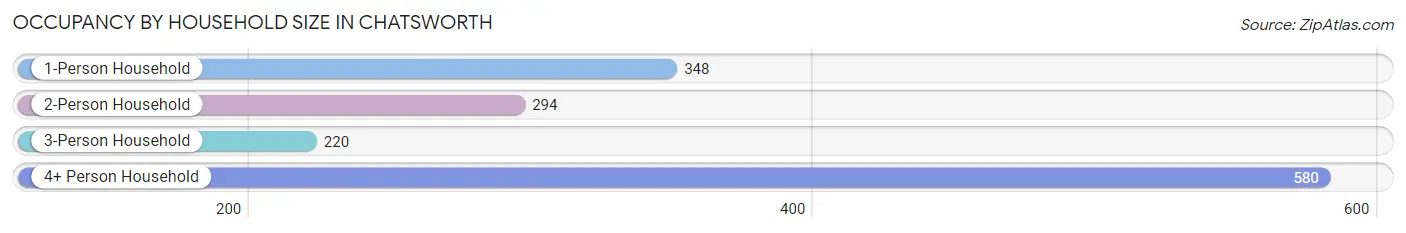
| Household Size | # Housing Units | % Housing Units |
| 1-Person Household | 348 | 24.1% |
| 2-Person Household | 294 | 20.4% |
| 3-Person Household | 220 | 15.3% |
| 4+ Person Household | 580 | 40.2% |
| Total Housing Units | 1,442 | 100.0% |
Occupancy by Ownership by Household Size in Chatsworth
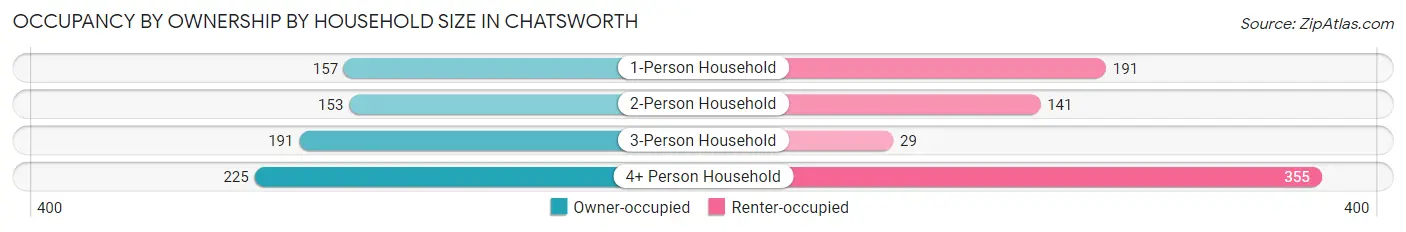
| Household Size | Owner-occupied | Renter-occupied |
| 1-Person Household | 157 (45.1%) | 191 (54.9%) |
| 2-Person Household | 153 (52.0%) | 141 (48.0%) |
| 3-Person Household | 191 (86.8%) | 29 (13.2%) |
| 4+ Person Household | 225 (38.8%) | 355 (61.2%) |
| Total Housing Units | 726 (50.3%) | 716 (49.6%) |
Occupancy by Educational Attainment in Chatsworth
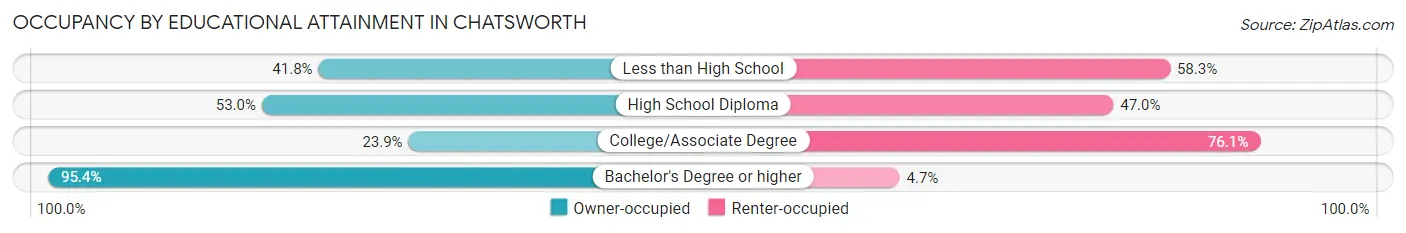
| Household Size | Owner-occupied | Renter-occupied |
| Less than High School | 172 (41.7%) | 240 (58.3%) |
| High School Diploma | 169 (53.0%) | 150 (47.0%) |
| College/Associate Degree | 98 (23.9%) | 312 (76.1%) |
| Bachelor's Degree or higher | 287 (95.4%) | 14 (4.6%) |
Occupancy by Age of Householder in Chatsworth
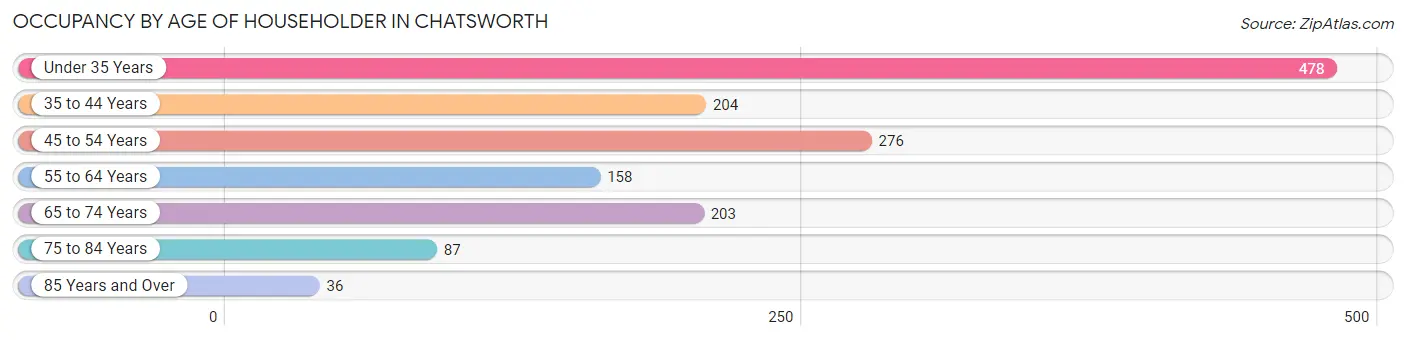
| Age Bracket | # Households | % Households |
| Under 35 Years | 478 | 33.2% |
| 35 to 44 Years | 204 | 14.1% |
| 45 to 54 Years | 276 | 19.1% |
| 55 to 64 Years | 158 | 11.0% |
| 65 to 74 Years | 203 | 14.1% |
| 75 to 84 Years | 87 | 6.0% |
| 85 Years and Over | 36 | 2.5% |
| Total | 1,442 | 100.0% |
Housing Finances in Chatsworth
Median Income by Occupancy in Chatsworth
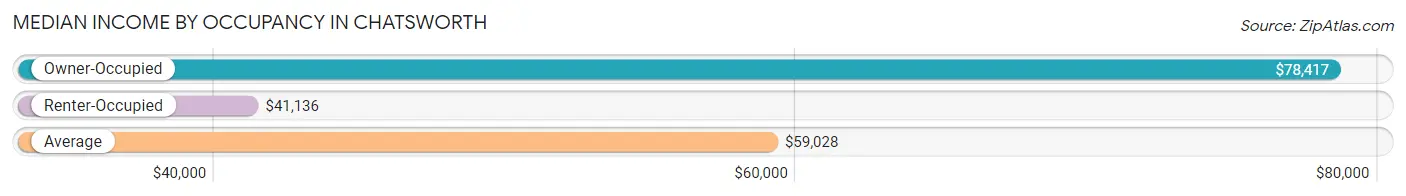
| Occupancy Type | # Households | Median Income |
| Owner-Occupied | 726 (50.3%) | $78,417 |
| Renter-Occupied | 716 (49.6%) | $41,136 |
| Average | 1,442 (100.0%) | $59,028 |
Occupancy by Householder Income Bracket in Chatsworth
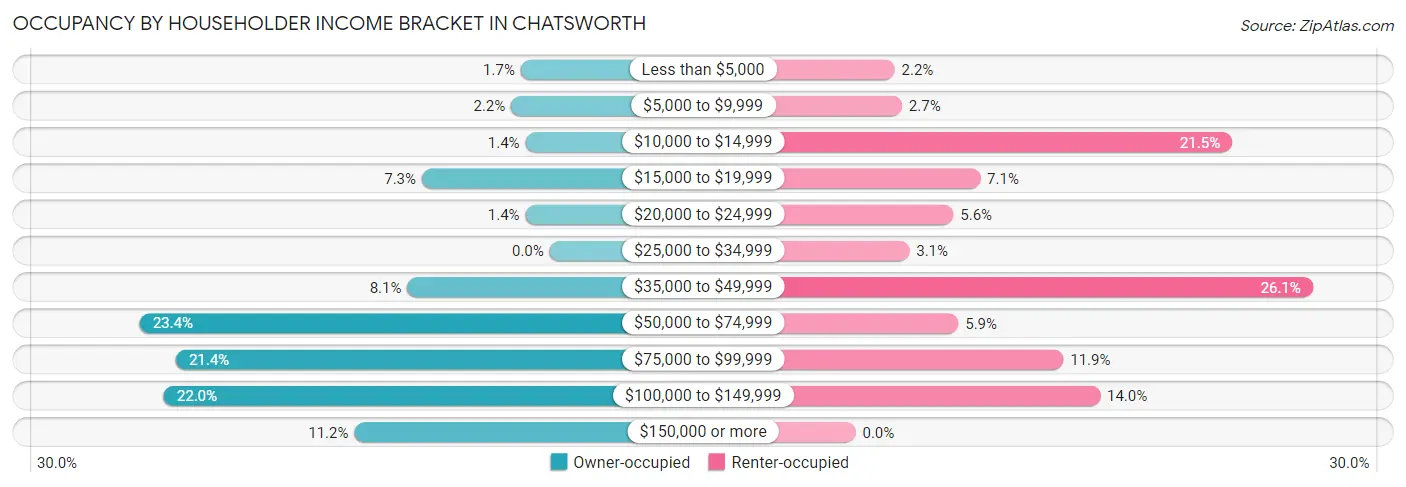
| Income Bracket | Owner-occupied | Renter-occupied |
| Less than $5,000 | 12 (1.7%) | 16 (2.2%) |
| $5,000 to $9,999 | 16 (2.2%) | 19 (2.6%) |
| $10,000 to $14,999 | 10 (1.4%) | 154 (21.5%) |
| $15,000 to $19,999 | 53 (7.3%) | 51 (7.1%) |
| $20,000 to $24,999 | 10 (1.4%) | 40 (5.6%) |
| $25,000 to $34,999 | 0 (0.0%) | 22 (3.1%) |
| $35,000 to $49,999 | 59 (8.1%) | 187 (26.1%) |
| $50,000 to $74,999 | 170 (23.4%) | 42 (5.9%) |
| $75,000 to $99,999 | 155 (21.3%) | 85 (11.9%) |
| $100,000 to $149,999 | 160 (22.0%) | 100 (14.0%) |
| $150,000 or more | 81 (11.2%) | 0 (0.0%) |
| Total | 726 (100.0%) | 716 (100.0%) |
Monthly Housing Cost Tiers in Chatsworth
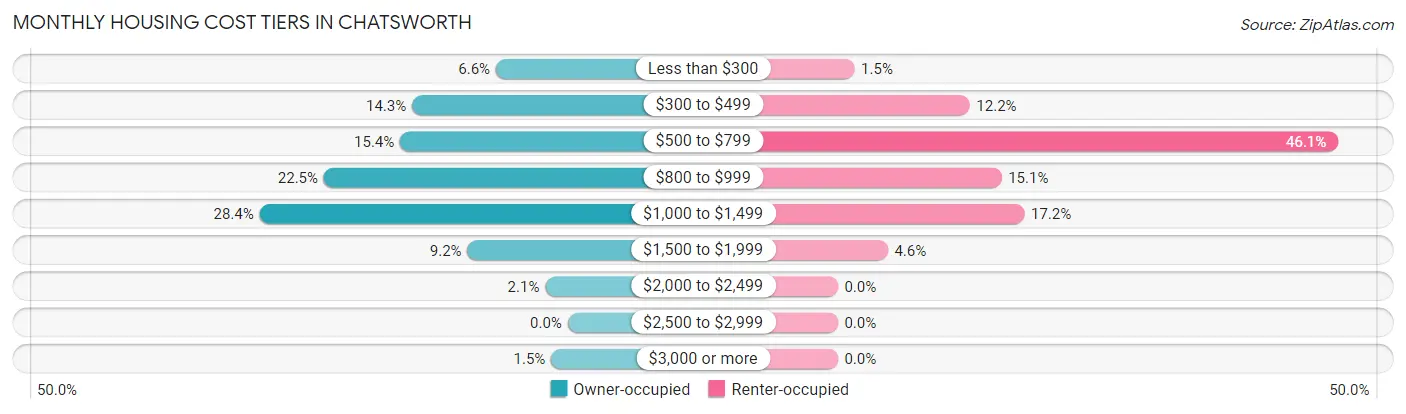
| Monthly Cost | Owner-occupied | Renter-occupied |
| Less than $300 | 48 (6.6%) | 11 (1.5%) |
| $300 to $499 | 104 (14.3%) | 87 (12.1%) |
| $500 to $799 | 112 (15.4%) | 330 (46.1%) |
| $800 to $999 | 163 (22.5%) | 108 (15.1%) |
| $1,000 to $1,499 | 206 (28.4%) | 123 (17.2%) |
| $1,500 to $1,999 | 67 (9.2%) | 33 (4.6%) |
| $2,000 to $2,499 | 15 (2.1%) | 0 (0.0%) |
| $2,500 to $2,999 | 0 (0.0%) | 0 (0.0%) |
| $3,000 or more | 11 (1.5%) | 0 (0.0%) |
| Total | 726 (100.0%) | 716 (100.0%) |
Physical Housing Characteristics in Chatsworth
Housing Structures in Chatsworth
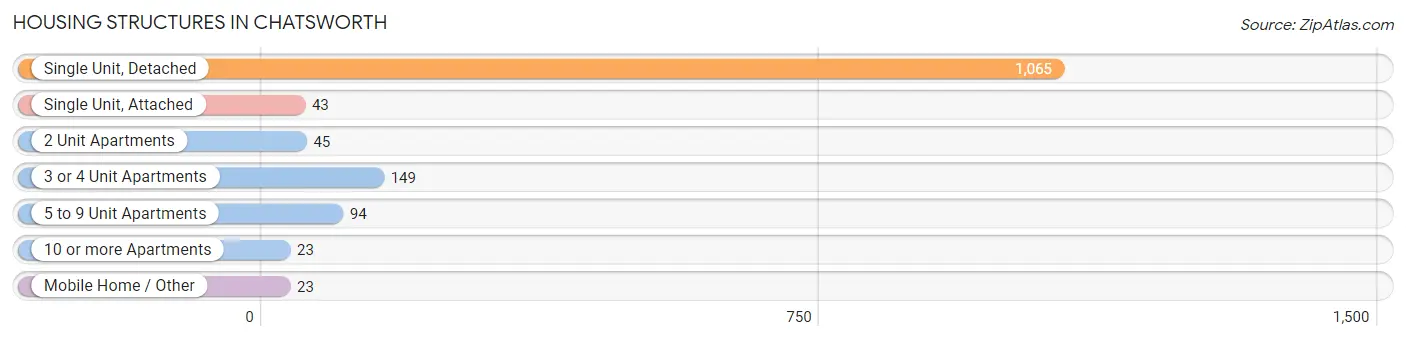
| Structure Type | # Housing Units | % Housing Units |
| Single Unit, Detached | 1,065 | 73.9% |
| Single Unit, Attached | 43 | 3.0% |
| 2 Unit Apartments | 45 | 3.1% |
| 3 or 4 Unit Apartments | 149 | 10.3% |
| 5 to 9 Unit Apartments | 94 | 6.5% |
| 10 or more Apartments | 23 | 1.6% |
| Mobile Home / Other | 23 | 1.6% |
| Total | 1,442 | 100.0% |
Housing Structures by Occupancy in Chatsworth
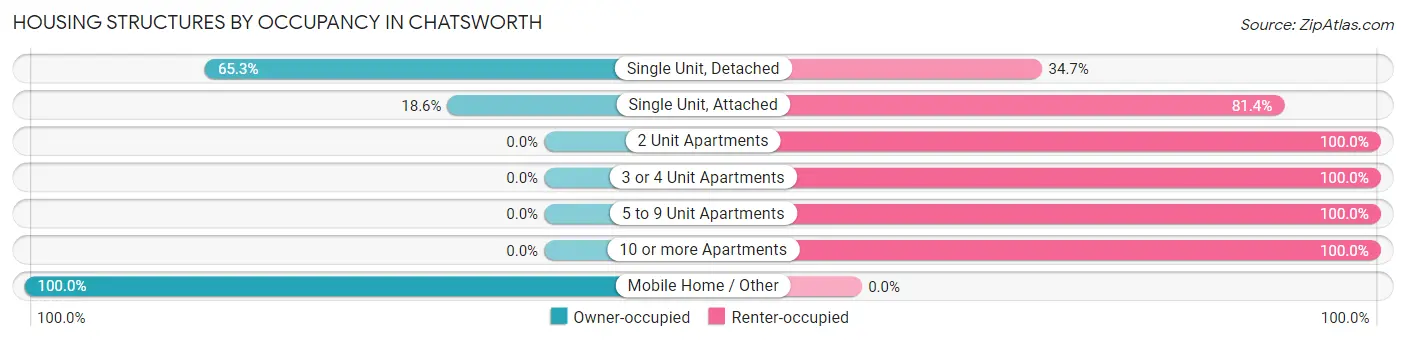
| Structure Type | Owner-occupied | Renter-occupied |
| Single Unit, Detached | 695 (65.3%) | 370 (34.7%) |
| Single Unit, Attached | 8 (18.6%) | 35 (81.4%) |
| 2 Unit Apartments | 0 (0.0%) | 45 (100.0%) |
| 3 or 4 Unit Apartments | 0 (0.0%) | 149 (100.0%) |
| 5 to 9 Unit Apartments | 0 (0.0%) | 94 (100.0%) |
| 10 or more Apartments | 0 (0.0%) | 23 (100.0%) |
| Mobile Home / Other | 23 (100.0%) | 0 (0.0%) |
| Total | 726 (50.3%) | 716 (49.6%) |
Housing Structures by Number of Rooms in Chatsworth
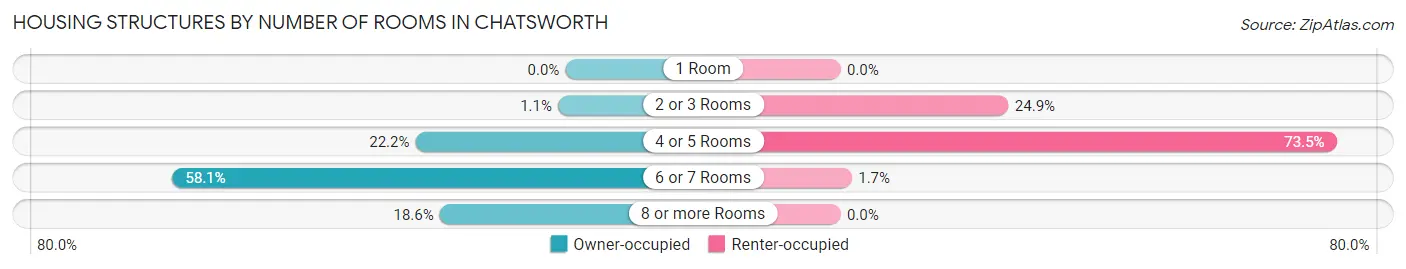
| Number of Rooms | Owner-occupied | Renter-occupied |
| 1 Room | 0 (0.0%) | 0 (0.0%) |
| 2 or 3 Rooms | 8 (1.1%) | 178 (24.9%) |
| 4 or 5 Rooms | 161 (22.2%) | 526 (73.5%) |
| 6 or 7 Rooms | 422 (58.1%) | 12 (1.7%) |
| 8 or more Rooms | 135 (18.6%) | 0 (0.0%) |
| Total | 726 (100.0%) | 716 (100.0%) |
Housing Structure by Heating Type in Chatsworth
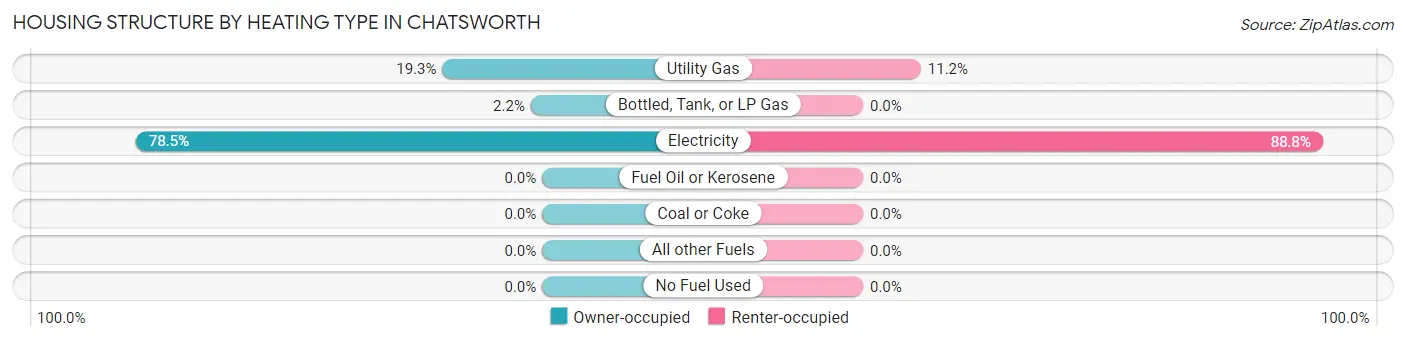
| Heating Type | Owner-occupied | Renter-occupied |
| Utility Gas | 140 (19.3%) | 80 (11.2%) |
| Bottled, Tank, or LP Gas | 16 (2.2%) | 0 (0.0%) |
| Electricity | 570 (78.5%) | 636 (88.8%) |
| Fuel Oil or Kerosene | 0 (0.0%) | 0 (0.0%) |
| Coal or Coke | 0 (0.0%) | 0 (0.0%) |
| All other Fuels | 0 (0.0%) | 0 (0.0%) |
| No Fuel Used | 0 (0.0%) | 0 (0.0%) |
| Total | 726 (100.0%) | 716 (100.0%) |
Household Vehicle Usage in Chatsworth
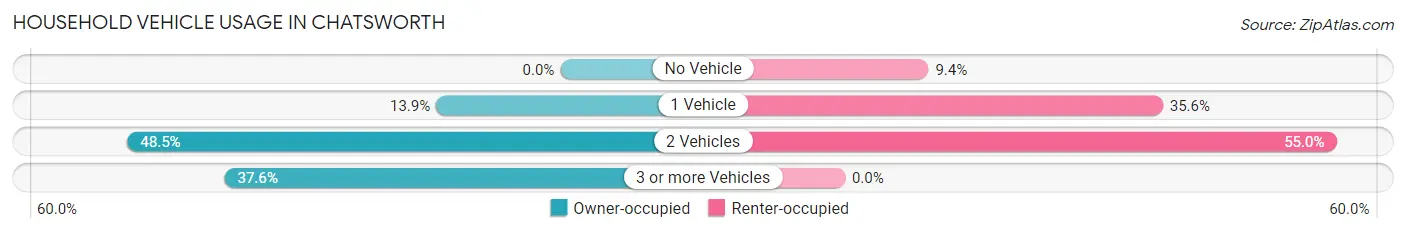
| Vehicles per Household | Owner-occupied | Renter-occupied |
| No Vehicle | 0 (0.0%) | 67 (9.4%) |
| 1 Vehicle | 101 (13.9%) | 255 (35.6%) |
| 2 Vehicles | 352 (48.5%) | 394 (55.0%) |
| 3 or more Vehicles | 273 (37.6%) | 0 (0.0%) |
| Total | 726 (100.0%) | 716 (100.0%) |
Real Estate & Mortgages in Chatsworth
Real Estate and Mortgage Overview in Chatsworth
| Characteristic | Without Mortgage | With Mortgage |
| Housing Units | 320 | 406 |
| Median Property Value | $172,600 | $170,400 |
| Median Household Income | $78,278 | $71 |
| Monthly Housing Costs | $543 | $11 |
| Real Estate Taxes | $1,448 | $13 |
Property Value by Mortgage Status in Chatsworth
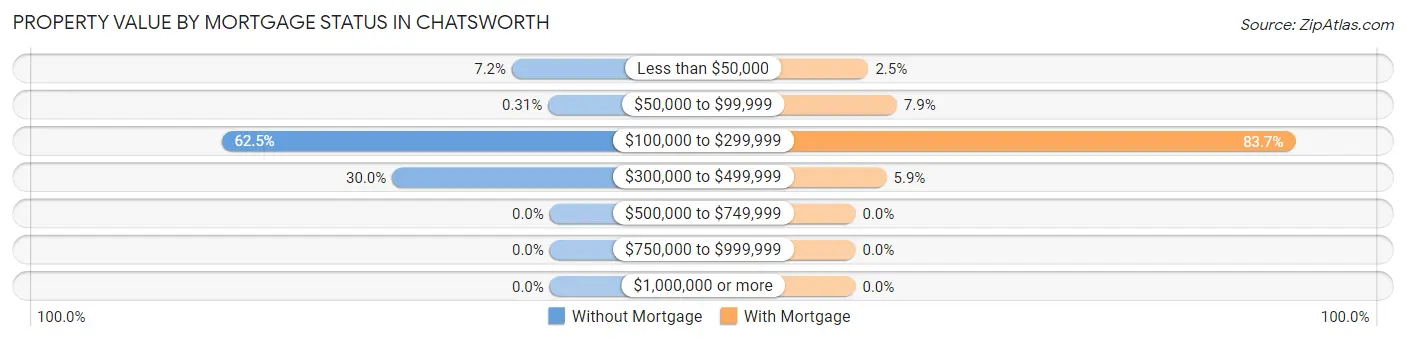
| Property Value | Without Mortgage | With Mortgage |
| Less than $50,000 | 23 (7.2%) | 10 (2.5%) |
| $50,000 to $99,999 | 1 (0.3%) | 32 (7.9%) |
| $100,000 to $299,999 | 200 (62.5%) | 340 (83.7%) |
| $300,000 to $499,999 | 96 (30.0%) | 24 (5.9%) |
| $500,000 to $749,999 | 0 (0.0%) | 0 (0.0%) |
| $750,000 to $999,999 | 0 (0.0%) | 0 (0.0%) |
| $1,000,000 or more | 0 (0.0%) | 0 (0.0%) |
| Total | 320 (100.0%) | 406 (100.0%) |
Household Income by Mortgage Status in Chatsworth
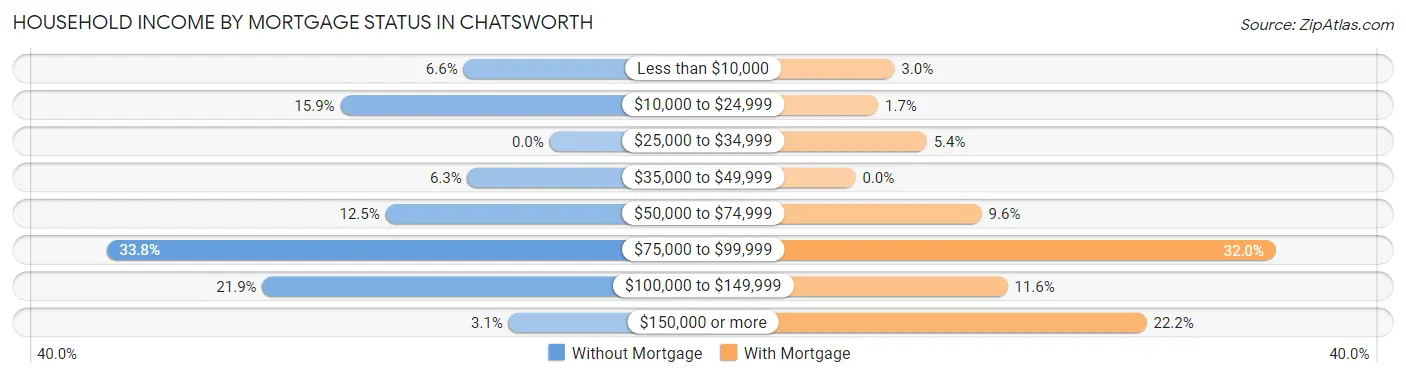
| Household Income | Without Mortgage | With Mortgage |
| Less than $10,000 | 21 (6.6%) | 12 (3.0%) |
| $10,000 to $24,999 | 51 (15.9%) | 7 (1.7%) |
| $25,000 to $34,999 | 0 (0.0%) | 22 (5.4%) |
| $35,000 to $49,999 | 20 (6.2%) | 0 (0.0%) |
| $50,000 to $74,999 | 40 (12.5%) | 39 (9.6%) |
| $75,000 to $99,999 | 108 (33.8%) | 130 (32.0%) |
| $100,000 to $149,999 | 70 (21.9%) | 47 (11.6%) |
| $150,000 or more | 10 (3.1%) | 90 (22.2%) |
| Total | 320 (100.0%) | 406 (100.0%) |
Property Value to Household Income Ratio in Chatsworth
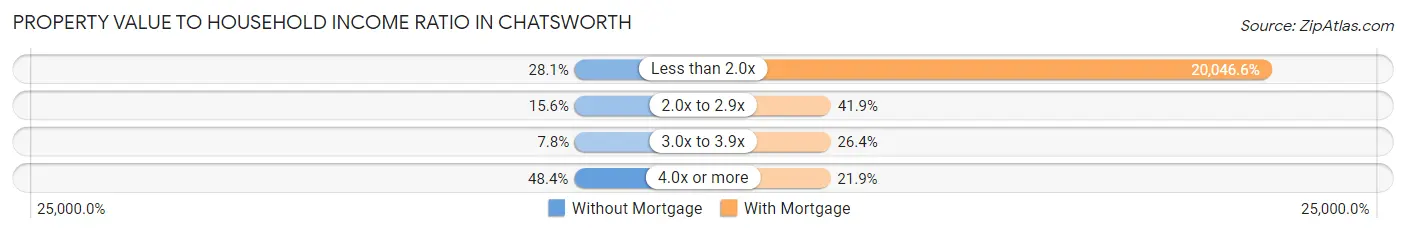
| Value-to-Income Ratio | Without Mortgage | With Mortgage |
| Less than 2.0x | 90 (28.1%) | 81,389 (20,046.5%) |
| 2.0x to 2.9x | 50 (15.6%) | 170 (41.9%) |
| 3.0x to 3.9x | 25 (7.8%) | 107 (26.4%) |
| 4.0x or more | 155 (48.4%) | 89 (21.9%) |
| Total | 320 (100.0%) | 406 (100.0%) |
Real Estate Taxes by Mortgage Status in Chatsworth
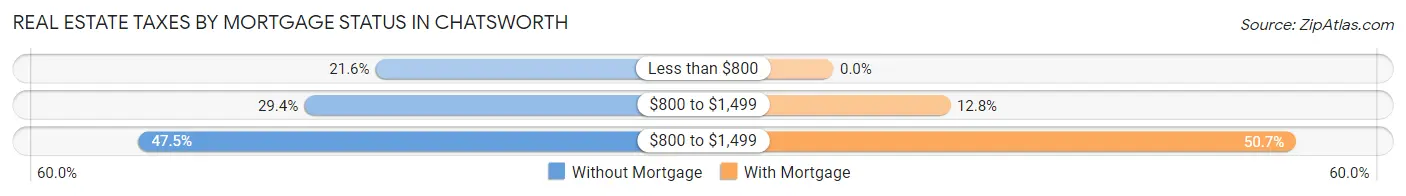
| Property Taxes | Without Mortgage | With Mortgage |
| Less than $800 | 69 (21.6%) | 0 (0.0%) |
| $800 to $1,499 | 94 (29.4%) | 52 (12.8%) |
| $800 to $1,499 | 152 (47.5%) | 206 (50.7%) |
| Total | 320 (100.0%) | 406 (100.0%) |
Health & Disability in Chatsworth
Health Insurance Coverage by Age in Chatsworth
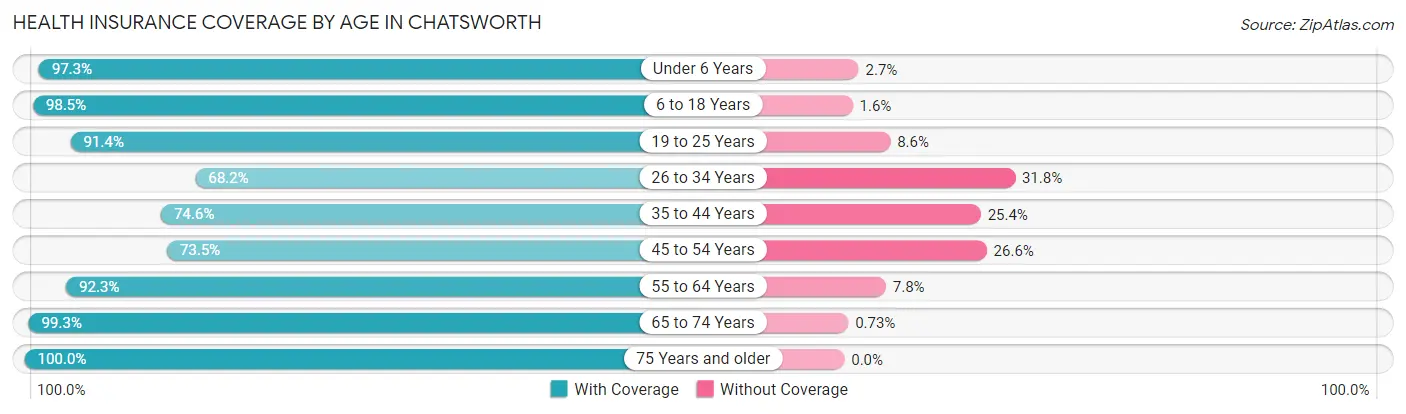
| Age Bracket | With Coverage | Without Coverage |
| Under 6 Years | 659 (97.3%) | 18 (2.7%) |
| 6 to 18 Years | 1,018 (98.5%) | 16 (1.5%) |
| 19 to 25 Years | 235 (91.4%) | 22 (8.6%) |
| 26 to 34 Years | 621 (68.2%) | 290 (31.8%) |
| 35 to 44 Years | 428 (74.6%) | 146 (25.4%) |
| 45 to 54 Years | 332 (73.5%) | 120 (26.6%) |
| 55 to 64 Years | 250 (92.2%) | 21 (7.7%) |
| 65 to 74 Years | 272 (99.3%) | 2 (0.7%) |
| 75 Years and older | 124 (100.0%) | 0 (0.0%) |
| Total | 3,939 (86.1%) | 635 (13.9%) |
Health Insurance Coverage by Citizenship Status in Chatsworth
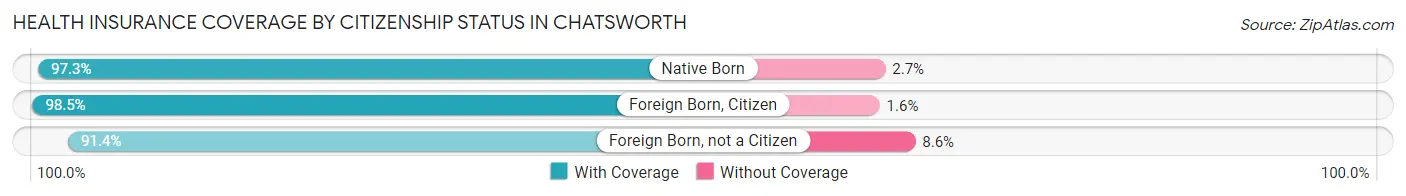
| Citizenship Status | With Coverage | Without Coverage |
| Native Born | 659 (97.3%) | 18 (2.7%) |
| Foreign Born, Citizen | 1,018 (98.5%) | 16 (1.5%) |
| Foreign Born, not a Citizen | 235 (91.4%) | 22 (8.6%) |
Health Insurance Coverage by Household Income in Chatsworth

| Household Income | With Coverage | Without Coverage |
| Under $25,000 | 641 (84.2%) | 120 (15.8%) |
| $25,000 to $49,999 | 1,065 (78.2%) | 296 (21.7%) |
| $50,000 to $74,999 | 524 (90.5%) | 55 (9.5%) |
| $75,000 to $99,999 | 478 (78.2%) | 133 (21.8%) |
| $100,000 and over | 1,228 (97.5%) | 31 (2.5%) |
Public vs Private Health Insurance Coverage by Age in Chatsworth
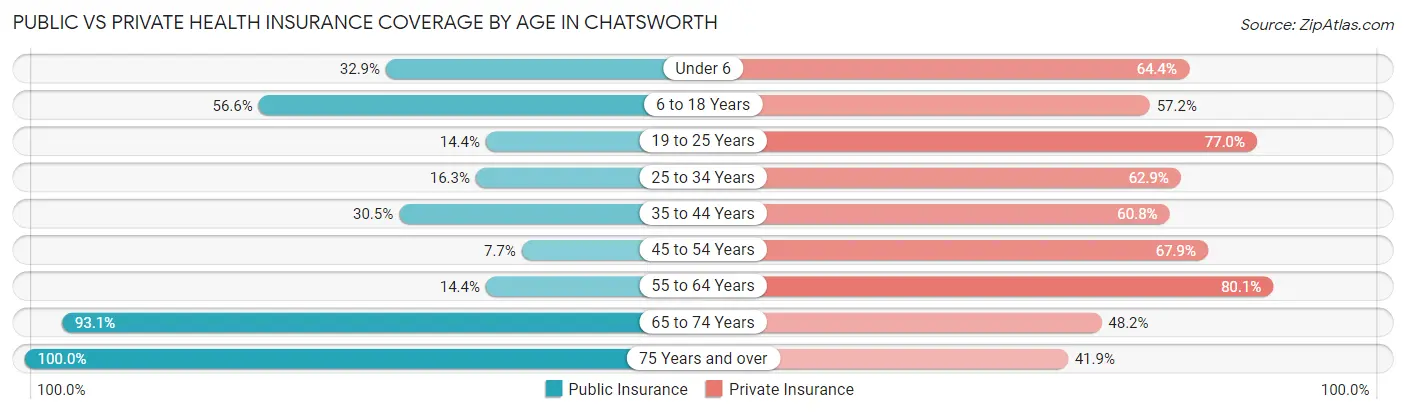
| Age Bracket | Public Insurance | Private Insurance |
| Under 6 | 223 (32.9%) | 436 (64.4%) |
| 6 to 18 Years | 585 (56.6%) | 591 (57.2%) |
| 19 to 25 Years | 37 (14.4%) | 198 (77.0%) |
| 25 to 34 Years | 148 (16.3%) | 573 (62.9%) |
| 35 to 44 Years | 175 (30.5%) | 349 (60.8%) |
| 45 to 54 Years | 35 (7.7%) | 307 (67.9%) |
| 55 to 64 Years | 39 (14.4%) | 217 (80.1%) |
| 65 to 74 Years | 255 (93.1%) | 132 (48.2%) |
| 75 Years and over | 124 (100.0%) | 52 (41.9%) |
| Total | 1,621 (35.4%) | 2,855 (62.4%) |
Disability Status by Sex by Age in Chatsworth
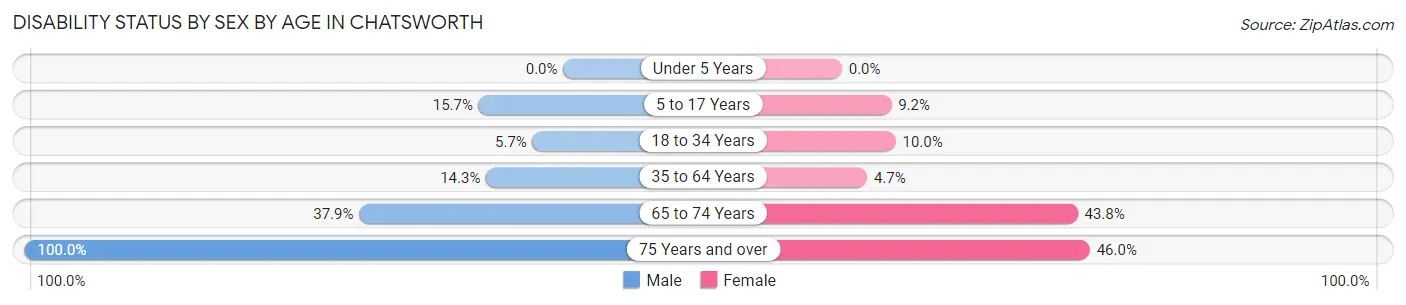
| Age Bracket | Male | Female |
| Under 5 Years | 0 (0.0%) | 0 (0.0%) |
| 5 to 17 Years | 96 (15.7%) | 61 (9.2%) |
| 18 to 34 Years | 31 (5.7%) | 71 (10.0%) |
| 35 to 64 Years | 103 (14.3%) | 27 (4.7%) |
| 65 to 74 Years | 25 (37.9%) | 91 (43.8%) |
| 75 Years and over | 11 (100.0%) | 52 (46.0%) |
Disability Class by Sex by Age in Chatsworth
Disability Class: Hearing Difficulty
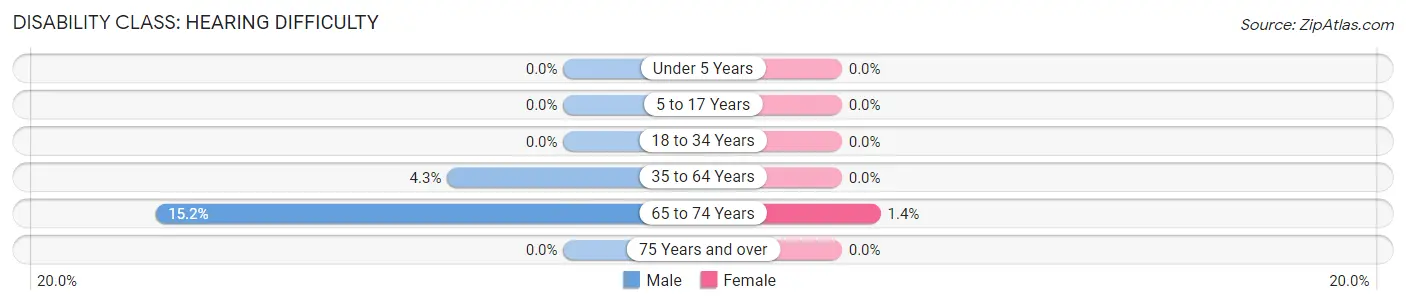
| Age Bracket | Male | Female |
| Under 5 Years | 0 (0.0%) | 0 (0.0%) |
| 5 to 17 Years | 0 (0.0%) | 0 (0.0%) |
| 18 to 34 Years | 0 (0.0%) | 0 (0.0%) |
| 35 to 64 Years | 31 (4.3%) | 0 (0.0%) |
| 65 to 74 Years | 10 (15.1%) | 3 (1.4%) |
| 75 Years and over | 0 (0.0%) | 0 (0.0%) |
Disability Class: Vision Difficulty
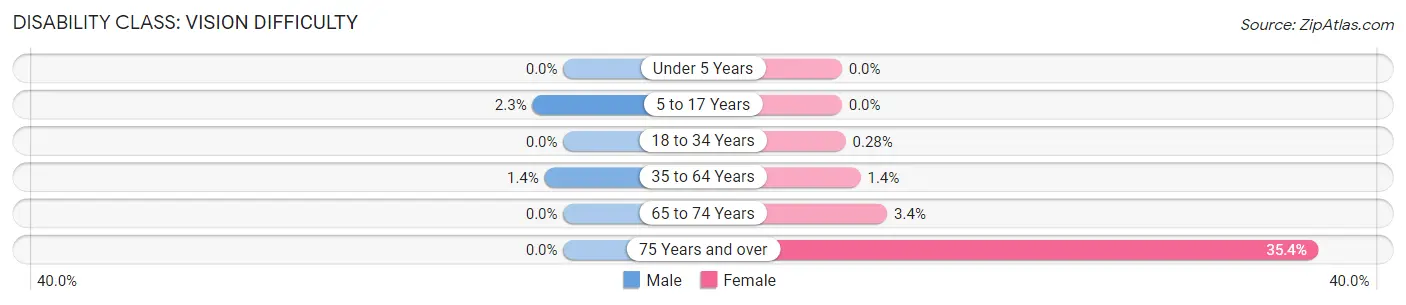
| Age Bracket | Male | Female |
| Under 5 Years | 0 (0.0%) | 0 (0.0%) |
| 5 to 17 Years | 14 (2.3%) | 0 (0.0%) |
| 18 to 34 Years | 0 (0.0%) | 2 (0.3%) |
| 35 to 64 Years | 10 (1.4%) | 8 (1.4%) |
| 65 to 74 Years | 0 (0.0%) | 7 (3.4%) |
| 75 Years and over | 0 (0.0%) | 40 (35.4%) |
Disability Class: Cognitive Difficulty
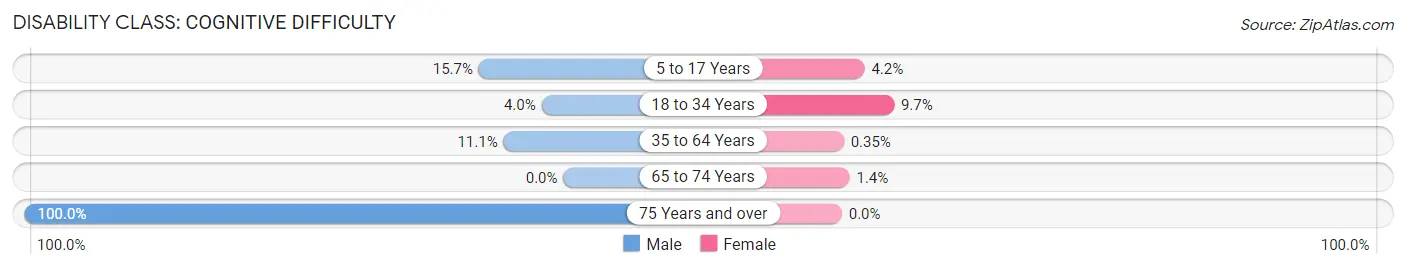
| Age Bracket | Male | Female |
| 5 to 17 Years | 96 (15.7%) | 28 (4.2%) |
| 18 to 34 Years | 22 (4.0%) | 69 (9.7%) |
| 35 to 64 Years | 80 (11.1%) | 2 (0.4%) |
| 65 to 74 Years | 0 (0.0%) | 3 (1.4%) |
| 75 Years and over | 11 (100.0%) | 0 (0.0%) |
Disability Class: Ambulatory Difficulty
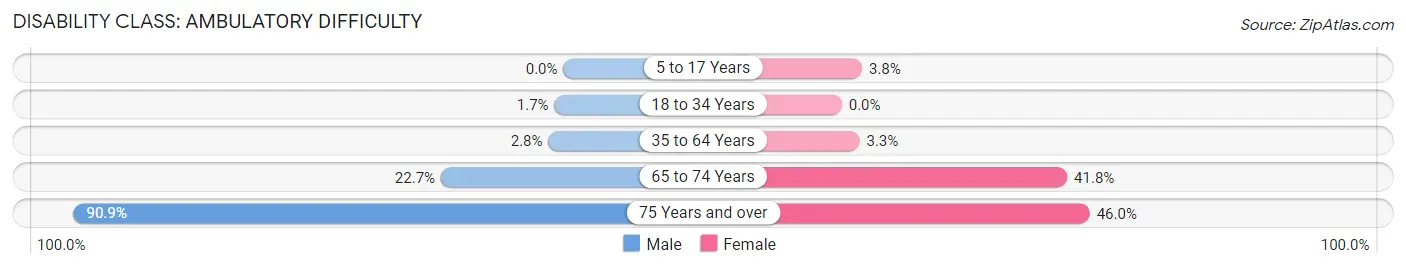
| Age Bracket | Male | Female |
| 5 to 17 Years | 0 (0.0%) | 25 (3.8%) |
| 18 to 34 Years | 9 (1.7%) | 0 (0.0%) |
| 35 to 64 Years | 20 (2.8%) | 19 (3.3%) |
| 65 to 74 Years | 15 (22.7%) | 87 (41.8%) |
| 75 Years and over | 10 (90.9%) | 52 (46.0%) |
Disability Class: Self-Care Difficulty
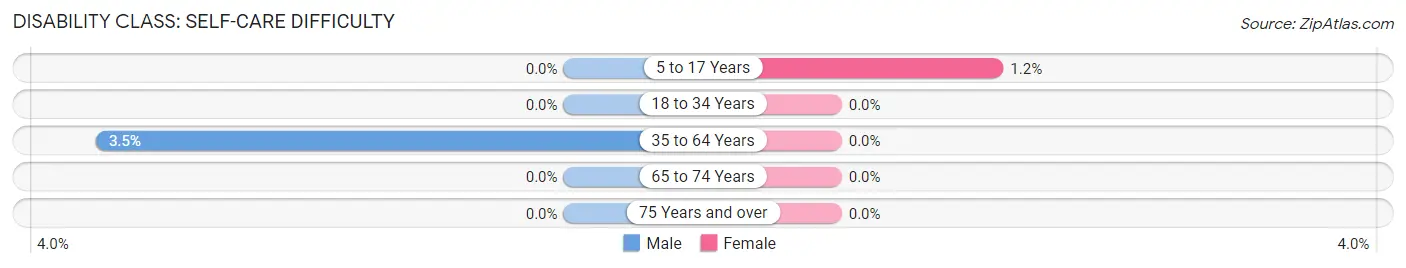
| Age Bracket | Male | Female |
| 5 to 17 Years | 0 (0.0%) | 8 (1.2%) |
| 18 to 34 Years | 0 (0.0%) | 0 (0.0%) |
| 35 to 64 Years | 25 (3.5%) | 0 (0.0%) |
| 65 to 74 Years | 0 (0.0%) | 0 (0.0%) |
| 75 Years and over | 0 (0.0%) | 0 (0.0%) |
Technology Access in Chatsworth
Computing Device Access in Chatsworth
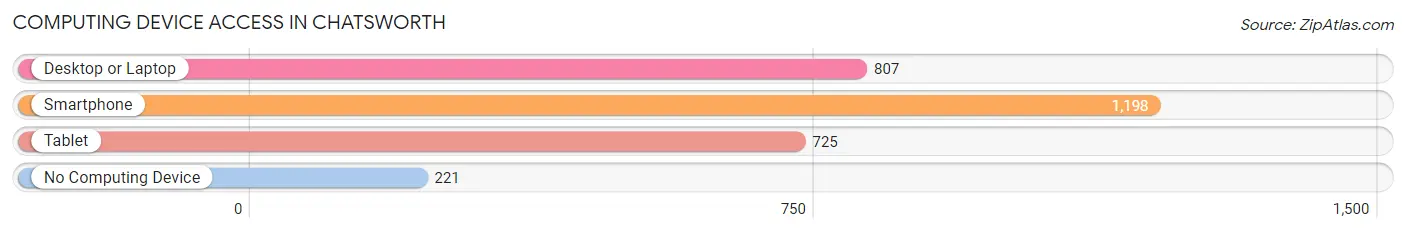
| Device Type | # Households | % Households |
| Desktop or Laptop | 807 | 56.0% |
| Smartphone | 1,198 | 83.1% |
| Tablet | 725 | 50.3% |
| No Computing Device | 221 | 15.3% |
| Total | 1,442 | 100.0% |
Internet Access in Chatsworth
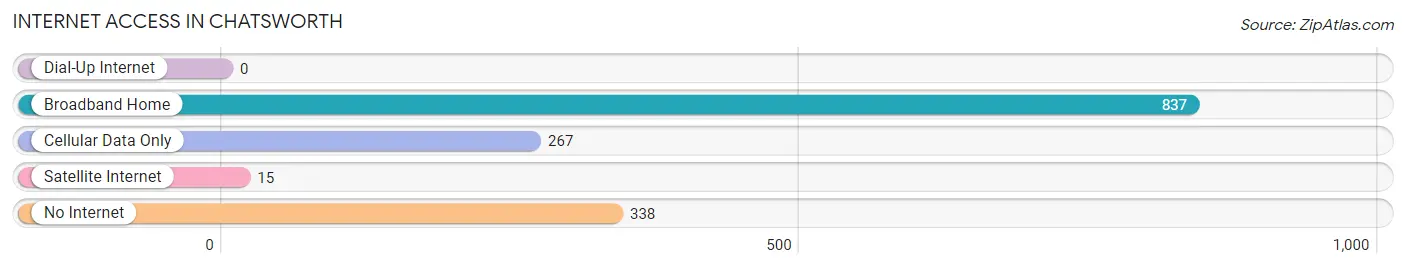
| Internet Type | # Households | % Households |
| Dial-Up Internet | 0 | 0.0% |
| Broadband Home | 837 | 58.0% |
| Cellular Data Only | 267 | 18.5% |
| Satellite Internet | 15 | 1.0% |
| No Internet | 338 | 23.4% |
| Total | 1,442 | 100.0% |
Chatsworth Summary
Chatsworth is a city located in the northwestern corner of the state of Georgia, United States. It is the county seat of Murray County and is part of the Dalton Metropolitan Statistical Area. The city is located in the foothills of the Appalachian Mountains and is known for its scenic beauty and outdoor recreation opportunities.
History
The area that is now Chatsworth was first settled in the early 1800s by Cherokee Indians. The town was originally known as "The Narrows" due to its location at the narrowest point of the Conasauga River. In 1838, the town was renamed Chatsworth after the Earl of Chatsworth in England.
In 1851, the Georgia General Assembly established Murray County and Chatsworth was chosen as the county seat. The town was incorporated in 1872 and the first courthouse was built in 1873.
In the late 1800s, the town began to grow and prosper due to the railroad and the timber industry. The town was also known for its mineral springs, which were believed to have healing properties.
In the early 1900s, the town began to decline due to the depletion of the timber industry and the Great Depression. The town was revitalized in the 1950s with the construction of the Chickamauga Dam and the creation of Lake Chickamauga.
Geography
Chatsworth is located in the northwestern corner of the state of Georgia, in the foothills of the Appalachian Mountains. The city is situated at the narrowest point of the Conasauga River, which is the border between Murray and Whitfield counties.
The city has a total area of 8.3 square miles, of which 8.2 square miles is land and 0.1 square miles is water. The city is located at an elevation of 845 feet above sea level.
Economy
The economy of Chatsworth is largely based on tourism and outdoor recreation. The city is home to several state parks, including Fort Mountain State Park, Red Clay State Park, and Cloudland Canyon State Park. The city is also home to the Chickamauga Dam, which provides hydroelectric power to the region.
The city is also home to several manufacturing companies, including Shaw Industries, which produces carpets and rugs, and Mohawk Industries, which produces flooring products.
Demographics
As of the 2010 census, the city of Chatsworth had a population of 3,853. The racial makeup of the city was 87.3% White, 8.2% African American, 0.3% Native American, 0.7% Asian, 0.1% Pacific Islander, 1.3% from other races, and 2.3% from two or more races. Hispanic or Latino of any race were 3.3% of the population.
The median household income in Chatsworth was $31,944, and the median family income was $41,250. The per capita income for the city was $17,845. About 17.2% of families and 20.3% of the population were below the poverty line, including 28.2% of those under age 18 and 14.2% of those age 65 or over.
Common Questions
What is Per Capita Income in Chatsworth?
Per Capita income in Chatsworth is $19,944.
What is the Median Family Income in Chatsworth?
Median Family Income in Chatsworth is $77,862.
What is the Median Household income in Chatsworth?
Median Household Income in Chatsworth is $59,028.
What is Income or Wage Gap in Chatsworth?
Income or Wage Gap in Chatsworth is 33.7%.
Women in Chatsworth earn 66.3 cents for every dollar earned by a man.
What is Family Income Deficit in Chatsworth?
Family Income Deficit in Chatsworth is $15,454.
Families that are below poverty line in Chatsworth earn $15,454 less on average than the poverty threshold level.
What is Inequality or Gini Index in Chatsworth?
Inequality or Gini Index in Chatsworth is 0.40.
What is the Total Population of Chatsworth?
Total Population of Chatsworth is 4,840.
What is the Total Male Population of Chatsworth?
Total Male Population of Chatsworth is 2,268.
What is the Total Female Population of Chatsworth?
Total Female Population of Chatsworth is 2,572.
What is the Ratio of Males per 100 Females in Chatsworth?
There are 88.18 Males per 100 Females in Chatsworth.
What is the Ratio of Females per 100 Males in Chatsworth?
There are 113.40 Females per 100 Males in Chatsworth.
What is the Median Population Age in Chatsworth?
Median Population Age in Chatsworth is 28.9 Years.
What is the Average Family Size in Chatsworth
Average Family Size in Chatsworth is 3.8 People.
What is the Average Household Size in Chatsworth
Average Household Size in Chatsworth is 3.2 People.
How Large is the Labor Force in Chatsworth?
There are 2,023 People in the Labor Forcein in Chatsworth.
What is the Percentage of People in the Labor Force in Chatsworth?
59.2% of People are in the Labor Force in Chatsworth.
What is the Unemployment Rate in Chatsworth?
Unemployment Rate in Chatsworth is 9.1%.