Zip Codes with the Highest Percentage of Hispanic or Latino Population in Macon, GA
RELATED REPORTS & OPTIONS
Hispanic or Latino
Macon
Compare Zip Codes
Map of Zip Codes with the Highest Percentage of Hispanic or Latino Population in Macon
1.4%
7.5%
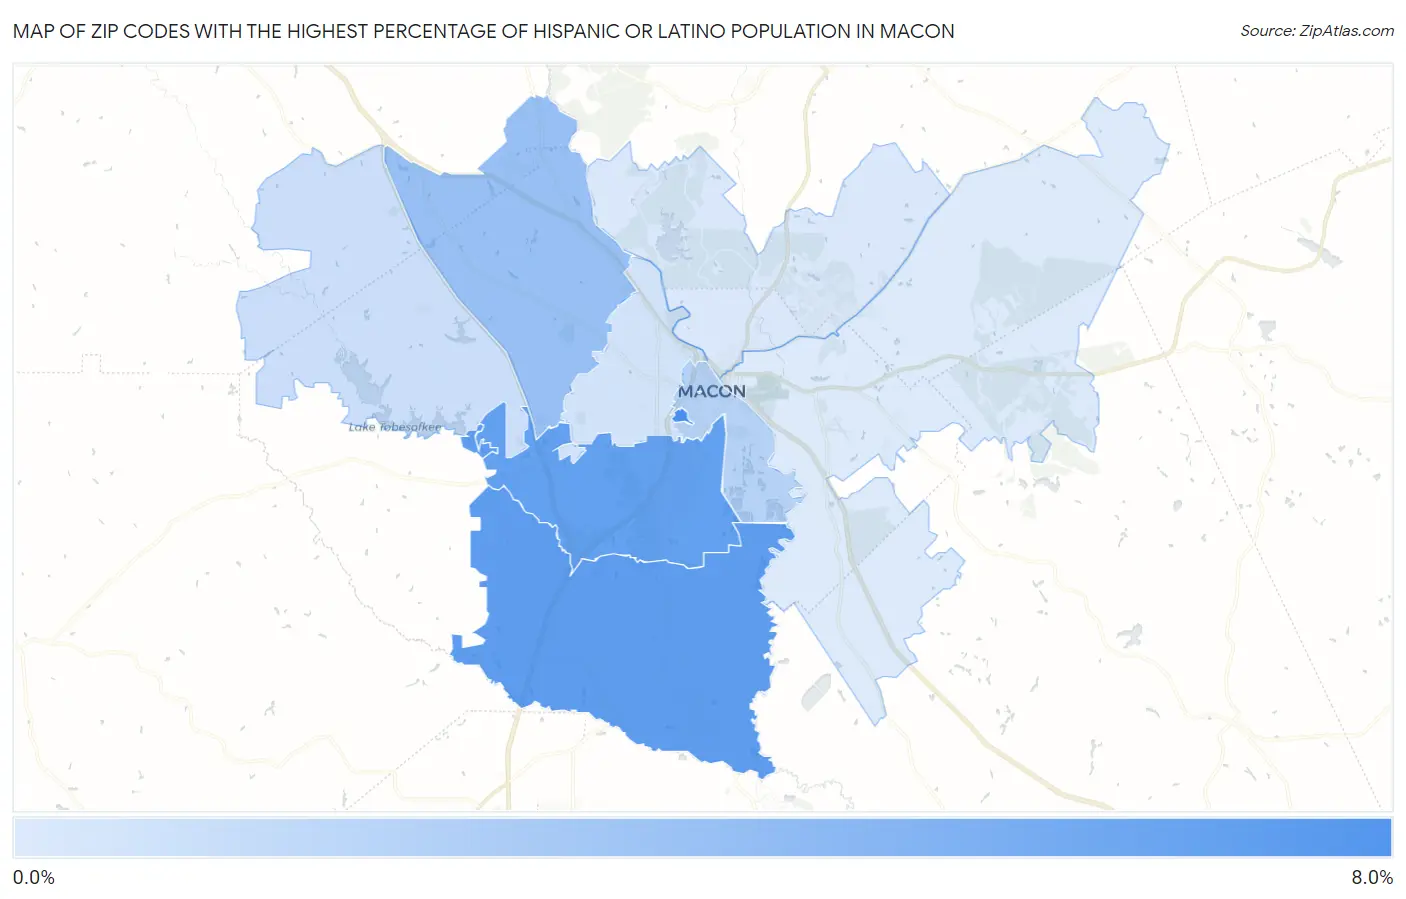
Zip Codes with the Highest Percentage of Hispanic or Latino Population in Macon, GA
| Zip Code | Hispanic or Latino | vs State | vs National | |
| 1. | 31207 | 7.5% | 10.1% (-2.58)#246 | 18.7% (-11.2)#11,078 |
| 2. | 31216 | 6.5% | 10.1% (-3.53)#289 | 18.7% (-12.1)#12,147 |
| 3. | 31206 | 6.4% | 10.1% (-3.69)#297 | 18.7% (-12.3)#12,330 |
| 4. | 31210 | 4.2% | 10.1% (-5.87)#408 | 18.7% (-14.5)#15,756 |
| 5. | 31201 | 3.0% | 10.1% (-7.07)#484 | 18.7% (-15.7)#18,404 |
| 6. | 31220 | 2.2% | 10.1% (-7.90)#533 | 18.7% (-16.5)#20,586 |
| 7. | 31204 | 1.9% | 10.1% (-8.17)#547 | 18.7% (-16.8)#21,374 |
| 8. | 31211 | 1.5% | 10.1% (-8.51)#567 | 18.7% (-17.1)#22,403 |
| 9. | 31217 | 1.4% | 10.1% (-8.64)#575 | 18.7% (-17.2)#22,830 |
1
Common Questions
What are the Top 5 Zip Codes with the Highest Percentage of Hispanic or Latino Population in Macon, GA?
Top 5 Zip Codes with the Highest Percentage of Hispanic or Latino Population in Macon, GA are:
What zip code has the Highest Percentage of Hispanic or Latino Population in Macon, GA?
31207 has the Highest Percentage of Hispanic or Latino Population in Macon, GA with 7.5%.
What is the Percentage of Hispanic or Latino Population in Georgia?
Percentage of Hispanic or Latino Population in Georgia is 10.1%.
What is the Percentage of Hispanic or Latino Population in the United States?
Percentage of Hispanic or Latino Population in the United States is 18.7%.