Morgan, GA Map & Demographics
Morgan Map
Morgan Overview
$4,271
PER CAPITA INCOME
$75,208
AVG FAMILY INCOME
$38,750
AVG HOUSEHOLD INCOME
$14,585
FAMILY INCOME DEFICIT
0.46
INEQUALITY / GINI INDEX
1,832
TOTAL POPULATION
1,671
MALE POPULATION
161
FEMALE POPULATION
1,037.89
MALES / 100 FEMALES
9.63
FEMALES / 100 MALES
37.0
MEDIAN AGE
3.7
AVG FAMILY SIZE
2.4
AVG HOUSEHOLD SIZE
81
LABOR FORCE [ PEOPLE ]
4.5%
PERCENT IN LABOR FORCE
39.0%
UNEMPLOYMENT RATE
Morgan Zip Codes
Morgan Area Codes
Income in Morgan
Income Overview in Morgan
Per Capita Income in Morgan is $4,271, while median incomes of families and households are $75,208 and $38,750 respectively.
| Characteristic | Number | Measure |
| Per Capita Income | 1,832 | $4,271 |
| Median Family Income | 45 | $75,208 |
| Mean Family Income | 45 | $55,700 |
| Median Household Income | 95 | $38,750 |
| Mean Household Income | 95 | $43,145 |
| Income Deficit | 45 | $14,585 |
| Wage / Income Gap (%) | 1,832 | 0.00% |
| Wage / Income Gap ($) | 1,832 | 100.00¢ per $1 |
| Gini / Inequality Index | 1,832 | 0.46 |
Earnings by Sex in Morgan
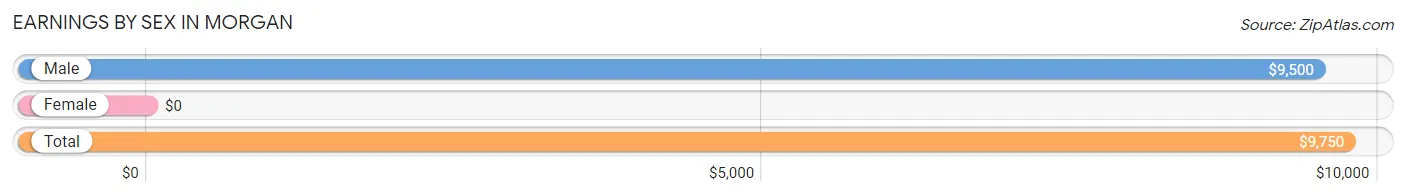
| Sex | Number | Average Earnings |
| Male | 256 (93.1%) | $9,500 |
| Female | 19 (6.9%) | $0 |
| Total | 275 (100.0%) | $9,750 |
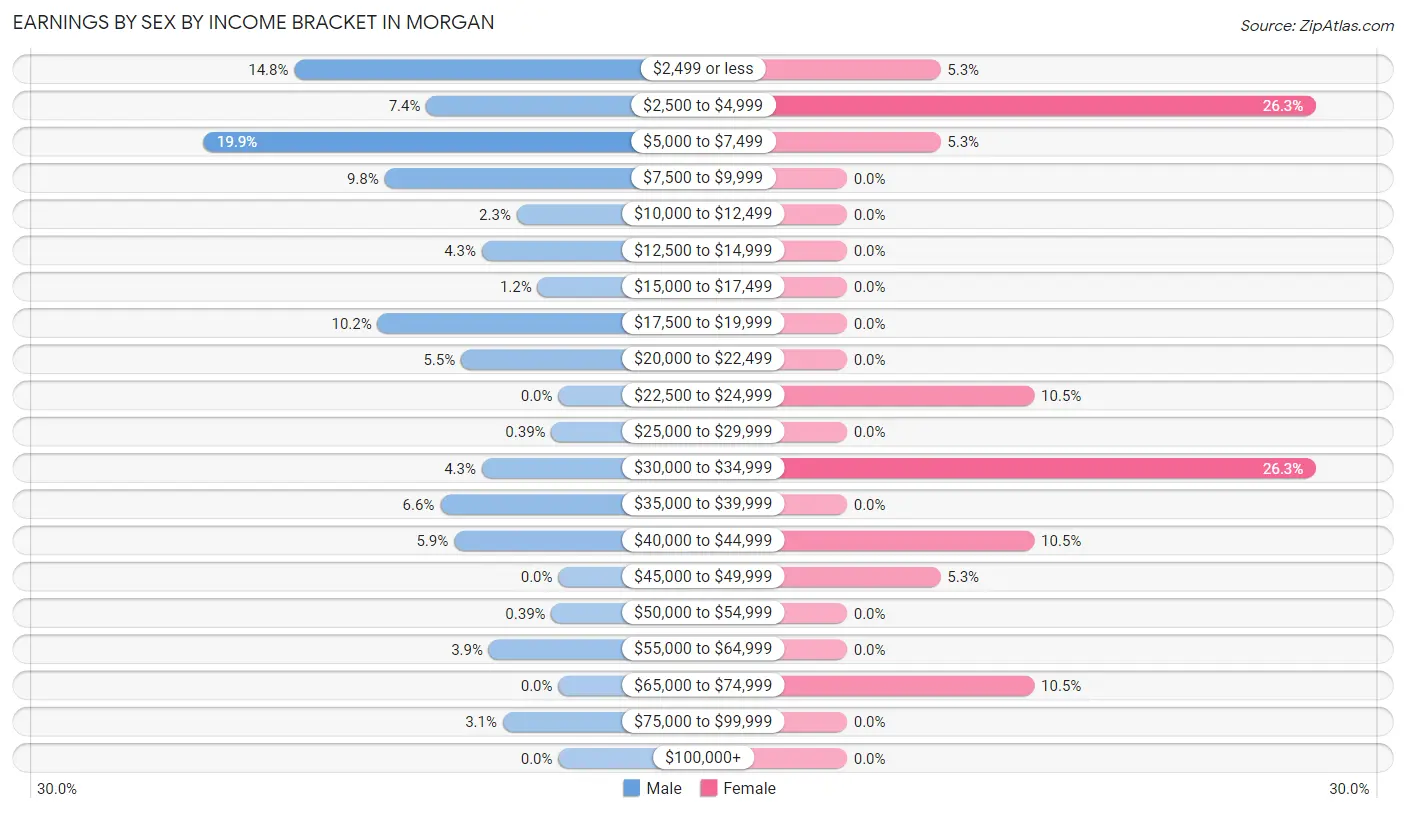
Earnings by Sex by Income Bracket in Morgan
The most common earnings brackets in Morgan are $5,000 to $7,499 for men (51 | 19.9%) and $2,500 to $4,999 for women (5 | 26.3%).
| Income | Male | Female |
| $2,499 or less | 38 (14.8%) | 1 (5.3%) |
| $2,500 to $4,999 | 19 (7.4%) | 5 (26.3%) |
| $5,000 to $7,499 | 51 (19.9%) | 1 (5.3%) |
| $7,500 to $9,999 | 25 (9.8%) | 0 (0.0%) |
| $10,000 to $12,499 | 6 (2.3%) | 0 (0.0%) |
| $12,500 to $14,999 | 11 (4.3%) | 0 (0.0%) |
| $15,000 to $17,499 | 3 (1.2%) | 0 (0.0%) |
| $17,500 to $19,999 | 26 (10.2%) | 0 (0.0%) |
| $20,000 to $22,499 | 14 (5.5%) | 0 (0.0%) |
| $22,500 to $24,999 | 0 (0.0%) | 2 (10.5%) |
| $25,000 to $29,999 | 1 (0.4%) | 0 (0.0%) |
| $30,000 to $34,999 | 11 (4.3%) | 5 (26.3%) |
| $35,000 to $39,999 | 17 (6.6%) | 0 (0.0%) |
| $40,000 to $44,999 | 15 (5.9%) | 2 (10.5%) |
| $45,000 to $49,999 | 0 (0.0%) | 1 (5.3%) |
| $50,000 to $54,999 | 1 (0.4%) | 0 (0.0%) |
| $55,000 to $64,999 | 10 (3.9%) | 0 (0.0%) |
| $65,000 to $74,999 | 0 (0.0%) | 2 (10.5%) |
| $75,000 to $99,999 | 8 (3.1%) | 0 (0.0%) |
| $100,000+ | 0 (0.0%) | 0 (0.0%) |
| Total | 256 (100.0%) | 19 (100.0%) |
Earnings by Sex by Educational Attainment in Morgan
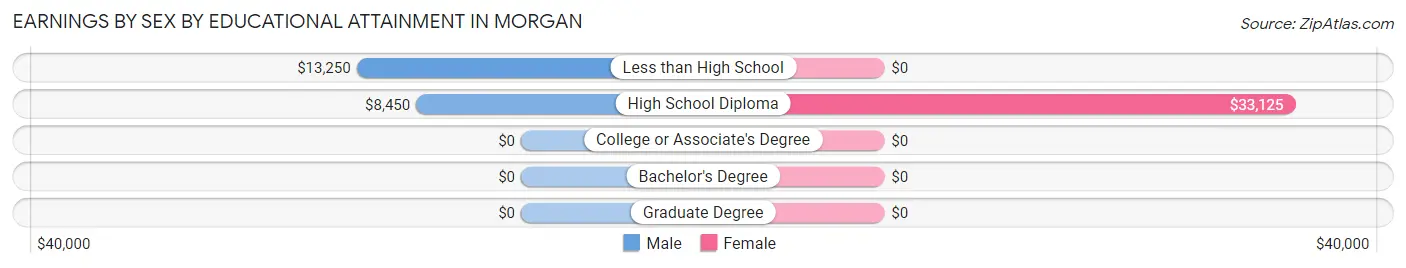
| Educational Attainment | Male Income | Female Income |
| Less than High School | $13,250 | $0 |
| High School Diploma | $8,450 | $33,125 |
| College or Associate's Degree | - | - |
| Bachelor's Degree | - | - |
| Graduate Degree | - | - |
| Total | - | - |
Family Income in Morgan
Family Income Brackets in Morgan
According to the Morgan family income data, there are 19 families falling into the $75,000 to $99,999 income range, which is the most common income bracket and makes up 42.2% of all families.
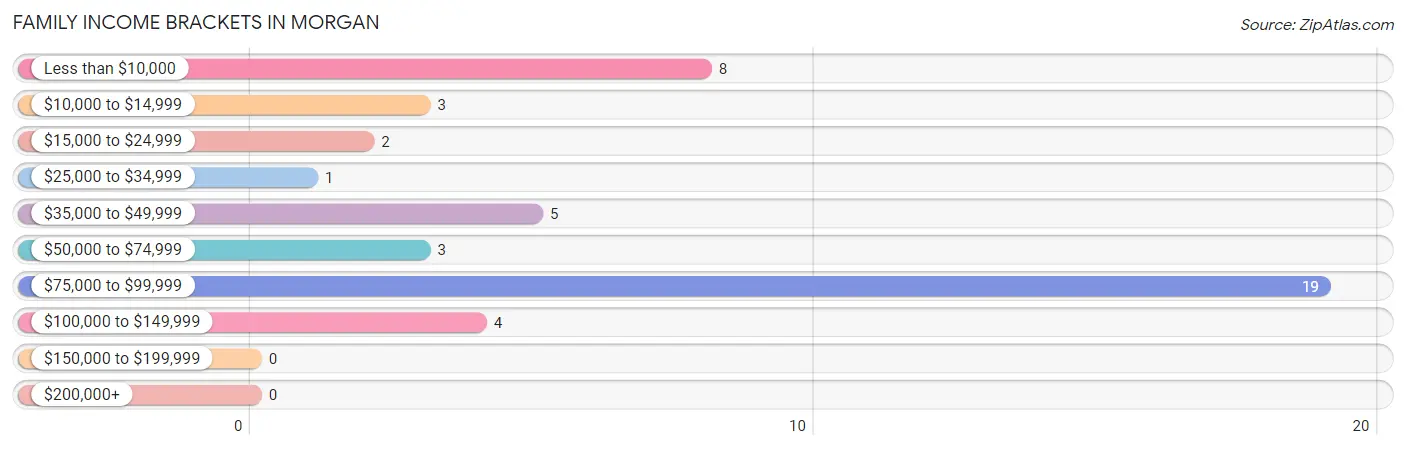
| Income Bracket | # Families | % Families |
| Less than $10,000 | 8 | 17.8% |
| $10,000 to $14,999 | 3 | 6.7% |
| $15,000 to $24,999 | 2 | 4.4% |
| $25,000 to $34,999 | 1 | 2.2% |
| $35,000 to $49,999 | 5 | 11.1% |
| $50,000 to $74,999 | 3 | 6.7% |
| $75,000 to $99,999 | 19 | 42.2% |
| $100,000 to $149,999 | 4 | 8.9% |
| $150,000 to $199,999 | 0 | 0.0% |
| $200,000+ | 0 | 0.0% |
Family Income by Famaliy Size in Morgan
3-person families (11 | 24.4%) account for the highest median family income in Morgan with $54,375 per family, while 3-person families (11 | 24.4%) have the highest median income of $18,125 per family member.
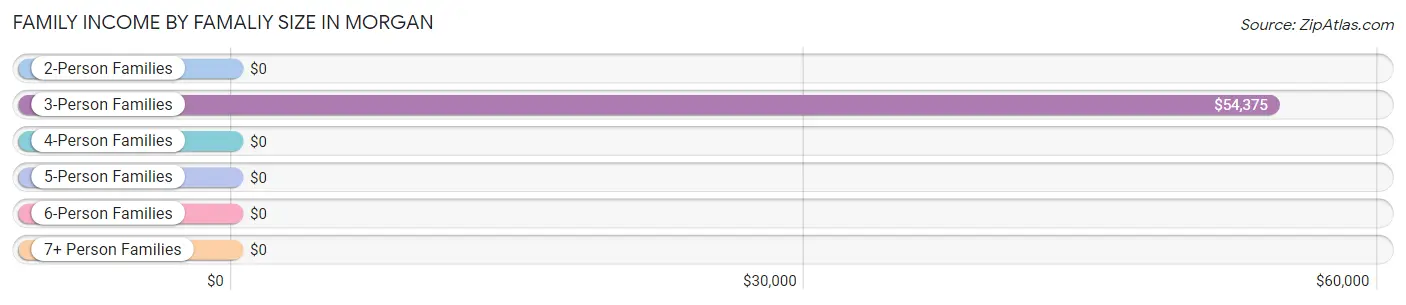
| Income Bracket | # Families | Median Income |
| 2-Person Families | 20 (44.4%) | $0 |
| 3-Person Families | 11 (24.4%) | $54,375 |
| 4-Person Families | 5 (11.1%) | $0 |
| 5-Person Families | 9 (20.0%) | $0 |
| 6-Person Families | 0 (0.0%) | $0 |
| 7+ Person Families | 0 (0.0%) | $0 |
| Total | 45 (100.0%) | $75,208 |
Family Income by Number of Earners in Morgan
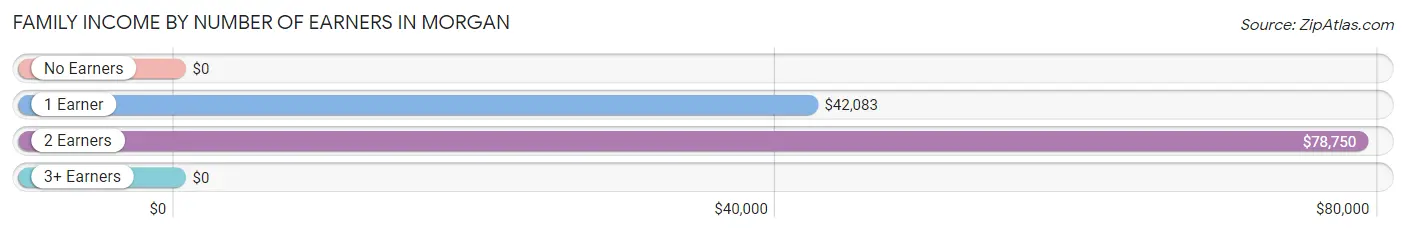
| Number of Earners | # Families | Median Income |
| No Earners | 20 (44.4%) | $0 |
| 1 Earner | 5 (11.1%) | $42,083 |
| 2 Earners | 20 (44.4%) | $78,750 |
| 3+ Earners | 0 (0.0%) | $0 |
| Total | 45 (100.0%) | $75,208 |
Household Income in Morgan
Household Income Brackets in Morgan
With 27 households falling in the category, the $75,000 to $99,999 income range is the most frequent in Morgan, accounting for 28.4% of all households.
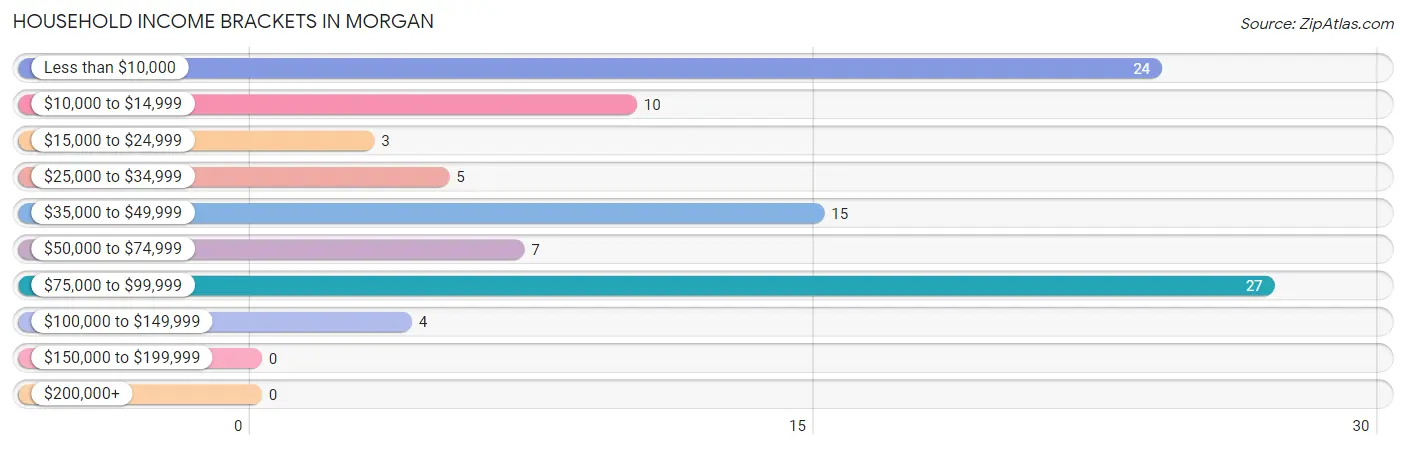
| Income Bracket | # Households | % Households |
| Less than $10,000 | 24 | 25.3% |
| $10,000 to $14,999 | 10 | 10.5% |
| $15,000 to $24,999 | 3 | 3.2% |
| $25,000 to $34,999 | 5 | 5.3% |
| $35,000 to $49,999 | 15 | 15.8% |
| $50,000 to $74,999 | 7 | 7.4% |
| $75,000 to $99,999 | 27 | 28.4% |
| $100,000 to $149,999 | 4 | 4.2% |
| $150,000 to $199,999 | 0 | 0.0% |
| $200,000+ | 0 | 0.0% |
Household Income by Householder Age in Morgan
The median household income in Morgan is $38,750, with the highest median household income of $75,750 found in the 25 to 44 years age bracket for the primary householder. A total of 25 households (26.3%) fall into this category.
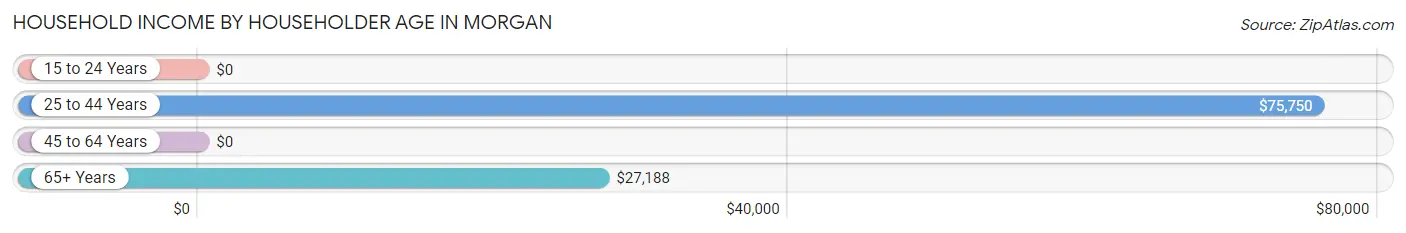
| Income Bracket | # Households | Median Income |
| 15 to 24 Years | 0 (0.0%) | $0 |
| 25 to 44 Years | 25 (26.3%) | $75,750 |
| 45 to 64 Years | 19 (20.0%) | $0 |
| 65+ Years | 51 (53.7%) | $27,188 |
| Total | 95 (100.0%) | $38,750 |
Poverty in Morgan
Income Below Poverty by Sex and Age in Morgan
With 10.9% poverty level for males and 45.6% for females among the residents of Morgan, 35 to 44 year old males and 18 to 24 year old females are the most vulnerable to poverty, with 6 males (27.3%) and 31 females (100.0%) in their respective age groups living below the poverty level.
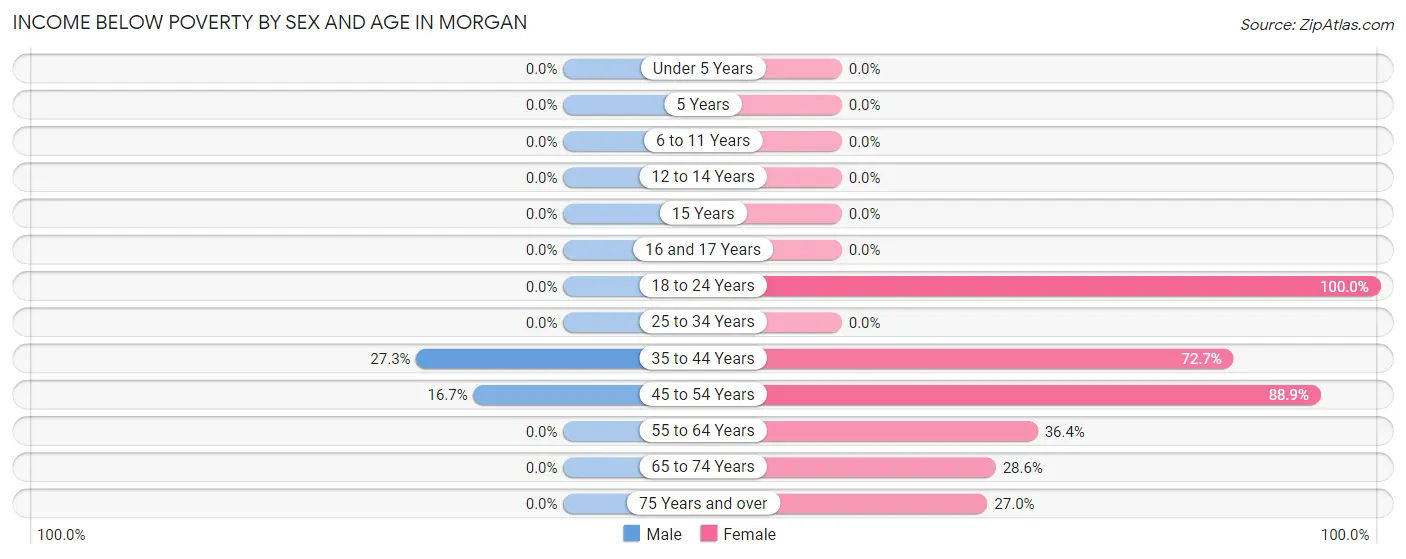
| Age Bracket | Male | Female |
| Under 5 Years | 0 (0.0%) | 0 (0.0%) |
| 5 Years | 0 (0.0%) | 0 (0.0%) |
| 6 to 11 Years | 0 (0.0%) | 0 (0.0%) |
| 12 to 14 Years | 0 (0.0%) | 0 (0.0%) |
| 15 Years | 0 (0.0%) | 0 (0.0%) |
| 16 and 17 Years | 0 (0.0%) | 0 (0.0%) |
| 18 to 24 Years | 0 (0.0%) | 31 (100.0%) |
| 25 to 34 Years | 0 (0.0%) | 0 (0.0%) |
| 35 to 44 Years | 6 (27.3%) | 16 (72.7%) |
| 45 to 54 Years | 1 (16.7%) | 8 (88.9%) |
| 55 to 64 Years | 0 (0.0%) | 4 (36.4%) |
| 65 to 74 Years | 0 (0.0%) | 4 (28.6%) |
| 75 Years and over | 0 (0.0%) | 10 (27.0%) |
| Total | 7 (10.9%) | 73 (45.6%) |
Income Above Poverty by Sex and Age in Morgan
According to the poverty statistics in Morgan, males aged 6 to 11 years and females aged under 5 years are the age groups that are most secure financially, with 100.0% of males and 100.0% of females in these age groups living above the poverty line.
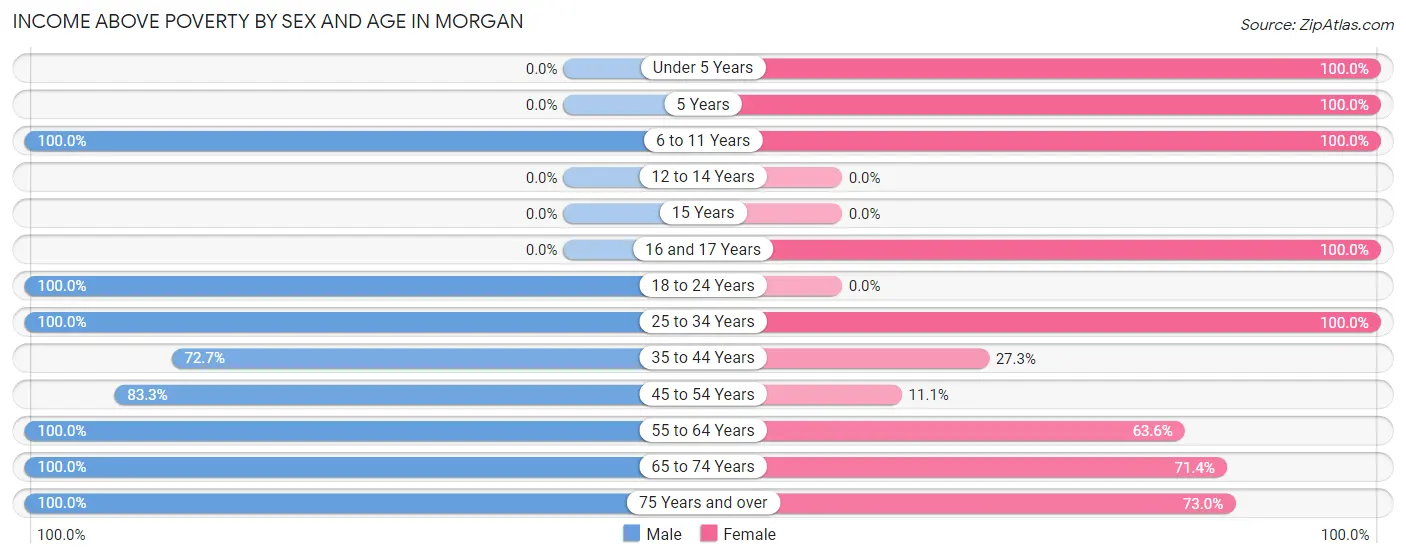
| Age Bracket | Male | Female |
| Under 5 Years | 0 (0.0%) | 16 (100.0%) |
| 5 Years | 0 (0.0%) | 3 (100.0%) |
| 6 to 11 Years | 8 (100.0%) | 2 (100.0%) |
| 12 to 14 Years | 0 (0.0%) | 0 (0.0%) |
| 15 Years | 0 (0.0%) | 0 (0.0%) |
| 16 and 17 Years | 0 (0.0%) | 2 (100.0%) |
| 18 to 24 Years | 5 (100.0%) | 0 (0.0%) |
| 25 to 34 Years | 4 (100.0%) | 13 (100.0%) |
| 35 to 44 Years | 16 (72.7%) | 6 (27.3%) |
| 45 to 54 Years | 5 (83.3%) | 1 (11.1%) |
| 55 to 64 Years | 5 (100.0%) | 7 (63.6%) |
| 65 to 74 Years | 11 (100.0%) | 10 (71.4%) |
| 75 Years and over | 3 (100.0%) | 27 (73.0%) |
| Total | 57 (89.1%) | 87 (54.4%) |
Income Below Poverty Among Married-Couple Families in Morgan
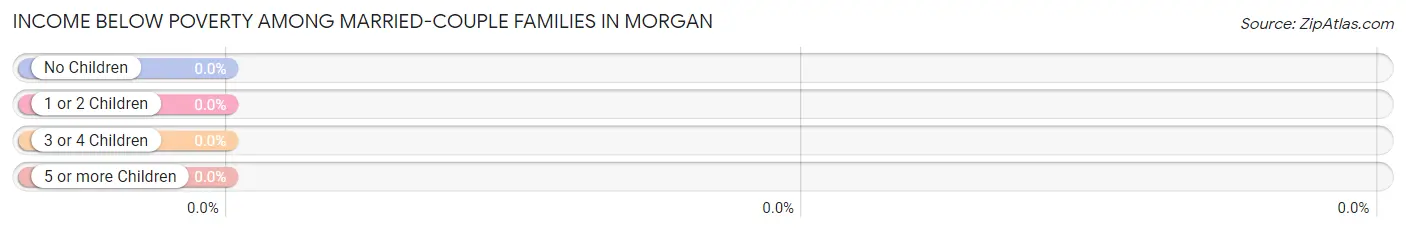
| Children | Above Poverty | Below Poverty |
| No Children | 18 (100.0%) | 0 (0.0%) |
| 1 or 2 Children | 7 (100.0%) | 0 (0.0%) |
| 3 or 4 Children | 7 (100.0%) | 0 (0.0%) |
| 5 or more Children | 0 (0.0%) | 0 (0.0%) |
| Total | 32 (100.0%) | 0 (0.0%) |
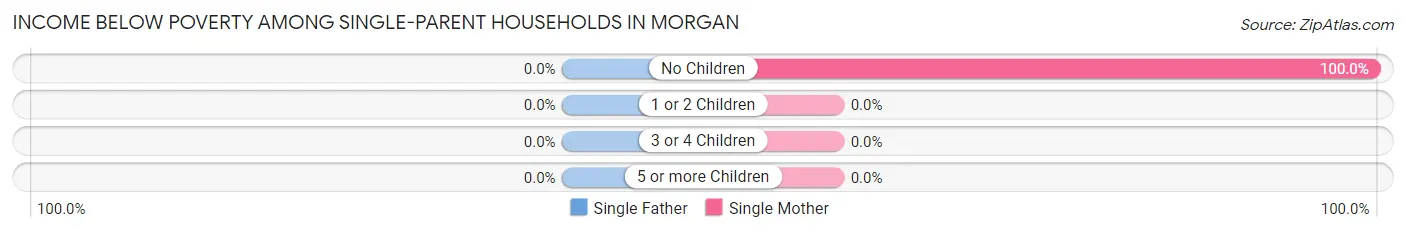
Income Below Poverty Among Single-Parent Households in Morgan
| Children | Single Father | Single Mother |
| No Children | 0 (0.0%) | 13 (100.0%) |
| 1 or 2 Children | 0 (0.0%) | 0 (0.0%) |
| 3 or 4 Children | 0 (0.0%) | 0 (0.0%) |
| 5 or more Children | 0 (0.0%) | 0 (0.0%) |
| Total | 0 (0.0%) | 13 (100.0%) |
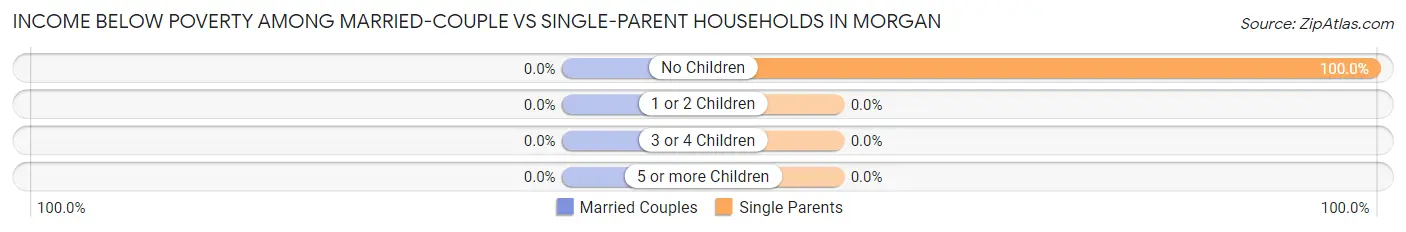
Income Below Poverty Among Married-Couple vs Single-Parent Households in Morgan
| Children | Married-Couple Families | Single-Parent Households |
| No Children | 0 (0.0%) | 13 (100.0%) |
| 1 or 2 Children | 0 (0.0%) | 0 (0.0%) |
| 3 or 4 Children | 0 (0.0%) | 0 (0.0%) |
| 5 or more Children | 0 (0.0%) | 0 (0.0%) |
| Total | 0 (0.0%) | 13 (100.0%) |
Race in Morgan
The most populous races in Morgan are Black / African American (1,202 | 65.6%), White / Caucasian (533 | 29.1%), and Hispanic or Latino (120 | 6.6%).
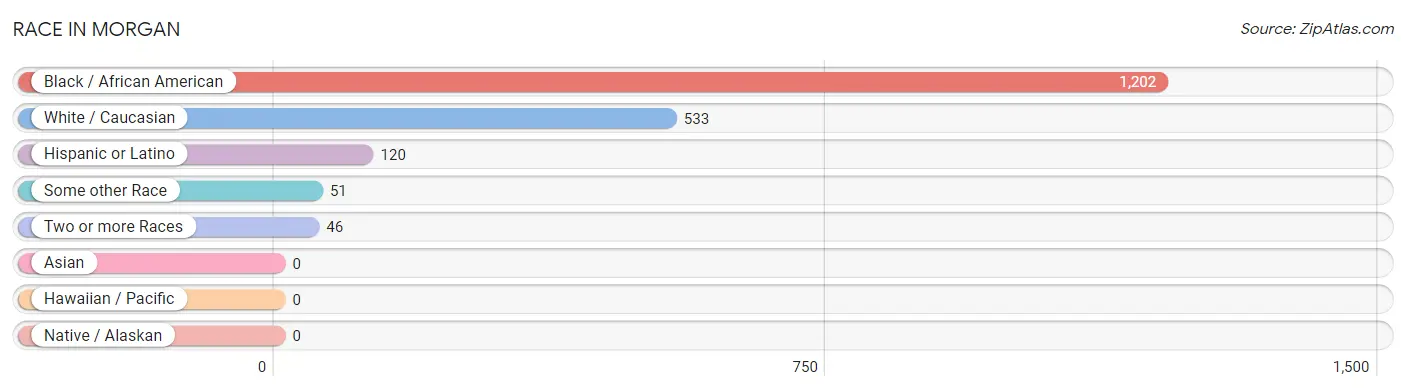
| Race | # Population | % Population |
| Asian | 0 | 0.0% |
| Black / African American | 1,202 | 65.6% |
| Hawaiian / Pacific | 0 | 0.0% |
| Hispanic or Latino | 120 | 6.6% |
| Native / Alaskan | 0 | 0.0% |
| White / Caucasian | 533 | 29.1% |
| Two or more Races | 46 | 2.5% |
| Some other Race | 51 | 2.8% |
| Total | 1,832 | 100.0% |
Ancestry in Morgan
The most populous ancestries reported in Morgan are American (147 | 8.0%), German (99 | 5.4%), Irish (92 | 5.0%), Mexican (82 | 4.5%), and African (48 | 2.6%), together accounting for 25.5% of all Morgan residents.
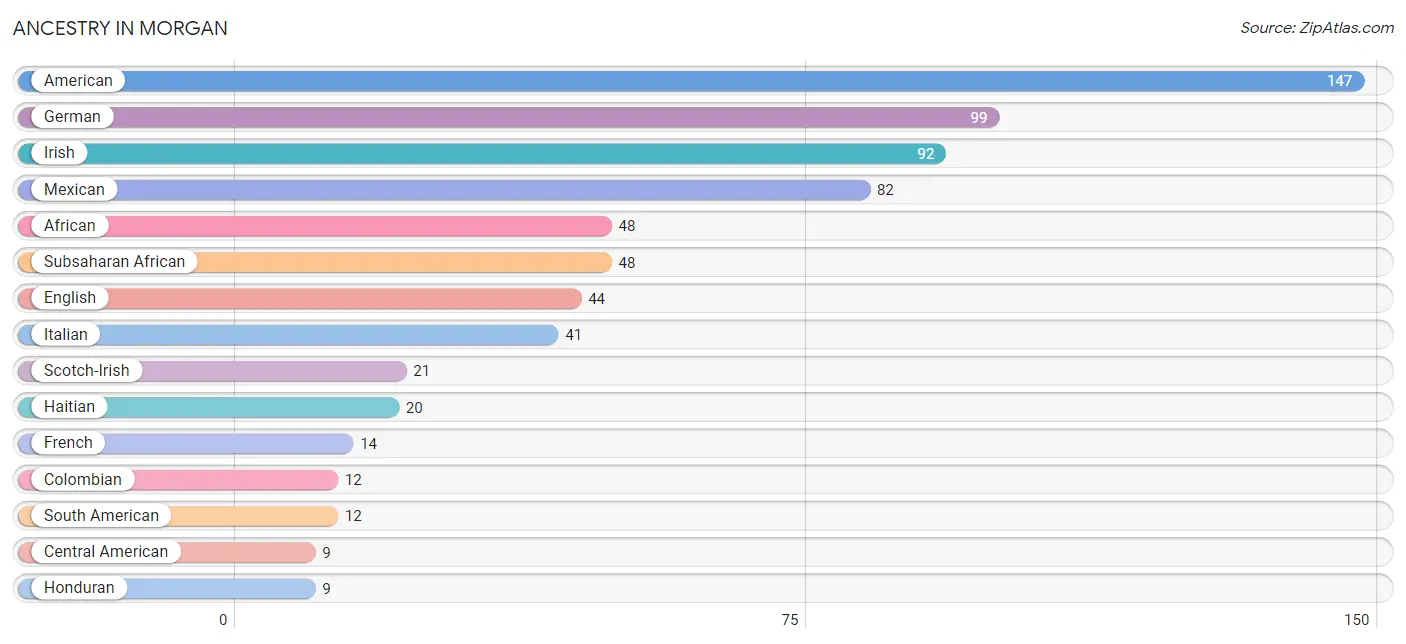
| Ancestry | # Population | % Population |
| African | 48 | 2.6% |
| American | 147 | 8.0% |
| Belgian | 1 | 0.1% |
| Bhutanese | 4 | 0.2% |
| Central American | 9 | 0.5% |
| Colombian | 12 | 0.7% |
| Dominican | 6 | 0.3% |
| English | 44 | 2.4% |
| French | 14 | 0.8% |
| German | 99 | 5.4% |
| Haitian | 20 | 1.1% |
| Honduran | 9 | 0.5% |
| Irish | 92 | 5.0% |
| Italian | 41 | 2.2% |
| Mexican | 82 | 4.5% |
| Puerto Rican | 5 | 0.3% |
| Scotch-Irish | 21 | 1.1% |
| Scottish | 3 | 0.2% |
| South American | 12 | 0.7% |
| Spaniard | 6 | 0.3% |
| Subsaharan African | 48 | 2.6% |
| Swiss | 2 | 0.1% | View All 22 Rows |
Immigrants in Morgan
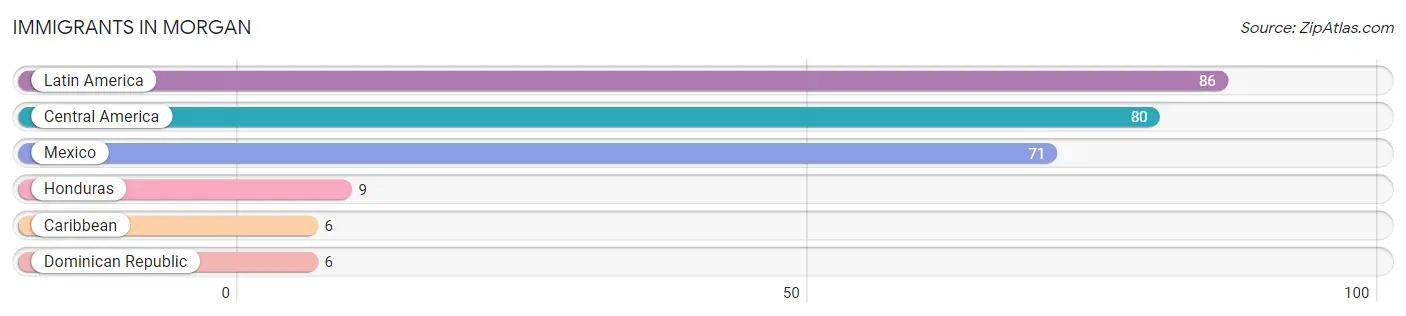
The most numerous immigrant groups reported in Morgan came from Latin America (86 | 4.7%), Central America (80 | 4.4%), Mexico (71 | 3.9%), Honduras (9 | 0.5%), and Caribbean (6 | 0.3%), together accounting for 13.8% of all Morgan residents.
| Immigration Origin | # Population | % Population |
| Caribbean | 6 | 0.3% |
| Central America | 80 | 4.4% |
| Dominican Republic | 6 | 0.3% |
| Honduras | 9 | 0.5% |
| Latin America | 86 | 4.7% |
| Mexico | 71 | 3.9% | View All 6 Rows |
Sex and Age in Morgan
Sex and Age in Morgan
The most populous age groups in Morgan are 40 to 44 Years (328 | 19.6%) for men and 20 to 24 Years (20 | 12.4%) for women.
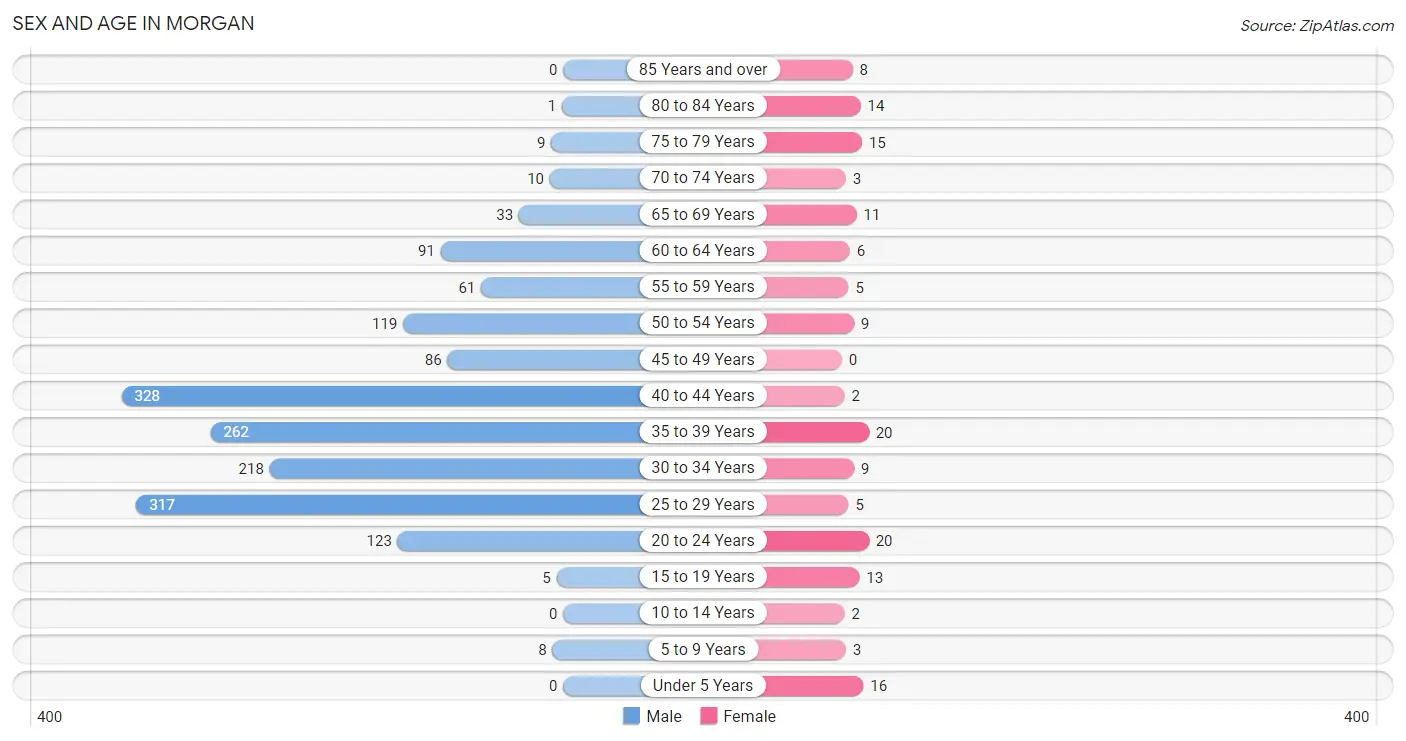
| Age Bracket | Male | Female |
| Under 5 Years | 0 (0.0%) | 16 (9.9%) |
| 5 to 9 Years | 8 (0.5%) | 3 (1.9%) |
| 10 to 14 Years | 0 (0.0%) | 2 (1.2%) |
| 15 to 19 Years | 5 (0.3%) | 13 (8.1%) |
| 20 to 24 Years | 123 (7.4%) | 20 (12.4%) |
| 25 to 29 Years | 317 (19.0%) | 5 (3.1%) |
| 30 to 34 Years | 218 (13.1%) | 9 (5.6%) |
| 35 to 39 Years | 262 (15.7%) | 20 (12.4%) |
| 40 to 44 Years | 328 (19.6%) | 2 (1.2%) |
| 45 to 49 Years | 86 (5.1%) | 0 (0.0%) |
| 50 to 54 Years | 119 (7.1%) | 9 (5.6%) |
| 55 to 59 Years | 61 (3.6%) | 5 (3.1%) |
| 60 to 64 Years | 91 (5.4%) | 6 (3.7%) |
| 65 to 69 Years | 33 (2.0%) | 11 (6.8%) |
| 70 to 74 Years | 10 (0.6%) | 3 (1.9%) |
| 75 to 79 Years | 9 (0.5%) | 15 (9.3%) |
| 80 to 84 Years | 1 (0.1%) | 14 (8.7%) |
| 85 Years and over | 0 (0.0%) | 8 (5.0%) |
| Total | 1,671 (100.0%) | 161 (100.0%) |
Families and Households in Morgan
Median Family Size in Morgan
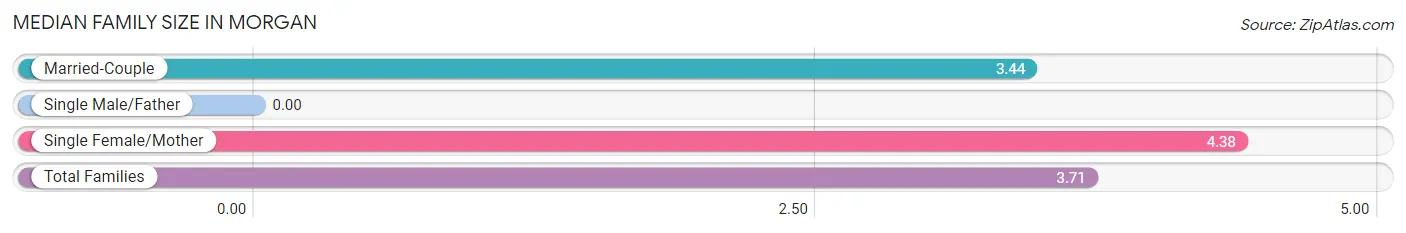
| Family Type | # Families | Family Size |
| Married-Couple | 32 (71.1%) | 3.44 |
| Single Male/Father | 0 (0.0%) | - |
| Single Female/Mother | 13 (28.9%) | 4.38 |
| Total Families | 45 (100.0%) | 3.71 |
Median Household Size in Morgan
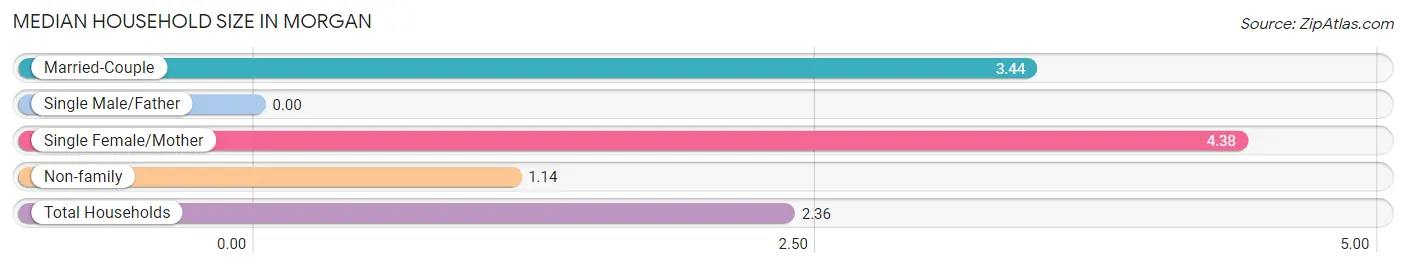
| Household Type | # Households | Household Size |
| Married-Couple | 32 (33.7%) | 3.44 |
| Single Male/Father | 0 (0.0%) | - |
| Single Female/Mother | 13 (13.7%) | 4.38 |
| Non-family | 50 (52.6%) | 1.14 |
| Total Households | 95 (100.0%) | 2.36 |
Household Size by Marriage Status in Morgan
Out of a total of 95 households in Morgan, 45 (47.4%) are family households, while 50 (52.6%) are nonfamily households. The most numerous type of family households are 2-person households, comprising 20, and the most common type of nonfamily households are 1-person households, comprising 46.
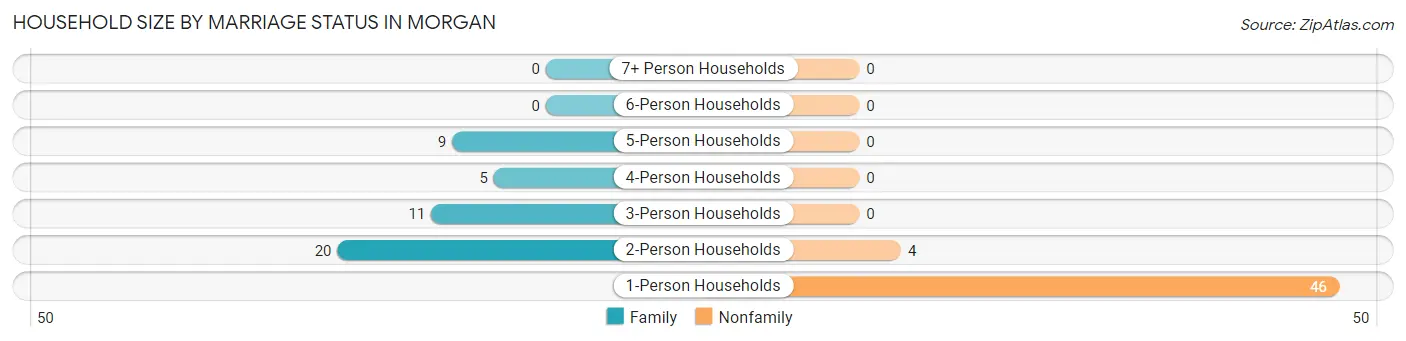
| Household Size | Family Households | Nonfamily Households |
| 1-Person Households | - | 46 (48.4%) |
| 2-Person Households | 20 (21.0%) | 4 (4.2%) |
| 3-Person Households | 11 (11.6%) | 0 (0.0%) |
| 4-Person Households | 5 (5.3%) | 0 (0.0%) |
| 5-Person Households | 9 (9.5%) | 0 (0.0%) |
| 6-Person Households | 0 (0.0%) | 0 (0.0%) |
| 7+ Person Households | 0 (0.0%) | 0 (0.0%) |
| Total | 45 (47.4%) | 50 (52.6%) |
Female Fertility in Morgan
Fertility by Age in Morgan
| Age Bracket | Women with Births | Births / 1,000 Women |
| 15 to 19 years | 0 (0.0%) | 0.0 |
| 20 to 34 years | 0 (0.0%) | 0.0 |
| 35 to 50 years | 0 (0.0%) | 0.0 |
| Total | 0 (0.0%) | 0.0 |
Fertility by Age by Marriage Status in Morgan
| Age Bracket | Married | Unmarried |
| 15 to 19 years | 0 (0.0%) | 0 (0.0%) |
| 20 to 34 years | 0 (0.0%) | 0 (0.0%) |
| 35 to 50 years | 0 (0.0%) | 0 (0.0%) |
| Total | 0 (0.0%) | 0 (0.0%) |
Fertility by Education in Morgan
| Educational Attainment | Women with Births | Births / 1,000 Women |
| Less than High School | 0 (0.0%) | 0.0 |
| High School Diploma | 0 (0.0%) | 0.0 |
| College or Associate's Degree | 0 (0.0%) | 0.0 |
| Bachelor's Degree | 0 (0.0%) | 0.0 |
| Graduate Degree | 0 (0.0%) | 0.0 |
| Total | 0 (0.0%) | 0.0 |
Fertility by Education by Marriage Status in Morgan
| Educational Attainment | Married | Unmarried |
| Less than High School | 0 (0.0%) | 0 (0.0%) |
| High School Diploma | 0 (0.0%) | 0 (0.0%) |
| College or Associate's Degree | 0 (0.0%) | 0 (0.0%) |
| Bachelor's Degree | 0 (0.0%) | 0 (0.0%) |
| Graduate Degree | 0 (0.0%) | 0 (0.0%) |
| Total | 0 (0.0%) | 0 (0.0%) |
Employment Characteristics in Morgan
Employment by Class of Employer in Morgan
Among the 45 employed individuals in Morgan, private company employees (24 | 53.3%), self-employed (not incorporated) (7 | 15.6%), and not-for-profit organizations (7 | 15.6%) make up the most common classes of employment.
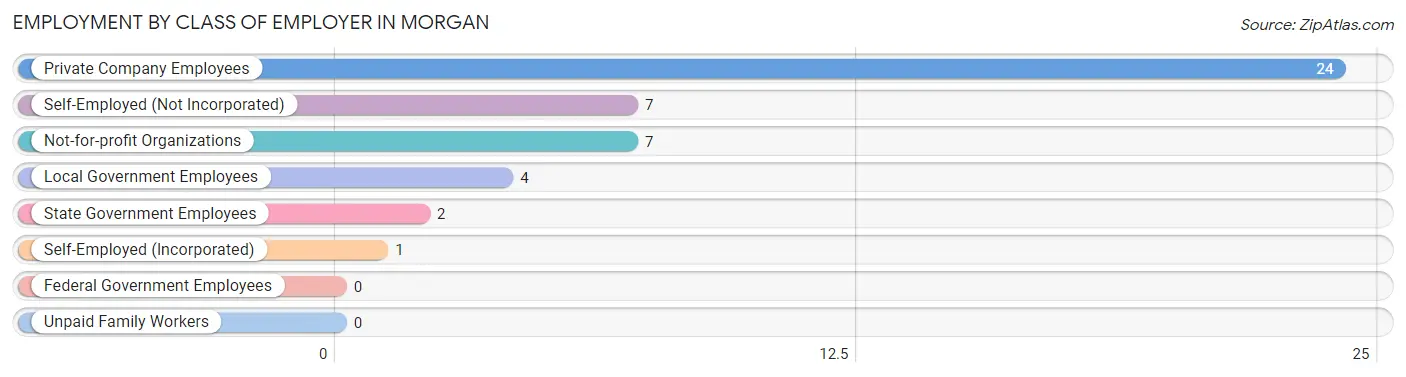
| Employer Class | # Employees | % Employees |
| Private Company Employees | 24 | 53.3% |
| Self-Employed (Incorporated) | 1 | 2.2% |
| Self-Employed (Not Incorporated) | 7 | 15.6% |
| Not-for-profit Organizations | 7 | 15.6% |
| Local Government Employees | 4 | 8.9% |
| State Government Employees | 2 | 4.4% |
| Federal Government Employees | 0 | 0.0% |
| Unpaid Family Workers | 0 | 0.0% |
| Total | 45 | 100.0% |
Employment Status by Age in Morgan
According to the labor force statistics for Morgan, out of the total population over 16 years of age (1,803), 4.5% or 81 individuals are in the labor force, with 39.0% or 32 of them unemployed. The age group with the highest labor force participation rate is 65 to 74 years, with 14.0% or 8 individuals in the labor force. Within the labor force, the 20 to 24 years age range has the highest percentage of unemployed individuals, with 100.0% or 5 of them being unemployed.
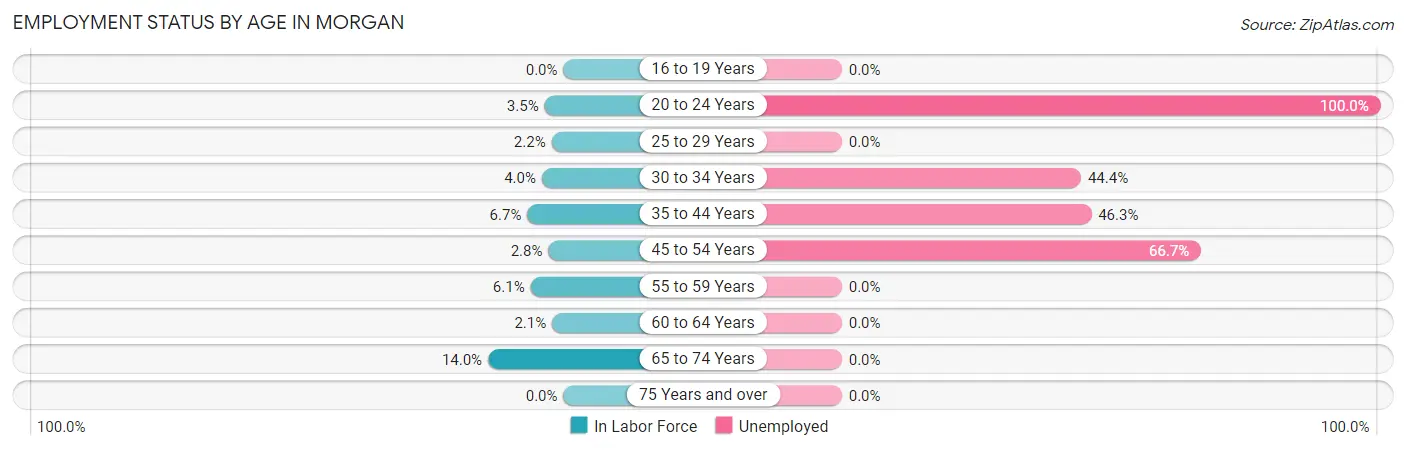
| Age Bracket | In Labor Force | Unemployed |
| 16 to 19 Years | 0 (0.0%) | 0 (0.0%) |
| 20 to 24 Years | 5 (3.5%) | 5 (100.0%) |
| 25 to 29 Years | 7 (2.2%) | 0 (0.0%) |
| 30 to 34 Years | 9 (4.0%) | 4 (44.4%) |
| 35 to 44 Years | 41 (6.7%) | 19 (46.3%) |
| 45 to 54 Years | 6 (2.8%) | 4 (66.7%) |
| 55 to 59 Years | 4 (6.1%) | 0 (0.0%) |
| 60 to 64 Years | 2 (2.1%) | 0 (0.0%) |
| 65 to 74 Years | 8 (14.0%) | 0 (0.0%) |
| 75 Years and over | 0 (0.0%) | 0 (0.0%) |
| Total | 81 (4.5%) | 32 (39.0%) |
Employment Status by Educational Attainment in Morgan
According to labor force statistics for Morgan, 4.5% of individuals (69) out of the total population between 25 and 64 years of age (1,538) are in the labor force, with 39.1% or 27 of them being unemployed. The group with the highest labor force participation rate are those with the educational attainment of bachelor's degree or higher, with 57.6% or 34 individuals in the labor force. Within the labor force, individuals with high school diploma education have the highest percentage of unemployment, with 44.4% or 8 of them being unemployed.
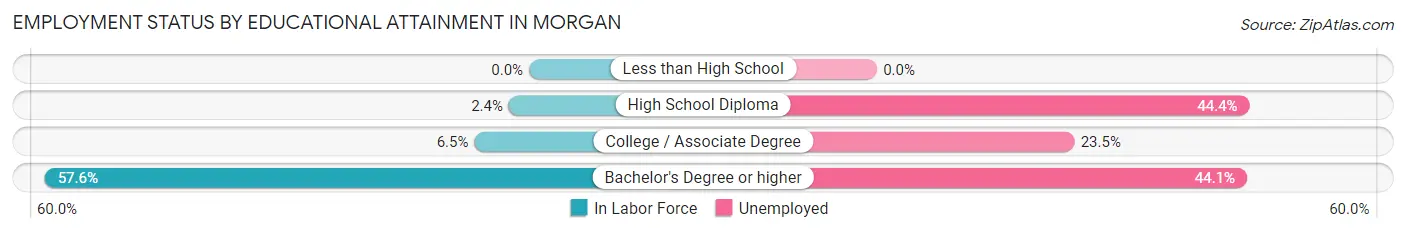
| Educational Attainment | In Labor Force | Unemployed |
| Less than High School | 0 (0.0%) | 0 (0.0%) |
| High School Diploma | 18 (2.4%) | 333 (44.4%) |
| College / Associate Degree | 17 (6.5%) | 62 (23.5%) |
| Bachelor's Degree or higher | 34 (57.6%) | 26 (44.1%) |
| Total | 69 (4.5%) | 601 (39.1%) |
Employment Occupations by Sex in Morgan
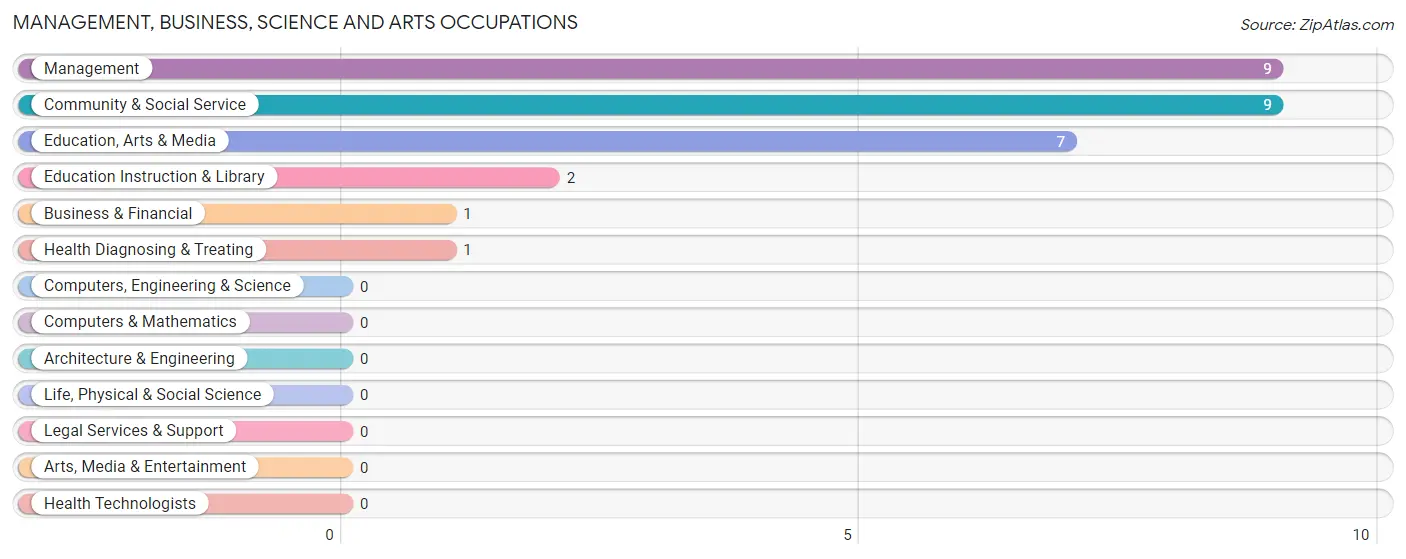
Management, Business, Science and Arts Occupations
The most common Management, Business, Science and Arts occupations in Morgan are Management (9 | 18.0%), Community & Social Service (9 | 18.0%), Education, Arts & Media (7 | 14.0%), Education Instruction & Library (2 | 4.0%), and Business & Financial (1 | 2.0%).
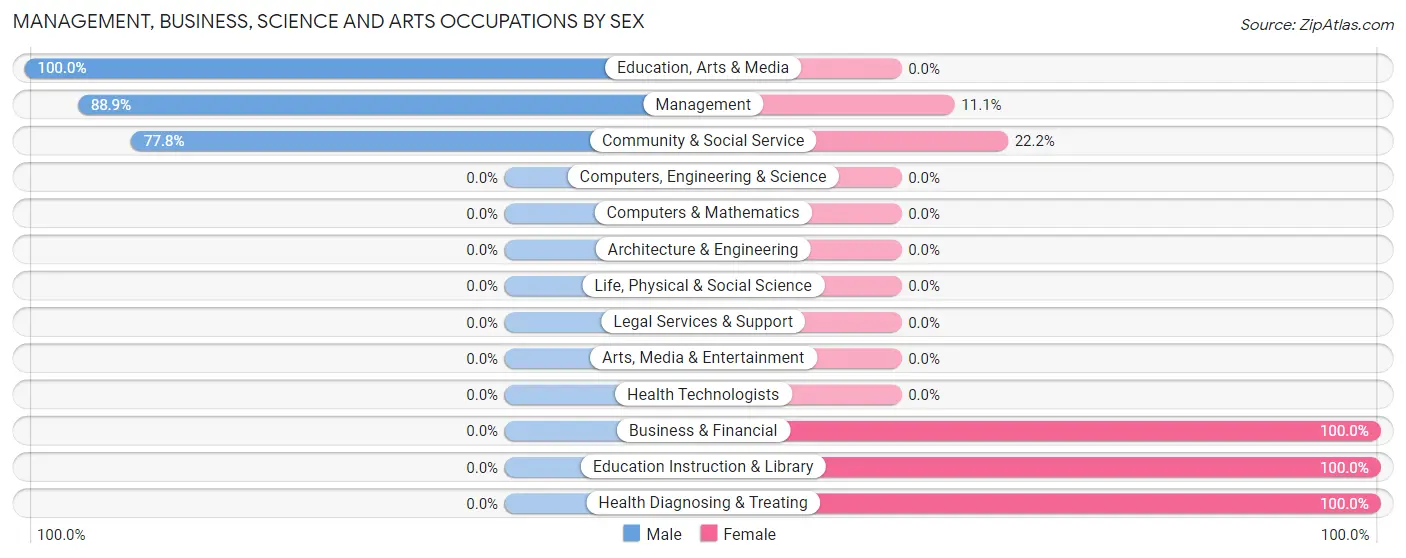
Management, Business, Science and Arts Occupations by Sex
Within the Management, Business, Science and Arts occupations in Morgan, the most male-oriented occupations are Education, Arts & Media (100.0%), Management (88.9%), and Community & Social Service (77.8%), while the most female-oriented occupations are Business & Financial (100.0%), Education Instruction & Library (100.0%), and Health Diagnosing & Treating (100.0%).
| Occupation | Male | Female |
| Management | 8 (88.9%) | 1 (11.1%) |
| Business & Financial | 0 (0.0%) | 1 (100.0%) |
| Computers, Engineering & Science | 0 (0.0%) | 0 (0.0%) |
| Computers & Mathematics | 0 (0.0%) | 0 (0.0%) |
| Architecture & Engineering | 0 (0.0%) | 0 (0.0%) |
| Life, Physical & Social Science | 0 (0.0%) | 0 (0.0%) |
| Community & Social Service | 7 (77.8%) | 2 (22.2%) |
| Education, Arts & Media | 7 (100.0%) | 0 (0.0%) |
| Legal Services & Support | 0 (0.0%) | 0 (0.0%) |
| Education Instruction & Library | 0 (0.0%) | 2 (100.0%) |
| Arts, Media & Entertainment | 0 (0.0%) | 0 (0.0%) |
| Health Diagnosing & Treating | 0 (0.0%) | 1 (100.0%) |
| Health Technologists | 0 (0.0%) | 0 (0.0%) |
| Total (Category) | 15 (75.0%) | 5 (25.0%) |
| Total (Overall) | 33 (66.0%) | 17 (34.0%) |
Services Occupations
Services Occupations by Sex
| Occupation | Male | Female |
| Healthcare Support | 0 (0.0%) | 0 (0.0%) |
| Security & Protection | 0 (0.0%) | 0 (0.0%) |
| Firefighting & Prevention | 0 (0.0%) | 0 (0.0%) |
| Law Enforcement | 0 (0.0%) | 0 (0.0%) |
| Food Preparation & Serving | 0 (0.0%) | 0 (0.0%) |
| Cleaning & Maintenance | 0 (0.0%) | 0 (0.0%) |
| Personal Care & Service | 0 (0.0%) | 0 (0.0%) |
| Total (Category) | 0 (0.0%) | 0 (0.0%) |
| Total (Overall) | 33 (66.0%) | 17 (34.0%) |
Sales and Office Occupations
The most common Sales and Office occupations in Morgan are Sales & Related (9 | 18.0%), and Office & Administration (7 | 14.0%).
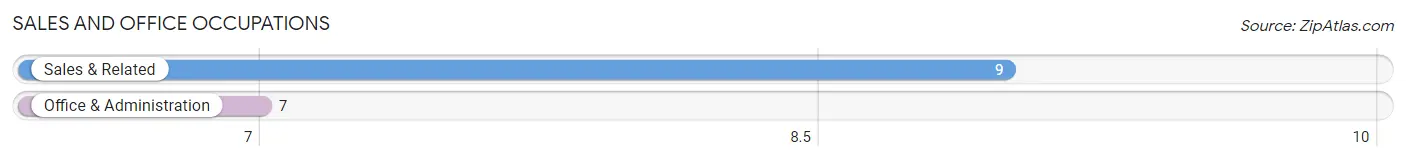
Sales and Office Occupations by Sex
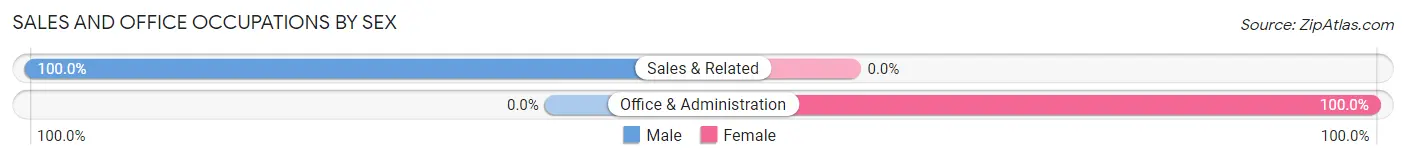
| Occupation | Male | Female |
| Sales & Related | 9 (100.0%) | 0 (0.0%) |
| Office & Administration | 0 (0.0%) | 7 (100.0%) |
| Total (Category) | 9 (56.2%) | 7 (43.8%) |
| Total (Overall) | 33 (66.0%) | 17 (34.0%) |
Natural Resources, Construction and Maintenance Occupations
The most common Natural Resources, Construction and Maintenance occupations in Morgan are Construction & Extraction (4 | 8.0%), and Farming, Fishing & Forestry (1 | 2.0%).
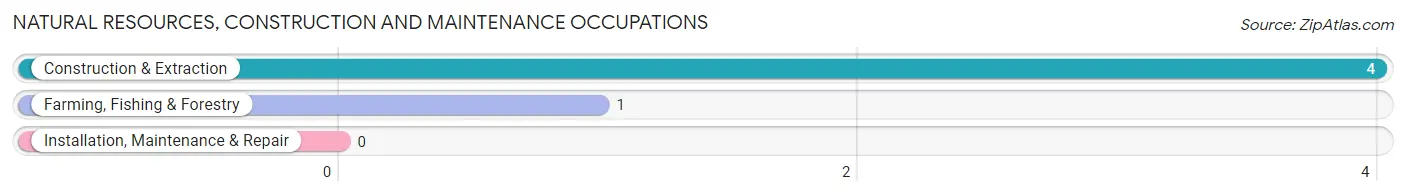
Natural Resources, Construction and Maintenance Occupations by Sex
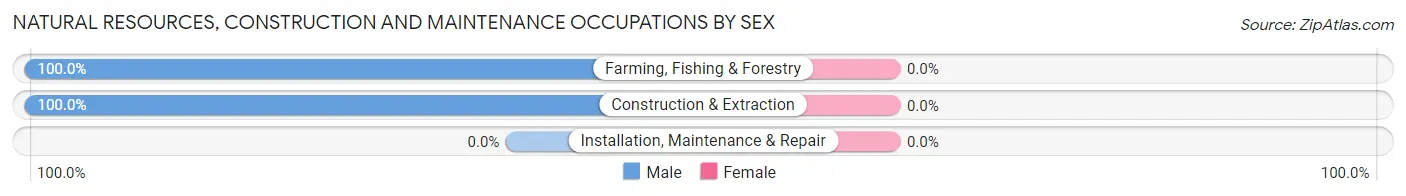
| Occupation | Male | Female |
| Farming, Fishing & Forestry | 1 (100.0%) | 0 (0.0%) |
| Construction & Extraction | 4 (100.0%) | 0 (0.0%) |
| Installation, Maintenance & Repair | 0 (0.0%) | 0 (0.0%) |
| Total (Category) | 5 (100.0%) | 0 (0.0%) |
| Total (Overall) | 33 (66.0%) | 17 (34.0%) |
Production, Transportation and Moving Occupations
The most common Production, Transportation and Moving occupations in Morgan are Production (5 | 10.0%), and Transportation (4 | 8.0%).
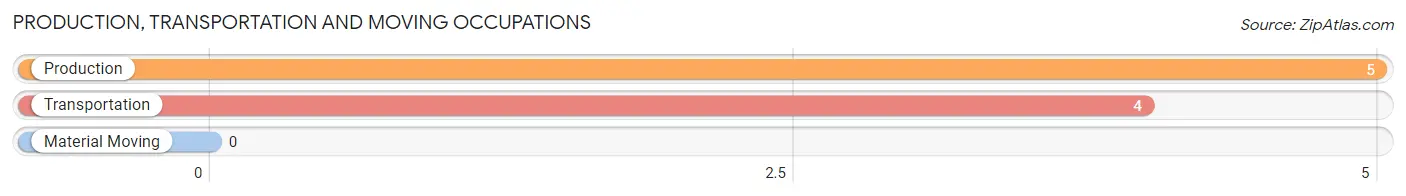
Production, Transportation and Moving Occupations by Sex
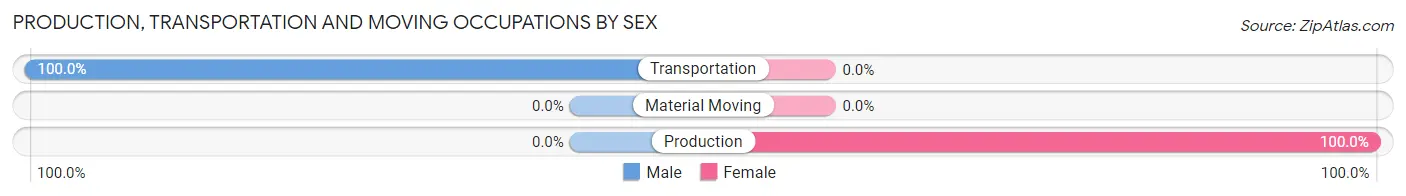
| Occupation | Male | Female |
| Production | 0 (0.0%) | 5 (100.0%) |
| Transportation | 4 (100.0%) | 0 (0.0%) |
| Material Moving | 0 (0.0%) | 0 (0.0%) |
| Total (Category) | 4 (44.4%) | 5 (55.6%) |
| Total (Overall) | 33 (66.0%) | 17 (34.0%) |
Employment Industries by Sex in Morgan
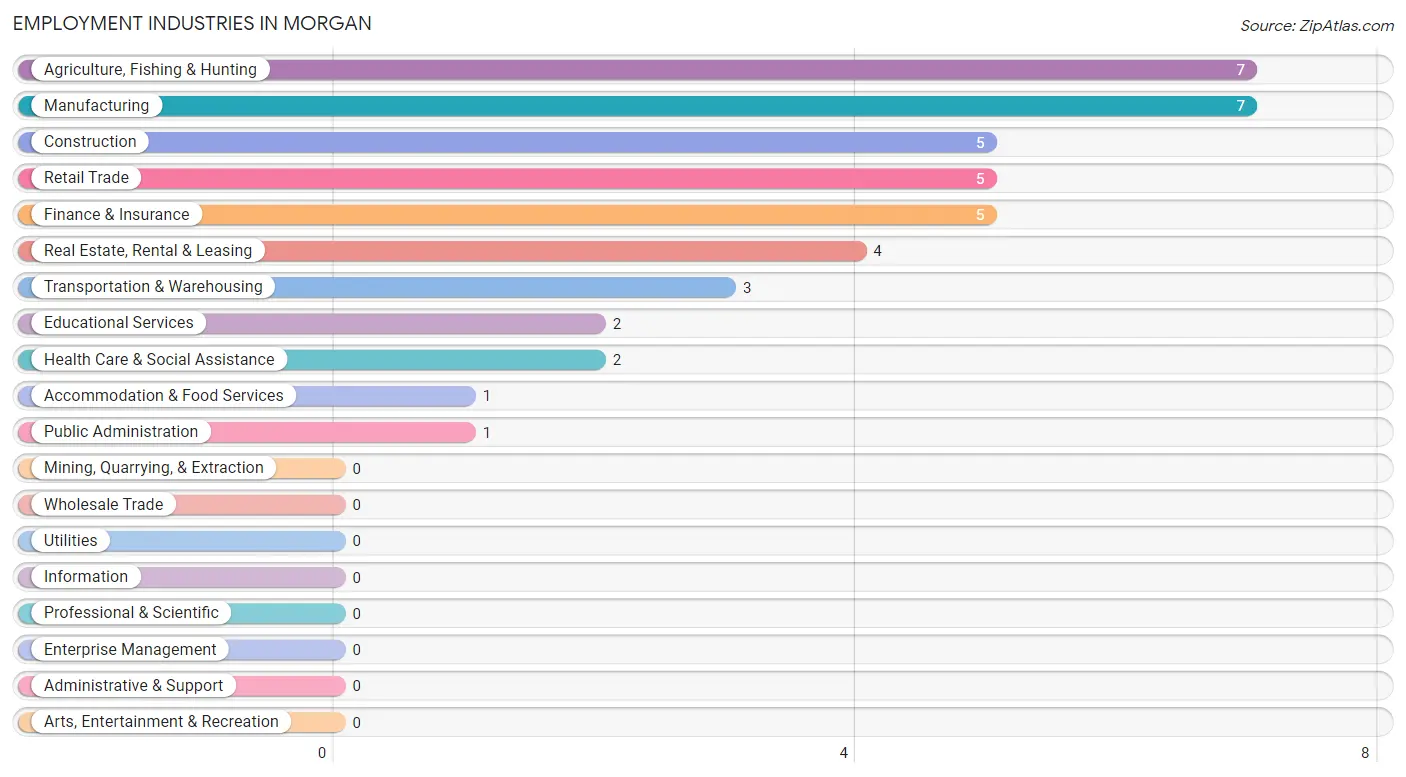
Employment Industries in Morgan
The major employment industries in Morgan include Agriculture, Fishing & Hunting (7 | 14.0%), Manufacturing (7 | 14.0%), Construction (5 | 10.0%), Retail Trade (5 | 10.0%), and Finance & Insurance (5 | 10.0%).
Employment Industries by Sex in Morgan
The Morgan industries that see more men than women are Agriculture, Fishing & Hunting (100.0%), Construction (100.0%), and Retail Trade (100.0%), whereas the industries that tend to have a higher number of women are Finance & Insurance (100.0%), Educational Services (100.0%), and Health Care & Social Assistance (100.0%).
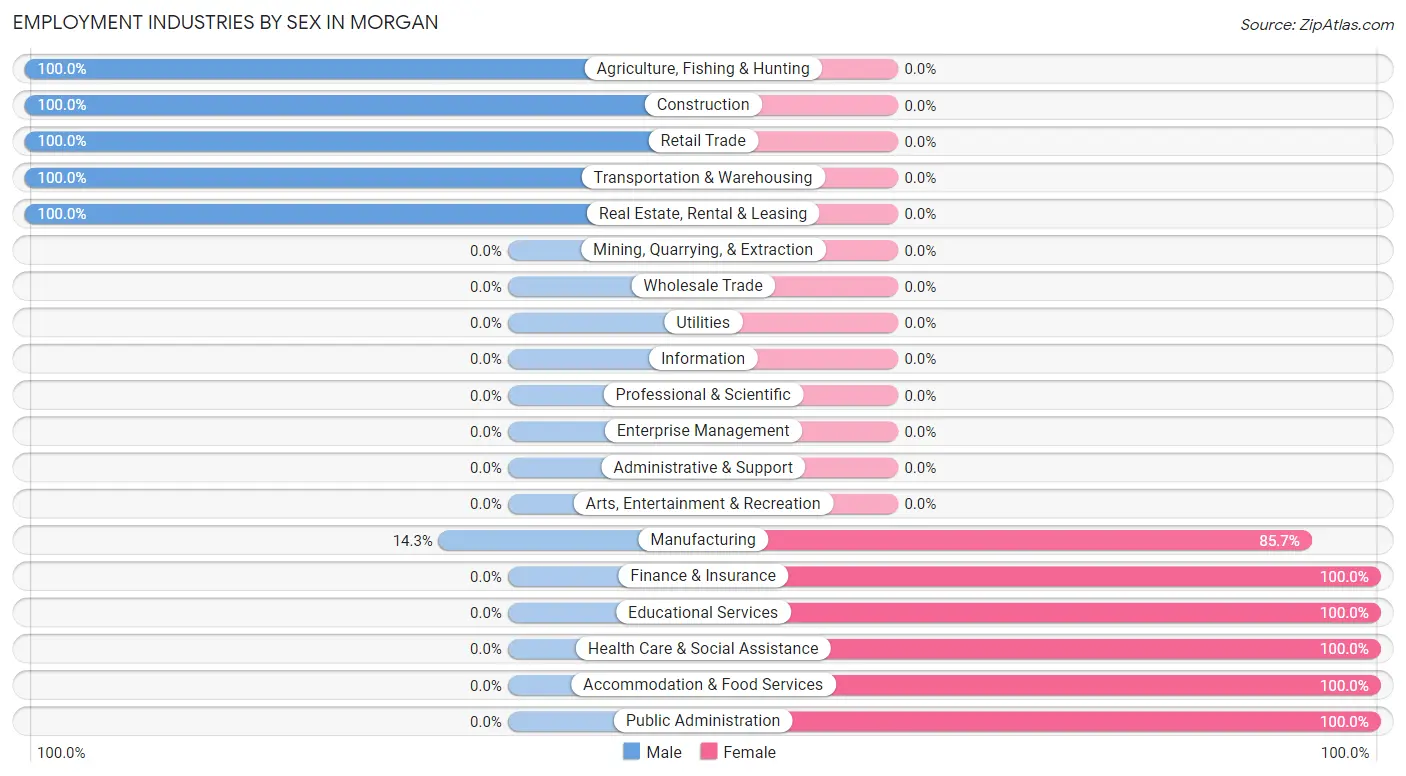
| Industry | Male | Female |
| Agriculture, Fishing & Hunting | 7 (100.0%) | 0 (0.0%) |
| Mining, Quarrying, & Extraction | 0 (0.0%) | 0 (0.0%) |
| Construction | 5 (100.0%) | 0 (0.0%) |
| Manufacturing | 1 (14.3%) | 6 (85.7%) |
| Wholesale Trade | 0 (0.0%) | 0 (0.0%) |
| Retail Trade | 5 (100.0%) | 0 (0.0%) |
| Transportation & Warehousing | 3 (100.0%) | 0 (0.0%) |
| Utilities | 0 (0.0%) | 0 (0.0%) |
| Information | 0 (0.0%) | 0 (0.0%) |
| Finance & Insurance | 0 (0.0%) | 5 (100.0%) |
| Real Estate, Rental & Leasing | 4 (100.0%) | 0 (0.0%) |
| Professional & Scientific | 0 (0.0%) | 0 (0.0%) |
| Enterprise Management | 0 (0.0%) | 0 (0.0%) |
| Administrative & Support | 0 (0.0%) | 0 (0.0%) |
| Educational Services | 0 (0.0%) | 2 (100.0%) |
| Health Care & Social Assistance | 0 (0.0%) | 2 (100.0%) |
| Arts, Entertainment & Recreation | 0 (0.0%) | 0 (0.0%) |
| Accommodation & Food Services | 0 (0.0%) | 1 (100.0%) |
| Public Administration | 0 (0.0%) | 1 (100.0%) |
| Total | 33 (66.0%) | 17 (34.0%) |
Education in Morgan
School Enrollment in Morgan
The most common levels of schooling among the 137 students in Morgan are college / undergraduate (65 | 47.4%), high school (45 | 32.9%), and nursery / preschool (11 | 8.0%).
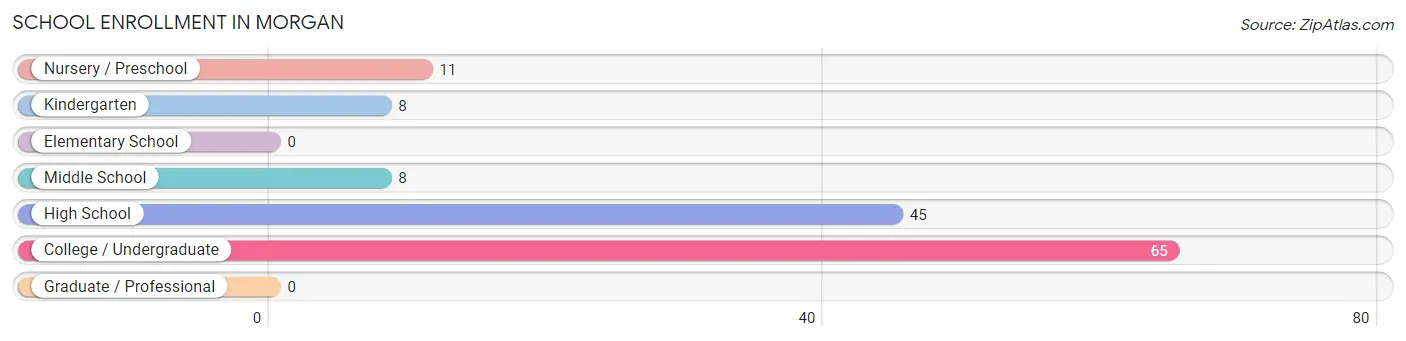
| School Level | # Students | % Students |
| Nursery / Preschool | 11 | 8.0% |
| Kindergarten | 8 | 5.8% |
| Elementary School | 0 | 0.0% |
| Middle School | 8 | 5.8% |
| High School | 45 | 32.9% |
| College / Undergraduate | 65 | 47.4% |
| Graduate / Professional | 0 | 0.0% |
| Total | 137 | 100.0% |
School Enrollment by Age by Funding Source in Morgan
Out of a total of 137 students who are enrolled in schools in Morgan, 61 (44.5%) attend a private institution, while the remaining 76 (55.5%) are enrolled in public schools. The age group of 3 to 4 year olds has the highest likelihood of being enrolled in private schools, with 8 (100.0% in the age bracket) enrolled. Conversely, the age group of 10 to 14 year olds has the lowest likelihood of being enrolled in a private school, with 2 (100.0% in the age bracket) attending a public institution.
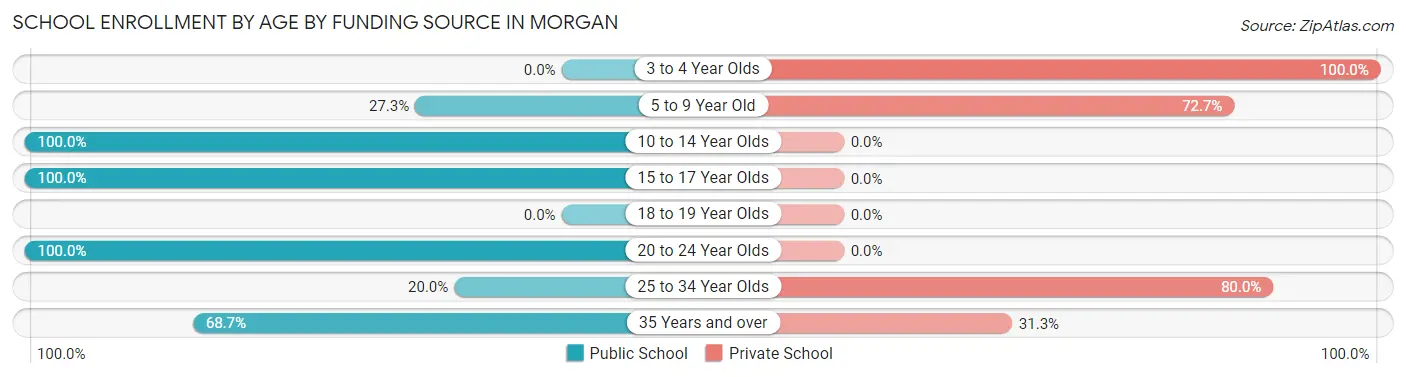
| Age Bracket | Public School | Private School |
| 3 to 4 Year Olds | 0 (0.0%) | 8 (100.0%) |
| 5 to 9 Year Old | 3 (27.3%) | 8 (72.7%) |
| 10 to 14 Year Olds | 2 (100.0%) | 0 (0.0%) |
| 15 to 17 Year Olds | 2 (100.0%) | 0 (0.0%) |
| 18 to 19 Year Olds | 0 (0.0%) | 0 (0.0%) |
| 20 to 24 Year Olds | 17 (100.0%) | 0 (0.0%) |
| 25 to 34 Year Olds | 6 (20.0%) | 24 (80.0%) |
| 35 Years and over | 46 (68.7%) | 21 (31.3%) |
| Total | 76 (55.5%) | 61 (44.5%) |
Educational Attainment by Field of Study in Morgan
Communications (21 | 26.3%), business (14 | 17.5%), education (14 | 17.5%), liberal arts & history (10 | 12.5%), and social sciences (7 | 8.7%) are the most common fields of study among 80 individuals in Morgan who have obtained a bachelor's degree or higher.
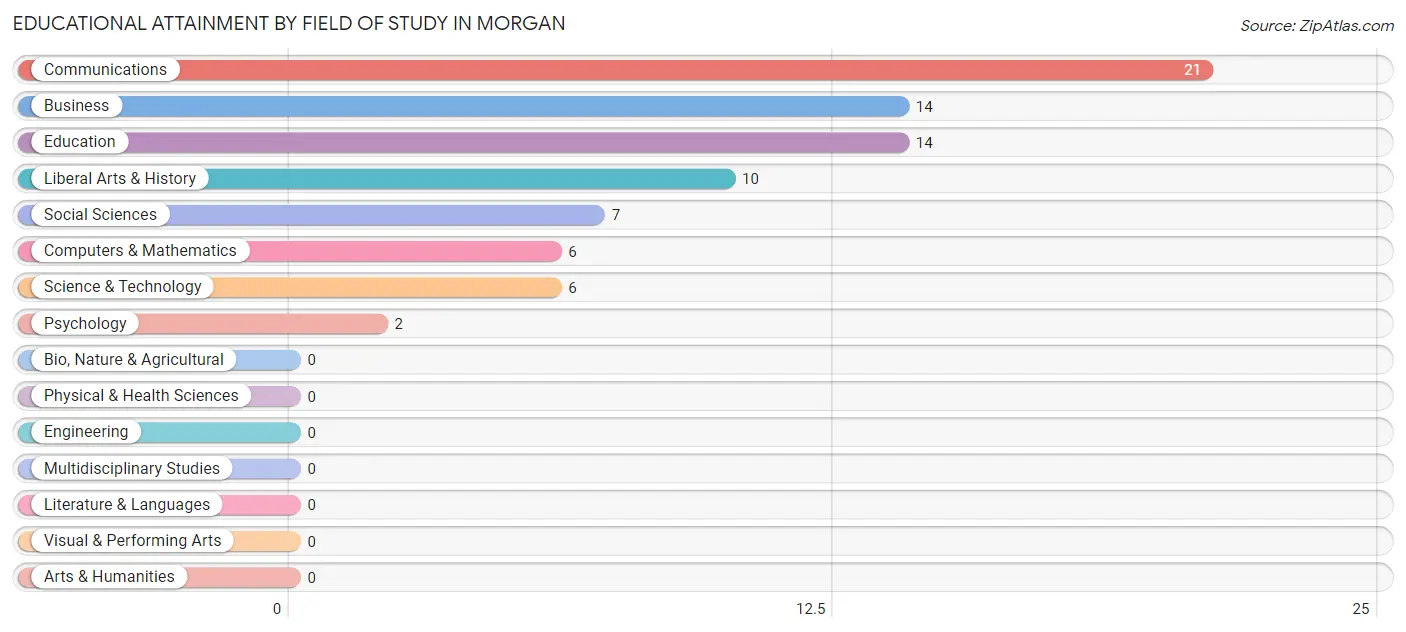
| Field of Study | # Graduates | % Graduates |
| Computers & Mathematics | 6 | 7.5% |
| Bio, Nature & Agricultural | 0 | 0.0% |
| Physical & Health Sciences | 0 | 0.0% |
| Psychology | 2 | 2.5% |
| Social Sciences | 7 | 8.7% |
| Engineering | 0 | 0.0% |
| Multidisciplinary Studies | 0 | 0.0% |
| Science & Technology | 6 | 7.5% |
| Business | 14 | 17.5% |
| Education | 14 | 17.5% |
| Literature & Languages | 0 | 0.0% |
| Liberal Arts & History | 10 | 12.5% |
| Visual & Performing Arts | 0 | 0.0% |
| Communications | 21 | 26.3% |
| Arts & Humanities | 0 | 0.0% |
| Total | 80 | 100.0% |
Transportation & Commute in Morgan
Vehicle Availability by Sex in Morgan
The most prevalent vehicle ownership categories in Morgan are males with 3 vehicles (11, accounting for 37.9%) and females with 3 vehicles (7, making up 68.8%).
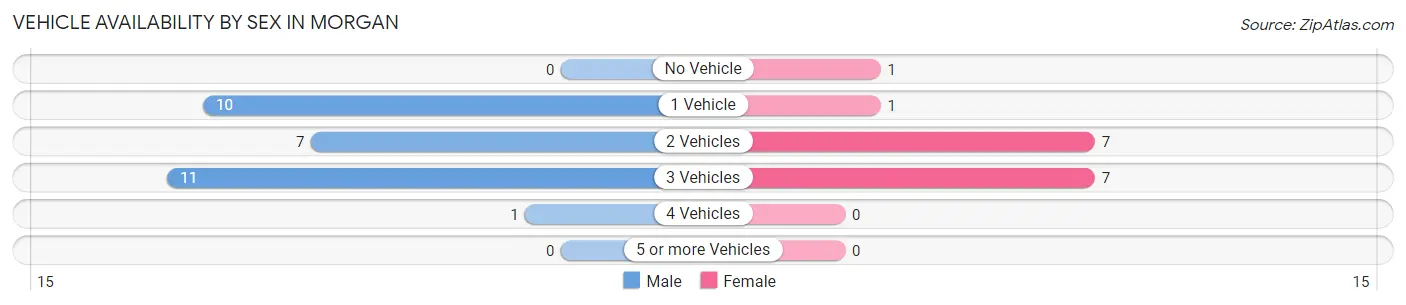
| Vehicles Available | Male | Female |
| No Vehicle | 0 (0.0%) | 1 (6.2%) |
| 1 Vehicle | 10 (34.5%) | 1 (6.2%) |
| 2 Vehicles | 7 (24.1%) | 7 (43.8%) |
| 3 Vehicles | 11 (37.9%) | 7 (43.8%) |
| 4 Vehicles | 1 (3.5%) | 0 (0.0%) |
| 5 or more Vehicles | 0 (0.0%) | 0 (0.0%) |
| Total | 29 (100.0%) | 16 (100.0%) |
Commute Time in Morgan
The most frequently occuring commute durations in Morgan are 10 to 14 minutes (11 commuters, 27.5%), less than 5 minutes (10 commuters, 25.0%), and 5 to 9 minutes (4 commuters, 10.0%).
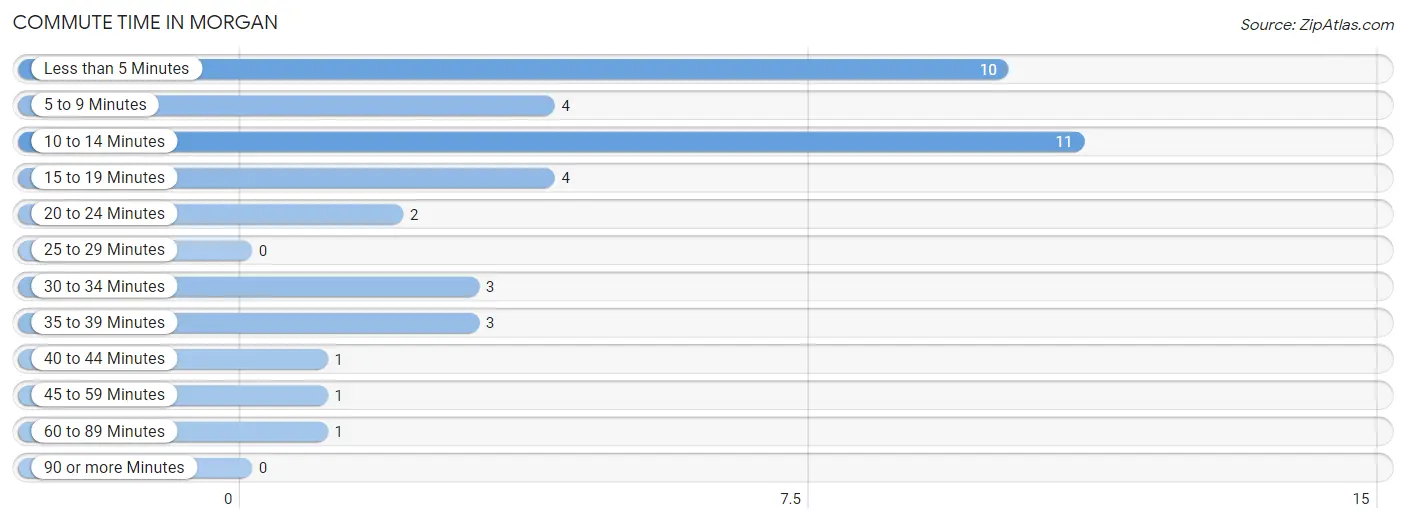
| Commute Time | # Commuters | % Commuters |
| Less than 5 Minutes | 10 | 25.0% |
| 5 to 9 Minutes | 4 | 10.0% |
| 10 to 14 Minutes | 11 | 27.5% |
| 15 to 19 Minutes | 4 | 10.0% |
| 20 to 24 Minutes | 2 | 5.0% |
| 25 to 29 Minutes | 0 | 0.0% |
| 30 to 34 Minutes | 3 | 7.5% |
| 35 to 39 Minutes | 3 | 7.5% |
| 40 to 44 Minutes | 1 | 2.5% |
| 45 to 59 Minutes | 1 | 2.5% |
| 60 to 89 Minutes | 1 | 2.5% |
| 90 or more Minutes | 0 | 0.0% |
Commute Time by Sex in Morgan
The most common commute times in Morgan are less than 5 minutes (10 commuters, 34.5%) for males and 10 to 14 minutes (4 commuters, 36.4%) for females.
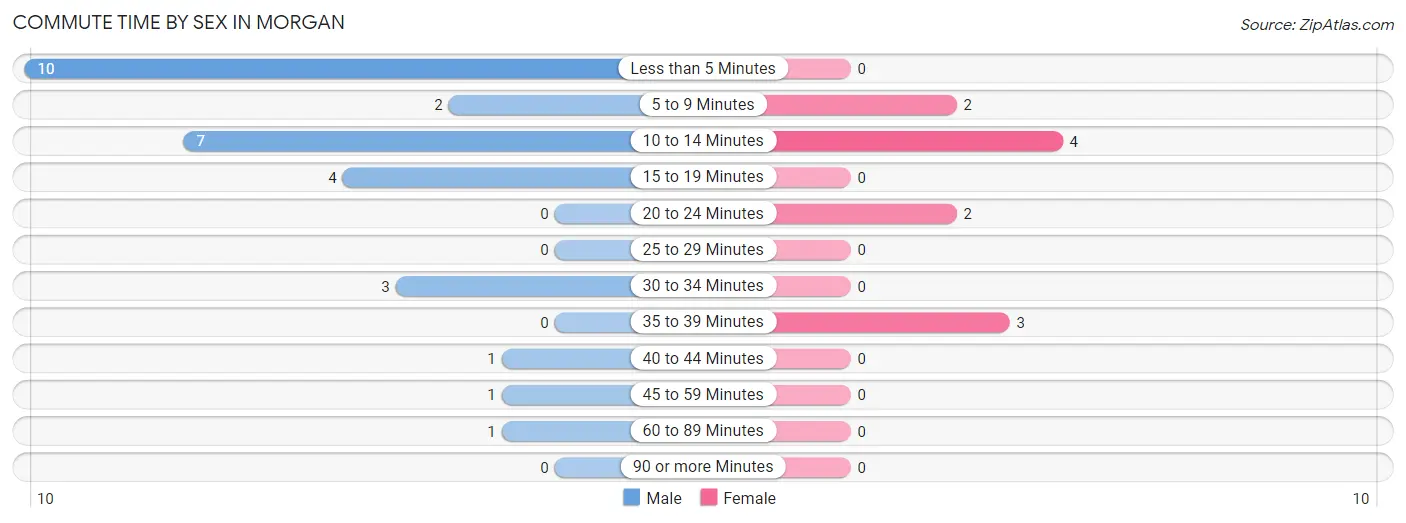
| Commute Time | Male | Female |
| Less than 5 Minutes | 10 (34.5%) | 0 (0.0%) |
| 5 to 9 Minutes | 2 (6.9%) | 2 (18.2%) |
| 10 to 14 Minutes | 7 (24.1%) | 4 (36.4%) |
| 15 to 19 Minutes | 4 (13.8%) | 0 (0.0%) |
| 20 to 24 Minutes | 0 (0.0%) | 2 (18.2%) |
| 25 to 29 Minutes | 0 (0.0%) | 0 (0.0%) |
| 30 to 34 Minutes | 3 (10.3%) | 0 (0.0%) |
| 35 to 39 Minutes | 0 (0.0%) | 3 (27.3%) |
| 40 to 44 Minutes | 1 (3.5%) | 0 (0.0%) |
| 45 to 59 Minutes | 1 (3.5%) | 0 (0.0%) |
| 60 to 89 Minutes | 1 (3.5%) | 0 (0.0%) |
| 90 or more Minutes | 0 (0.0%) | 0 (0.0%) |
Time of Departure to Work by Sex in Morgan
The most frequent times of departure to work in Morgan are 7:30 AM to 7:59 AM (9, 31.0%) for males and 7:30 AM to 7:59 AM (5, 45.5%) for females.
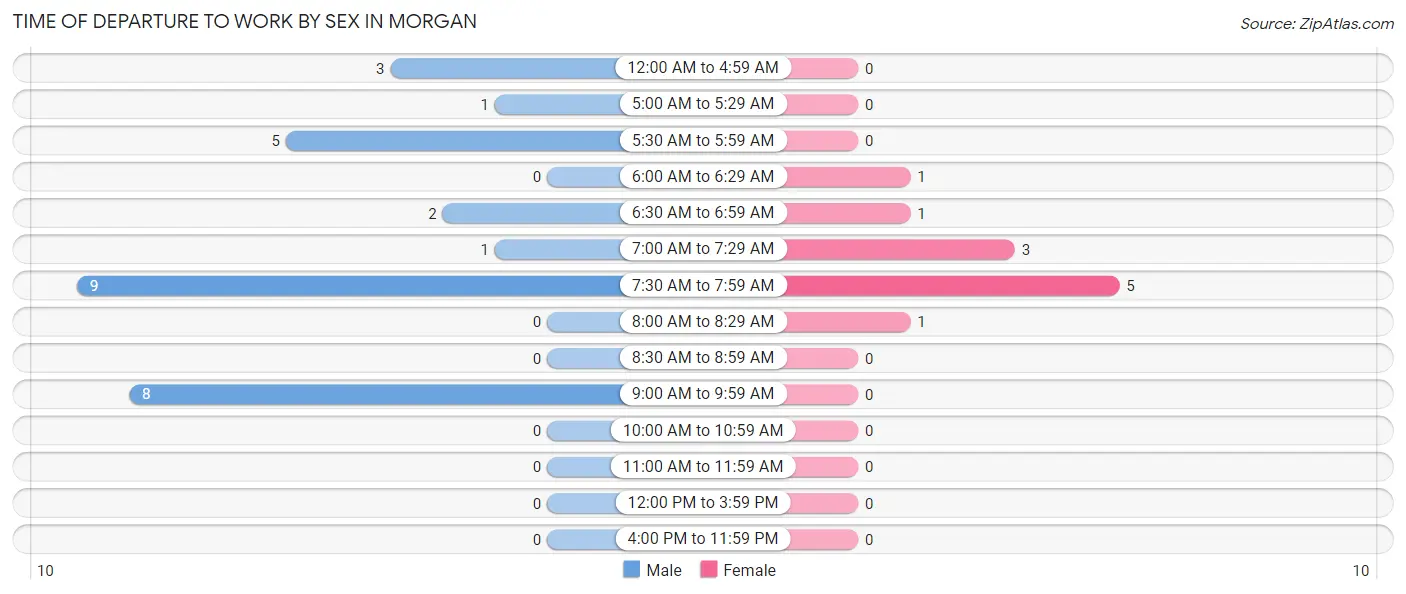
| Time of Departure | Male | Female |
| 12:00 AM to 4:59 AM | 3 (10.3%) | 0 (0.0%) |
| 5:00 AM to 5:29 AM | 1 (3.5%) | 0 (0.0%) |
| 5:30 AM to 5:59 AM | 5 (17.2%) | 0 (0.0%) |
| 6:00 AM to 6:29 AM | 0 (0.0%) | 1 (9.1%) |
| 6:30 AM to 6:59 AM | 2 (6.9%) | 1 (9.1%) |
| 7:00 AM to 7:29 AM | 1 (3.5%) | 3 (27.3%) |
| 7:30 AM to 7:59 AM | 9 (31.0%) | 5 (45.5%) |
| 8:00 AM to 8:29 AM | 0 (0.0%) | 1 (9.1%) |
| 8:30 AM to 8:59 AM | 0 (0.0%) | 0 (0.0%) |
| 9:00 AM to 9:59 AM | 8 (27.6%) | 0 (0.0%) |
| 10:00 AM to 10:59 AM | 0 (0.0%) | 0 (0.0%) |
| 11:00 AM to 11:59 AM | 0 (0.0%) | 0 (0.0%) |
| 12:00 PM to 3:59 PM | 0 (0.0%) | 0 (0.0%) |
| 4:00 PM to 11:59 PM | 0 (0.0%) | 0 (0.0%) |
| Total | 29 (100.0%) | 11 (100.0%) |
Housing Occupancy in Morgan
Occupancy by Ownership in Morgan
Of the total 95 dwellings in Morgan, owner-occupied units account for 70 (73.7%), while renter-occupied units make up 25 (26.3%).
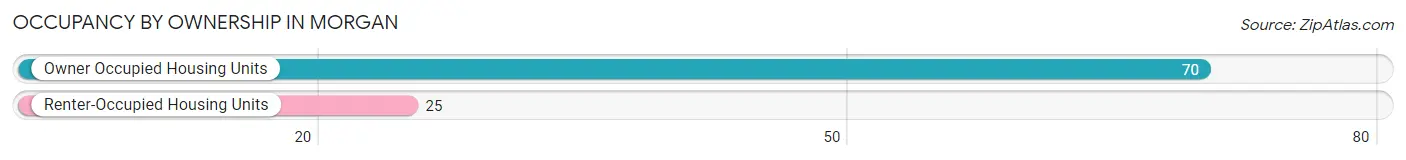
| Occupancy | # Housing Units | % Housing Units |
| Owner Occupied Housing Units | 70 | 73.7% |
| Renter-Occupied Housing Units | 25 | 26.3% |
| Total Occupied Housing Units | 95 | 100.0% |
Occupancy by Household Size in Morgan
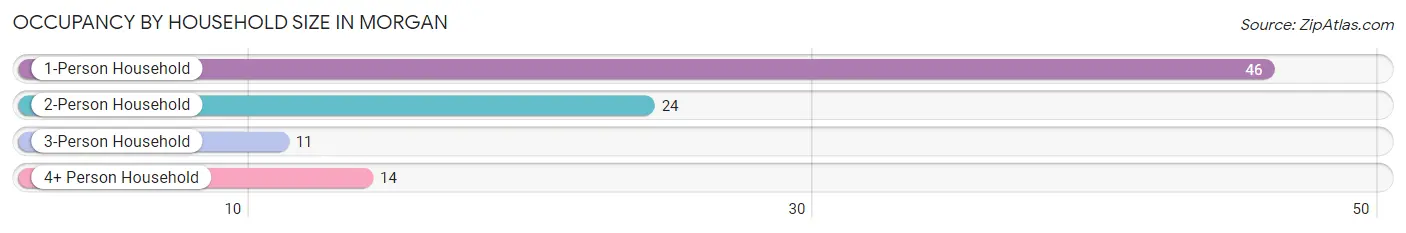
| Household Size | # Housing Units | % Housing Units |
| 1-Person Household | 46 | 48.4% |
| 2-Person Household | 24 | 25.3% |
| 3-Person Household | 11 | 11.6% |
| 4+ Person Household | 14 | 14.7% |
| Total Housing Units | 95 | 100.0% |
Occupancy by Ownership by Household Size in Morgan
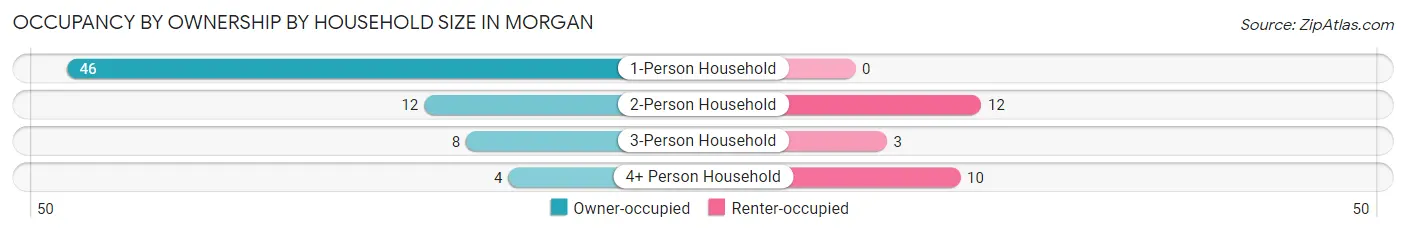
| Household Size | Owner-occupied | Renter-occupied |
| 1-Person Household | 46 (100.0%) | 0 (0.0%) |
| 2-Person Household | 12 (50.0%) | 12 (50.0%) |
| 3-Person Household | 8 (72.7%) | 3 (27.3%) |
| 4+ Person Household | 4 (28.6%) | 10 (71.4%) |
| Total Housing Units | 70 (73.7%) | 25 (26.3%) |
Occupancy by Educational Attainment in Morgan
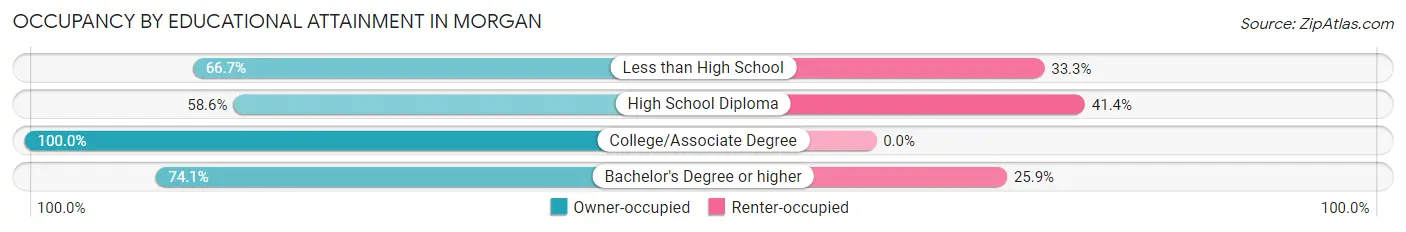
| Household Size | Owner-occupied | Renter-occupied |
| Less than High School | 12 (66.7%) | 6 (33.3%) |
| High School Diploma | 17 (58.6%) | 12 (41.4%) |
| College/Associate Degree | 21 (100.0%) | 0 (0.0%) |
| Bachelor's Degree or higher | 20 (74.1%) | 7 (25.9%) |
Occupancy by Age of Householder in Morgan
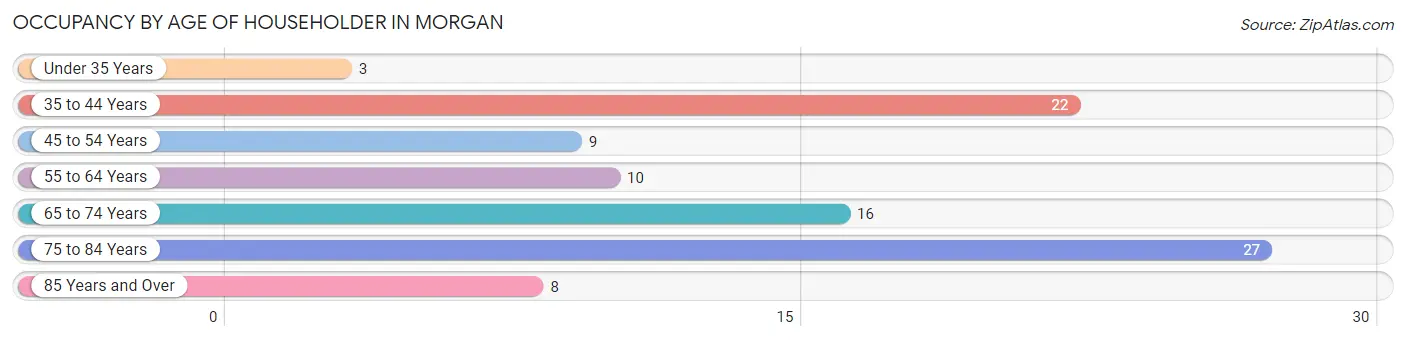
| Age Bracket | # Households | % Households |
| Under 35 Years | 3 | 3.2% |
| 35 to 44 Years | 22 | 23.2% |
| 45 to 54 Years | 9 | 9.5% |
| 55 to 64 Years | 10 | 10.5% |
| 65 to 74 Years | 16 | 16.8% |
| 75 to 84 Years | 27 | 28.4% |
| 85 Years and Over | 8 | 8.4% |
| Total | 95 | 100.0% |
Housing Finances in Morgan
Median Income by Occupancy in Morgan
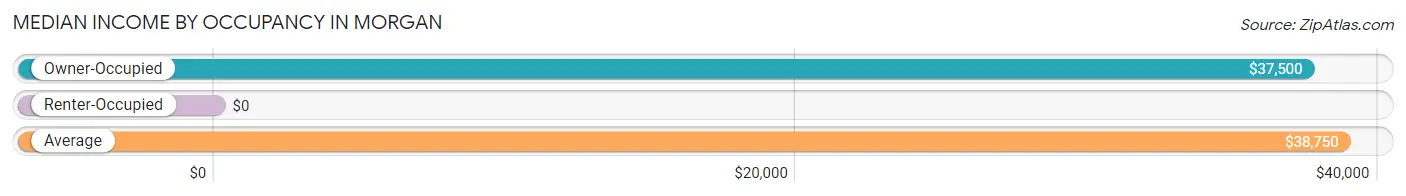
| Occupancy Type | # Households | Median Income |
| Owner-Occupied | 70 (73.7%) | $37,500 |
| Renter-Occupied | 25 (26.3%) | $0 |
| Average | 95 (100.0%) | $38,750 |
Occupancy by Householder Income Bracket in Morgan
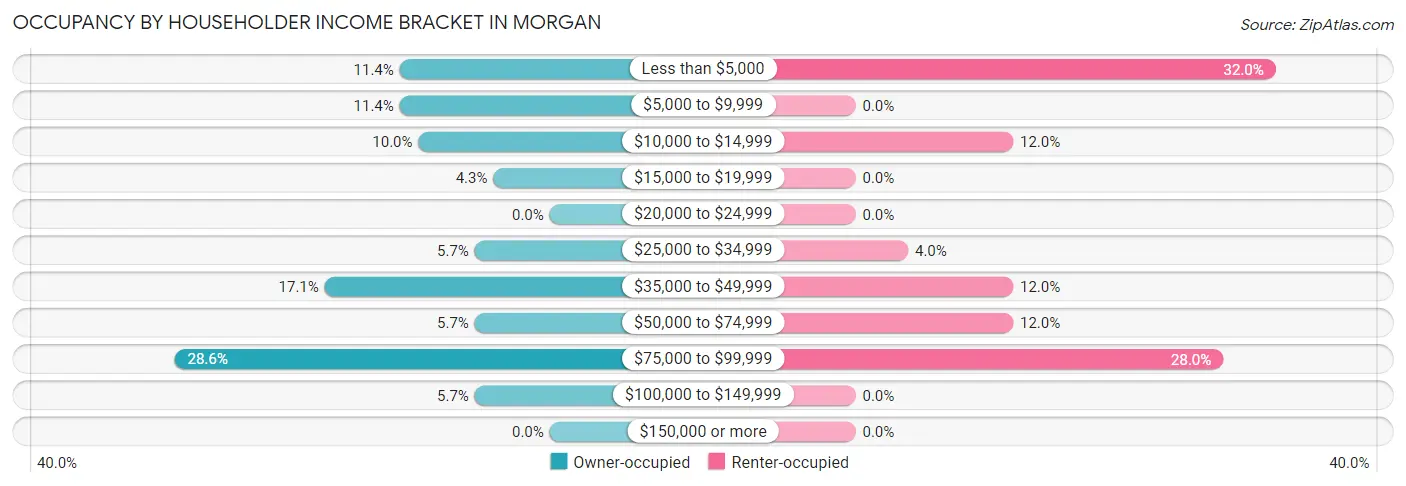
| Income Bracket | Owner-occupied | Renter-occupied |
| Less than $5,000 | 8 (11.4%) | 8 (32.0%) |
| $5,000 to $9,999 | 8 (11.4%) | 0 (0.0%) |
| $10,000 to $14,999 | 7 (10.0%) | 3 (12.0%) |
| $15,000 to $19,999 | 3 (4.3%) | 0 (0.0%) |
| $20,000 to $24,999 | 0 (0.0%) | 0 (0.0%) |
| $25,000 to $34,999 | 4 (5.7%) | 1 (4.0%) |
| $35,000 to $49,999 | 12 (17.1%) | 3 (12.0%) |
| $50,000 to $74,999 | 4 (5.7%) | 3 (12.0%) |
| $75,000 to $99,999 | 20 (28.6%) | 7 (28.0%) |
| $100,000 to $149,999 | 4 (5.7%) | 0 (0.0%) |
| $150,000 or more | 0 (0.0%) | 0 (0.0%) |
| Total | 70 (100.0%) | 25 (100.0%) |
Monthly Housing Cost Tiers in Morgan
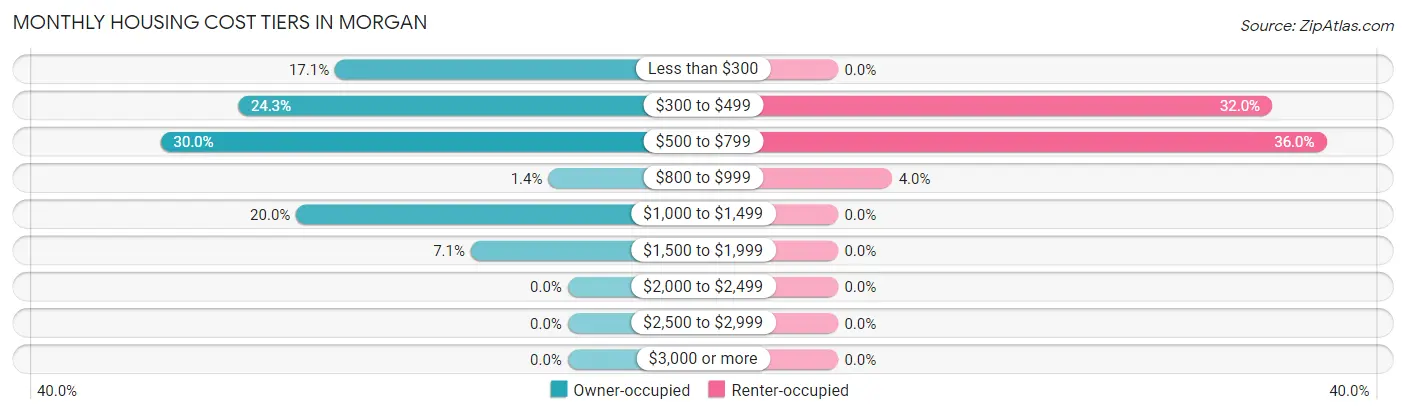
| Monthly Cost | Owner-occupied | Renter-occupied |
| Less than $300 | 12 (17.1%) | 0 (0.0%) |
| $300 to $499 | 17 (24.3%) | 8 (32.0%) |
| $500 to $799 | 21 (30.0%) | 9 (36.0%) |
| $800 to $999 | 1 (1.4%) | 1 (4.0%) |
| $1,000 to $1,499 | 14 (20.0%) | 0 (0.0%) |
| $1,500 to $1,999 | 5 (7.1%) | 0 (0.0%) |
| $2,000 to $2,499 | 0 (0.0%) | 0 (0.0%) |
| $2,500 to $2,999 | 0 (0.0%) | 0 (0.0%) |
| $3,000 or more | 0 (0.0%) | 0 (0.0%) |
| Total | 70 (100.0%) | 25 (100.0%) |
Physical Housing Characteristics in Morgan
Housing Structures in Morgan
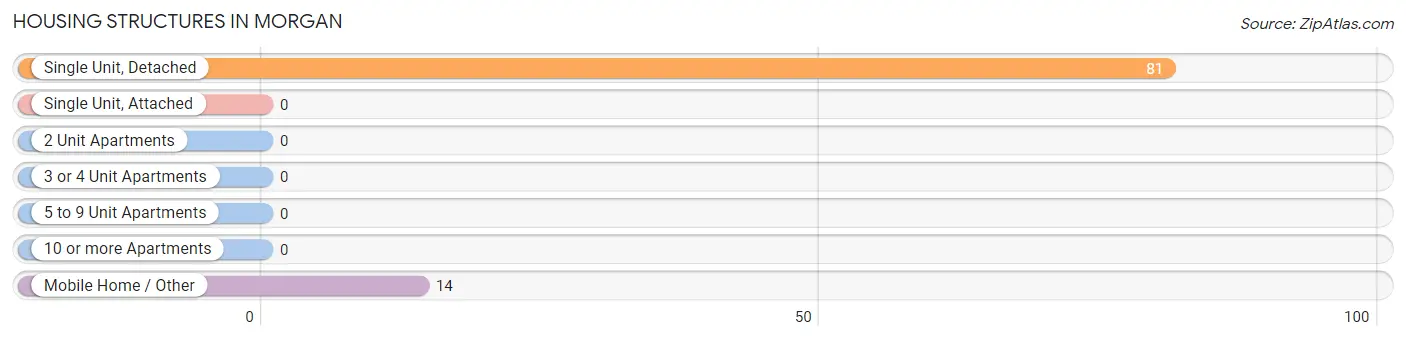
| Structure Type | # Housing Units | % Housing Units |
| Single Unit, Detached | 81 | 85.3% |
| Single Unit, Attached | 0 | 0.0% |
| 2 Unit Apartments | 0 | 0.0% |
| 3 or 4 Unit Apartments | 0 | 0.0% |
| 5 to 9 Unit Apartments | 0 | 0.0% |
| 10 or more Apartments | 0 | 0.0% |
| Mobile Home / Other | 14 | 14.7% |
| Total | 95 | 100.0% |
Housing Structures by Occupancy in Morgan
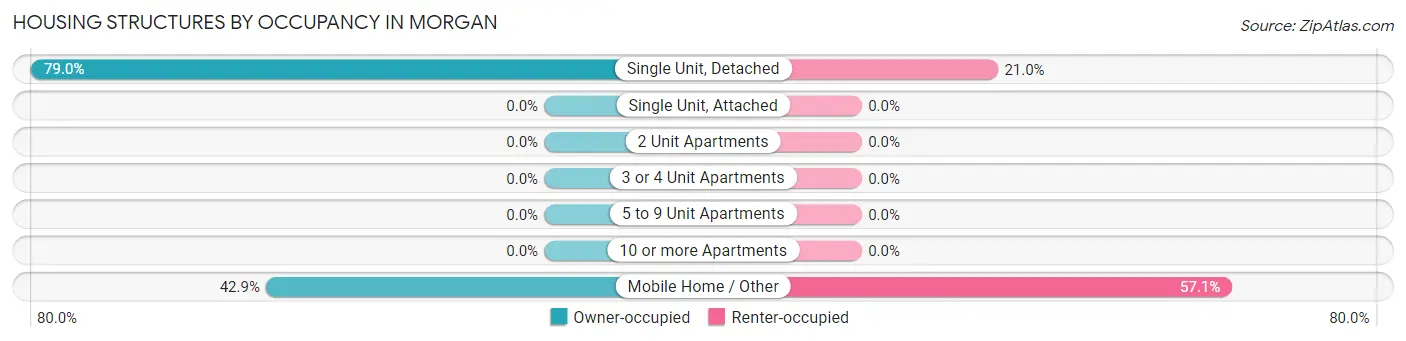
| Structure Type | Owner-occupied | Renter-occupied |
| Single Unit, Detached | 64 (79.0%) | 17 (21.0%) |
| Single Unit, Attached | 0 (0.0%) | 0 (0.0%) |
| 2 Unit Apartments | 0 (0.0%) | 0 (0.0%) |
| 3 or 4 Unit Apartments | 0 (0.0%) | 0 (0.0%) |
| 5 to 9 Unit Apartments | 0 (0.0%) | 0 (0.0%) |
| 10 or more Apartments | 0 (0.0%) | 0 (0.0%) |
| Mobile Home / Other | 6 (42.9%) | 8 (57.1%) |
| Total | 70 (73.7%) | 25 (26.3%) |
Housing Structures by Number of Rooms in Morgan

| Number of Rooms | Owner-occupied | Renter-occupied |
| 1 Room | 0 (0.0%) | 0 (0.0%) |
| 2 or 3 Rooms | 0 (0.0%) | 0 (0.0%) |
| 4 or 5 Rooms | 33 (47.1%) | 14 (56.0%) |
| 6 or 7 Rooms | 28 (40.0%) | 3 (12.0%) |
| 8 or more Rooms | 9 (12.9%) | 8 (32.0%) |
| Total | 70 (100.0%) | 25 (100.0%) |
Housing Structure by Heating Type in Morgan
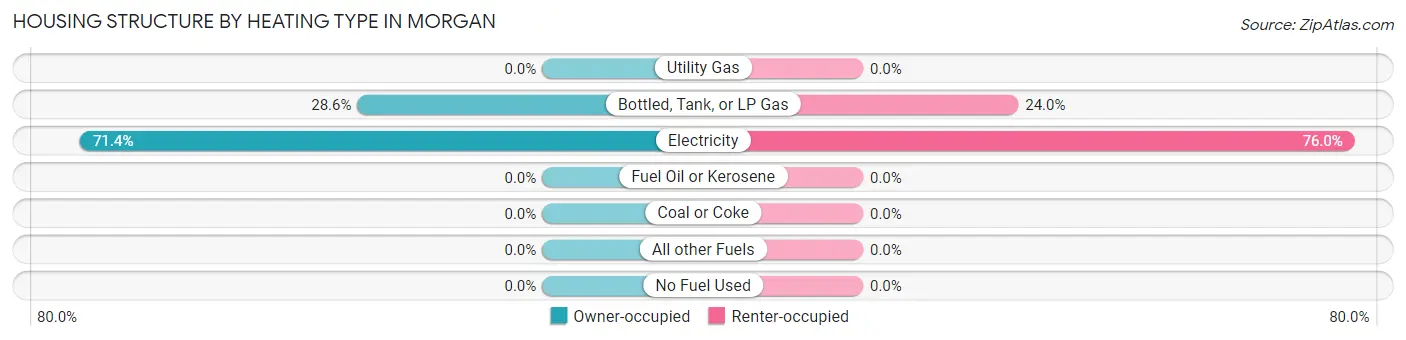
| Heating Type | Owner-occupied | Renter-occupied |
| Utility Gas | 0 (0.0%) | 0 (0.0%) |
| Bottled, Tank, or LP Gas | 20 (28.6%) | 6 (24.0%) |
| Electricity | 50 (71.4%) | 19 (76.0%) |
| Fuel Oil or Kerosene | 0 (0.0%) | 0 (0.0%) |
| Coal or Coke | 0 (0.0%) | 0 (0.0%) |
| All other Fuels | 0 (0.0%) | 0 (0.0%) |
| No Fuel Used | 0 (0.0%) | 0 (0.0%) |
| Total | 70 (100.0%) | 25 (100.0%) |
Household Vehicle Usage in Morgan
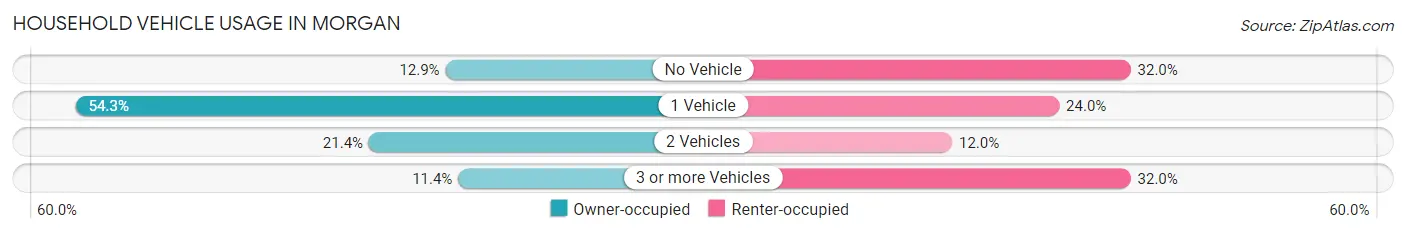
| Vehicles per Household | Owner-occupied | Renter-occupied |
| No Vehicle | 9 (12.9%) | 8 (32.0%) |
| 1 Vehicle | 38 (54.3%) | 6 (24.0%) |
| 2 Vehicles | 15 (21.4%) | 3 (12.0%) |
| 3 or more Vehicles | 8 (11.4%) | 8 (32.0%) |
| Total | 70 (100.0%) | 25 (100.0%) |
Real Estate & Mortgages in Morgan
Real Estate and Mortgage Overview in Morgan
| Characteristic | Without Mortgage | With Mortgage |
| Housing Units | 40 | 30 |
| Median Property Value | $86,700 | $87,100 |
| Median Household Income | $40,000 | $0 |
| Monthly Housing Costs | $418 | $0 |
| Real Estate Taxes | $867 | $1 |
Property Value by Mortgage Status in Morgan
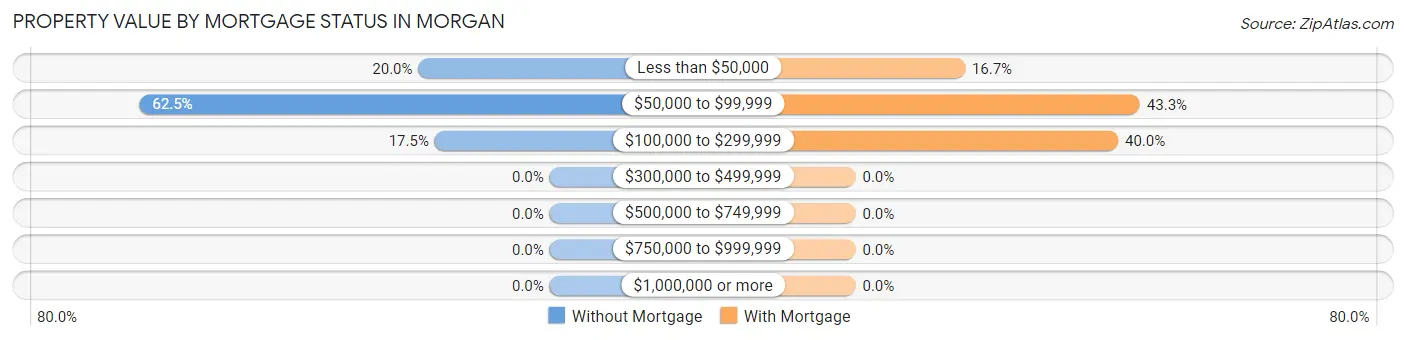
| Property Value | Without Mortgage | With Mortgage |
| Less than $50,000 | 8 (20.0%) | 5 (16.7%) |
| $50,000 to $99,999 | 25 (62.5%) | 13 (43.3%) |
| $100,000 to $299,999 | 7 (17.5%) | 12 (40.0%) |
| $300,000 to $499,999 | 0 (0.0%) | 0 (0.0%) |
| $500,000 to $749,999 | 0 (0.0%) | 0 (0.0%) |
| $750,000 to $999,999 | 0 (0.0%) | 0 (0.0%) |
| $1,000,000 or more | 0 (0.0%) | 0 (0.0%) |
| Total | 40 (100.0%) | 30 (100.0%) |
Household Income by Mortgage Status in Morgan
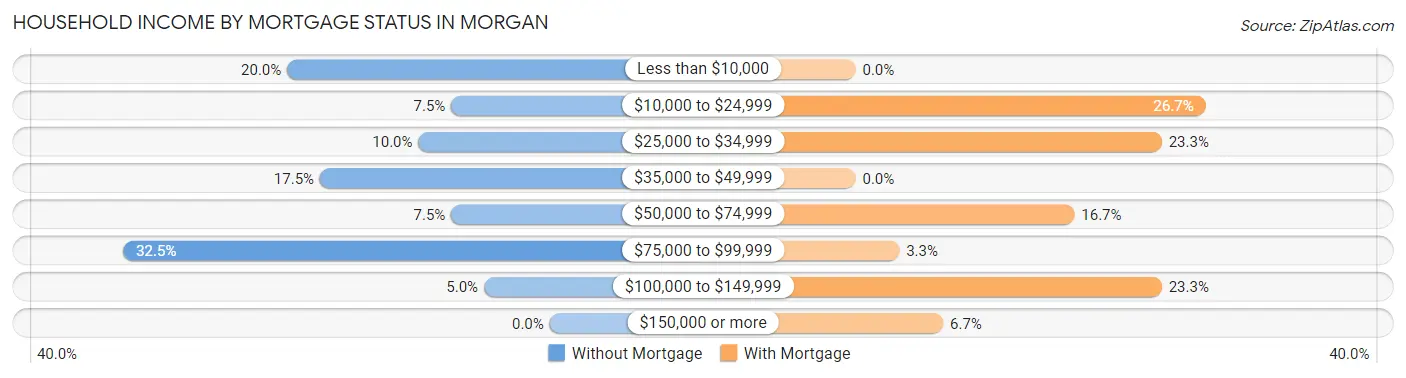
| Household Income | Without Mortgage | With Mortgage |
| Less than $10,000 | 8 (20.0%) | 0 (0.0%) |
| $10,000 to $24,999 | 3 (7.5%) | 8 (26.7%) |
| $25,000 to $34,999 | 4 (10.0%) | 7 (23.3%) |
| $35,000 to $49,999 | 7 (17.5%) | 0 (0.0%) |
| $50,000 to $74,999 | 3 (7.5%) | 5 (16.7%) |
| $75,000 to $99,999 | 13 (32.5%) | 1 (3.3%) |
| $100,000 to $149,999 | 2 (5.0%) | 7 (23.3%) |
| $150,000 or more | 0 (0.0%) | 2 (6.7%) |
| Total | 40 (100.0%) | 30 (100.0%) |
Property Value to Household Income Ratio in Morgan
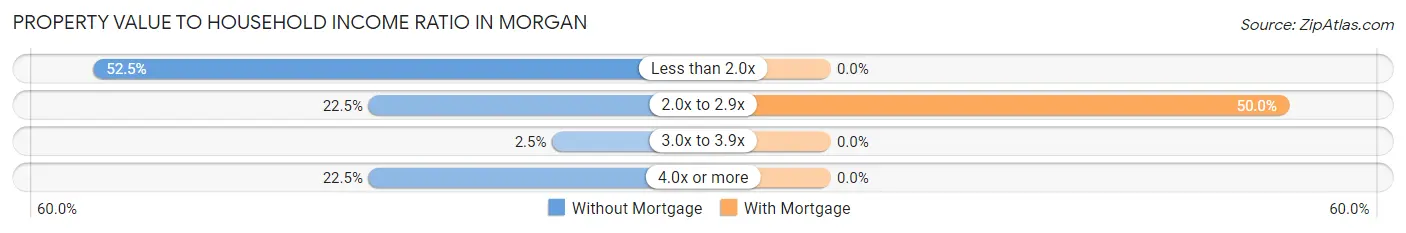
| Value-to-Income Ratio | Without Mortgage | With Mortgage |
| Less than 2.0x | 21 (52.5%) | 0 (0.0%) |
| 2.0x to 2.9x | 9 (22.5%) | 15 (50.0%) |
| 3.0x to 3.9x | 1 (2.5%) | 0 (0.0%) |
| 4.0x or more | 9 (22.5%) | 0 (0.0%) |
| Total | 40 (100.0%) | 30 (100.0%) |
Real Estate Taxes by Mortgage Status in Morgan
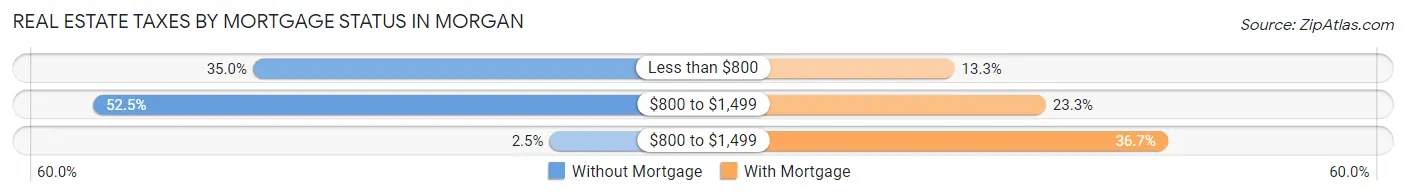
| Property Taxes | Without Mortgage | With Mortgage |
| Less than $800 | 14 (35.0%) | 4 (13.3%) |
| $800 to $1,499 | 21 (52.5%) | 7 (23.3%) |
| $800 to $1,499 | 1 (2.5%) | 11 (36.7%) |
| Total | 40 (100.0%) | 30 (100.0%) |
Health & Disability in Morgan
Health Insurance Coverage by Age in Morgan
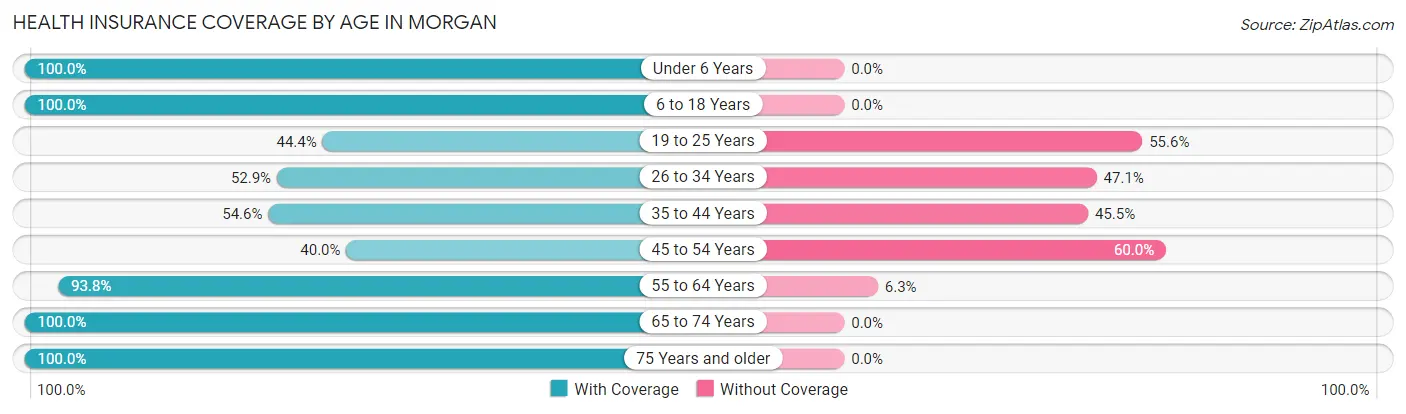
| Age Bracket | With Coverage | Without Coverage |
| Under 6 Years | 19 (100.0%) | 0 (0.0%) |
| 6 to 18 Years | 12 (100.0%) | 0 (0.0%) |
| 19 to 25 Years | 16 (44.4%) | 20 (55.6%) |
| 26 to 34 Years | 9 (52.9%) | 8 (47.1%) |
| 35 to 44 Years | 24 (54.5%) | 20 (45.5%) |
| 45 to 54 Years | 6 (40.0%) | 9 (60.0%) |
| 55 to 64 Years | 15 (93.8%) | 1 (6.2%) |
| 65 to 74 Years | 25 (100.0%) | 0 (0.0%) |
| 75 Years and older | 40 (100.0%) | 0 (0.0%) |
| Total | 166 (74.1%) | 58 (25.9%) |
Health Insurance Coverage by Citizenship Status in Morgan
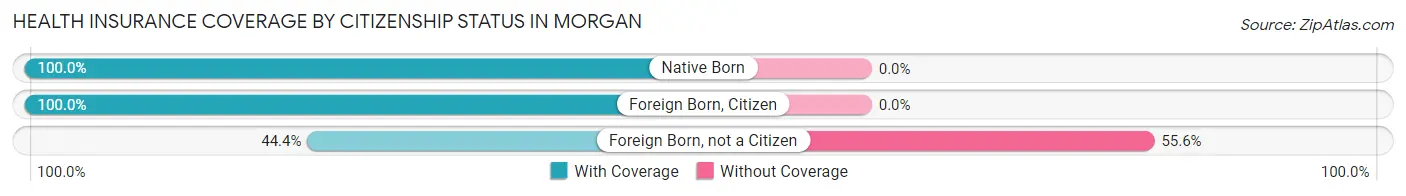
| Citizenship Status | With Coverage | Without Coverage |
| Native Born | 19 (100.0%) | 0 (0.0%) |
| Foreign Born, Citizen | 12 (100.0%) | 0 (0.0%) |
| Foreign Born, not a Citizen | 16 (44.4%) | 20 (55.6%) |
Health Insurance Coverage by Household Income in Morgan
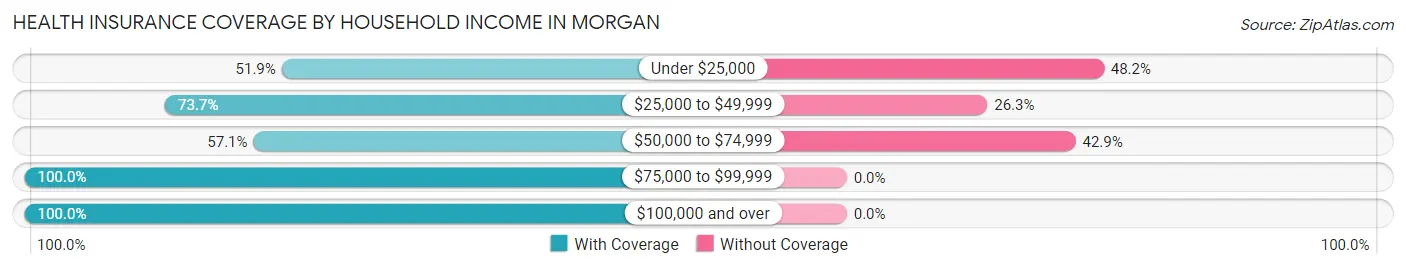
| Household Income | With Coverage | Without Coverage |
| Under $25,000 | 42 (51.8%) | 39 (48.1%) |
| $25,000 to $49,999 | 28 (73.7%) | 10 (26.3%) |
| $50,000 to $74,999 | 12 (57.1%) | 9 (42.9%) |
| $75,000 to $99,999 | 76 (100.0%) | 0 (0.0%) |
| $100,000 and over | 8 (100.0%) | 0 (0.0%) |
Public vs Private Health Insurance Coverage by Age in Morgan
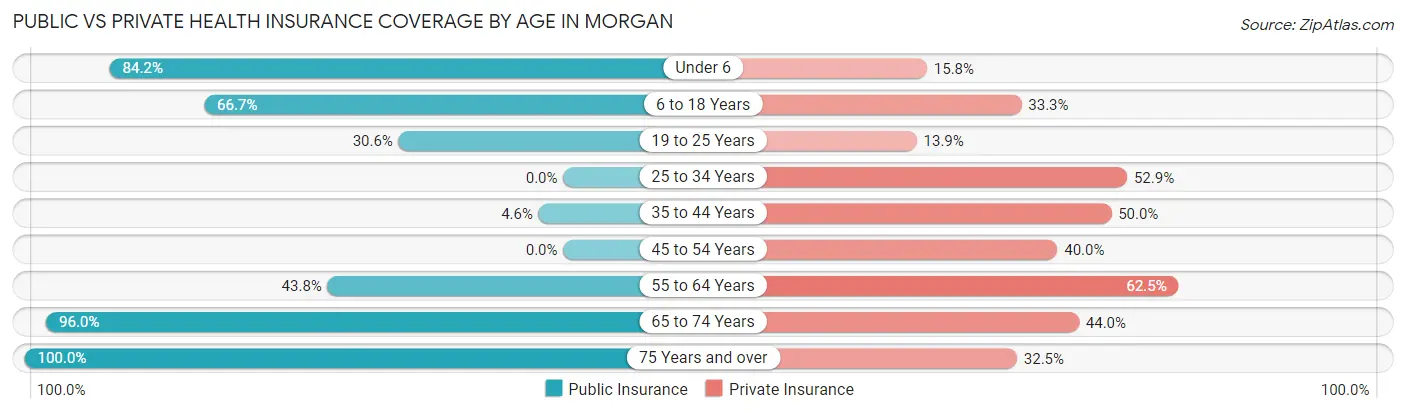
| Age Bracket | Public Insurance | Private Insurance |
| Under 6 | 16 (84.2%) | 3 (15.8%) |
| 6 to 18 Years | 8 (66.7%) | 4 (33.3%) |
| 19 to 25 Years | 11 (30.6%) | 5 (13.9%) |
| 25 to 34 Years | 0 (0.0%) | 9 (52.9%) |
| 35 to 44 Years | 2 (4.5%) | 22 (50.0%) |
| 45 to 54 Years | 0 (0.0%) | 6 (40.0%) |
| 55 to 64 Years | 7 (43.8%) | 10 (62.5%) |
| 65 to 74 Years | 24 (96.0%) | 11 (44.0%) |
| 75 Years and over | 40 (100.0%) | 13 (32.5%) |
| Total | 108 (48.2%) | 83 (37.0%) |
Disability Status by Sex by Age in Morgan
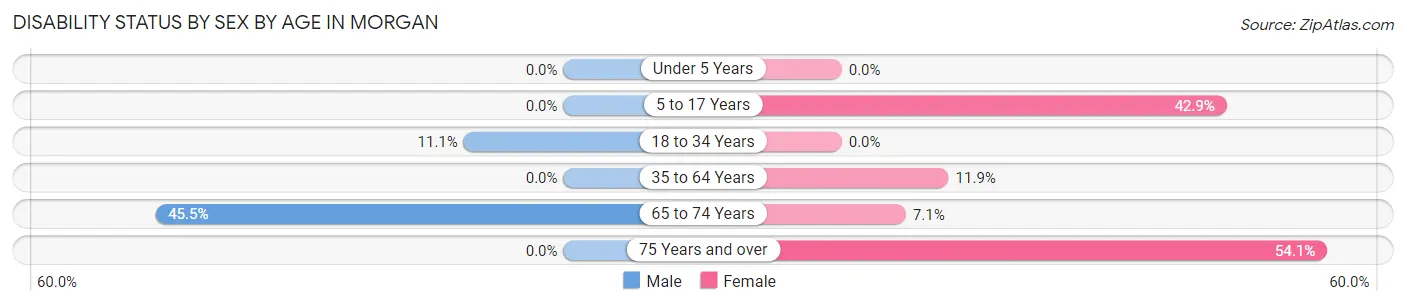
| Age Bracket | Male | Female |
| Under 5 Years | 0 (0.0%) | 0 (0.0%) |
| 5 to 17 Years | 0 (0.0%) | 3 (42.9%) |
| 18 to 34 Years | 1 (11.1%) | 0 (0.0%) |
| 35 to 64 Years | 0 (0.0%) | 5 (11.9%) |
| 65 to 74 Years | 5 (45.5%) | 1 (7.1%) |
| 75 Years and over | 0 (0.0%) | 20 (54.0%) |
Disability Class by Sex by Age in Morgan
Disability Class: Hearing Difficulty
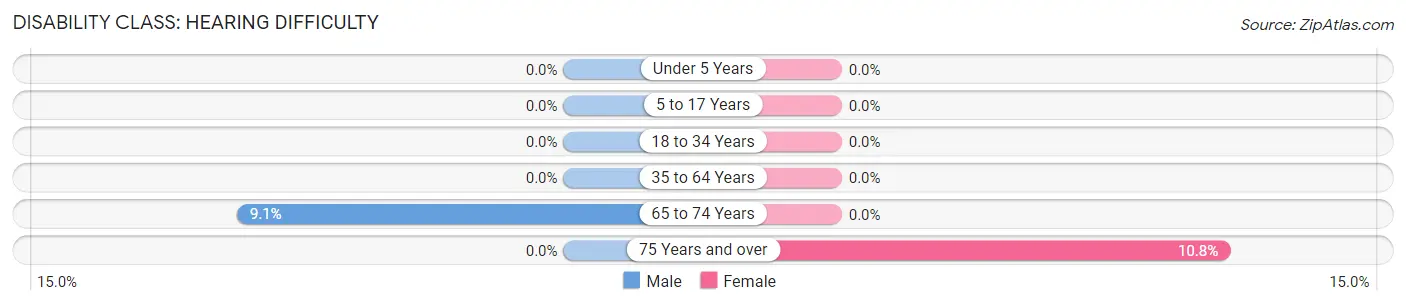
| Age Bracket | Male | Female |
| Under 5 Years | 0 (0.0%) | 0 (0.0%) |
| 5 to 17 Years | 0 (0.0%) | 0 (0.0%) |
| 18 to 34 Years | 0 (0.0%) | 0 (0.0%) |
| 35 to 64 Years | 0 (0.0%) | 0 (0.0%) |
| 65 to 74 Years | 1 (9.1%) | 0 (0.0%) |
| 75 Years and over | 0 (0.0%) | 4 (10.8%) |
Disability Class: Vision Difficulty
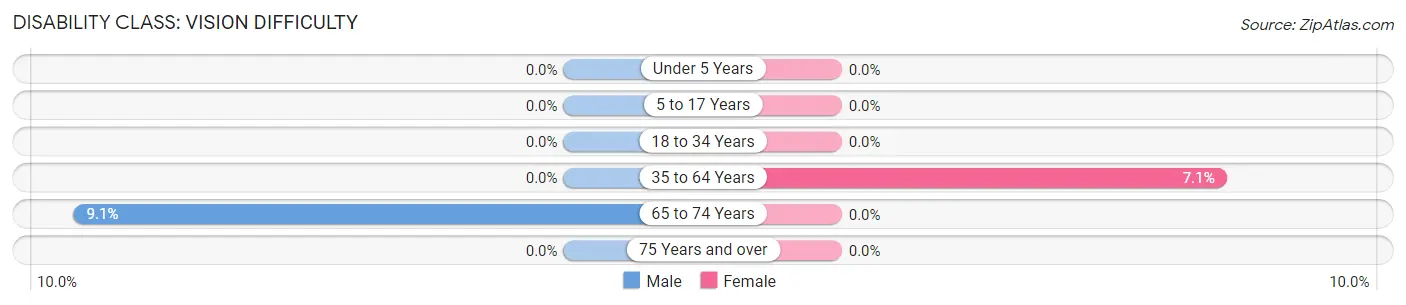
| Age Bracket | Male | Female |
| Under 5 Years | 0 (0.0%) | 0 (0.0%) |
| 5 to 17 Years | 0 (0.0%) | 0 (0.0%) |
| 18 to 34 Years | 0 (0.0%) | 0 (0.0%) |
| 35 to 64 Years | 0 (0.0%) | 3 (7.1%) |
| 65 to 74 Years | 1 (9.1%) | 0 (0.0%) |
| 75 Years and over | 0 (0.0%) | 0 (0.0%) |
Disability Class: Cognitive Difficulty
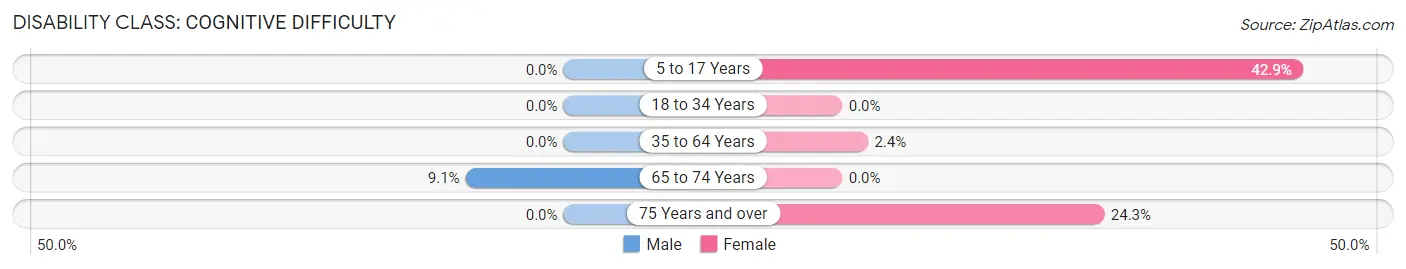
| Age Bracket | Male | Female |
| 5 to 17 Years | 0 (0.0%) | 3 (42.9%) |
| 18 to 34 Years | 0 (0.0%) | 0 (0.0%) |
| 35 to 64 Years | 0 (0.0%) | 1 (2.4%) |
| 65 to 74 Years | 1 (9.1%) | 0 (0.0%) |
| 75 Years and over | 0 (0.0%) | 9 (24.3%) |
Disability Class: Ambulatory Difficulty
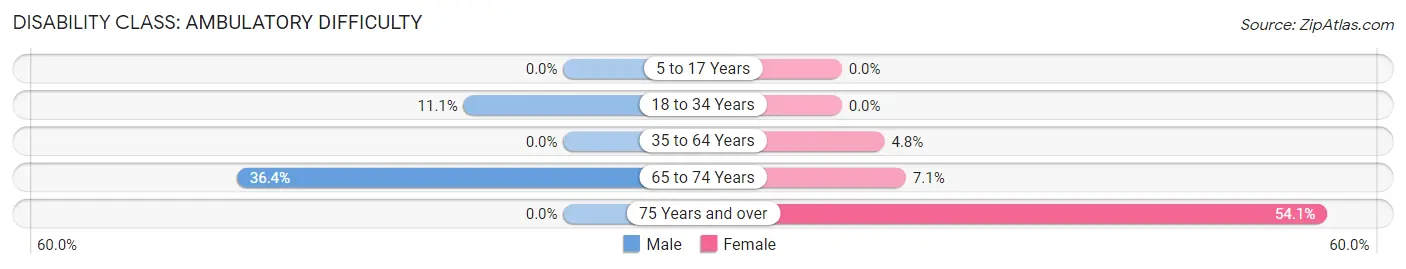
| Age Bracket | Male | Female |
| 5 to 17 Years | 0 (0.0%) | 0 (0.0%) |
| 18 to 34 Years | 1 (11.1%) | 0 (0.0%) |
| 35 to 64 Years | 0 (0.0%) | 2 (4.8%) |
| 65 to 74 Years | 4 (36.4%) | 1 (7.1%) |
| 75 Years and over | 0 (0.0%) | 20 (54.0%) |
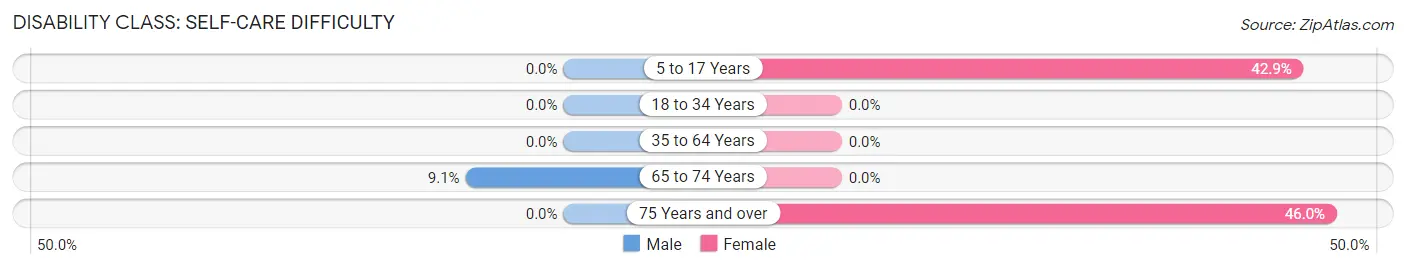
Disability Class: Self-Care Difficulty
| Age Bracket | Male | Female |
| 5 to 17 Years | 0 (0.0%) | 3 (42.9%) |
| 18 to 34 Years | 0 (0.0%) | 0 (0.0%) |
| 35 to 64 Years | 0 (0.0%) | 0 (0.0%) |
| 65 to 74 Years | 1 (9.1%) | 0 (0.0%) |
| 75 Years and over | 0 (0.0%) | 17 (46.0%) |
Technology Access in Morgan
Computing Device Access in Morgan
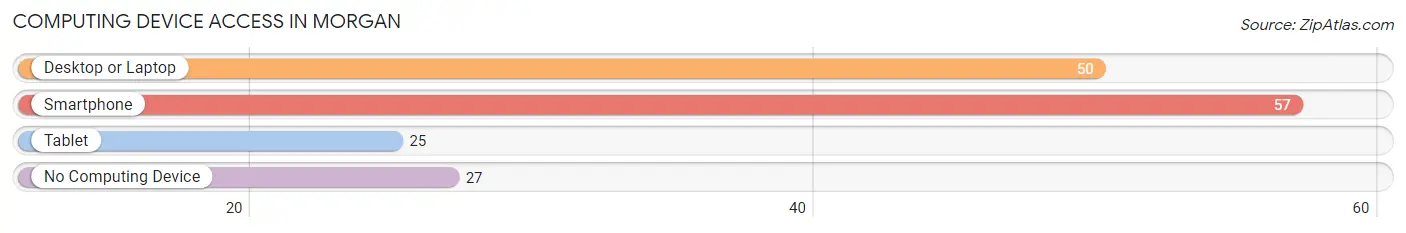
| Device Type | # Households | % Households |
| Desktop or Laptop | 50 | 52.6% |
| Smartphone | 57 | 60.0% |
| Tablet | 25 | 26.3% |
| No Computing Device | 27 | 28.4% |
| Total | 95 | 100.0% |
Internet Access in Morgan
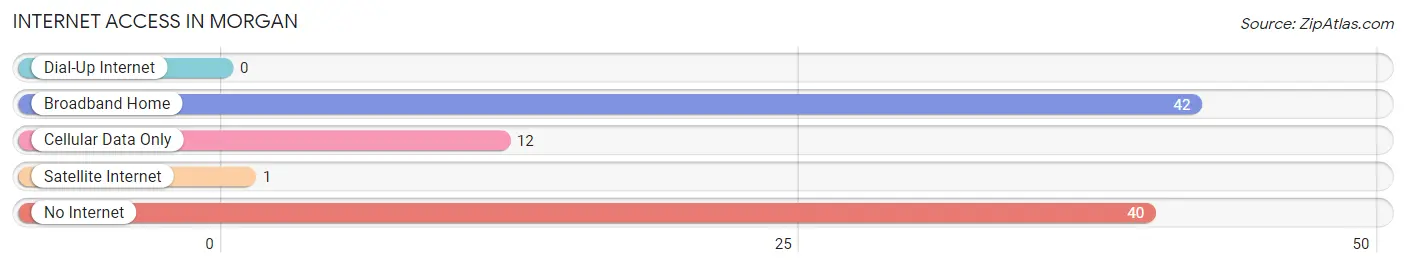
| Internet Type | # Households | % Households |
| Dial-Up Internet | 0 | 0.0% |
| Broadband Home | 42 | 44.2% |
| Cellular Data Only | 12 | 12.6% |
| Satellite Internet | 1 | 1.1% |
| No Internet | 40 | 42.1% |
| Total | 95 | 100.0% |
Morgan Summary
Morgan, Georgia is a small town located in the northeastern part of the state, in the foothills of the Appalachian Mountains. It is part of the larger metropolitan area of Atlanta, and is located about an hour and a half away from the city. The town has a population of just over 1,000 people, and is known for its rural charm and small-town atmosphere.
History
The area that is now Morgan, Georgia was first settled in the early 1800s by settlers from North Carolina. The town was originally known as “Morgan’s Crossroads”, named after the local postmaster, William Morgan. The town was officially incorporated in 1883, and the name was changed to Morgan.
In the late 1800s, the town was a major stop on the railroad line that ran from Atlanta to Chattanooga. This allowed the town to become a major trading center for the surrounding area. The town also had a thriving lumber industry, and was home to several sawmills.
In the early 1900s, the town began to decline as the railroad line was abandoned and the lumber industry moved away. The town was largely forgotten until the late 1970s, when it was rediscovered by a group of artists and musicians who moved to the area and began to revitalize the town.
Geography
Morgan is located in the northeastern part of Georgia, in the foothills of the Appalachian Mountains. The town is situated on the banks of the Chattahoochee River, and is surrounded by rolling hills and forests. The town is located about an hour and a half away from Atlanta, and is part of the larger metropolitan area.
The climate in Morgan is mild and temperate, with hot summers and cool winters. The average temperature in the summer is around 80 degrees Fahrenheit, and the average temperature in the winter is around 40 degrees Fahrenheit.
Economy
The economy of Morgan is largely based on tourism and agriculture. The town is home to several small businesses, including restaurants, shops, and galleries. The town is also home to several farms, which produce a variety of fruits and vegetables.
The town is also home to several wineries, which produce a variety of wines. The town is also home to several craft breweries, which produce a variety of craft beers.
Demographics
As of the 2010 census, the population of Morgan was 1,072. The racial makeup of the town was 94.3% White, 2.2% African American, 0.3% Native American, 0.7% Asian, 0.1% Pacific Islander, and 2.4% from other races. The median household income was $37,500, and the median age was 41.
Morgan is a small, rural town with a strong sense of community. The town is known for its friendly atmosphere and its commitment to preserving its rural charm. The town is also home to several festivals and events throughout the year, including the annual Morgan County Fair.
Common Questions
What is Per Capita Income in Morgan?
Per Capita income in Morgan is $4,271.
What is the Median Family Income in Morgan?
Median Family Income in Morgan is $75,208.
What is the Median Household income in Morgan?
Median Household Income in Morgan is $38,750.
What is Family Income Deficit in Morgan?
Family Income Deficit in Morgan is $14,585.
Families that are below poverty line in Morgan earn $14,585 less on average than the poverty threshold level.
What is Inequality or Gini Index in Morgan?
Inequality or Gini Index in Morgan is 0.46.
What is the Total Population of Morgan?
Total Population of Morgan is 1,832.
What is the Total Male Population of Morgan?
Total Male Population of Morgan is 1,671.
What is the Total Female Population of Morgan?
Total Female Population of Morgan is 161.
What is the Ratio of Males per 100 Females in Morgan?
There are 1,037.89 Males per 100 Females in Morgan.
What is the Ratio of Females per 100 Males in Morgan?
There are 9.63 Females per 100 Males in Morgan.
What is the Median Population Age in Morgan?
Median Population Age in Morgan is 37.0 Years.
What is the Average Family Size in Morgan
Average Family Size in Morgan is 3.7 People.
What is the Average Household Size in Morgan
Average Household Size in Morgan is 2.4 People.
How Large is the Labor Force in Morgan?
There are 81 People in the Labor Forcein in Morgan.
What is the Percentage of People in the Labor Force in Morgan?
4.5% of People are in the Labor Force in Morgan.
What is the Unemployment Rate in Morgan?
Unemployment Rate in Morgan is 39.0%.