Zip Codes with the Highest Percentage of Population with a Degree in Science and Engineering in Delaware
RELATED REPORTS & OPTIONS
Science and Engineering
Delaware
Compare Zip Codes
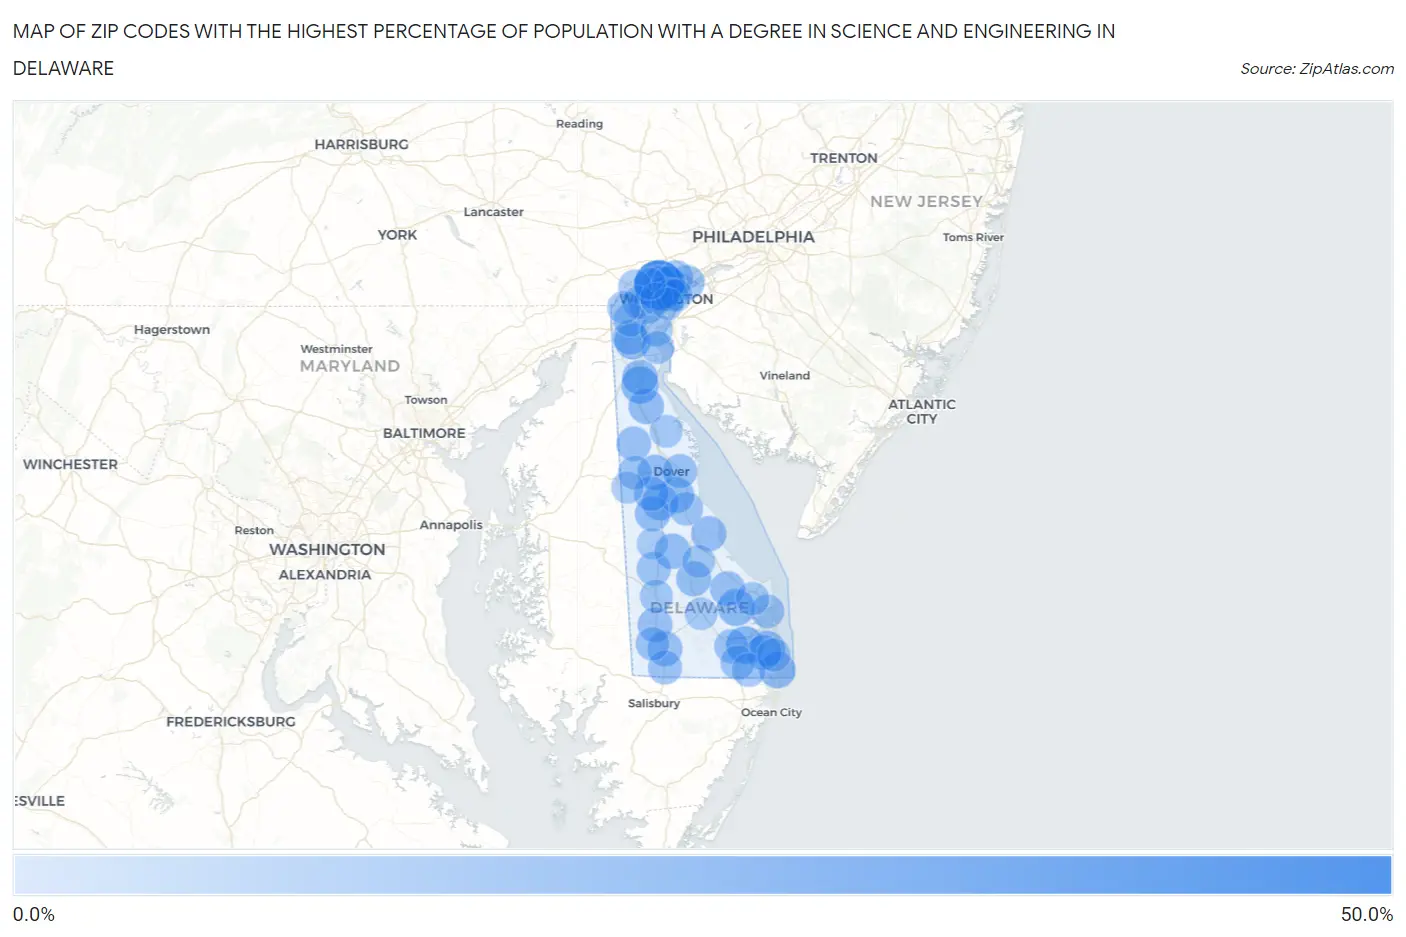
Map of Zip Codes with the Highest Percentage of Population with a Degree in Science and Engineering in Delaware
0.0%
50.0%
Zip Codes with the Highest Percentage of Population with a Degree in Science and Engineering in Delaware
| Zip Code | % Graduates | vs State | vs National | |
| 1. | 19710 | 50.0% | 9.8%(+40.2)#1 | 9.8%(+40.2)#423 |
| 2. | 19939 | 18.6% | 9.8%(+8.79)#2 | 9.8%(+8.85)#3,974 |
| 3. | 19730 | 18.0% | 9.8%(+8.17)#3 | 9.8%(+8.23)#4,314 |
| 4. | 19951 | 17.3% | 9.8%(+7.44)#4 | 9.8%(+7.50)#4,743 |
| 5. | 19944 | 15.7% | 9.8%(+5.84)#5 | 9.8%(+5.90)#6,001 |
| 6. | 19701 | 15.2% | 9.8%(+5.35)#6 | 9.8%(+5.41)#6,516 |
| 7. | 19979 | 14.9% | 9.8%(+5.03)#7 | 9.8%(+5.08)#6,847 |
| 8. | 19962 | 14.5% | 9.8%(+4.68)#8 | 9.8%(+4.73)#7,223 |
| 9. | 19954 | 13.7% | 9.8%(+3.87)#9 | 9.8%(+3.93)#8,237 |
| 10. | 19970 | 13.6% | 9.8%(+3.77)#10 | 9.8%(+3.83)#8,368 |
| 11. | 19734 | 13.5% | 9.8%(+3.67)#11 | 9.8%(+3.72)#8,490 |
| 12. | 19709 | 13.5% | 9.8%(+3.61)#12 | 9.8%(+3.67)#8,571 |
| 13. | 19904 | 13.4% | 9.8%(+3.55)#13 | 9.8%(+3.60)#8,655 |
| 14. | 19967 | 13.0% | 9.8%(+3.14)#14 | 9.8%(+3.19)#9,278 |
| 15. | 19963 | 12.8% | 9.8%(+3.01)#15 | 9.8%(+3.07)#9,477 |
| 16. | 19943 | 12.8% | 9.8%(+2.93)#16 | 9.8%(+2.99)#9,595 |
| 17. | 19941 | 12.4% | 9.8%(+2.57)#17 | 9.8%(+2.63)#10,179 |
| 18. | 19968 | 12.2% | 9.8%(+2.35)#18 | 9.8%(+2.41)#10,549 |
| 19. | 19956 | 12.0% | 9.8%(+2.12)#19 | 9.8%(+2.17)#10,979 |
| 20. | 19973 | 12.0% | 9.8%(+2.11)#20 | 9.8%(+2.17)#10,980 |
| 21. | 19804 | 11.7% | 9.8%(+1.81)#21 | 9.8%(+1.87)#11,567 |
| 22. | 19934 | 11.6% | 9.8%(+1.75)#22 | 9.8%(+1.81)#11,683 |
| 23. | 19938 | 11.4% | 9.8%(+1.55)#23 | 9.8%(+1.61)#12,040 |
| 24. | 19702 | 11.1% | 9.8%(+1.31)#24 | 9.8%(+1.37)#12,527 |
| 25. | 19703 | 10.9% | 9.8%(+1.03)#25 | 9.8%(+1.09)#13,147 |
| 26. | 19901 | 10.7% | 9.8%(+0.832)#26 | 9.8%(+0.890)#13,586 |
| 27. | 19950 | 10.4% | 9.8%(+0.518)#27 | 9.8%(+0.576)#14,262 |
| 28. | 19810 | 10.2% | 9.8%(+0.328)#28 | 9.8%(+0.386)#14,679 |
| 29. | 19966 | 10.0% | 9.8%(+0.206)#29 | 9.8%(+0.264)#14,921 |
| 30. | 19945 | 9.9% | 9.8%(+0.066)#30 | 9.8%(+0.124)#15,245 |
| 31. | 19732 | 9.8% | 9.8%(-0.003)#31 | 9.8%(+0.055)#15,394 |
| 32. | 19940 | 9.7% | 9.8%(-0.135)#32 | 9.8%(-0.077)#15,701 |
| 33. | 19806 | 9.5% | 9.8%(-0.374)#33 | 9.8%(-0.316)#16,253 |
| 34. | 19975 | 9.4% | 9.8%(-0.420)#34 | 9.8%(-0.362)#16,347 |
| 35. | 19946 | 9.2% | 9.8%(-0.664)#35 | 9.8%(-0.606)#16,918 |
| 36. | 19931 | 8.7% | 9.8%(-1.19)#36 | 9.8%(-1.13)#18,146 |
| 37. | 19971 | 8.6% | 9.8%(-1.19)#37 | 9.8%(-1.13)#18,162 |
| 38. | 19953 | 8.6% | 9.8%(-1.21)#38 | 9.8%(-1.16)#18,202 |
| 39. | 19930 | 8.5% | 9.8%(-1.32)#39 | 9.8%(-1.26)#18,415 |
| 40. | 19713 | 8.3% | 9.8%(-1.55)#40 | 9.8%(-1.49)#18,994 |
| 41. | 19707 | 8.2% | 9.8%(-1.62)#41 | 9.8%(-1.56)#19,137 |
| 42. | 19803 | 8.2% | 9.8%(-1.66)#42 | 9.8%(-1.60)#19,242 |
| 43. | 19958 | 8.1% | 9.8%(-1.75)#43 | 9.8%(-1.70)#19,446 |
| 44. | 19802 | 8.0% | 9.8%(-1.89)#44 | 9.8%(-1.83)#19,746 |
| 45. | 19808 | 7.7% | 9.8%(-2.14)#45 | 9.8%(-2.09)#20,303 |
| 46. | 19933 | 7.4% | 9.8%(-2.39)#46 | 9.8%(-2.33)#20,823 |
| 47. | 19720 | 7.3% | 9.8%(-2.56)#47 | 9.8%(-2.50)#21,164 |
| 48. | 19960 | 7.3% | 9.8%(-2.57)#48 | 9.8%(-2.52)#21,207 |
| 49. | 19711 | 7.1% | 9.8%(-2.71)#49 | 9.8%(-2.65)#21,493 |
| 50. | 19706 | 7.0% | 9.8%(-2.81)#50 | 9.8%(-2.75)#21,661 |
| 51. | 19977 | 6.6% | 9.8%(-3.21)#51 | 9.8%(-3.16)#22,368 |
| 52. | 19805 | 6.4% | 9.8%(-3.45)#52 | 9.8%(-3.39)#22,781 |
| 53. | 19947 | 6.3% | 9.8%(-3.54)#53 | 9.8%(-3.49)#22,943 |
| 54. | 19809 | 5.7% | 9.8%(-4.14)#54 | 9.8%(-4.08)#23,879 |
| 55. | 19964 | 5.6% | 9.8%(-4.23)#55 | 9.8%(-4.17)#23,996 |
| 56. | 19801 | 5.4% | 9.8%(-4.41)#56 | 9.8%(-4.35)#24,209 |
| 57. | 19807 | 4.7% | 9.8%(-5.11)#57 | 9.8%(-5.05)#25,043 |
| 58. | 19952 | 3.5% | 9.8%(-6.33)#58 | 9.8%(-6.27)#26,123 |
1
Common Questions
What are the Top 10 Zip Codes with the Highest Percentage of Population with a Degree in Science and Engineering in Delaware?
Top 10 Zip Codes with the Highest Percentage of Population with a Degree in Science and Engineering in Delaware are:
What zip code has the Highest Percentage of Population with a Degree in Science and Engineering in Delaware?
19710 has the Highest Percentage of Population with a Degree in Science and Engineering in Delaware with 50.0%.
What is the Percentage of Population with a Degree in Science and Engineering in the State of Delaware?
Percentage of Population with a Degree in Science and Engineering in Delaware is 9.8%.
What is the Percentage of Population with a Degree in Science and Engineering in the United States?
Percentage of Population with a Degree in Science and Engineering in the United States is 9.8%.