Zip Codes with the Highest Percentage of Population with a Degree in Psychology in Tennessee
RELATED REPORTS & OPTIONS
Psychology
Tennessee
Compare Zip Codes
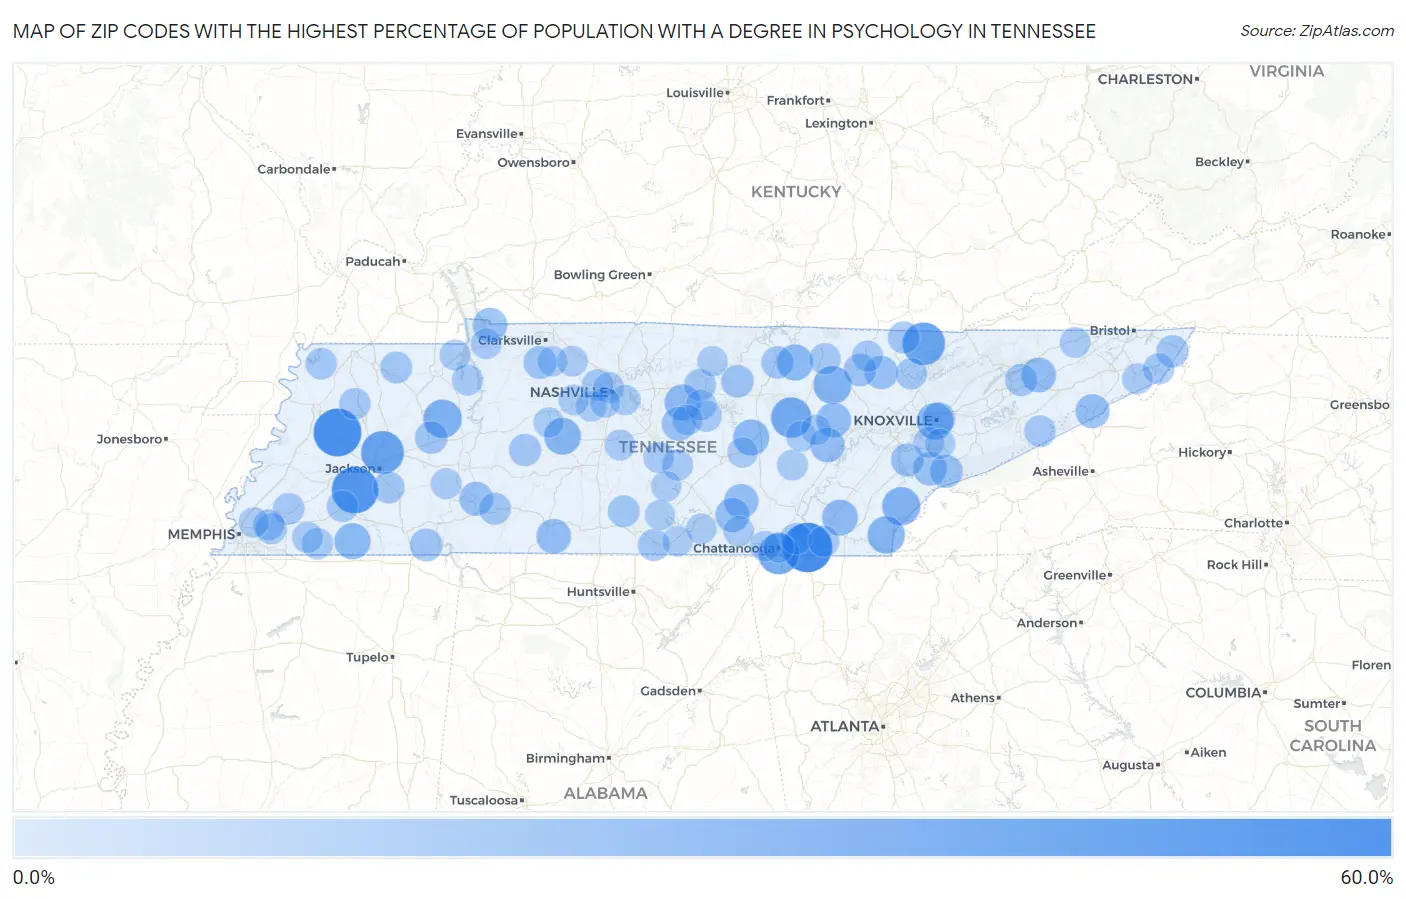
Map of Zip Codes with the Highest Percentage of Population with a Degree in Psychology in Tennessee
0.0%
60.0%
Zip Codes with the Highest Percentage of Population with a Degree in Psychology in Tennessee
| Zip Code | % Graduates | vs State | vs National | |
| 1. | 37315 | 54.1% | 4.9%(+49.1)#1 | 5.1%(+49.0)#88 |
| 2. | 38021 | 50.0% | 4.9%(+45.1)#2 | 5.1%(+44.9)#124 |
| 3. | 38392 | 46.8% | 4.9%(+41.9)#3 | 5.1%(+41.7)#137 |
| 4. | 38362 | 37.6% | 4.9%(+32.7)#4 | 5.1%(+32.5)#192 |
| 5. | 37729 | 36.9% | 4.9%(+32.0)#5 | 5.1%(+31.9)#199 |
| 6. | 37410 | 33.2% | 4.9%(+28.3)#6 | 5.1%(+28.1)#259 |
| 7. | 38578 | 31.6% | 4.9%(+26.7)#7 | 5.1%(+26.5)#277 |
| 8. | 38318 | 26.7% | 4.9%(+21.8)#8 | 5.1%(+21.6)#378 |
| 9. | 37385 | 26.3% | 4.9%(+21.4)#9 | 5.1%(+21.2)#389 |
| 10. | 37726 | 25.9% | 4.9%(+21.0)#10 | 5.1%(+20.8)#403 |
| 11. | 37333 | 24.3% | 4.9%(+19.4)#11 | 5.1%(+19.3)#449 |
| 12. | 38476 | 23.0% | 4.9%(+18.1)#12 | 5.1%(+17.9)#496 |
| 13. | 37916 | 22.5% | 4.9%(+17.6)#13 | 5.1%(+17.5)#517 |
| 14. | 38543 | 21.5% | 4.9%(+16.6)#14 | 5.1%(+16.5)#566 |
| 15. | 38067 | 21.3% | 4.9%(+16.4)#15 | 5.1%(+16.2)#588 |
| 16. | 38579 | 21.0% | 4.9%(+16.1)#16 | 5.1%(+16.0)#599 |
| 17. | 37184 | 20.7% | 4.9%(+15.8)#17 | 5.1%(+15.7)#616 |
| 18. | 37310 | 20.4% | 4.9%(+15.5)#18 | 5.1%(+15.4)#627 |
| 19. | 37723 | 18.0% | 4.9%(+13.1)#19 | 5.1%(+13.0)#797 |
| 20. | 37711 | 17.9% | 4.9%(+12.9)#20 | 5.1%(+12.8)#810 |
| 21. | 38468 | 17.8% | 4.9%(+12.9)#21 | 5.1%(+12.8)#811 |
| 22. | 37337 | 17.3% | 4.9%(+12.4)#22 | 5.1%(+12.2)#875 |
| 23. | 37028 | 17.1% | 4.9%(+12.2)#23 | 5.1%(+12.1)#889 |
| 24. | 37339 | 17.1% | 4.9%(+12.2)#24 | 5.1%(+12.0)#893 |
| 25. | 37387 | 16.7% | 4.9%(+11.8)#25 | 5.1%(+11.7)#922 |
| 26. | 37657 | 16.5% | 4.9%(+11.6)#26 | 5.1%(+11.4)#959 |
| 27. | 37118 | 16.1% | 4.9%(+11.2)#27 | 5.1%(+11.0)#1,004 |
| 28. | 38425 | 16.1% | 4.9%(+11.2)#28 | 5.1%(+11.0)#1,007 |
| 29. | 37878 | 15.1% | 4.9%(+10.2)#29 | 5.1%(+10.0)#1,117 |
| 30. | 37756 | 14.7% | 4.9%(+9.77)#30 | 5.1%(+9.63)#1,175 |
| 31. | 37882 | 13.9% | 4.9%(+8.98)#31 | 5.1%(+8.84)#1,292 |
| 32. | 37742 | 13.8% | 4.9%(+8.92)#32 | 5.1%(+8.78)#1,310 |
| 33. | 37052 | 13.6% | 4.9%(+8.73)#33 | 5.1%(+8.59)#1,342 |
| 34. | 37915 | 13.4% | 4.9%(+8.53)#34 | 5.1%(+8.39)#1,393 |
| 35. | 38357 | 13.2% | 4.9%(+8.29)#35 | 5.1%(+8.15)#1,437 |
| 36. | 37852 | 13.0% | 4.9%(+8.14)#36 | 5.1%(+7.99)#1,467 |
| 37. | 38545 | 12.7% | 4.9%(+7.83)#37 | 5.1%(+7.69)#1,534 |
| 38. | 38390 | 12.7% | 4.9%(+7.76)#38 | 5.1%(+7.62)#1,555 |
| 39. | 38570 | 12.6% | 4.9%(+7.64)#39 | 5.1%(+7.50)#1,574 |
| 40. | 37683 | 12.2% | 4.9%(+7.34)#40 | 5.1%(+7.20)#1,658 |
| 41. | 37033 | 12.0% | 4.9%(+7.05)#41 | 5.1%(+6.90)#1,743 |
| 42. | 37860 | 11.9% | 4.9%(+6.97)#42 | 5.1%(+6.83)#1,771 |
| 43. | 38485 | 11.5% | 4.9%(+6.56)#43 | 5.1%(+6.42)#1,888 |
| 44. | 37819 | 11.4% | 4.9%(+6.46)#44 | 5.1%(+6.31)#1,924 |
| 45. | 38225 | 11.2% | 4.9%(+6.25)#45 | 5.1%(+6.10)#1,992 |
| 46. | 38563 | 11.1% | 4.9%(+6.17)#46 | 5.1%(+6.03)#2,035 |
| 47. | 38366 | 11.0% | 4.9%(+6.08)#47 | 5.1%(+5.94)#2,065 |
| 48. | 37335 | 10.9% | 4.9%(+5.99)#48 | 5.1%(+5.84)#2,102 |
| 49. | 37144 | 10.7% | 4.9%(+5.83)#49 | 5.1%(+5.69)#2,159 |
| 50. | 37727 | 10.7% | 4.9%(+5.81)#50 | 5.1%(+5.66)#2,168 |
| 51. | 38036 | 10.5% | 4.9%(+5.62)#51 | 5.1%(+5.48)#2,250 |
| 52. | 37416 | 10.5% | 4.9%(+5.57)#52 | 5.1%(+5.43)#2,267 |
| 53. | 38075 | 10.2% | 4.9%(+5.29)#53 | 5.1%(+5.15)#2,394 |
| 54. | 38232 | 10.1% | 4.9%(+5.23)#54 | 5.1%(+5.08)#2,425 |
| 55. | 38330 | 10.1% | 4.9%(+5.17)#55 | 5.1%(+5.03)#2,455 |
| 56. | 37218 | 10.1% | 4.9%(+5.15)#56 | 5.1%(+5.01)#2,461 |
| 57. | 37757 | 9.9% | 4.9%(+5.02)#57 | 5.1%(+4.88)#2,537 |
| 58. | 38556 | 9.9% | 4.9%(+5.02)#58 | 5.1%(+4.87)#2,541 |
| 59. | 38057 | 9.7% | 4.9%(+4.78)#59 | 5.1%(+4.64)#2,670 |
| 60. | 37018 | 9.5% | 4.9%(+4.60)#60 | 5.1%(+4.45)#2,776 |
| 61. | 38221 | 9.4% | 4.9%(+4.53)#61 | 5.1%(+4.39)#2,819 |
| 62. | 37311 | 9.4% | 4.9%(+4.53)#62 | 5.1%(+4.38)#2,820 |
| 63. | 37755 | 9.4% | 4.9%(+4.49)#63 | 5.1%(+4.35)#2,842 |
| 64. | 38016 | 9.3% | 4.9%(+4.41)#64 | 5.1%(+4.27)#2,892 |
| 65. | 37640 | 9.2% | 4.9%(+4.29)#65 | 5.1%(+4.14)#2,990 |
| 66. | 38133 | 9.2% | 4.9%(+4.27)#66 | 5.1%(+4.13)#2,996 |
| 67. | 37095 | 9.0% | 4.9%(+4.05)#67 | 5.1%(+3.90)#3,185 |
| 68. | 38076 | 8.9% | 4.9%(+4.00)#68 | 5.1%(+3.85)#3,218 |
| 69. | 37012 | 8.8% | 4.9%(+3.89)#69 | 5.1%(+3.75)#3,305 |
| 70. | 37046 | 8.8% | 4.9%(+3.88)#70 | 5.1%(+3.73)#3,316 |
| 71. | 38374 | 8.8% | 4.9%(+3.86)#71 | 5.1%(+3.71)#3,334 |
| 72. | 37037 | 8.7% | 4.9%(+3.84)#72 | 5.1%(+3.70)#3,345 |
| 73. | 38222 | 8.7% | 4.9%(+3.83)#73 | 5.1%(+3.69)#3,356 |
| 74. | 37228 | 8.7% | 4.9%(+3.79)#74 | 5.1%(+3.64)#3,404 |
| 75. | 37367 | 8.7% | 4.9%(+3.77)#75 | 5.1%(+3.63)#3,430 |
| 76. | 37642 | 8.4% | 4.9%(+3.50)#76 | 5.1%(+3.35)#3,712 |
| 77. | 37058 | 8.4% | 4.9%(+3.48)#77 | 5.1%(+3.34)#3,719 |
| 78. | 37701 | 8.4% | 4.9%(+3.48)#78 | 5.1%(+3.34)#3,722 |
| 79. | 37658 | 8.4% | 4.9%(+3.45)#79 | 5.1%(+3.31)#3,742 |
| 80. | 37374 | 8.3% | 4.9%(+3.43)#80 | 5.1%(+3.28)#3,769 |
| 81. | 37016 | 8.3% | 4.9%(+3.43)#81 | 5.1%(+3.28)#3,778 |
| 82. | 37419 | 8.0% | 4.9%(+3.14)#82 | 5.1%(+3.00)#4,069 |
| 83. | 38572 | 8.0% | 4.9%(+3.11)#83 | 5.1%(+2.97)#4,106 |
| 84. | 37221 | 8.0% | 4.9%(+3.10)#84 | 5.1%(+2.96)#4,112 |
| 85. | 37082 | 8.0% | 4.9%(+3.09)#85 | 5.1%(+2.95)#4,140 |
| 86. | 38555 | 8.0% | 4.9%(+3.05)#86 | 5.1%(+2.91)#4,185 |
| 87. | 37306 | 7.9% | 4.9%(+2.95)#87 | 5.1%(+2.81)#4,307 |
| 88. | 37035 | 7.8% | 4.9%(+2.94)#88 | 5.1%(+2.80)#4,312 |
| 89. | 37402 | 7.7% | 4.9%(+2.84)#89 | 5.1%(+2.70)#4,428 |
| 90. | 37318 | 7.7% | 4.9%(+2.84)#90 | 5.1%(+2.70)#4,429 |
| 91. | 38128 | 7.7% | 4.9%(+2.77)#91 | 5.1%(+2.63)#4,533 |
| 92. | 37145 | 7.6% | 4.9%(+2.73)#92 | 5.1%(+2.59)#4,587 |
| 93. | 37183 | 7.6% | 4.9%(+2.73)#93 | 5.1%(+2.59)#4,591 |
| 94. | 38581 | 7.6% | 4.9%(+2.67)#94 | 5.1%(+2.53)#4,683 |
| 95. | 37171 | 7.5% | 4.9%(+2.63)#95 | 5.1%(+2.49)#4,747 |
| 96. | 37804 | 7.5% | 4.9%(+2.62)#96 | 5.1%(+2.47)#4,772 |
| 97. | 37217 | 7.5% | 4.9%(+2.58)#97 | 5.1%(+2.44)#4,841 |
| 98. | 37025 | 7.5% | 4.9%(+2.58)#98 | 5.1%(+2.43)#4,862 |
| 99. | 37215 | 7.5% | 4.9%(+2.56)#99 | 5.1%(+2.42)#4,878 |
| 100. | 37352 | 7.5% | 4.9%(+2.55)#100 | 5.1%(+2.41)#4,906 |
Common Questions
What are the Top 10 Zip Codes with the Highest Percentage of Population with a Degree in Psychology in Tennessee?
Top 10 Zip Codes with the Highest Percentage of Population with a Degree in Psychology in Tennessee are:
What zip code has the Highest Percentage of Population with a Degree in Psychology in Tennessee?
37315 has the Highest Percentage of Population with a Degree in Psychology in Tennessee with 54.1%.
What is the Percentage of Population with a Degree in Psychology in the State of Tennessee?
Percentage of Population with a Degree in Psychology in Tennessee is 4.9%.
What is the Percentage of Population with a Degree in Psychology in the United States?
Percentage of Population with a Degree in Psychology in the United States is 5.1%.