Zip Codes with the Highest Percentage of Population with a Degree in Psychology in Crossville, TN
RELATED REPORTS & OPTIONS
Psychology
Crossville
Compare Zip Codes
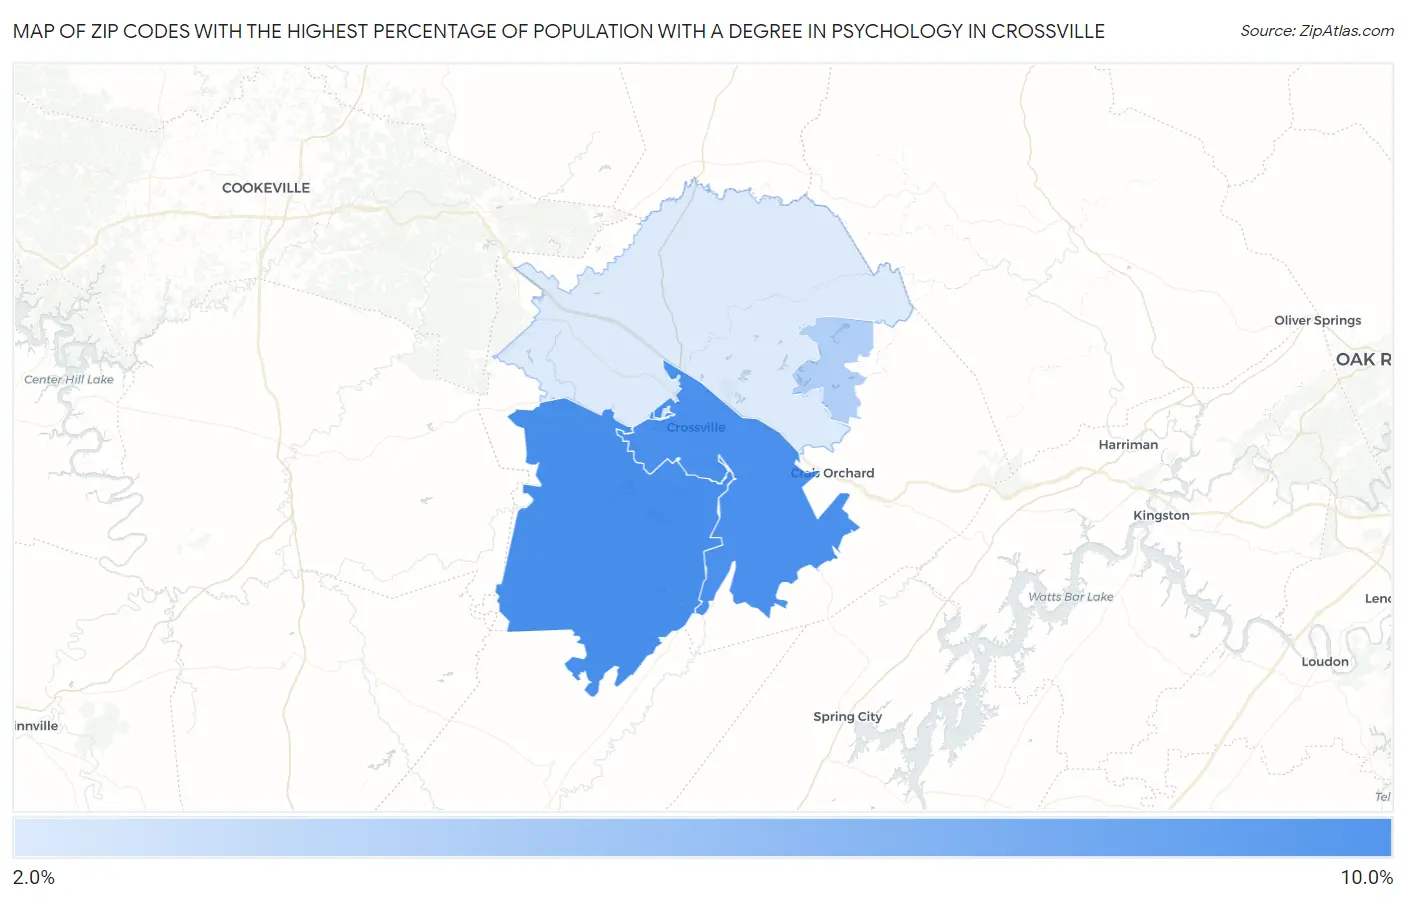
Map of Zip Codes with the Highest Percentage of Population with a Degree in Psychology in Crossville
2.0%
8.0%
Zip Codes with the Highest Percentage of Population with a Degree in Psychology in Crossville, TN
| Zip Code | % Graduates | vs State | vs National | |
| 1. | 38572 | 8.0% | 4.9%(+3.11)#83 | 5.1%(+2.97)#4,106 |
| 2. | 38555 | 8.0% | 4.9%(+3.05)#86 | 5.1%(+2.91)#4,185 |
| 3. | 38558 | 3.7% | 4.9%(-1.16)#311 | 5.1%(-1.30)#15,795 |
| 4. | 38571 | 2.0% | 4.9%(-2.87)#391 | 5.1%(-3.01)#20,728 |
1
Common Questions
What are the Top 3 Zip Codes with the Highest Percentage of Population with a Degree in Psychology in Crossville, TN?
Top 3 Zip Codes with the Highest Percentage of Population with a Degree in Psychology in Crossville, TN are:
What zip code has the Highest Percentage of Population with a Degree in Psychology in Crossville, TN?
38572 has the Highest Percentage of Population with a Degree in Psychology in Crossville, TN with 8.0%.
What is the Percentage of Population with a Degree in Psychology in Crossville, TN?
Percentage of Population with a Degree in Psychology in Crossville is 7.4%.
What is the Percentage of Population with a Degree in Psychology in Tennessee?
Percentage of Population with a Degree in Psychology in Tennessee is 4.9%.
What is the Percentage of Population with a Degree in Psychology in the United States?
Percentage of Population with a Degree in Psychology in the United States is 5.1%.